Embed Size (px)
Citation preview
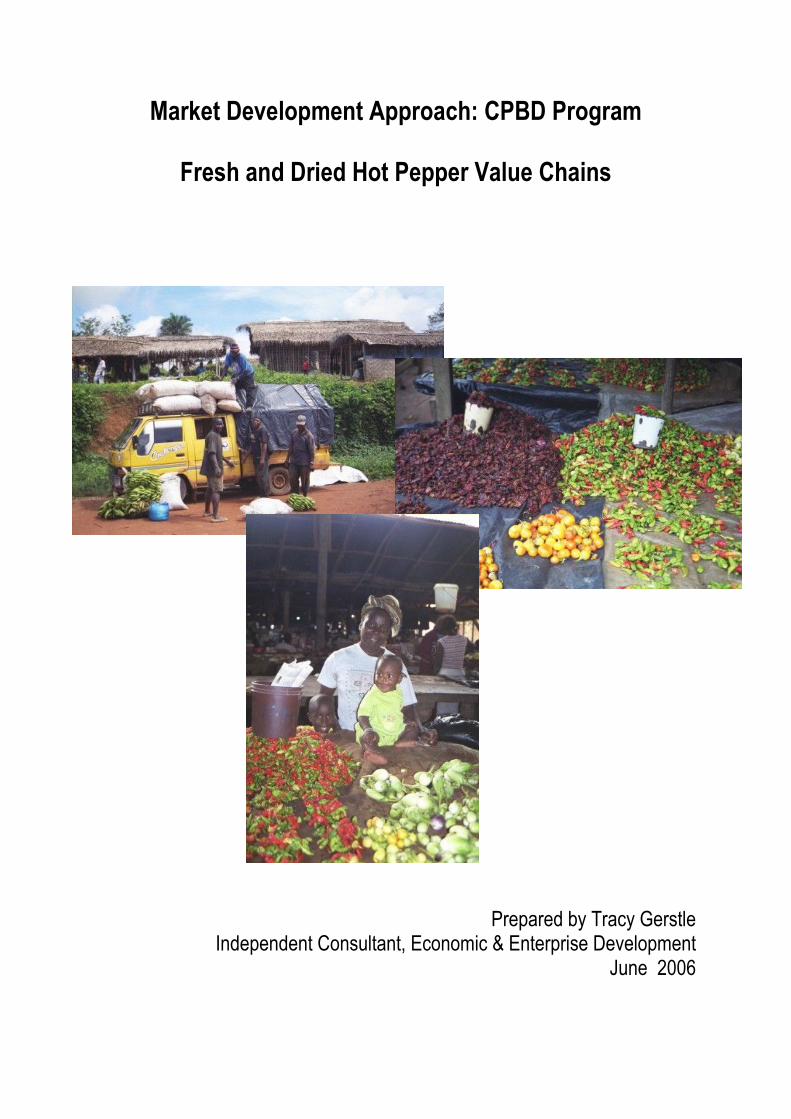
Market Development Approach: CPBD Program
Fresh and Dried Hot Pepper Value Chains
Prepared by Tracy GerstleIndependent Consultant, Economic & Enterprise Development
June 2006

Table of Contents
Executive Summary............................................................................................................ 4Introduction........................................................................................................................ 5Activities Completed During the Consultancy.................................................................... 6Scope & Limitations............................................................................................................ 6Overview of Market Development Frameworks: Subsectors & Value Chains....................8
Figure 1: Factors Considered in Subsector Analysis......................................................... 8Lessons Learned in the Cow Peas Subsector...................................................................... 9
Figure 2: Strategies to Develop the Dried Cow Pea Value Chain....................................10Identifying Subsectors for the Market Assessment........................................................... 13
Figure 3: Designing & Implementing a Market Development Program..........................14Table 1: Potential Criteria for Subsector Selection..........................................................15Table 2: Sector Ranking...................................................................................................16
Market Research................................................................................................................ 16General Research Findings................................................................................................ 18
table 3: Compilation of Farmers Interviewed.................................................................. 19Table 4: Transportation Costs for Local Markets & Red Light (Liberty)........................22
Description of the Two Sectors......................................................................................... 23Hot Pepper............................................................................................................................23
Figure 4: Hot Pepper, National Supply vs Price.............................................................. 24Peanuts................................................................................................................................. 26Figure 5: Hot Pepper Subsector Map .................................................................................. 28Retail.................................................................................................................................... 28Wholesale............................................................................................................................. 28Processors.............................................................................................................................28Growers................................................................................................................................ 28Input Supply......................................................................................................................... 28Figure 6: Peanut Subsector Map ......................................................................................... 29Input Supply......................................................................................................................... 29Retail.................................................................................................................................... 29Wholesale............................................................................................................................. 29Processors (Boiling)............................................................................................................. 29Growers................................................................................................................................ 29
Identification of Constraints in the Two Sectors............................................................... 30CPBD Programming Parameters for Work in the Hot Pepper and Peanut Subsectors... 32Identification of Opportunities and Solutions................................................................... 33
Table 5: Opportunities & Solutions in Hot Pepper.......................................................... 33Table 6: Opportunities & Solutions in Peanuts...............................................................35
Hot Pepper: Program Strategy.......................................................................................... 35Table 5: Non-Peak/Semi-Lowland Planting Calendar – Pepper......................................36Table 6: Peak Season Upland Planting Calendar – Pepper..............................................36
Peanuts: Program Strategy................................................................................................ 36Cow Peas: Program Strategy............................................................................................. 37Conclusion......................................................................................................................... 37Appendix 1: Scope of Work for BDS Consultant............................................................... 39Appendix 2: Travel and Meeting Itinerary........................................................................ 41Appendix 3: Research Team & Workshop Participants.................................................... 43 .......................................................................................................................................... 43
- 2 -

Appendix 4: Information from Sector Ranking Exercise.................................................. 44Appendix 5: Research Plans.............................................................................................. 46Appendix 6: Participatory Economic & Marketing Appraisals with Communities..........48Appendix 7: Hot Pepper & Peanut Feasibility, Production Methods............................... 54Appendix 8: Input Supply Prices....................................................................................... 60Appendix 9: Prices for Hot Pepper & Peanuts.................................................................. 61Appendix 10: Activity Plan Meeting with Farmers............................................................ 62Appendix 11 Value Chain Governance Structures............................................................. 64
- 3 -

Executive SummaryThe past three years have seen significant changes in Liberia, including the end of the fourteen-year civil conflict and the election of a new government in late 2005. The stability brought about by these changes has enabled the CPBD communities to start taking a longer term view towards their livelihoods and increasing their incomes. CPBD is a five year - $12 million program jointly implemented by MC and AED. The program is designed to promote a greater role for civil society in the transition to improved social, economic and political conditions by working with rural communities. Given the focus on economic growth by the CPBD communities, Mercy Corps and AGRA opted to use a market development approach to identify profitable, sustainable opportunities for communities to engage in high value markets.
Since the majority of community members are engaged in agriculture, opportunities to support subsistence farmers to increase their yields and transition into commercial agriculture by growing cash crops and moving into agro-processing offered the greatest potential. In May 2005, CPBD staff and local partners worked with a BDS consultant, Mary Morgan, to conduct a subsector analysis of the dried cow pea value chain, which was identified as a high potential crop that offered communities opportunities both to increase their incomes and food security. The analysis examined the constraints that subsistence farmers face to successfully produce, process and market dried cow peas. Then potential solutions were identified that would enable farmers to overcome the most pressing of these constraints, based upon local resources and affordable, commercial inputs and services. Based upon the research findings changes were made by CBPD staff and partners to the program.
The purpose of this second consultancy is to expand upon the program’s BDS strategy through the addition of one to two high potential sectors, while examining the lessons learned in working in cow peas. This will expand upon the potential sectors and resources available to CPBD community members interested in working in cash crops.
A second Market Assessment found that the hot pepper subsector is particularly promising, since it offers potential returns of up to 300%. Hot pepper is in demand year round and most of the CPBD communities already have some engagement in the sector, which will enable the program to build upon this interest. The greatest opportunities are in off-season production when prices are at the highest, as well as selling dry peppers in this period. Assisting communities to develop their capacity and the needed resources to follow a dry and hold strategy during the peak season could significantly increase their incomes. Additional research on the peanut subsectors indicates that at least for the counties in which CPBD currently operates, namely Monterrado, Grand Basso and Margibi, peanuts is not a very promising crop in terms of profitability. Rather than expending considerable resources on peanut production, the program would be better served in looking at other crops and activities. However, given the interest in peanuts some recommendations are made here in the event activities in the subsector are pursued.
In reflecting on the initiative last year for the CPBD program to engage in the cow pea subsector, the greatest challenges were consistency in communicating with the communities and in development of the resources needed to assist AGRA in implementing the strategy. This year these issues need to be addressed, and particular focus is needed to develop resources such as activity plans and meeting templates that farmers can use to organize their activities. Success in farm planning will assist communities to succeed in cow peas and any other crops they may choose to engage in.
- 4 -

Looking beyond CPBD to the next phase of programming there are opportunities to work with communities in other subsectors such as rubber and palm oil. Liberia already exports rubber and there is great potential to revive the historical export trade in palm oil. The low purchasing power among consumers in Liberia limits the opportunities in the domestic economy, so ultimately the greatest opportunities will lie in exports. Many of the CPBD communities are already planning or engaging in palm oil and rubber, through palm seed harvesting and processing, cultivating rubber trees on community land etc. The capacity planning in farm management and engagements in markets at the community level via CPBD this year will build communities’ capacity to engage in these growth opportunities for the country. Given the high levels of fragmentation and market-based governance in the country’s agricultural sectors, a value chain approach could be very useful in promoting opportunities for greater coordination and collaboration. This will also promote peace dividends in the country via economic ties and opportunities for inclusive growth.
IntroductionThe past three years have seen significant changes in Liberia, including the end of the fourteen-year civil conflict and the election of a new government in late 2005. The stability brought about by these changes has changed the priorities in the communities working with CPBD, the Community Peace Building and Development Program (CPBD), also know as Diompilor. CPBD is a five year - $12 million program jointly implemented by Mercy Corps (MC) and the Academy for Educational Development. The program is designed to promote a greater role for civil society in the transition to improved social, economic and political conditions by working with local civic organizations and 200 communities. This is in line with the program’s intended contribution to USAID Liberia’s Strategic Objectives 4 & 5:
Increased Food Security in Targeted Areas Civil Society Role in Democratic Governance Strengthened
Reflecting the recent stability in the country, community members increasingly express the desire to focus on the economic development and incomes in their communities. Given that the majority of community members are engaged in agriculture, opportunities to support subsistence farmers to increase their yields and transition into commercial agriculture by growing cash crops and moving into agro-processing offer the greatest potential.
In line with the program’s strategy to focus increasingly on economic development and incomes, investments are being made to conduct market research to inform program approaches, while building the capacity of CPBD’s local NGO partners in using market-based approaches, such as BDS and Value Chains. The decision to take more of a market-based approach was strategic, recognizing it would foster program initiatives with a greater potential for sustainability, impact and scale. Sustainability is fostered by building communities capacity to engage more profitability in their local markets, aware of the different market trends that affect their business. Scale is promoted since a market-based approach leverages trends in the private sector for programmatic ends. Impact is measured in terms of the changes in incomes at the community level, which will be more significant if program interventions address the specific challenges that communities face both in their business and in engaging with markets.
In May 2005, CPBD staff and local partners worked with a BDS consultant, Mary Morgan, to conduct a subsector analysis of the dried cow pea value chain, which was identified as a high potential crop that offered communities opportunities both to increase their incomes and food security. The analysis examined the constraints that subsistence farmers face to successfully produce, process and market dried cow peas. Then potential solutions were identified that
- 5 -

would enable farmers to overcome the most pressing of these constraints, based upon local resources and affordable, commercial inputs and services. Based upon the research findings changes were made by CBPD staff and partners to the program.
The purpose of this second consultancy is to expand upon the program’s BDS strategy through the addition of one to two high potential sectors, while examining the lessons learned in working in cow peas. This will expand upon the potential sectors and resources available to CPBD community members interested in working in cash crops. Additionally the consultancy is designed to re-enforce the training in market-based programming, provided to CPBD’s local NGO partners, Action for Greater Harvest (AGRA) and National Adult Education and Literacy (NAEL) and MC staff, as well as continuing to mentor the staff through field work.
Activities Completed During the Consultancy Conduct one and a half day workshop with leadership from Mercy Corps and CPBD
partners, AGRA and NEAL to build consensus on the consultancy and research objectives, review lessons learned from the work in cowpeas and to identify two potential subsectors for the market assessment
Train research team, consisting of staff from MC, AGRA and NEAL in approaches to market development in a one day review of the prior year’s training
Spend nine days conducting the market assessment, identifying and evaluating the demand and supply side constraints for the two subsectors, and opportunities to address these constraints
Work with the research team over two days in Monrovia to analyze the data collected, to discuss the research findings and to develop feasibility analyses of smallholder production in the two sectors, as well as to identify the constraints-opportunities and potential solutions for the two subsectors
Prepare a Power Point summary of the assessment findings that the research team presented to Bill Massaquoi, USAID Liberia during the consultancy, which was subsequently also presented to the Ministry of Agriculture the following week
Facilitated a half day workshop for the research team and MC management to review the findings of the research, and to develop potential program strategies for the three sectors: hot pepper, peanuts and cow peas, as well as to develop some of the parameters for a work plan to roll out the program
Held a debrief of the research findings for AED in Washington, DC
Appendices 1 and 2 provide the scope of work for the consultancy and a timeline of the activities undertaken. Appendix 3 provides a list of participants in the sector selector workshop and the members of the research team for the market assessment.
Scope & LimitationsThis year’s assessment had a considerable advantage over the prior year in that the levels of market literacy among the research team are much improved. This reflects well upon the training and field experience the team gained with Mary Morgan. As a result we were able to save time on training in market assessment technique and focus our efforts on conducting the market research, which is fortunate since we needed all the time available. Conducting a market assessment in a post-war context such as Liberia is very challenging and this impacted the quality of the research. Following the consultant’s arrival, members of the research team visited the FAO, the Ministry of Agriculture and other sources to compile any and all available research and data on potential sectors for the study. Very little exists on the current, post-war status of the economy and we were unable to source any secondary information on cultivation, pre and post
- 6 -

war levels of production and import/export patterns of the potential sectors. Therefore, the research product is the result of all primary interviews conducted over the three weeks the consultant was in Liberia. As a result our identification of sectors to study for the market research was not optimal, since we had to go more on intuition than data. To counterbalance the local NGOs’ and MC staffers’ intuition, we evaluated potential sectors on a number of criteria, which required staffers to do some additional analysis as discussed in the section on identifying subsectors for the market assessment.
In the future, as MC and the local partners consider additional sectors for market assessments, they would be well advised to do more external research by conducting interviews with a number of actors in both the public and private sectors before choosing a sector. Two to three weeks should be set aside for this, with staffers scheduling a couple of interviews each week interspersed with their other duties. This would then provide a more sound knowledge base, which could be tested via a week of interviews with market actors in two to three potential sectors prior to finalizing a sector for study. This may seem labor intensive, but would be a good use of time before making the investment in time and money needed for a larger study.
While staff capacity is increasing, the team still needed considerable guidance in using critical thinking to evaluate the answers they received in interviews, so as to identify relevant additional information or to question a non-logical response. This was so pervasive that we opted to use multiple choice questionnaires and more closed questions than is usually optimal in this type of market research, which generally is conducted with open ended questions. In studying informal markets there are many other factors that influence business and incentives that are difficult to capture via multiple choice questions. Additionally not all members of the research team, regularly followed the questionnaires or filled in the responses. In part, we did not have sufficient time to test and train the research team in administering the survey, but it was also an indication of staff capacity since some of the team continued to fill out surveys incorrectly after more than a week of field research and guided feedback from the consultant. This prevented a full tabulation of all the survey responses, since in many instances it was not possible to clearly determine respondents’ answers, particularly for critical information such as price data. These challenges are however, not a reflection of the staffers’ dedication to their work. Given that we had less than two weeks to conduct the market research, the team worked very intensively, including many late nights and weekends. Throughout they maintained a very positive attitude and went the extra mile when needed to collect additional information.
The legacy of the civil war and the many years of relief operations it precipitated has also bred a culture of dependency and incentives for communities to cater to NGOs’ interests in order to receive handouts. This legacy certainly colored many of the survey responses we received both at the community level and within the various value chains as well. With the exception of the some of the import sectors, there was not a sector within the economy untouched by relief funds, whether it was a NGO providing grants for emergency production or a NGO purchasing tools from agro-input suppliers or seeds from a farmer. Communities were also too eager to jump into peanut or pepper production, since they hoped for “support” from the program. This culture of dependency illustrates how careful NGOs need to be when conducting market research and the “light touch” that is required in implementing programming, so as to not foster false incentives that distort people’s actions and livelihoods.
- 7 -

Overview of Market Development Frameworks: Subsectors & Value ChainsIt is worth reviewing the market development frameworks: Subsectors and Value Chains briefly in this report, since there continues to be some misunderstanding around how to employ market development frameworks such as subsectors, value chains and BDS in the program. An understanding of how to do this work is critical in designating the roles and responsibilities played by the different stakeholders in the program, namely the development agencies: AGRA, MC and NAEAL and the communities and smallholder farmers with which the program interacts. As Mary Morgan noted in her report, “smallholder farmers do not operate in a vacuum, but rather within market systems which may be local, regional or even international.” Subsector and value chain frameworks act as tools by which to assist development practitioners and the communities and farmers with which the practitioners work to better understand these market systems. This allows for targeted programming addressing the constraints that smallholders face to engage more profitability in these market systems. Figure 1 lists the many factors that market development practitioners need to take into account in assessing and designing programs. Here I have re-included Mary’s explanation of the concepts given their importance. Figure 5 provides a map of the Hot Pepper subsector and its four value chains. This may act as a useful reference when reading about the structure of subsectors and value chains below.
“A subsector can be defined as follows:• All the firms that buy & sell from each other in order to supply a group of closely related
products or services to final consumers• The range of activities that brings a product from raw material to the final consumer:
input supplies →production → processing → wholesaling → retailing → exporting• These transactions, based on the farms and the flow of activities are also sometimes
referred to as horizontal and vertical linkages
• The different market channels to reach distinct consumer groups
Value chains exist within a subsector. A value chain maps the transformation of a product along only ONE market channel. There are usually several value chains within a subsector.
Subsector analysis seeks to identify the different value chains operating within one subsector and the final consumers that they serve. It then looks at the range of activities undertaken in each of these value chains and the different actors operating in each in terms of input suppliers, producers, retailers, traders, etc. It also attempts to map supporting services such as credit,
- 8 -
Market Trends
Solutions & Services
to Upgrade Micro & Small Enterprises
Enabling Environment
Constraints &Opportunities
Competitivenes
Financing
SubsectorMapping
RelationsAmong
Market Actors
Geographic Coverage
FIGURE 1: FACTORS CONSIDERED IN SUBSECTOR ANALYSIS
Source: Action for Enterprise

since these services play an important role in facilitating the activities. Once the linkages and relationships are identified it is possible to understand the distribution of benefits along the different chains as well as the constraints to efficiency and greater revenues faced by all the actors operating in the different value chains.
The distinct value chains within a subsector, cater to consumer groups differentiated by specifications of the different products they consume, typically based upon the level of the product’s upgrading. As more value is added to the product, the product will meet the specific desires and needs of a higher value chains. Analyzing the entire subsector reveals the different value chains, proving a opportunity to analyze not only the competitiveness of each value chain within a subsector, but also identify which value chain would provide the best market opportunity for a large number of poor people. Micro and small enterprises (MSEs) and smallholder farmers often operate in a market channel which targets other poor consumers as their market. This may be because their product is of poor quality, or they do not have access to transportation and other market outlets, or they cannot access the financing needed to upgrade their processing technology. However, the conclusion should not be made that poor producers would be best served by moving into the highest value chain. Sometimes the investments and/or capabilities needed to meet the requirements of this chain may not merit the investment required. Although this constraint can sometimes by overcome by linking smaller producers to lead firms. Research is therefore needed to determine where the greatest opportunities for poor producers exist.
The value chain analysis reveals these constraints, as well as identifying potential opportunities to promote MSEs and smallholders engagement in higher value chains. Once constraints and opportunities are identified, the assessment looks for solutions, which may include promoting access to business development services (BDS). For example, a potential constraint may be a lack of value added products among poor producers, due to unaffordable processing equipment. A potential solution would be to work with a financial services provider to design a credit product that enables poor producers to procure the equipment and/or the development of and introduction of a more affordable processing technology. The provider of this credit product or the supplier of the process equipment, are BDS providers. An intervention would then be to link farmers to the equipment supplier and the financial services institution. The market transaction is what drives the relationship. The role of the BDS facilitator is to identify the constraints, the solutions, the solution providers and develop an intervention which facilitates the development of the market.”
Additionally value chain analysis may identify other constraints of a non-commercial nature, such as a poor regulatory environment or poor infrastructure. In these cases, the BDS facilitator may work with or on the behalf of smallholder farmers to lobby for changes in the regulation. Or in the case of infrastructure, an assessment needs to be made as to whether a solution can be found or if the lack of infrastructure is insurmountable and therefore another value chain or even subsector offers greater opportunities.
Lessons Learned in the Cow Peas SubsectorGiven that the program staff and partners had already conducted one market assessment and designed and implemented one “BDS initiative” in the past year, we had the opportunity to reflect upon its strengths and challenges. The consultant facilitated several discussions with senior staff and program implementers from MC and AGRA to discuss the initiative and lessons learned. Additionally while conducting field research for new sectors there were opportunities to meet with farmers working in cowpeas. The goal of these discussions and interviews is to gain
- 9 -

an understanding of the work in cowpeas so as to make some recommendations to strengthen the initiative and to leverage the learnings in the new sectors.
At the conclusion of the cow peas assessment in May 2005, the research team designed a fairly comprehensive plan as to how they could work with the communities to better support cultivation and marketing of cow peas going forward. Figure 2 provides an overview of this plan. A strength of this exercise was that the research team was comprised of senior leadership and implementers from both AGRA and MC, so the initiative had management’s buy-in. It also should have resulted in the identification of practical solutions, since it was designed by the same staff overseeing and implementing the program. However, in reflecting back upon the initiative now the team found that they had not realized most of the strategies identified. Our question was to understand why.
To do this we looked at the program through the lens of two communities with which the program had worked in cow peas: Gardour and Borlorla. In both communities, AGRA attempted to follow the strategy outlined above. In community meetings in June and July 2005, AGRA had meetings with the groups of farmers in the communities to discuss the findings from the cow pea research. The farmers groups were then asked to self-organize into susus so as to save capital to fund their activities. It is unclear what was communicated to farmers in terms of what the capital was to be used for. Staff seemed to indicate that farmers’ responsibility was to save so as to not self-fund their activities as outlined in strategies No. 1 & 2 above, but rather to accumulate the 10% community contribution that CPBD sometimes requires from its communities as a match for the CPBD investment. In this case the match was to be $10 of the $100 CBPD was investing in the initiative to buy the farmers tools and seeds. Another complexity of the program was that at this stage CPBD was still working through demonstration plots, which may or may not have belonged to the farmers who were mobilized. Farmers were paid a rate of $2 USD for every day they worked on these plots. The farmers were also not directly involved in any of the procurement of seeds and tools, and CPBD did not deliver the seeds in time to sow. This greatly hampered the initiative from a technical perspective—and likely hurt the credibility of CPBD in the communities, since the program was then encouraging the farmers to sow seeds late. Farmers were also not asked to make any contributions, and it would have been difficult to secure one despite the earlier advice on how they might save up for
- 10 -
Strategy No. 1: Strengthen Farmers Groups
Farmers Group selects leaderFarmers Group develops activity plan
⇒ Increase farm sizes⇒ Access tools, seeds
& transport collectively⇒ Link to buyers⇒ Buy storage
container together
Strategy No. 2: Susu Clubs & Asset Development
Savings clubs - Capital to purchase tools, seeds in bulk & contract transportAsset Development – Capital to purchase storage
Strategy No. 3: Crop Husbandry, Preservation
Land PreparationPlanting in rows and with moundsIntercroppingCrop maintenance (cultural practices)Harvesting (pre harvest & post harvest technology)processingIrrigation methodsCrop budgetsCrop calendars - When to plantIPM – for ants and weevils Preserving seeds
FIGURE 2: STRATEGIES TO DEVELOP THE DRIED COW PEA VALUE CHAIN

their contribution via a susu since CPBD had done the procurement. Despite these challenges in some of the communities cow peas were successfully cultivated, but program staff did not have the opportunity to work with the communities on the marketing initiatives outlined in strategy No. 1, since these were historical communities in which the program were no longer working. Another challenge was that the CPBD program needed to graduate these communities and focus its efforts on introducing the program in new communities. As a result the program staff could not work through the entire strategy with the farmers, nor did they have the time to go back during a second season to reinforce the new cultivation techniques introduced or to encourage the farmers groups in their organization.
From these experiences we were able to highlight the following key lessons:
Need for consistency in communications with communities and farmers groupsAs illustrated above in implementing the cow peas initiative, there was little consistency in what was communicated to the farmers groups and the communities. Initially communities and farmers groups were asked to make a contribution, but then this was not followed up on. It was also unclear as to how the AGRA and CBPD staff re-enforced and supported the other aspects of the strategy over the course of the seasonal calendar, such as the plan to collectively store and market their produce.
Need to work more intensively with farmers to assist them not only in improving their cultivation practices, but also to assist them in better organized and professional in their operationsPromoting behavior change cannot be achieved overnight, particularly among adults and youth, since they are revisiting how they have operated for years if not decades. Effective behavior change requires learning through doing, followed by a period of practical support to reinforce the lessons. Having spent limited time with AGRA in the field, the organization seems to be very good at assisting farmers in learning about “best practice” farming, by working side by side with farmers and communities in the fields. However fewer techniques seem to have been developed and applied by MC and AGRA to assist farmers in revisiting how they manage their farm and make decisions on which crops to engage in. This is a critical missing gap—particularly as the program moves into promoting cash crops. Poor people are naturally risk averse since they are struggling to survive. To motivate the CPBD communities to engage in new farming practices, the program needs to help them see how the practices will reduce their costs while increasing their yields.—If this is not the case then CPBD needs to make the case as to how increased costs will be offset by increased yields. Communities need to feel confident that the investment they will make in terms of labor and inputs will be paid off through increased sales and profits. This will also enable the communities to earn the cash they need to continue to invest in their farm in the future. Additionally building communities’ market literacy and assisting them to better link to markets and buyers will enable them to profitable engage in the long run, since they will have opportunities and resources to make smart cultivation and marketing decisions.
Last year Mary Morgan left the team with a template and suggested meeting plan as to how staffers might start to work with farmers on this. It would be useful to start working with this template and to use it as a springboard to promote more consistent activities and planning in the community. This will help farmers to start evaluating the choices they make as well as enabling them to plan both their production and marketing strategies giving them a better chance of success. Additionally at the conclusion of the consultancy, the consultant gave the team a set of resource books developed by the FAO for working with farmers on marketing and farm management for some additional ideas.
- 11 -

Ultimately if communities do not see and realize economic gains from “best practices” or “modern production techniques” then they will quickly abandon them.
Need to proactively trouble shoot challenges and to develop plans to address themA strength of subsector and value chain tools is that they require implementers to identify as much as possible all of the potential constraints that exist in a given value chain and how these constraints affect all the different actors in the chain. In the cow pea analysis, there were several potential constraints identified including pests. As part of the program planning for strategy No. 3 AGRA and CPBD staff were charged with working with communities and farmers groups to build their ability to recognize and manage pest outbreaks in their field. During this year’s consultancy visit, several of the communities were starting to suffer from pest outbreaks in their cow pea fields; however, they had no plans as to how they would address the outbreaks. There was no reason why the communities should not have had a plan to roll out to address these outbreaks, since it was forecast over a year in advance that this would be one of the constraints and different potential solutions were identified to address this constraint.
Need to identify at which level to work in the communitiesOne of the challenges in overlaying a community development program with an economic development initiative is incentives. Although the community as a whole may have agreed that the program should work on agriculture and particular sectors, usually the programmatic activities that result will not benefit all community members. This is definitively the case in the activities promoted under CPBD. The program does not have sufficient funds to outfit all community members with seeds and tools—nor do all community members necessarily wish to engage in cow peas, much less other legume or horticulture crops. Therefore to be effective the program needs to focus on individuals already engaged in or interested in engaging in this sector. These individuals will generally be acting in their own interest and in the interest of their families. Ultimately if the individuals do not receive tangible benefits from what they are expected to contribute to the initiative then they will have no incentive to insure its success.
Overarching all of these lessons is a challenge that CPBD will likely be unable to overcome at this point in the program cycle, is the way in which the program is designed and operates is not well suited to promoting market development and commercial farming by smallholders. The overarching goal of CPBD is social development and peacebuilding following a protracted civil war. The program’s structure is based upon promoting these goals and does not have all the resources and structures needed to focus primarily on market development. In addition to agriculture, communities have the choice to focus on other activities in health and other small, non-agriculture based businesses. Once the community makes the decision as to which of these activities to undertake, the program has $1,000 in funds to invest in one of these activities and can provide some technical support. This does not provide the programmatic flexibility needed for the agriculture programs and may indeed skew more sustainable programming, since ultimately the program must spend out the $1,000 grant. If it does not then the community is at a disadvantage versus other communities that chose activities in health or alternative income generation. This is at no fault to the program which was designed over five years ago, when Liberia was at a very different stage in terms of its political and even economic status. At that time the CPBD communities also had different priorities, and they were less focused on economic development.
Another aspect of market development programming is that it takes a systems view, looking beyond the community level to the broader market systems with which communities interact. Figure 1 presents a schematic of the different factors which may need to be taken into account in designing and implementing a market development program. For example a market assessment
- 12 -

might determine that the best means by which to promote food security across all of the CPBD communities is to actually work not at the community level, but rather in the transportation sector developing transportation services that allow communities to better transport their goods to market. If this were to be a finding, within the current CBPD structure this issue could not be addressed.
So the challenge is to determine how best in its final year can CPBD assist communities to prepare for the transition and support their desire to move into more commercial agriculture, while meeting the programmatic goals of working in 200 communities. A market assessment is a still a useful tool at this stage, since ultimately an understanding of the private sector and the markets into which the community link is needed. The analysis can also be tailored to hone in on the types of solutions that are within the purview of CPBD. It also enables the program practitioners to start developing a longer term view as to what form subsequent programming could take. Given this, the recommendations provided in this report will look at both aspects. The first will be to advise the CPBD program based on its current structure as to how it can best continue to reorient its programs towards a greater focus on sustainable economic development and the promotion of the strategic subsectors and value chains identified in this report. The second will be to advise how in subsequent programs the program implementers: AED, AGRA and MC can realize their vision to use market development programming as a means to catalyze economic reconstruction and growth, thereby promoting food security and growing incomes in rural communities.
Identifying Subsectors for the Market AssessmentThe main objective of the consultancy is to work with CPBD staff and local partners to identify additional high potential sectors in which the project may work and to assist the program in developing strategies to work in these sectors. Sectors chosen for the project should be in line with the overall impact objective for the economic development component of CPBD:
To work with local partner organizations to effectively increase food security (both food and income) by improving and diversifying food production and other livelihood means for vulnerable CPBD communities.
To kick-off the consultancy a one and a half day workshop was held with the leadership of CPBD’s LNGO partners and MC in the MC Buchanan office to discuss the overall objectives for the consultancy and potential sectors in which the program might work. All of the program partners agreed that the introduction of the concept of market development and the subsector and value chain frameworks in the prior year was a worthwhile addition to the program in that it attuned staff to the core principles of sustainable economic development. However, as noted in the summary of lessons learned in cow peas above, the staff are still struggling with how best to implement the findings of the initial consultancy and most importantly the principles of market development in their work. We agreed to keep these challenges in mind in this second round of research, analysis and strategy design, so as to address them where ever possible, while further building staff’s capacity.
In applying the market development framework there are four principles, typically used to guide market research and program/strategy design, namely:
• To achieve high impact: Impact can be defined in different ways. Within market development programs, changes in income and the number of households or enterprises which experience these changes are often the key indicators of impact. Depending on the
- 13 -
program impact may also reflect other goals such as the number of vulnerable populations that participate or outreach to rural communities.
• To be focused in the delivery of interventions: The goal is to promote solutions that will be in demand by the target enterprises and to serve their key constraints in terms of reaching higher value markets and improving the efficiency of their operations.
• To be market driven: Market-based programming is all about understanding the incentives of different actors in the subsector and leveraging these and final consumer demand.
• To be sustainable: Sustainability is measured in terms of ongoing value creation by the targeted population following the exit of the market facilitator. It is also linked to the target population having on-going access to the commercial services and inputs they need to develop and grow their businesses and to adapt with changing market trends.
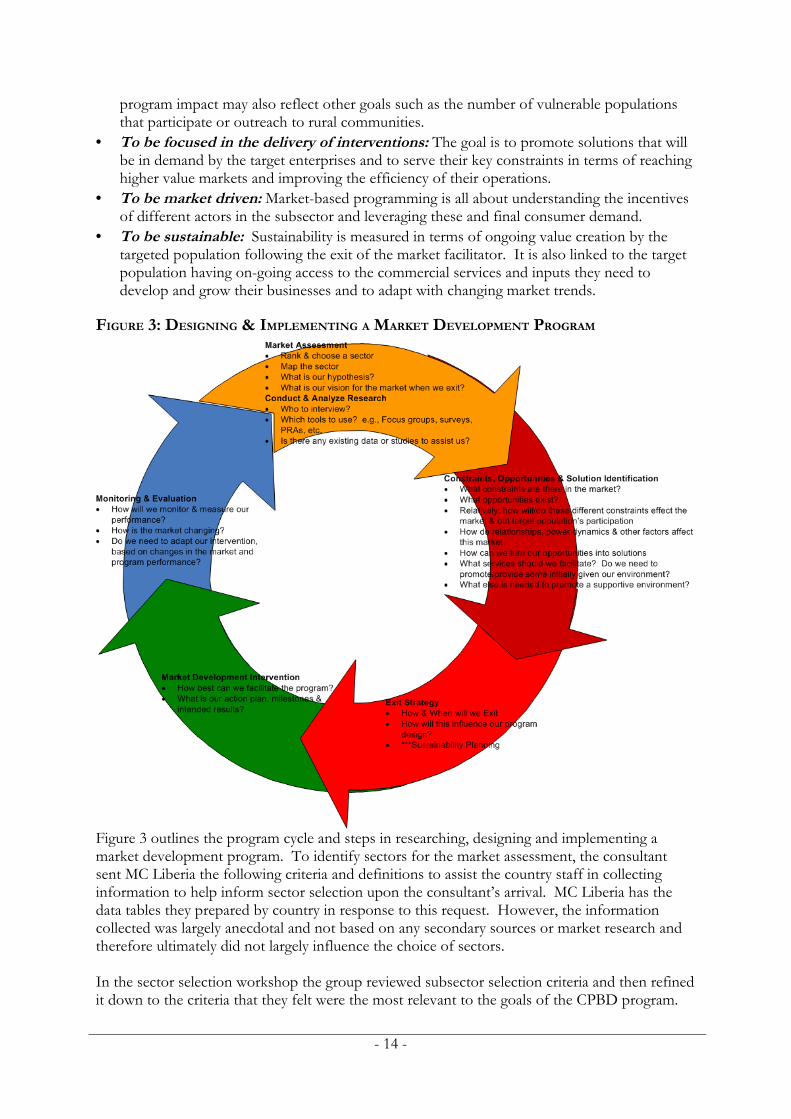
FIGURE 3: DESIGNING & IMPLEMENTING A MARKET DEVELOPMENT PROGRAM
Figure 3 outlines the program cycle and steps in researching, designing and implementing a market development program. To identify sectors for the market assessment, the consultant sent MC Liberia the following criteria and definitions to assist the country staff in collecting information to help inform sector selection upon the consultant’s arrival. MC Liberia has the data tables they prepared by country in response to this request. However, the information collected was largely anecdotal and not based on any secondary sources or market research and therefore ultimately did not largely influence the choice of sectors.
In the sector selection workshop the group reviewed subsector selection criteria and then refined it down to the criteria that they felt were the most relevant to the goals of the CPBD program.
- 14 -
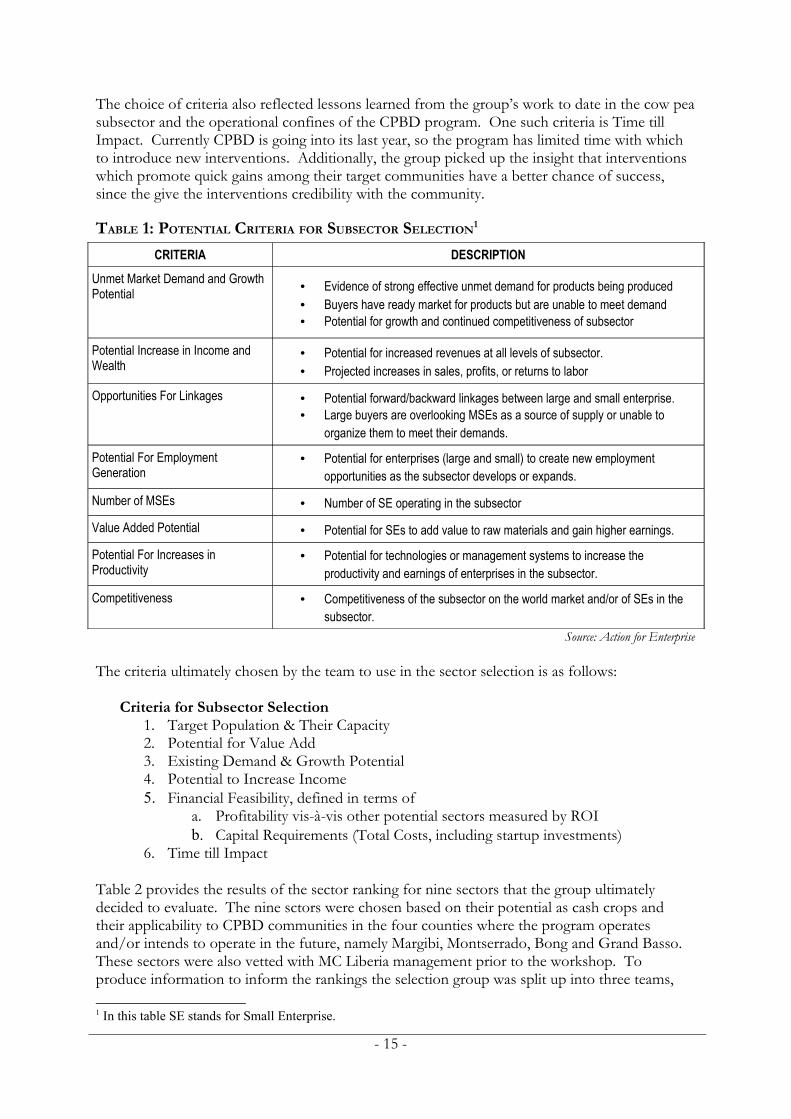
The choice of criteria also reflected lessons learned from the group’s work to date in the cow pea subsector and the operational confines of the CPBD program. One such criteria is Time till Impact. Currently CPBD is going into its last year, so the program has limited time with which to introduce new interventions. Additionally, the group picked up the insight that interventions which promote quick gains among their target communities have a better chance of success, since the give the interventions credibility with the community.
TABLE 1: POTENTIAL CRITERIA FOR SUBSECTOR SELECTION1
CRITERIA DESCRIPTION
Unmet Market Demand and Growth Potential • Evidence of strong effective unmet demand for products being produced
• Buyers have ready market for products but are unable to meet demand • Potential for growth and continued competitiveness of subsector
Potential Increase in Income and Wealth
• Potential for increased revenues at all levels of subsector. • Projected increases in sales, profits, or returns to labor
Opportunities For Linkages • Potential forward/backward linkages between large and small enterprise. • Large buyers are overlooking MSEs as a source of supply or unable to
organize them to meet their demands. Potential For Employment Generation
• Potential for enterprises (large and small) to create new employment opportunities as the subsector develops or expands.
Number of MSEs • Number of SE operating in the subsector Value Added Potential • Potential for SEs to add value to raw materials and gain higher earnings. Potential For Increases in Productivity
• Potential for technologies or management systems to increase the productivity and earnings of enterprises in the subsector.
Competitiveness • Competitiveness of the subsector on the world market and/or of SEs in the subsector.
Source: Action for Enterprise
The criteria ultimately chosen by the team to use in the sector selection is as follows:
Criteria for Subsector Selection1. Target Population & Their Capacity2. Potential for Value Add3. Existing Demand & Growth Potential4. Potential to Increase Income5. Financial Feasibility, defined in terms of
a. Profitability vis-à-vis other potential sectors measured by ROIb. Capital Requirements (Total Costs, including startup investments)
6. Time till Impact
Table 2 provides the results of the sector ranking for nine sectors that the group ultimately decided to evaluate. The nine sctors were chosen based on their potential as cash crops and their applicability to CPBD communities in the four counties where the program operates and/or intends to operate in the future, namely Margibi, Montserrado, Bong and Grand Basso. These sectors were also vetted with MC Liberia management prior to the workshop. To produce information to inform the rankings the selection group was split up into three teams,
1 In this table SE stands for Small Enterprise.
- 15 -

with each team preparing a deeper analysis of three potential sectors across the criteria. This included breakeven and profitability analyses for the financial feasibility criterion. The smaller teams then regrouped and presented their analysis to the entire group. Summaries of their presentations and financial analyses are included in Appendix 4. For each criterion, the group was asked to rank the sectors on a scale of 5 to 1, with a score of 5 for a good fit. Based on the presentations the group ultimately chose to focus on peanuts and hot pepper for the market research.
TABLE 2: SECTOR RANKING
Suitabilityfor TargetPopulation
Potential forValue Add
ExistingDemand &GrowthPotential
Potential to IncreaseIncome
ProfitsCapital Required(Total Costs)
Time till Impact Total
Goats 3.5 3 5 5 1 1 1.5 20Sheep 1 2 3 4 2 1 1.5 14.5CassavaProcessed
5 4 5 3 2 1 3 23
Cassava 5 4 5 3 2 5 3 27
Peanuts 5 4.5 5 5 4 2.5 4 30Plantains 3 2.5 3 4 1.5 2 1 17Hot Pepper
5 3.5 4.5 4.5 3 3.5 3.5 27.5
Bitter Ball 3.5 1.5 3.5 3 2.5 3.5 3.5 21Corn 3.5 2 2.5 1.5 1.5 3.5 3.5 18
With completion of the sector selection the larger group adjourned and MC Deputy Country Director, Tricia Matthews worked with the CPBD local partners to determine who should be on the research team. The final composition of the research team is included in Appendix 3. The team then adjourned for a day, before meeting up again for a one day refresher course on market development programs and market research. The training materials used in the one day seminar are included separate to this report.
Market ResearchAt the conclusion of the market development refresher course the research team prepared preliminary subsector maps for peanuts and hot peppers. These maps were a useful tool for the team, acting as an outline for the market research, since the maps outlined the different market actors in the two subsectors and the different value chains in each subsector. Figures 4 & 5 provide the final maps that were eventually produced for the hot pepper and peanut subsectors.
Subsector maps are a useful tool to set the stage for a market study, since through mapping the industry all the market actors who need to be interviewed are identified. Additionally, the map provides a useful framework on which to stage a discussion as to the hypothesis and goal of the research. Formulating a hypothesis statement for the research in terms of the potential constraints and even opportunities and solutions that may be uncovered is a good means of helping the research to stay focused. The hypothesis statement is complemented by a goal statement, which helps to ensure that the research identifies potential solutions that can actually be employed in the program. Appendix 5 provides the research plan the team designed for hot peppers. The research plan for hot peppers was informed by market research, since it was
- 16 -

completed after one day of market interviews at St. Johns’ Market in Grand Basso country, which is located on the border of Bong country and therefore acts as a bi-county trading hub.
It is important to note that the research plan and the hypothesis statement are just a plan and that the team in its research was instructed to stay receptive to all of the information collected, allowing us to capture potential findings and constraints that we may not have predicted. For example, land title and land usage emerged as a constraint in both sectors and not one which was highlighted among the potential constraints in the hot pepper research plan.
The research hypothesis for hot peppers and the overall goal for a potential intervention are as follows:
Hypothesis: Pepper production, processing, and marketing offers an opportunity for CPBD communities to increase their incomes, by engaging in a high value crop for the Liberian market.2 Following the Liberian Civil War, cultivation of pepper is increasing annually and during the primary harvesting season Liberian markets are sometimes saturated with fresh pepper. To be successful in the fresh and dried value chains for hot pepper, communities will need to enter into off season production as well as looking at means by which they may preserve excess production during the peak season through processing and/or storage for sale when there is scarcity.
Goal: To increase CPBD communities’ engagement in value chains for hot pepper, through improved production and processing and the development of a marketing plan.
Notably for peanuts, the research team was much less knowledgeable as to the potential for peanuts. For much of the market research we were unable to bridge the gaps in our knowledge, since we conducting our initial research in Grand Basso and Margibi countries. These counties are more lush, with more low and semi-low land making them less suitable for peanut cultivation. Additionally as we were to learn, peanut cultivation largely stopped during the civil war and is only restarting. So there was little activity to study. It was only in the final stages of our research, when we traveled to Bong county that we started to identify farmers and other market actors working in domestic peanuts. As a result we had insufficient information to formulate a comprehensive research plan for peanuts, so one is not included with this report. However, to keep the research team on track the following goal/hypothesis statement was formulated for the peanut subsector: Goal/Hypothesis: To examine the potential viability of the peanut sector as a re-emerging crop, and opportunities in marketing and processing.
To save time, survey questions for the research were based off the prior set of surveys that Mary Morgan developed with the research team in May 2005. Survey questions were developed for small holder farmers, input suppliers, processors, transporters, traders and retailers (small tabletop operations to medium and large with storefronts.) Additionally some questions were added to try to gauge through the research what were some of the trends in the two sectors in terms of competition, levels of production, demand and prices. As discussed in the scope and limitations section of the report, one of our greatest disadvantages was the lack of time to test the surveys and to train the research team in administering them. Since statistically significant results were not needed for this research, throughout the research the consultant worked with the research team to adjust the survey questions as needed so as to gather the most relevant and
2 Per a discussion with an official at the FAO, prior to the Liberian Civil War there may have been exports of hot fresh and dried pepper to neighboring African countries.
- 17 -

highest quality information. Copies of the surveys used and the results which could be tabulated are included in a separate attachment to this report.
Another challenge of the research was that the team only had one car, so this limited the team’s movements in terms of the number of interviews and geography which could be covered. Appendix 2 provides the travel itinerary for the trip and all the communities and markets visited across the four counties: Grand Basso, Margibi, Montserrado and Bong in conducting the market research.
Based on the lessons learned from the work in the cow pea sector, we also opted to do participatory economic mappings in each of the communities that we visited. This allowed us to understand the sectors studied in the greater context of all the economic activities undertaken by the communities. Four different PRAs were used in each of the communities, although based on time limitations and community responses we varied our use of PRAs three and four:
Enterprise Ranking: Community members free list all of the activities that community members undertake to acquire money, food or other resources that they require. They are then asked to rank the relative importance of these activities based on three criteria:
o Importance to the village, based on however they define importanceo What brings the most moneyo What is easiest to sell
Price Difference by Season and Location: Community members discuss the season price trends for the most important sources of income identified in the first PRA. They are also asked to comment as to how prices change based on where they sell.
Enterprise Trends: Builds off the second PRA by asking communities to delve deeper on the trends in their key activities in terms of changes in production levels, sales and profit levels and the reasons for any changes.
Gender Roles in Marketing: Looks the gender and power roles in the different economic activities, particularly in terms of control of resources generated by the different activities.
The four PRAs and communities’ responses are included in Appendix 6, with a broader discussion of the findings below.
General Research FindingsAs discussed in the scope and limitations of the study, we were unable to tabulate all of the research questionnaires, since many were not filled in properly or responses were written in the margins. This greatly challenged the data collection and compromised our results. Based on this the comments here are a compilation of the general trends were found among all the different actors in the subsector.
- 18 -
Farmers
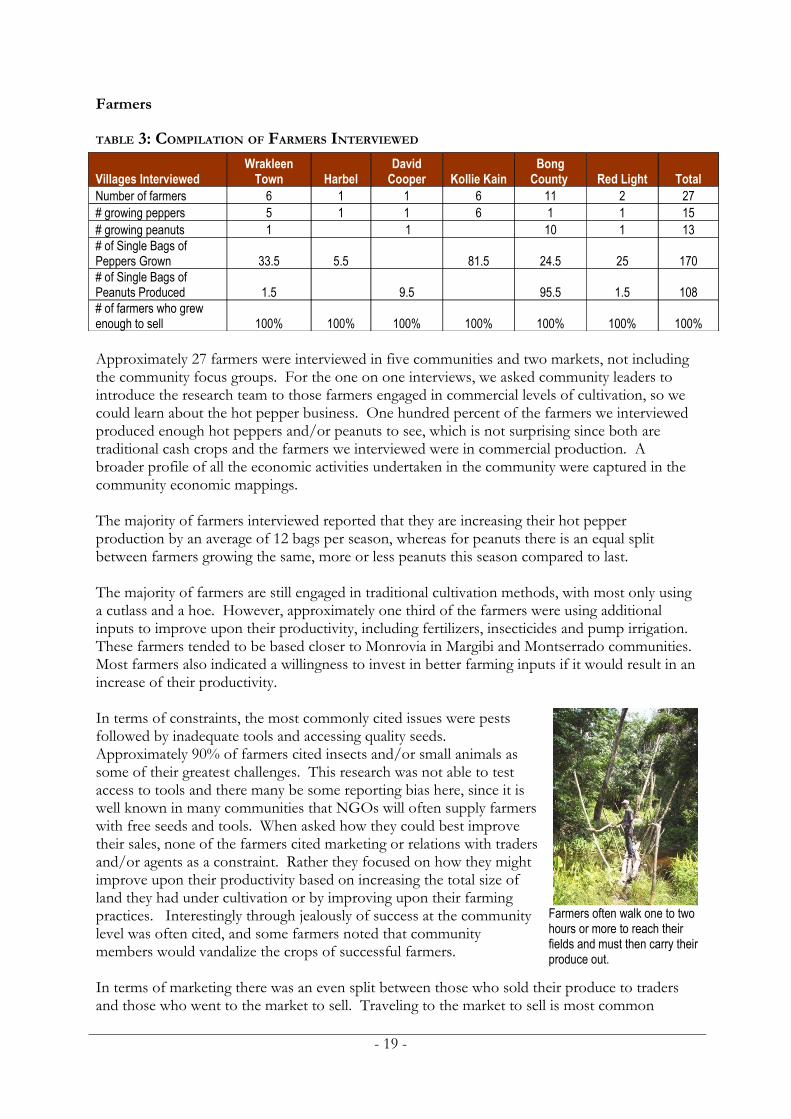
TABLE 3: COMPILATION OF FARMERS INTERVIEWED
Villages InterviewedWrakleen
Town HarbelDavid
Cooper Kollie KainBong
County Red Light TotalNumber of farmers 6 1 1 6 11 2 27# growing peppers 5 1 1 6 1 1 15# growing peanuts 1 1 10 1 13# of Single Bags of Peppers Grown 33.5 5.5 81.5 24.5 25 170# of Single Bags of Peanuts Produced 1.5 9.5 95.5 1.5 108# of farmers who grew enough to sell 100% 100% 100% 100% 100% 100% 100%
Approximately 27 farmers were interviewed in five communities and two markets, not including the community focus groups. For the one on one interviews, we asked community leaders to introduce the research team to those farmers engaged in commercial levels of cultivation, so we could learn about the hot pepper business. One hundred percent of the farmers we interviewed produced enough hot peppers and/or peanuts to see, which is not surprising since both are traditional cash crops and the farmers we interviewed were in commercial production. A broader profile of all the economic activities undertaken in the community were captured in the community economic mappings.
The majority of farmers interviewed reported that they are increasing their hot pepper production by an average of 12 bags per season, whereas for peanuts there is an equal split between farmers growing the same, more or less peanuts this season compared to last.
The majority of farmers are still engaged in traditional cultivation methods, with most only using a cutlass and a hoe. However, approximately one third of the farmers were using additional inputs to improve upon their productivity, including fertilizers, insecticides and pump irrigation. These farmers tended to be based closer to Monrovia in Margibi and Montserrado communities. Most farmers also indicated a willingness to invest in better farming inputs if it would result in an increase of their productivity.
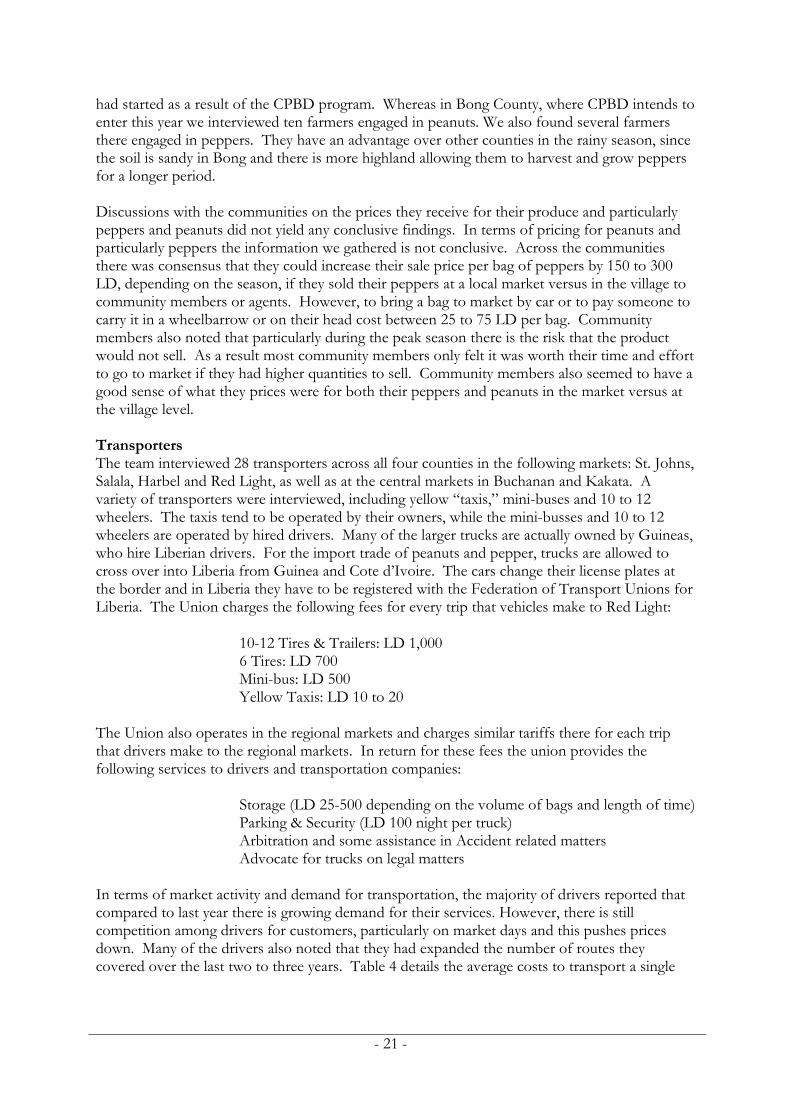
In terms of constraints, the most commonly cited issues were pests followed by inadequate tools and accessing quality seeds. Approximately 90% of farmers cited insects and/or small animals as some of their greatest challenges. This research was not able to test access to tools and there many be some reporting bias here, since it is well known in many communities that NGOs will often supply farmers with free seeds and tools. When asked how they could best improve their sales, none of the farmers cited marketing or relations with traders and/or agents as a constraint. Rather they focused on how they might improve upon their productivity based on increasing the total size of land they had under cultivation or by improving upon their farming practices. Interestingly through jealously of success at the community level was often cited, and some farmers noted that community members would vandalize the crops of successful farmers.
In terms of marketing there was an even split between those who sold their produce to traders and those who went to the market to sell. Traveling to the market to sell is most common
- 19 -
Farmers often walk one to two hours or more to reach their fields and must then carry their produce out.

among those farmers selling in larger quantities of five bags or greater in one sale. Half of farmers self carry or hire someone else to carry their goods to the market while the other half hire yellow taxis.
Most of the farmers noted that they belong to a ku and that they use the ku as a source of labor. However, there were several larger farmers who indicated they had paid for their ku labor. Thus from our interviews we were unable to determine how functional most of the ku structures actually are.
The majority of farmers undertake no processing of either their peppers and/or their peanuts. Although 30% reported that they dry peppers, but primarily for home consumption.
Prices paid to farmers for pepper tended to average around 1,500 LD per bag, particularly if it was a bigger farmer with some bargaining power in terms of the number of bags sold. Some smaller farmers did note however, that their prices could be much lower, particularly when they sell by the bucket or half bag with prices ranging from 800 to 900 per bag. We attempted to classify growers based on the range of production levels they achieve, this is illustrated in Figure 4 We estimate that in most communities small growers dominate, with a subset of enterprising medium and larger growers.
Community Economic MappingsA team of two researchers undertook PRAs in three communities in Grand Basso and Margibi counties. Due to time constraints we were unable to undertake a community mapping in Bong. All of the communities that we visited were CPBD communities that had completed their main activities under the program, and all were located along main roads, which may have influenced the findings since this allows them greater accessibility to markets.3
When asked to rank the different activities undertaken by community members and the relative importance of these activities, the results across all three communities was a mix of cash crops and staple crops, with cash crops dominating. This indicates that the communities are focused on increasing their cash incomes. For example in David Cooper, Margibi Country, community members ranked cassava production as the more important activity to the village, since it is a food staple. However, the three subsequent activities that they ranked in importance were tapping, bitterball and palm oil, all of which community members undertake for cash. Similarly in Wrakleen, the group seemed to be focused on cash crops ranking palm oil as the most important crop to the village, as it generated $3,000 USD for the community in the past year. Cassava then followed in importance with peanuts, rice and pepper ranked third through fifth. Relatively Kollie Kain, Margibi was the most focused on staple crops of the three communities listing cassava and rice as the most important activities, followed by plantains, which is a traditional source of food during the hungry season. Additionally across all three communities, many communities were growing rubber trees on their private or community land as an upcoming income source in the next six to seven years. This would indicate that communities are starting to take a more long term view to their livelihoods.
Importantly, the communities confirmed that work to strengthen the hot pepper subsector would be of interest to them, particularly in Grand Basso and Margibi where many community members are engaged in the subsector. Communities in these counties also expressed interest in peanuts, but we found very few communities engaged in peanuts and most who were engaged
3 Access is used loosely here since many farmers may have to walk one to two hours or more into the bush to reach their fields. This may include river crossings and other obstacles, when then have to be recrossed with the produce carried on their heads when it is ready for market.
- 20 -
had started as a result of the CPBD program. Whereas in Bong County, where CPBD intends to enter this year we interviewed ten farmers engaged in peanuts. We also found several farmers there engaged in peppers. They have an advantage over other counties in the rainy season, since the soil is sandy in Bong and there is more highland allowing them to harvest and grow peppers for a longer period.
Discussions with the communities on the prices they receive for their produce and particularly peppers and peanuts did not yield any conclusive findings. In terms of pricing for peanuts and particularly peppers the information we gathered is not conclusive. Across the communities there was consensus that they could increase their sale price per bag of peppers by 150 to 300 LD, depending on the season, if they sold their peppers at a local market versus in the village to community members or agents. However, to bring a bag to market by car or to pay someone to carry it in a wheelbarrow or on their head cost between 25 to 75 LD per bag. Community members also noted that particularly during the peak season there is the risk that the product would not sell. As a result most community members only felt it was worth their time and effort to go to market if they had higher quantities to sell. Community members also seemed to have a good sense of what they prices were for both their peppers and peanuts in the market versus at the village level.
TransportersThe team interviewed 28 transporters across all four counties in the following markets: St. Johns, Salala, Harbel and Red Light, as well as at the central markets in Buchanan and Kakata. A variety of transporters were interviewed, including yellow “taxis,” mini-buses and 10 to 12 wheelers. The taxis tend to be operated by their owners, while the mini-busses and 10 to 12 wheelers are operated by hired drivers. Many of the larger trucks are actually owned by Guineas, who hire Liberian drivers. For the import trade of peanuts and pepper, trucks are allowed to cross over into Liberia from Guinea and Cote d’Ivoire. The cars change their license plates at the border and in Liberia they have to be registered with the Federation of Transport Unions for Liberia. The Union charges the following fees for every trip that vehicles make to Red Light:
10-12 Tires & Trailers: LD 1,000 6 Tires: LD 700 Mini-bus: LD 500 Yellow Taxis: LD 10 to 20
The Union also operates in the regional markets and charges similar tariffs there for each trip that drivers make to the regional markets. In return for these fees the union provides the following services to drivers and transportation companies:
Storage (LD 25-500 depending on the volume of bags and length of time)Parking & Security (LD 100 night per truck)Arbitration and some assistance in Accident related mattersAdvocate for trucks on legal matters
In terms of market activity and demand for transportation, the majority of drivers reported that compared to last year there is growing demand for their services. However, there is still competition among drivers for customers, particularly on market days and this pushes prices down. Many of the drivers also noted that they had expanded the number of routes they covered over the last two to three years. Table 4 details the average costs to transport a single
- 21 -

TABLE 4: TRANSPORTATION COSTS FOR LOCAL MARKETS & RED LIGHT (Liberty)Bong Grand Basso Margibi Montserrado
Local Red Light Local Red Light Local Red Light Local Red Light50 kg peanuts 37.5 75 50 150 40 87.5 27.550 kg pepper 32.5 75 50 112.5 45 62.5 27.5
50 kg bag of peanuts or peppers from a community to a local market and the fees to transport from the local markets to Red Light market in Monrovia. The price data is from drivers, communities and drivers. What was noticeable in this price survey is that the prices are not necessarily reflective of the total number of kilometers traveled, but likely is more closely related to road conditions and perhaps competition among drivers. For example in Bong country communities pay 33 LD to transport a bag of pepper to a local market, where as to take a bag to Red Light costs LD 75. Thus communities’ cost of transportation is higher to local markets relative to traveling to Red Light in terms of the distance.
TradersApproximately 30 traders were interviewed across the four counties in the following markets St. Johns, Salala, Harbel and Red Light, as well as at the central markets in Buchanan and Kakata. For the purposes of the research, traders were defined as market actors who purchased produce either directly from farmers and/or via agents in order to sell the produce to retailers who then sell to the final consumer. In reality we found that it was difficult to make clear distinctions between traders, retailers and farmers, since all of these actors sometimes sell to the final consumer. However, the larger a trader the more likely they are to specialize and sell only to retailers. As illustrated in the hot pepper and peanut subsector maps, Figures 4 & 5, we were able to make some distinctions between traders based on the amount of working capital they invested in their business.
Another distinction was based on traders’ specialization usually in either fresh or dry goods and the markets from which they buy. Fresh traders, typically work in the Liberian market, buying fresh peppers from farmers and agents. If these traders work in other crops in addition to pepper it tends to be other horticulture crops, but this does not include fresh peanuts. Our research found that fresh Liberian peanuts are still very rare on the Liberian market, so there is insufficient supply to attract specialized traders. Rather they are sold either directly by farmers or by generalist traders who buy whatever goods are available in rural markets for resale in Monrovia. Dry goods traders specialize in dried peppers and/or dry peanuts. These traders travel to Guinea, Cote d’Ivoire and Mali to purchase their goods.
The amount of working capital a trader could invest in the business is important, since it influences the traders’ buying power and ultimately profitability. Traders with 15,000 LD or more available to make longer terms investments of a month or more can establish forward buying relationships with farmers. Typically these traders will advance cash or other goods to farmers, including both consumer goods and productive inputs such as fertilizer, a rented water pump, etc., in order to secure a buying agreement at harvest time. At the time of the harvest the trader will subtract an agreed upon price for the advance from the price paid for part or all of a farmer’s harvest. Currently there is considerable competition for farmers’ harvests, particularly if they will have 20 or more bags available for sale. As a result traders complete with one another to establish buying relationships with these farmers, and the traders we talked with noted they had lost out to other traders who could offer the farmers better deals. Most of these larger farmers tend to cluster in the communities and counties surrounding Monrovia, so as a result traders who can secure buying agreements from these larger farmers have lower operating costs. These traders spend less time and resources going from village to village to find product to buy,
- 22 -

and they do not have to travel to markets far from Monrovia. In contrast the traders with far less working capital to invest must travel much further to find sufficient supplies for sale. They may also have to travel from village to village consolidating ERA buckets of pepper into bags to bring back to Monrovia. This increases their costs considerably. For example one trader we met had 5,000 LD which she invested in buying goods weekly, in addition she set aside another 2,500 LD to cover her weekly costs in terms of transportation, food, etc.
Input SuppliersInput Supply is still somewhat limited throughout the country, with all of the largest suppliers based in Monrovia. The only exception is Sethi Brothers, which recently opened an outlet in Kakata in Margibi country. Some smaller scale retailers are engaged in selling pesticides. They buy them in Monrovia and break the packages down and sell them in smaller quantities at local markets. Tools are also available in markets outside Monrovia, either carried out by traders to the markets or produced by blacksmiths at the village level. Appendix 8 lists the prices for the different inputs we identified and their availability in the different counties.
Description of the Two Sectors
Hot PepperColloquially known as Hot Peppers, the peppers cultivated in Liberia are of the Capsicum frutescens or chinense species, both of which are found in West Africa and known for their fiery taste. Many of the varieties found in the region were introduced by repatriating slaves in the last century. Hot pepper is a key ingredient in Liberian cuisine and many Liberians consume it daily.
Hot Pepper was selected as a promising sector for further study for a number of reasons. As indicated in Appendix 4, it offered the highest profitability of all the sectors we examined, with a potential Return on Investment on a .3 Ha lot of over 300%. Average start up costs to cultivate hot pepper were average to low, relative to the other sectors we examined allowing communities to easily enter into hot pepper production. Other advantages of hot pepper are its short cultivation cycle of three to four months and its high, year round demand. There is significant volatility of the supply of Liberian fresh, hot pepper during the year and as a result the price is similarly volatile ranging from 4,000 LD per bag to as little as 900-800 LD a bag in Monrovia. Figure 4 illustrates the supply and price trends for fresh, hot pepper in the Liberian market over the course of a year.
- 23 -
Women harvesting hot peppers to take to the market. Margibi County

FIGURE 4: HOT PEPPER, NATIONAL SUPPLY VS PRICE4
January February M arch April M ay June July August September October N ov ember December
PriceNationwide Supply
During the dry season from January till March and the rainy season from late June through early October fresh and dried pepper is imported from Guinea and Cote d’Ivoire to fill the gap. Dried hot pepper is largely sold in January through March, when pepper production is similarly low in Guinea and Cote d’Ivoire due to the dry season. The rainy season affects production in Guinea and Cote d’Ivoire less than Liberia, so the two countries can supply some fresh hot pepper earlier at the conclusion of the rainy season. However, given the poor transportation infrastructure, the high costs of fuel in Liberia and that fresh pepper is very perishable, the fresh pepper is only imported where the price spikes at 3,800 LD or greater per bag. Averages of the prices we recorded by location, market actor and season are included in Appendix 9.
Liberian consumers value freshness, taste and appearance in their peppers and are willing to pay a premium for these qualities, particularly in urban markets, giving the Liberian pepper an advantage over imported peppers. There are no cold storage facilities by which to import peppers from other countries and locally Liberian-grown pepper is considered to be hotter than all of the imported varieties, with the exception of dried cayenne which comes from Cote d’Ivoire. Given the limited number of markets and farms visited, we did not attempt to size total production or sales levels in the sector, since we did not have meaningful information on which to make an estimate, and this information was not available from other sources.
Figure 5 illustrates the subsector map for hot pepper. The left hand column is the production and marketing process from the initial input supply through to sale to the final consumer. Across the top are the two distinct consumer groups that consume pepper, and on the bottom are divisions for the four market channels in the sector: Liberian fresh, Liberian dried, Imported fresh & Imported dried. For the import channels, there is no information on the production process and/or distribution of activities until the level of the wholesaler since this takes place outside of the country and could not be studied. Liberian traders travel to the three pepper producing countries: Cote d’Ivoire, Guinea and Mali. There they work with agents or by themselves buying up all the
4 This graph is for illustrative purposes, based on interviews on supply and price trends with actors throughout the hot pepper subsector. Given how dispersed the production and trade of fresh hot pepper is throughout the country, we were unable to estimate the total size of the market based on the number of locations visited.
- 24 -
Rainy SeasonDry Season Hungry Season Dry
Seas
Dried and fresh Liberian hot pepper for sale in Harbel market.

fresh or dried pepper they can access. If needed they will stay in one of the countries for an extended period of several weeks accumulating the pepper through small quantity purchases either to keep the price from increasing or when there are shortages. The large traders then bring it back to Monrovia to warehouses at Red Light. The traders hold the pepper till prices rise and they then sell it. Additionally there are a large number of smaller scale traders who will buy a couple of bags at a time and bring it back over the border for sale direct to consumers or to retailers in Monrovia and other markets. For the first two Liberian channels most of the production flows through the fresh channel. All along the two channels different actors will engage in drying as a last resort when the pepper starts to spoil or if prices drop too low. Although in our interviews we did not identify any actors that engaged in drying and holding as a strategy—most prefer to sell the pepper immediately if they can. This seems to be more of a cash flow issue, than of profitability, since in the dry season the dried Liberian pepper can sell for up to 2,000 LD a bag.
Fresh hot pepper is produced by individual farmers. Most source their seeds from their own seed stock or from other farmers in their community or neighboring villages. There are master farmers in the communities who act as seed suppliers. Seeds are sold by the bottle or can be bartered for assistance in land clearing and cultivation. Some community members will work with the Master Farmers both to gain knowledge of cultivation practices and to share a small percentage of their yield and to acquire seeds. Some seeds are imported from Spain and other countries and we found these for sale in Red Light; however, we did not find any farmers using the imported seeds. There are also some small scale seed suppliers in Red Light who process and sell local seeds. High and low prices for all of the inputs used in cultivation by county are included in Appendix 8. Pepper is widely grown in the CPBD communities on a small scale, often by women who use it to earn some cash. These small scale plots typically produce three to four 50 kg bags per season. These small scale farmers often sell their pepper within village, or carry it to local markets to sell throughout they season as they harvest. We also found in several of the communities that there are groups of farmers, mostly men, but also some women who are working to grow on a larger scale, producing usually 20 bags and greater per season. These farmers are split between those who travel to markets to sell there peppers or those who pre-arranged to sell their produce to traders and/or agents at the farmgate. As discussed in the research findings, traders and sometimes agents will offer inputs, cash and other incentives upfront to pepper and other farmers in order to secure agreements to buy at harvest time.
There are large numbers of traders and agents competing to secure produce from the farmers, particularly those farmers closest to larger, urban markets such as Monrovia. As discussed in the research section these traders’ power and influence is based on the amount of capital they have available both to invest in farmers and to buy larger quantities of produce. However in both the Liberian market channels and the other two import channels there is a high level of fragmentation. None of the buyers or suppliers operating in the four market channels have a significant market share and therefore they have relatively little influence over each other. Price is the main determination of all relationships. In the value chain framework this type of governance structure where there is little to no formal cooperation among participants and business transactions are primarily at “arms-length” is know as Market-Based. Appendix 11 illustrates the different types of governance structures found in value chains and their characteristics. Often horticulture chains have what are know as Directed governance structures in which a group of firms, often traders and/or agents determine the rules of trade and the prices that small farmers receive. However, in Liberia this currently does not appear to be the case for hot pepper, particularly for the larger farmers who have greater bargaining power. This
- 25 -

may be due in part to the shortages of fresh hot pepper on the market during and following the civil war. There were and are still relatively few farmers growing significant amounts of pepper versus the number of traders and retailers competing to buy their produce, particularly in the non-peak season. As a result the farmers are not price takers, but rather have options in terms of who they will sell to based on the price and other incentives. There are benefits and costs to the current Market-Based governance structure. Currently farmers seem to be getting a better price in this structure, but this will likely not continue if the quantities of pepper supplied continue to grow, particularly in the peak season weakening farmers bargaining power. As the supply continues to grow, the competition among traders will subside and this may result in a more directed governance structure arising. Another disadvantage is that given the low levels of coordination between the market actors, there is a large amount of waste during the peak season of product and increases in traders and farmers costs since they do not coordinate their trade. There are also missed opportunities in that Liberian farmers may be able to supply dried pepper to traders who currently go to Guinea and Cote d’Ivoire to purchase dried pepper at great expense and increasing risk given the unrest in both those countries.
PeanutsThe peanut subsector is far less developed than hot pepper, with production just restarting. Historically it seems that many communities used to grow peanuts, and the CPBD staff and local staff pushed hard for the choice of peanuts as a subsector for study, insisting it is highly profitable, despite the findings in the initial subsector selection workshop which found it had among the lowest returns of the sectors studies at 104%. A revision of the net income and ROI calculations at the end of the assessment found the actual returns to be even lower, with a ROI ranging between 74% to -71% depending on the time of year when t he peanuts are sold and if labor costs are included. This would indicate that peanuts are not very desirable as a crop to promote via the program. It is unclear why the CPBD staff, local partners and the communities are so interested in growing peanuts, and it would be worthwhile to explore this with them some more in case a mistake has been made in calculating the returns or if there are other intangible factors that should be considered. However, a mistake in the ROI calculations seems unlikely as the main driver of the low returns for peanuts is the low yields that the crop provides in the counties where we observed peanut production, namely Margibi and lower Bong. One possibility is that since imported peanuts are so widely sold in the country and for such high prices, in the non-peak season dry imported peanuts sell for up to 7,000 LD per bag, that the CPBD partners and staff instinctively felt that peanuts had to be profitable. This is a good illustration as to why when choosing sectors it is so important to use empirical data, since sometimes our instincts can lead up astray. This finding also coincides with outside research which confirms that while peanuts can be grown in Liberia, the crop is less productive than in Senegal and Guinea due to climatic conditions.
Given the low potential for peanuts we will not dwell on the subsector analysis conducted for the crop, particularly since our findings were so sparse in terms of fresh production in Liberia.
Currently most of the farmers growing peanuts are growing a variety known as Cro Cro in the local language and we also found Cro Cro seeds available for sale in some of the local market places. Other varieties available in the country are known in the local language as Red or Citizen, white and baka. Samples of the different varieties sold in the markets were left with Mercy Corps Liberia for species identification Most farmers are interesting in cultivating the red peanuts, since they are both more productive and the red peanuts are popular among Liberians
- 26 -
Peanut plant in Bong.

for consumption. Reportedly the red is sweeter in taste and has a higher oil content, making the red more popular among consumers as well. There are no red seeds available at the markets, so farmers are cultivating red dried peanuts that were brought in from Guinea and Cote d’Ivoire for consumptions. The peanuts are then sold boiled for 850 up to 3,200 per bag, with the average price around 1,600.
Similar to hot pepper, the peanut industry is very fragmented, particularly on the import side with dozens if not hundreds of Liberians traveling over the borders with Guinea and Cote d’Ivoire to buy peanuts. There are two cooperatives of larger traders, who are all women and based in Red Light market. Many of these women have been importing dried and salted peanuts from Guinea and Cote d’Ivoire for 20 years or more, which also indicates that these are trade flows that operated before the Liberian Civil War. As a result the governance structure for the peanut value chains is Market-based, although perhaps a little more directed, particularly in terms of wholesale markets for the imported peanuts given the large traders in Monrovia.
- 27 -

Retail
Wholesale
Input Supply
Growers
Processors
RURAL
Liberian FreshChannel 1
Liberian DriedChannel 2
Imported FreshChannel 3
Imported DriedChannel 4
URBAN/PERI-URBAN
Tools & Chemicals
Imported Seed Supply
Farmer Seed
Suppliers
Growers (Small, Medium & Large)Small = 3-4 50kg-bags
Medium = 5-30 50kg-bagsLarge = 30 50kg-bags and up
Agents
Medium
Traders
Small Fresh Retailers
Small Traders
Small Fresh & Dried Retailers
Large Traders - Fresh Warehouse at Red Light
Small Dried
Importers & Traders
Large & Medium
Dried Importers & Traders
= Finance Linkage
= Chain Linkage
KEY: Small Traders = 5,000 LD in Capital (K)Medium Traders = 10-15,000 LD in KLarge Traders = 15,000 LD in K and up
Figure 5: Hot Pepper Subsector Map
- 28 -

Retail
Wholesale
Input Supply
Growers
Processors (Boiling)
RURAL
Liberian FreshChannel 1
Guinea DriedChannel 2
Guinea & Cote d’Ivoire FreshChannel 3
URBAN/PERI-URBAN= Finance Linkage
= Chain Linkage
Small Growers
Tools & Supplies
Small Fresh Retailers
Small Non- Specialized
TradersLarge Traders - Dried
Warehouse at Red Light
Small Trader
Small Retail
Mechanized Processors
Small Manual Processors
Small Traders
Large Traders - Fresh Warehouse at Red Light
Small Retail
Seed Supply (small peanut traders)
KEY: Small Traders = 5,000 LD in Capital (K)
Medium Traders = 10-15,000 LD in K
Large Traders = 15,000 LD in K and up
Figure 6: Peanut Subsector Map
- 20 -

Identification of Constraints in the Two SectorsOne advantage of the choice of two horticulture sectors for the study is that there were many overlaps between the two subsectors, in terms of their value chains, the market actors and the supporting services required, e.g. tools, seeds, financing, etc. This made it possible for us to look at the two subsectors simultaneously, which would not have been possible in other subsectors. Given all the overlaps, the constraints for both sectors are presented together here, with a notation at the end for the few constraints specific to each sector.
A challenge in identifying and isolating constraints in a market environment such as Liberia is in identifying the most pressing constraints and then determining which constraints can actually be addressed in terms of a project’s resources and timeline. Frankly there are so many constraints in a reconstruction environment that even identifying all of them is daunting and provides limited utility. Therefore, rather than trying to list all of the constraints in these two sectors, the goal of this exercise is to highlight the most pressing constraints to promoting the engagement of the CPBD communities in these two subsectors. A second criteria, is to identify constraints that may be within the capability and competencies of organizations such as AED, AGRA and MC to address or to partner with another organization to work on. If the constraints identified are so great as to prevent success in the subsector if they are not addressed and these constraints are not with the capabilities of the project to address, then this would indicate that the program may have greater success in another subsector. A summary of the constraints identified in hot peppers and peanuts is as follows:
Pests Dramatically Reduce YieldsUniversally, all of the farmers cited all manner of pests (fungus, insects, and small animals) as a constraint to their production. This can dramatically affect their yields from season to season and a large scale farmer in pepper one year can fall back into subsistence production the following year due to pests. It also causes stress all along the value chain for fresh hot peppers since traders cannot find reliable supply sources.
Lack of Certainty Around Land AccessLand access is restricted in many of the communities in which CPBD operates, since the communities are ringed by land private land holdings which are used for rubber and other large scale production. There is a history of the communities working with the private land owners to use this land for small-scale cultivation, but there are many risks involved for farmers given lack of clarity around land access, use of the cultivation’s proceeds etc. We found instances where there were misunderstandings or lack of formalized agreements and the farmers lost access to their crops or at worst were arrested. This also acts as an disincentive for farmers to increase their production.
Lack of Financing for InputsTo engage successfully in larger scale production farmers need access to inputs such as fertilizer and irrigation. However, most farmers do not have the upfront financing needed and while there is some credit available from traders, they are disinclined to invest in start up ventures preferring to work with farmers already producing on a larger scale.
- 30 -

Lack of Access to Quality SeedsThis problem is particularly acute for peanuts. Currently there is very limited availability of what is known in Liberia as the Red variety or Citizen seeds. Farmers are buying dry peanuts meant for consumption purposes from Guinea and selectively sowing and harvesting these peanuts to replenish their seed stock. Quality seeds is also somewhat of an issue for hot pepper. Some seeds are imported, but most are produced at the village level by Master Farmers who then sell them to the community or trade them for labor. These Master Farmers need to improve upon their varieties and seed production techniques.
Reduced Bargaining Power for Small-Scale ProducersPerhaps in contrast to the popular conception, we found many farmers that were very savvy in terms of marketing their products and who had a good overall sense of the prices in different markets. However, most of these farmers are engaged in larger scale production of 30 bags or more of peppers for example per season. Smaller scale growers selling ten bags or less a season are at more of a disadvantage, since they tend to sell their peppers in small quantities by the bucket or by the half bag. As noted elsewhere in the study our survey of pricing information was not conclusive, but there seems to be consensus across market actors that these small scale producers earned the lowest prices for their produce.
For hot peppers in particular we identified the following additional constraints:
Market Saturation During Peak Production SeasonWith a return of peace to Liberia, many farmers are re-establishing their farms and they are eager to engage in cash crops. Given the recognized demand for pepper in Liberia as a high value crop that is consumed daily by most families, many farmers have moved into fresh pepper production. As a result the price for hot, fresh pepper (as for most other good products) has fallen, particularly at the height of the harvest, when prices can drop as low as 700 LD per bag in urban markets. Currently the majority of hot pepper production in Liberia is rain fed, so all of the pepper plants peak together Nevertheless vis-à-vis other crops, hot, fresh pepper still generates good returns. Fresh peppers are in demand in Liberia year round, given the desire by Liberian consumers to spice their foods and to make fresh pepper sauce. In Monrovia during the winter months fresh, hot pepper prices can rise up to 3,000 LD to 3,500 LD per 50 kg bag, and dried pepper substitutes from Guinea and Cote d’Ivoire can generate as much as 6,000 to 7,000 LD per bag.
Waste & Poor Processing Given the market saturation issues above, a related constraint is the waste of hot pepper during the peak production season. Communities and traders focus on the sale of fresh peppers, only opting to dry peppers when they start to spoil. As a result a large volume of peppers are wasted.
For peanuts we did not identify any constraints that were specific just to peanuts. Peanut production is just restarting in Liberia and the sector is so nascent that we were unable to have a great level of depth in out analysis. As noted above the chief constraint for peanuts currently is the lack of seeds.
Another more general constraint which applies to the CPBD program as a whole is the knowledge and abilities of the MC and AGRA staff. Both organizations have several experienced agronomists on staff. However, given the war and the lack of opportunities to interact with the broader agricultural community their technical skills could be upgraded. During
- 31 -
the assessment there were often disagreements among staff as to the optimal number of growing seasons for different types of seeds, cultivation conditions and growing seasons. This is a challenge for the program and a reflection of the greater need for technical upgrading of skills, knowledge and resources to support agricultural production in the country. In the short term staff could use an upgrade in their knowledge, perhaps via mentoring from an experienced agronomist. In the long term MC and other organizations may be better served to look at how to build the capacity of national extension networks. There will also be increasing opportunities to work with input suppliers who will have a financial incentive to provide some of this information and services.
CPBD Programming Parameters for Work in the Hot Pepper and Peanut SubsectorsIn considering potential opportunities and solutions for the CPBD program, we need to keep the program’s operating parameters in mind, so as to ensure that the solutions identified are practical. These parameters are as follows:
1. CPBD is ending in approximately one year.2. As of July 2006 there are approximately two planting seasons and two or more
harvesting periods left for both peanuts and pepper in the next year.3. CPBD is now working in 50 new communities, in addition to the 98 it worked in
previously. The plan is to expand into an additional 50 communities in the next year in order to reach the overall program target of 200 communities.
4. This is an ambitious expansion plan, based on operational progress to date.5. The program has $1,000 per agriculture community to invest.6. Staffing is tight across the program and will be reduced in the final year as program
funding winds down. This will constrict how often and for how long the program can work in and monitor the communities.
7. The program has the opportunities to pursue complementary funding from other sources, which could allow it to add new program components—perhaps based on constraints identified in the subsector analysis that could not be addressed in CPBD.
8. The entry of Mittal Steel and other investors in the country will provide new markets for the horticulture subsectors studied here as well as complementary subsectors.
Some of these parameters conflict with the underlying philosophy of market-development programs, namely the promotion of commercial solutions. Commercial solutions are generally based on fee-for-service arrangements where there is strong supply and demand and/or or material incentives. This is desirable, since upon a program’s completion there is a far greater probability of the solution continuing, since there are clear economic incentives. However, these types of solutions need time to take root, particularly in transition environments. Additionally CPBD does not have the full programming flexibility needed to promote all of the potential commercial solutions identified. One particularly challenging constraint is that in the prior four years of the program, the current CPBD communities have had to invest little to none of their own nonlabor-based resources in the program. As noted in parameter No. 5 CPBD made the investments required by the communities to move into new activities. Given the changing operating environment and the desire to move into longer term development, the recommendation is that where ever possible the program try to move into the direction of commercial solutions, and wherever possible look for funding sources in the future that will allow the flexibility needed.
- 32 -

Identification of Opportunities and SolutionsThese tables lay out potential opportunities and solutions for the constraints identified in the market assessments for hot pepper and peanuts. The opportunities and solutions identified are based on local conditions and the desire to move the CPBD program toward more commercial solutions.
TABLE 5: OPPORTUNITIES & SOLUTIONS IN HOT PEPPER
Constraints Opportunities SolutionsPests drastically reduce yield
Bring in horticulture expert from the FAO or OSU to study common local pests & diseases for pepper and other horticulture, and recommend appropriate pest management techniques5
Introduce identified pest management techniques via community agriculture trainings
Future Opportunity :Work with input suppliers to develop regional supply network of the identified pesticides, complemented by field trainings & radio shows on appropriate usage
Market saturation during peak season
Promote off season production, when prices increase 100% to 300%
Introduce communities to the potential in off-season production, and use CPBD grants for financing requirements
Assist communities to develop action plans & promote implementation of the plans via follow up visits throughout the year
Use community grants to establish irrigation service providers who rent out irrigation systems during the dry season
Future Opportunities:Facilitate access to irrigation through shared irrigation systems and/or water pumps partially financed by the communities
Further investigation on the potential to introduce low cost, drip irrigation technologies
Lack of certainty around land access
Promote land usage agreements with private landholders & rubber plantations
Speak with community leaders and promote their more active involvement in assisting community members to realize land use agreements with private landowners
Future OpportunityTrain community members to draft legally recognized usage agreements for land owners and small holders
This could be done on a fee for service basis, encouraging community members to specialize in this
Build demand for the service through a marketing campaign in the communities and among land owners, plantations, etc.
5 Mercy Corps has an agreement with Oregon State University, allowing the program to access agricultural experts from the University for voluntary consultancies. MC covers their travel and lodging costs.
- 33 -
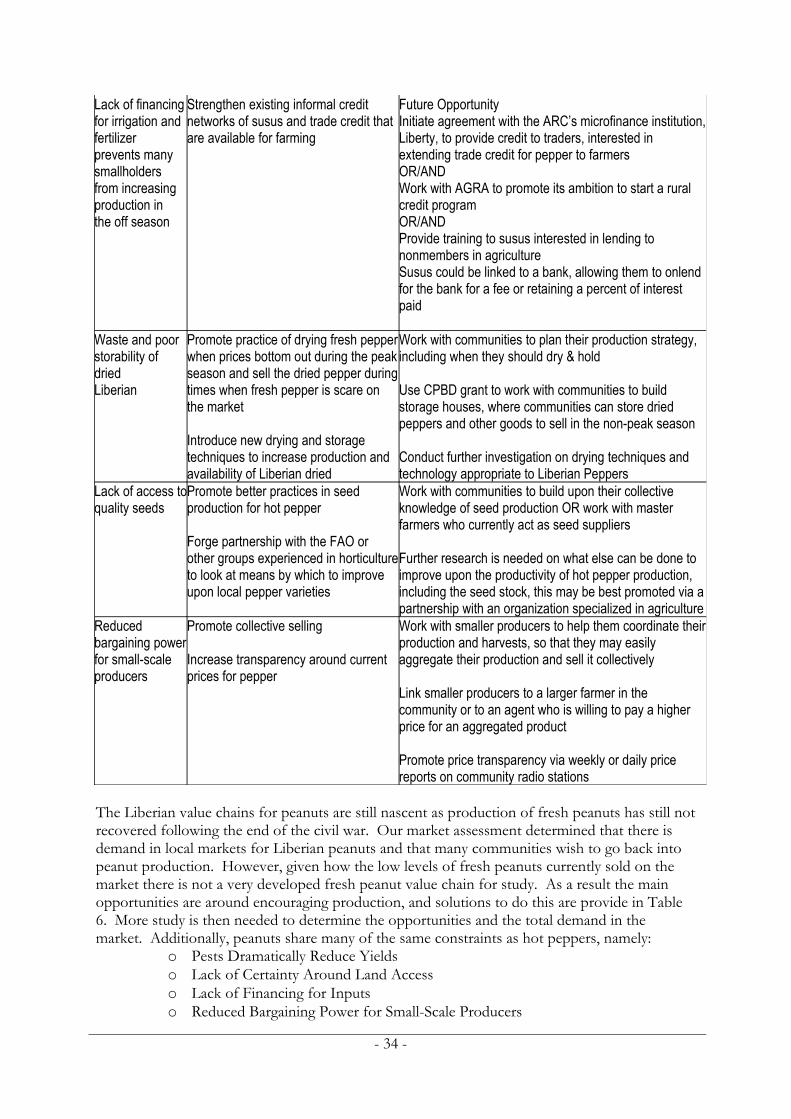
Lack of financing for irrigation and fertilizerprevents many smallholders from increasing production inthe off season
Strengthen existing informal credit networks of susus and trade credit that are available for farming
Future OpportunityInitiate agreement with the ARC’s microfinance institution, Liberty, to provide credit to traders, interested in extending trade credit for pepper to farmersOR/ANDWork with AGRA to promote its ambition to start a rural credit programOR/ANDProvide training to susus interested in lending to nonmembers in agricultureSusus could be linked to a bank, allowing them to onlend for the bank for a fee or retaining a percent of interest paid
Waste and poor storability of driedLiberian
Promote practice of drying fresh pepper when prices bottom out during the peak season and sell the dried pepper during times when fresh pepper is scare on the market
Introduce new drying and storage techniques to increase production and availability of Liberian dried
Work with communities to plan their production strategy, including when they should dry & hold
Use CPBD grant to work with communities to build storage houses, where communities can store dried peppers and other goods to sell in the non-peak season
Conduct further investigation on drying techniques and technology appropriate to Liberian Peppers
Lack of access to quality seeds
Promote better practices in seed production for hot pepper
Forge partnership with the FAO or other groups experienced in horticulture to look at means by which to improve upon local pepper varieties
Work with communities to build upon their collective knowledge of seed production OR work with master farmers who currently act as seed suppliers
Further research is needed on what else can be done to improve upon the productivity of hot pepper production, including the seed stock, this may be best promoted via a partnership with an organization specialized in agriculture
Reduced bargaining power for small-scale producers
Promote collective selling
Increase transparency around current prices for pepper
Work with smaller producers to help them coordinate their production and harvests, so that they may easily aggregate their production and sell it collectively
Link smaller producers to a larger farmer in the community or to an agent who is willing to pay a higher price for an aggregated product
Promote price transparency via weekly or daily price reports on community radio stations
The Liberian value chains for peanuts are still nascent as production of fresh peanuts has still not recovered following the end of the civil war. Our market assessment determined that there is demand in local markets for Liberian peanuts and that many communities wish to go back into peanut production. However, given how the low levels of fresh peanuts currently sold on the market there is not a very developed fresh peanut value chain for study. As a result the main opportunities are around encouraging production, and solutions to do this are provide in Table 6. More study is then needed to determine the opportunities and the total demand in the market. Additionally, peanuts share many of the same constraints as hot peppers, namely:
o Pests Dramatically Reduce Yieldso Lack of Certainty Around Land Accesso Lack of Financing for Inputso Reduced Bargaining Power for Small-Scale Producers
- 34 -

The solutions outlined for hot pepper in regards to these constraints are also applicable to peanuts.
TABLE 6: OPPORTUNITIES & SOLUTIONS IN PEANUTS
Constraints Opportunities Solutions
Unavailability ofseeds at the market or communitylevel
Communities can produce peanut seed which in high demand, while using some of the seed to increase theirpeanut production, providing two sources of income
Facilitate access to red peanut seeds from Guinea or Lofa to increase local production
Research whether local seed production or annual sourcing of seeds from an outside source is a better option in terms of seed productivity. If local seed production is appropriate there is the potential to use the CPBD grant to assist communities in establishing peanut seed banks
Future OpportunityAssess demand for and profitability of peanut seed production and marketing vs. fresh vs. roasted red peanuts
Assist communities to develop packing and organizedselling of seeds in local markets
Hot Pepper: Program StrategyIn hot pepper the CPBD strategy is to work with communities on off-season production of fresh peppers and to assist communities in drying hot peppers during the peak season for sale in the off season. This is based on the market assessment which found that in Liberia in the peak season, there is an oversupply of fresh pepper versus demand causing prices to drop. As illustrated in Appendix 7, production and sale of fresh pepper in the peak season results in a net loss to a small scale farmer when labor costs are included, where as nonpeak production generates a 56% ROI and $56. This figure improves when labor costs are not included to a net income of $297 and a ROI of 250%. To realize this strategy the CPBD program and its partners will need to hold discussions with the communities. This will provide the program the opportunity to share the results of the market research with the communities and to solicit their feedback. The program can then work with those communities interested in the strategy to plan a seasonal activity calendar, with CPBD support and community activities coinciding with the calendar. July and August are an ideal time to hold these discussions and to assist communities in developing action plans as during the rainy season farmers are less active in the fields. Figure 4 provides an illustration of the national supply and price trends for hot pepper and indicates where are the opportunities for nonpeak production and sale of dried peppers. Currently there are two periods when pepper prices spike: the dry season in January through early March and the rainy season between late July through early October. More work is needed with the CPBD program staff to determine the seasonal calendars for these two seasons, based on the county and soil conditions. Table 5 provides some approximations developed on the last day of the consultancy for the first period. Table 6 outlines the traditional seasonal calendar that most communities currently follow, which would provide for drying excess production in May, June and July. The activity planner developed by Mary Morgan for cow peas and re-attached here in Appendix 7 is a good resource to start this process, and could be useful with some adaptation. Additionally the consultant will provide a series of workbooks developed by the FAO on
- 35 -

assisting farmers with farm management that could be adapted as another resource, see Appendix 8 for the resource titles.
TABLE 5: NON-PEAK/SEMI-LOWLAND PLANTING CALENDAR – PEPPER
Activities TimeframeSite Selection Jul-AugNursery Preparation Aug-SeptLand Clearing/Brushing Aug-SeptLand Preparation Sept-OctPlanting Oct-NovMaintenance Nov-MayHarvesting/Processing Jan-MarMarketing All year
TABLE 6: PEAK SEASON UPLAND PLANTING CALENDAR – PEPPER
Activities TimeframeNursery Preparation FebruaryLand Preparation MarchTransplanting AprilHarvesting for Fresh May-early July
Late October-December
Implementation of some of the other potential activities identified in the section on opportunities and solutions is dependent on program capacity and resources. The most pressing challenge of pest management should be addressed as soon as possible.
In using the grant funds set aside for the program, the CBPD staff and partners should also take a long term view, anticipating all of the potential activities over the course of the year and the two potential production seasons.
Peanuts: Program StrategyIn peanuts, the CPBD program strategy is to assist communities that wish to engage in peanuts to increase their production. As indicated in the subsector analysis, the fresh peanut subsector is relatively nascent in Liberia currently, since the bulk of production ceased during the civil war. Initially the program needs to identify sources of quality red seeds and to determine whether communities can then reproduce the seeds or if it is more efficient in terms of crop productivity to produce new seeds each season. If seed replication is possible at the community level then there may be opportunities at the community level to engage in the production and marketing of peanut seeds as well as the fresh peanuts. Discussions with the FAO and the Ministry of Agriculture should help to determine this. Similar to the implementation planning for hot peppers, the CPBD staff and partners should discuss the market research findings with those communities currently working with peanuts and in new communities who indicate an interest in peanut production. If it is determined that peanut seeds can not be replicated at the community level then the program needs to work with communities to identify savings or credit mechanisms that will allow them to produce seeds with each new season. If seed replication is possible then models for seed banks and marketing can be explored.
Similar with hot pepper CPBD should engage the communities in activity planning for whatever activities are identified for peanuts.
- 36 -

Cow Peas: Program StrategyAs discussed in the cow peas lessons learned there were some challenges implementing the strategy developed by Mary Morgan, the CPBD staff and partners. Farmers that engaged in cow peas tended to do so on an individual rather than a group basis and this extended into their marketing strategies. Additionally, the communities need to be more active in farm management planning both for production and marketing, as well as related constraints that may arise, such as pest management.
In revisiting the cow peas strategy and action planning two factors should be considered. First the market for cow peas and the level of cow pea production in the communities. Much of the demand for cow peas came from IDPs from the North of the country, who were living in and around Monrovia. With the recent resettlements these IDPs have gone back to Lofa and other counties and as a result demand patterns in the markets around Monrovia may have shifted. This may be quickly determined via interviews with some of the larger traders in cow peas at Red Light. Second, it would be worthwhile to examine how many communities opted to engage in commercial production of cow peas and are succeeding. The scale in terms of numbers of communities working in the subsector will help to determine the most appropriate actions.
Initially, the CPBD team should revisit the seasonal calendar for cow peas, since this will indicate when the team needs to engage in different activities. The other finding from this assessment is that more time needs to be invested in assisting communities to market their cow peas. A brainstorming with the CPBD team and partners to strengthen the marketing aspect came up with the following ideas:
Increase market literacy through community field trips to urban markets (where cowpeas are sold)
Encourage community to re-visit cooperation in selling Link communities with traders to discuss selling
ConclusionThe peace and new government in Liberia bring opportunities for Liberians to start taking a longer term view towards their livelihoods. This has awakened a desire in the CPBD communities to focus more and more on increasing their incomes through agriculture and other economic activities. In its support of its partner communities, Mercy Corps and AGRA opted to use a market development approach, so as to assist communities in identifying profitable opportunities to engage in high value markets. The hot pepper subsector is particularly promising since it offers potential returns of up to 300%. Hot pepper is in demand year round and most of the CPBD communities already have some engagement in the sector, which will enable the program to build upon this interest. The greatest opportunities are in off-season production when prices are at the highest, as well as selling dry peppers in this period. Assisting communities to develop their capacity and the needed resources to follow a dry and hold strategy during the peak season could significantly increase their incomes. Additional research on the peanut subsectors indicates that at least for the counties in which CPBD currently operates, namely Monterrado, Grand Basso and Margibi, peanuts is not a very promising crop in terms of profitability. Rather than expending considerable resources on peanut production, the program would be better served in looking at other crops and activities. However, given the interest in peanuts some recommendations are made here in the event activities in the subsector are perused.
- 37 -

In reflecting on the initiative last year for the CPBD program to engage in the cow pea subsector, the greatest challenges were consistency in communicating with the communities and in development of the resources needed to assist AGRA in implementing the strategy. This year these issues need to be addressed, and particular focus is needed to develop resources such as activity plans and meeting templates that farmers can use to organize their activities. Success in farm planning will assist communities to succeed in cow peas and any other crops they may choose to engage in.
Looking beyond CPBD to the next phase of programming there are opportunities to work with communities in other subsectors such as rubber and palm oil. Liberia already exports rubber and there is great potential to revive the historical export trade in palm oil. The low purchasing power among consumers in Liberia limits the opportunities in the domestic economy, so ultimately the greatest opportunities will lie in exports. Many of the CPBD communities are already planning or engaging in palm oil and rubber, through palm seed harvesting and processing, cultivating rubber trees on community land etc. The capacity planning in farm management and engagements in markets at the community level via CPBD this year will build communities’ capacity to engage in these growth opportunities for the country. Given the high levels of fragmentation and market-based governance in the country’s agricultural sectors, a value chain approach could be very useful in promoting opportunities for greater coordination and collaboration. This will also promote peace dividends in the country via economic ties and opportunities for inclusive growth.
- 38 -
Appendix 1: Scope of Work for BDS Consultant
IntroductionFor the past 3 years, the CPBD program has worked with community groups in Liberia to develop economic projects. In 2005 Mercy Corps and AED conducted a market analysis of the cowpea sector which showed great opportunity for income-generation: farmers’ returns on a 50 kg bag of cowpeas could be 10 times more than what they currently get in the local market for a 50 kg bag of cassava, if they can grow cowpeas as a cash crop.
This year, CPBD will investigate another sector supply chain with the potential to increase farmer income. Developing a second cash crop or market will increase the options available to communities, farmers’ economic stability, and Liberia’s overall food security. Potential areas of investigation may include peanuts, non-timber forest products, citrus fruits, and handicrafts. CPBD will use a sub-sector approach, incorporating community mobilization through farmers groups and linking farmers to input and output markets while providing on-farm technical assistance with trained community people.
Objectivesa. A quick review of progress on the cowpea sector with recommendations for improvement
and next steps. (1 day, field visits if possible and interviews with key participants)b. A review of the BDS strategy which was introduced in 2005 through market data
collection, analysis, interpretation and results application training course with Mercy Corps and LNGO partners’ staff. Review what was done, what is remembered, and incorporate the answers to 5 questions into new work plan for second market assessment.
c. A training in market assessment to a mixed group of MC staff and LNGO partners (some of whom should have attended the May 2005 training) and preparation for the second market assessment to be conducted via this trip (3-4 days)
d. A second market assessment of another promising sector, evaluating both demand and supply side constraints for the sector, and opportunities to address these constraints (at least 7 days for interviews in the field, if we can have 3 teams)
e. A recommended second sector program strategy and implementation play developed with MC and LNGO staff (1-2 days at the end of the trip to review findings and brainstorm on program design).
Activitiesa. Conduct 2 day workshop at beginning of consultancy to kick off new activities, review
previous activities and training from 2005 and design strategy for 2006.b. Conduct a 3-day training course in market assessment and value chain analysis and
design of second market assessment.c. Increase AGRHA ability to serve as local BDS providers to smallholder producers and
entrepreneurs. Assess staff and partners BDS skills and performance, including client service delivery on core BDS skills, data collection, analysis, interpretation and application skills. Further develop skills in market research and client demand by working closely with local local staff and partners on assessment and providing additional training, as needed.
d. Prepare Step-By-Step Guide for the development of a new sub-sector for use by the BDS Facilitators and Agriculture Extension Officers of AGRHA, via brainstorming sessions the last two days in the field.
- 39 -

Deliverablesa. A comprehensive reportb. A set of recommendations for a new sub-sector in Liberia.
Assumptions:To ensure the best use of field time, the CPBD staff will collect as available all market data on the potential targeted sectors prior to the consultant’s arrival. This may include doing some primary research and interviews with key informants to gather information to inform the assessment. The consultant will provide CPBD will some guidance on the types of information that they should collect.
The group participating in the analysis will include several individuals from the prior May 2005 training. These individuals will be asked to fill out a brief five question survey prior to the second training to help improve upon the first.
CPBD staff will provide electronic notes of interviews and other information they help to gather with the Consultant every two to three days. The note taking can be shared, but everyone will need to take notes and provide electronic versions—particularly given the amount of information that will be collected in a short time.
CPBD and key LNGO staff will reserve two days at the end of the consultancy for a brainstorming session on program design.
Timeline3 Weeks (19 working days, including 4 days for preparation and report writing, excluding Saturdays and Sundays) in May - June, 2006.
- 40 -

Appendix 2: Travel and Meeting Itinerary
Saturday, May 13th –Sunday, May 14th Travel from Washington, DC to Monrovia via Brussels
Monday, May 15th
Unity Day in LiberiaMeet with Tricia Matthews, Deputy Country Director & Tom Ewert, Country Director to discuss trip objectives and logisticsMeet with Bakayoko Amadou, General Program Officer, Mercy Corps
Tuesday, May 16th
Travel to Buchanan, Grand Basso CountyAttend coordination meeting for Mercy Corps (MC) & its LNGO partners Action for Greater Harvest (AGRA) and National Adult Education and Literacy (NAEL)Hold half day workshop for MC & LNGO partners on:
Objectives for the consultancy Performance of the Cow Pea project to date Potential sectors for a second market assessment
Wednesday, May 17th
Work with MC, AGRA, & NAEL to conduct analysis of potential sectors for a market assessmentRank potential sectors, resulting in the selection of peanuts & peppers for the market researchReturn to Monrovia
Thursday, May 18th
Preparation for Training and Market ResearchVisit to the Food and Agriculture Organization (FAO)
Friday, May 19th
Travel to BuchananHold training for market research team, comprising MC, NAEL and AGRA staff on concepts in:
Entrepreneurship Market Development
Conduct first mapping of peanuts and hot pepper subsectorsDesign research plan
Saturday, May 20th
Research team travels to St. John’s Market, Frank Diggs Town, Grand Basso County Test questionnaires for market research interviewing traders, transformers, retailers and farmersDiscuss day’s findings with research team
Sunday, May 21st
Design & print questionnaires for market research
Monday, May 22nd
Finalize logistics for the researchResearch Team travels to Wrakleen Town, Grand Basso CountyInterview community on activities in peanut and pepper production and marketingConduct community mapping of the village’s economic activitiesInterview farmers in second community
Tuesday, May 23rd
Research team conducts interviews in Buchanan town
- 41 -
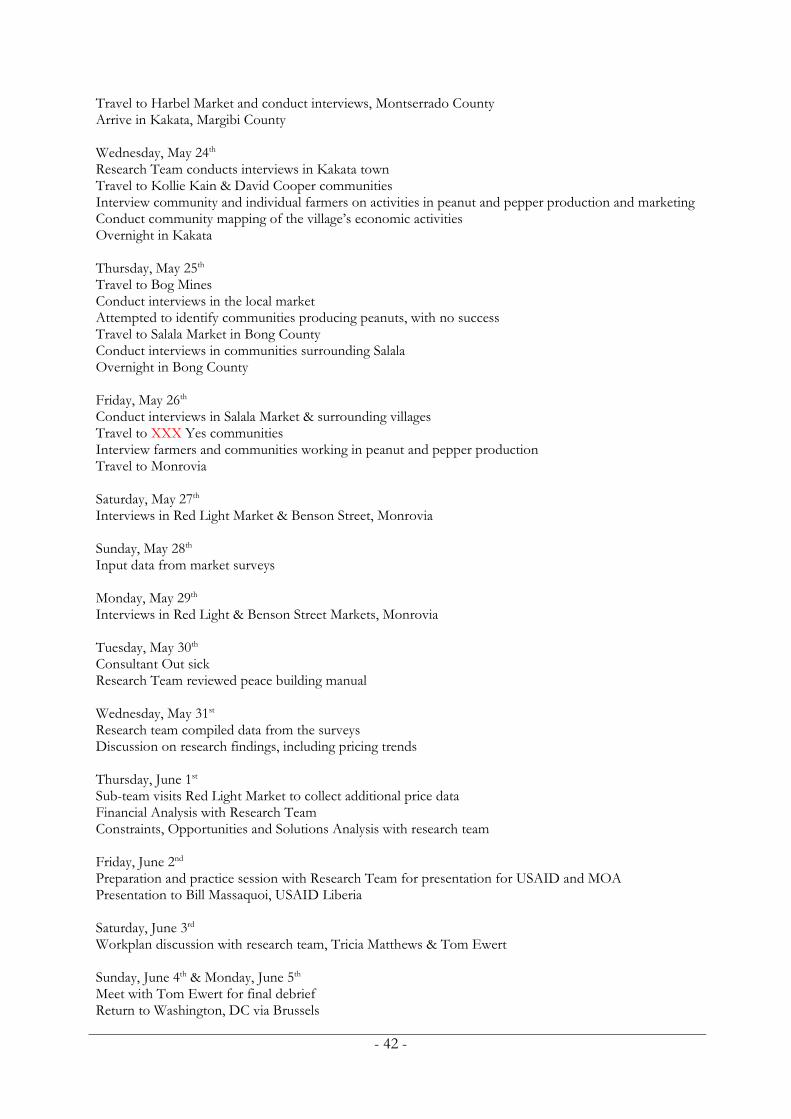
Travel to Harbel Market and conduct interviews, Montserrado CountyArrive in Kakata, Margibi County
Wednesday, May 24th
Research Team conducts interviews in Kakata town Travel to Kollie Kain & David Cooper communities Interview community and individual farmers on activities in peanut and pepper production and marketingConduct community mapping of the village’s economic activitiesOvernight in Kakata
Thursday, May 25th
Travel to Bog MinesConduct interviews in the local marketAttempted to identify communities producing peanuts, with no successTravel to Salala Market in Bong CountyConduct interviews in communities surrounding SalalaOvernight in Bong County
Friday, May 26th
Conduct interviews in Salala Market & surrounding villagesTravel to XXX Yes communitiesInterview farmers and communities working in peanut and pepper productionTravel to Monrovia
Saturday, May 27th
Interviews in Red Light Market & Benson Street, Monrovia
Sunday, May 28th
Input data from market surveys
Monday, May 29th
Interviews in Red Light & Benson Street Markets, Monrovia
Tuesday, May 30th
Consultant Out sickResearch Team reviewed peace building manual
Wednesday, May 31st
Research team compiled data from the surveysDiscussion on research findings, including pricing trends
Thursday, June 1st
Sub-team visits Red Light Market to collect additional price dataFinancial Analysis with Research TeamConstraints, Opportunities and Solutions Analysis with research team
Friday, June 2nd
Preparation and practice session with Research Team for presentation for USAID and MOAPresentation to Bill Massaquoi, USAID Liberia
Saturday, June 3rd
Workplan discussion with research team, Tricia Matthews & Tom Ewert
Sunday, June 4th & Monday, June 5th
Meet with Tom Ewert for final debriefReturn to Washington, DC via Brussels
- 42 -

Appendix 3: Research Team & Workshop Participants
SECTOR SELECTION WORKSHOP PARTICIPANTS
Participant name Institution PositionDee-Maxwell S. Kamayan, Sr. AGHA Executive DirectorRev. Benjamin B.M. Bangura PNO AEDOJerry S. Fumbah MC Project OfficerCecelia Nimely AGRA BSDOThomas Marwolo NAEL NAA. Faiya Leebor AGRA BSDOD. Solomon Harris AGRA NAZowolo Seepo AGRA Project OfficerJ. Vaari Kiazolu MC Office Manager, KakataTawah Blamal MC Office Manager, BuchananJ. Faiya Tandanpolie AGRA NATricia Matthews MC Deputy Director, LiberiaBakayoko Amadou MC General Program OfficerParker XXX MC Project Officer
RESEARCH TEAM
Participant name InstitutionJerry S. Fumbah MCCecelia Nimely AGRAThomas Marwolo NAELA. Faiya Leebor AGRAParker XXX MCJ. Faiya Tandanpolie AGRABakayoko Amadou MC
- 43 -

Appendix 4: Information from Sector Ranking Exercise
These presentations were prepared by AGRA and CPBD staffers, providing their thoughts on the promise of different sectors based on six criteria, including the potential returns on investment and capital requirements. Much of the comments here are somewhat subjective, since we could not field test them so they should be viewed as such.
PRESENTATION FOR PEPPER, BITTERBALL & CORNCriteria Pepper Bitterball CornTargeted Pop & Capacity 10 farm family in a given
community10 farm family in a given community
10 farm family in a given community
Potential for Value Add Fresh, dried stored, added to sauce, pounded into powder, prepared as a sauce
Cooked as sauce, dried Fresh, roasted, dried/shelled, boiled, pounded into powder, corn meal
Existing Demand & Growth Potential
High in demand all year around. 90% of homes consume
High consumption Very high
Potential to Increase Income
Is high especially in the dry season
Is high Is high but seasonal
Financial Feasibility Relatively high start up costs due to seeds, but has the highest ROI of all the sectors reviewed
NA NA
Time till Impact Crop from nursery to harvest is 90-110 days Two harvest seasons: Sept-Dec., March-May
Also a short growing cycle of three months or less.
NA
PRESENTATION FOR CASSAVA, PEANUTS & PLANTAINSCriteria Cassava Peanuts PlantainTargeted Pop & Capacity 20 farmers per village.
Can form a cooperative if they are strong.
Ditto Ditto
Potential for Value Add Raw, Fufu, Garie, Jeeper, Starch
Fresh peanuts, patched, peanut butter, weaning good. Candy
Cooked, fried rice bread
Existing Demand & Growth Potential
There is high existing demand & growth potential.
Ditto Ditto
Potential to Increase Income
There is high potential because of access to planting materials throughout the year
Ditto Very high potential because new sucker emerges every favorable season
Financial Feasibility Average capital requirement vis-à-vis the others. ROI of 158%
There was considerable debate amongst the group as to the returns on peanuts. At 100% not an impressive ROI and income of only $55, but start up costs were also low.
Average capital requirement vis-à-vis the others. One of the lower ROIs.
Time till Impact 8 months 4 months 10 months
- 44 -

PRESENTATION FOR GOATSCriteria GoatsTargeted Pop & Capacity Both rural and urban community dwellers have the capacity to buy most especially in the
cities. (e.g. Monrovia). Production communities have always the interest in this sector.Potential for Value Add Easily maintained, clean for marketing. Can be sold bodily in carcassExisting Demand & Growth Potential
Can be consumed/sold during festivals. High demand. High rate of multiplication. Low cost of maintenance, feeding and medication
Potential to Increase Income
High cost (income) A lb of goat meat cost LD 180 as compared to cow meat LD 125 easily marketed, with high demand.
Financial Feasibility Depending on the location. In Grand Bassa you can get a pair of mature goast for US 100. Production requires medications shelter, supplementary feeding.
Time till Impact More than one year before it the enterprise breaks even. Calculated ROI for one and two years production to look at this
The figures for this table were calculated by the different sector working groups for their presentations. All the groups used the same parameters, namely 0.3 Ha of land and one season of production. The calculations also included the costs of tools required. All groups in working in crops included labor costs, while the groups working with livestock did not since it was assumed that the animals would be allowed to roam, rather than taken to grazing land.
FINANCIAL FEASIBILITY ANALYSISNet Income Total Costs Return on Investment
Cassava $270 $132 159%Peanuts $55 $52.67 104%Plantains $136 $131.42 103.8%Hot Pepper $827 $213 388%Bitter Ball NA NA NACorn NA NA NAGoat Year 1 -$328 $458 -70.25%Goat Year 2 $290 $317 91.64%Sheep NA NA NA
- 45 -

Appendix 5: Research Plans
RESEARCH PLAN FOR HOT PEPPER IN GRAND BASSO, BONG, MONTSERRADO & MARGIBI COUNTIES, LIBERIA
Hypothesis: Pepper production, processing, and marketing offers an opportunity for CPBD communities to increase their incomes, by engaging in a high value crop for the Liberian market.6 Following the Liberian Civil War, cultivation of pepper is increasing annually and during the primary harvesting season Liberian markets are sometimes saturated with fresh pepper. To be successful in the fresh and dried value chains for hot pepper, communities will need to enter into off season production as well as looking at means by which they may preserve excess production during the peak season through processing and/or storage for sale when there is scarcity.
Goal: To increase CPBD communities’ engagement in value chains for hot pepper, through improved production and processing and the development of a marketing plan.
Choice of Hot Pepper Value Chains: Highest ROI among the potential sectors examined, at 388% per production cycle7
Short production cycle of 3 months till first yield Staple of the Liberian diet and it is in demand year round Liberians will pay a premium for fresh hot pepper in the off season
Objectives of the Market Research:• To map the dynamics of the relevant pepper value chains—likely fresh and dried hot
peppers, sweet or garden peppers and cayenne, fresh and dried—for markets in Monrovia, Buchanan and greater Liberia
• To identify other actors, particularly input suppliers along the relevant value chains that can support off-season production, as well marketing, storage and other productivity improvements
• To identify current and potential markets for residents’ products• To assess the investments needed to promote residents participation in the industry and
potential sources and means of financing
Activities: • Map an estimate of the current level of pepper production and market in a sample of
CPBD communities and identify potential clusters of communities with which to collaborate on a project in hot pepper value chains
• Gather relevant local agriculture and business statistics• Contact the Ministry of Agriculture and other relevant institutions to identify their
current initiatives related to hot pepper and horticulture• Identify traders, marketers, input suppliers, wholesalers, etc. to outline the supply chains
and economics of the relevant pepper value chains• Identify high potential market channels and linkages for CPBD communities
6 Per a discussion with an official at the FAO, prior to the Liberian Civil War there may have been exports of hot fresh and dried pepper to neighboring African countries.7 Need to double check this calculation and then cite in plan
- 46 -

• Calculate financing requirements and potential profitability of different types of operations related to pepper value chains
• Estimate based on seasonality and program startup the length of time before residents may start to see results
• Research the efforts of other organizations working in pepper and/or horticulture in Liberia
Interview ContactsSee pepper subsector map.
Potential Constraints and OpportunitiesGiven that the CPBD partners and Mercy Corps staff already do work in pepper and related sectors, we hypothesize that the market research will identify the following constraints. Accordingly, the research will delve deeper on these constraints and potential opportunities, for which the market research will attempt to identify sustainable solutions.
Constraints OpportunitiesMarket Saturation in the High Season Means by which to continue
cultivation during the rainy season Irrigation in the Dry Season
Lack of storage Storage facilities for fresh peppers Better storage during transport
Traditional & inefficient processing & drying
Identify alternative methods and potentially technology by which to
o Reduce waste during drying and/or smoking
o Increase storability of the dried product
o Introduce new pepper-based products, based on other processing methods
Inefficient or Nonexistent Distribution Networks outside of Urban Areas
None identified initially
Production Introduction of better seeds Training in seed selection
techniques Training in Modern Production
Processes
Lack of trust between different actors in the chain
None identified initially
- 47 -

Appendix 6: Participatory Economic & Marketing Appraisals with Communities
KOLLLIE KAIN, MARGIBI COUNTY
ENTERPRISE RANKING MODULE
No. ProductRanking in Order of Importance
Importance to Village
Brings the Most Money
Easy to Sell Reason
1 Peanuts 1 1 1 Fast to produce Provide more revenue High demand Pay school fees
2 Pineapple 93 Pepper 5 2 2 High demand
Easy to sell Use in daily diet
4 Cassava 2 Staple crop5 Bitterball 6 3 Jointly demanded with pepper
Easy to sell High demand
6 Rice 3 Staple crop for consumption7 Plantain 48 Corn 7 Easy to grow on any type of
land Use for food & cash
9 Tapping Most men engage in it Brings more money & fast
10 Kerosene11 Okro12 Fishing13 Palm Oil14 Sell fish 15 Potato 8
COMMENTS: 1. Discussions were likely biased, since the community knew we were studying peppers and peanuts. This
is evidenced by the ranking of peanuts as the most important crop to community, although they do not grow it currently and historically Margibi is not known for peanut cultivation.
2. The community doesn’t grow peanuts now because they don’t have money to buy seeds and there is scarcity on the market, but used to grow before the war. Based on that they were able to tell which crops would bring the most money into the community. Now almost all the young men are tapping to get money, so it brings the most money into the community.
3. Usually buy peanuts for household consumption. Because the production of pepper was not large and most of them were not producing for the market, it was difficult for them to determine their total sales and their profit. They stated financial problem being the factor hindering their capacity to produce for the market, but the willingness is always there. Also to get the community organized to undertake mass production was another factor preventing them to engage in that venture. Only three (3) men are producing the pepper for the market and they were not at the PRA meeting. The seeds were easy to get, and mostly they could be obtain in the community with the local farmers without disbursing any money.
4. Had a demo plot of peanuts, but it was overtaken by pests.
- 48 -

5. Almost everybody is growing pepper but at a smaller scale for local sale and consumption.6. Only a few grow pepper in large scale, its hardier than peanuts.7. Other crops are mostly produce for local consumption and from time to time they sell some to get some
cash.
PRICE DIFFERENCE BY SEASON AND LOCATION (Liberty)No. Item Unit Price in Village Price Outside village
Non-Peak Peak Harvest Peak Location1 Peanuts Bag 1,750 2,500 Kakata
2 Pepper Bag 300 – 900 Averages 800
1,200 1,500 2,500-3000 KakataMonrovia
COMMENTS:1. Many prefer to sell at the village level, since risk if you go to the market that you will not sell your goods.2. Most of the prices are for outside markets in St Johns. Kakata or Monrovia since there is not an active
market at the community level.
- 49 -

DAVID COOPER
ENTERPRISE RANKING MODULE
No. ProductRanking in Order of Importance
Importance to Village
Brings the Most Money
Easy to Sell Reason
1 Cassava 1 5 4 Takes a longer period to grow Easily process in gari, fufu, deepor
2 Peanuts 10 4 2 Fast to harvest compare to cassava Generates more money Scarcity of good seeds Produce twice a year Cro cro type only available
3 Pepper 9 3 34 Pineapple 115 Plantain6 Bitterball 3 2 1 Fast to harvest
More people growing it 1st in bringing money for women
7 Construction 78 Midwives 89 Okra10 Fishing 511 Tapping 2 1 All men involved in tapping
Fast cash12 Palm oil 413 Rice 614 Corn
COMMENTS: 1. Most if not all the women in that community are engaged in garden production, since its easy to do and
garden crops bring more money. 2. Bitter ball was first for them in terms of bringing the mof money because it is easy and fast to harvest and
sell. They can harvest many times in a season compare to pepper or other crops.3. Men classified tapping as first activity bringing the most money because what they grow takes a longer
period before they can harvest (rice, cassava, etc).4. The peanuts were classified in 10th position in terms of importance for the village because of scarcity of
seeds and also unavailability of quality seeds. Sometimes when they plant the seeds bought from at the market, the seeds do not succeed. Less people were involved in peanut production for that reason, and those growing peanuts were doing so on a small scale for their own consumption or retailing them in pile of LD 5 of tied them in plastic bag for LD 5.
5. The main problem with pepper is the prevalence of pests and insects, which destroy the plants. Sometimes the production goes down, but few use insecticides or chemicals due to its costs and limited availability.
- 50 -

PRICE DIFFERENCE BY SEASON & LOCATION (Liberty)
No. Item Marketed
UnitPrice In Village Price Outside
village
Harvest Peak Harvest Peak Location
1 Bitter ball Bucket 75 150 75 75
Pile 5 5 5 5
Kakata
2 Pepper Bag 900-1,000 1,000-1,200 1,200-1,500 1,500-1,400
Pile 5
3 Peanuts Bag 1,000-1,500 3,000 1,500 4,000-5,000
Pile 5 5 5 5
COMMENTS:In shortage period, the pile reduces in size but the price remains always at LD 5.Most at time people come to buy the pepper and peanuts from the community because the community members seek to reduce their transportation costs.
GENDER ROLES IN MARKETING
No. ProductWho sells the product?
Who controls the earnings from sales?
Women Men Women Men1 Bitter ball X X2 Pepper X X3 Peanuts X X4 Cassava X X
COMMENTS:1. Women are primarily in charge of selling the crops because they have more contact (relationships) with
people operating in the market, and they are more skilled in trading than the men.2. Women control the business income, since they are in charge of the family daily expenses, and they know
how to manage it by investing in a susu to earn more profits.3. The spending of the revenue varies according to each family in the community, but usually the husband
receives some “something for his pocket” while the woman has total control over the overall expenditures of the family. Additionally many men have more than one wife, so often the man’s income is not sufficient to meet the family’s needs.
4. They don’t save money in banks or with business people in town for lack of confidence. Save money always in the community by using it in susu. They mostly registering all the family members to make sure they get more profit to solve their problems and make their life.
- 51 -

WRAKLEENENTERPRISE RANKING MODULE
No. ProductRanking in Order of Importance
Importance to Village
Brings the Most Money
Easy to Sell Reason
1 Pepper 5 3 Fast money to buy school fees, hospital supplies
2 Cassava 2 2 Seedlings always available, & seedlings can be used for up to three years.
3 Bitterball Hard to sell since too much available.
Wastes since there is not way to preserve it
Women’s crop.4 Peanuts 3 4 Fast and more money to pay
school fees5 Plantain 6 5 Always available for food in
hunger period6 Rice 4 Stable food sell on needs basis
when no other options available7 Palm Oil 1 1 Always available8 Beans9 Tapping Very few people in the village
have tapping jobs, since only one person is needed for every 50 to 100 trees.
Men in the village are planting rubber trees for future income.
10 Weaving11 Fishing12 Cocoa13 Hunting14 Poultry15 Blacksmith 7 6 Repair the tools for farming
Comments1. Community made over USD$ 3,000 last year on 30 drums of palm oil.2. Many prefer to sell at the village level, since risk if you go to the market that you will not sell your goods.3. Limited market for cow peas at St. Johns since people do not usually eat it here.4. Insects are a challenge across all the horticulture crops. 5. This year have a demo plot of peanuts, but it has been overtaken by pests. Peppers are more hardy and
have fewer problems.
- 52 -

PRICE DIFFERENCE BY SEASON & LOCATION (Liberty)
No. Item Marketed
UnitPrice In Village Price Outside
village
Harvest Peak Harvest Peak Location
1 Bitter ball Bucket 75 150 75 75
Pile 5 5 5 5
Kakata
2 Pepper Bag 900-1,000 1,000-1,200 1,200-1,500 1,500-1,400
Pile 5
3 Peanuts Bag 1,000-1,500 3,000 1,500 4,000-5,000
Pile 5 5 5 5
ENTERPRISE TREND MODULE
No. Production Price Production Sales Profits Reason for change1 Palm Oil Last year
100-125 now 75-80
Up to 7 bags ? ? More production with the returness
2 Cassava Up last year 50-80 this yr ?150
No seed rice two years ago. Last year shifted so more planint cassava now
3 Pepper Down last yr. 1200-1500 up
750-13004 Peanuts Down last
year up this year
Unavailability of seeds last yr. Crocro doesn’t produce much
5 Bitterball Last year 400-600 down to 300-350 this year
- 53 -

Appendix 7: Hot Pepper & Peanut Feasibility, Production Methods
Hot Pepper, Modern Production, One Season ($USD)
Land Size 0.3 HaNo. of workers 31 $USD 56 LDNo. of plants, with 10 % loss 2700 Total Productive months (1) 4 monthsTotal No. of Harvests 8Total Peppers Produced, kg (2) 1080Total Bags, 62 kg 17.3
One Time Costs/CapitalTools (3) Units Price Total Cost
Cutlass, Small 2.00 2.95 5.89Hoe, Regular 1.00 5.98 5.98Hoe, Scratching 1.00 2.68 2.68Watering Can, Small 1.00 10.00 10.00Sharpening File 1.00 3.50 3.50Shovel 1.00 10.00 10.00Twine 2.00 1.50 3.00Tapeline 1.00 7.50 7.50Rake 1.00 3.50 3.50
Total One Time Costs 52.05
Recurring Costs/Working CapitalUnits Price Total Cost
Seeds, 1 Jumping Deer Bottle (4) 1.00 26.79 26.79Insecticides, ml 0.2 44.64 8.93Fertilizer, kg 0.52 60.00 31.20
Total Recurring Costs 66.91
Labor CostsUnits Price Total Cost
Brushing 10.00 1.34 13.39Clearing 25 1.34 33.48Land Preparation 25 1.34 33.48Planting 25 1.34 33.48Field Maintenance 25 1.34 33.48Total Labor Costs 147.32
Sales, Two Scenarios, Peak and Non-PeakUnits Price Total Sales
Non-Peak 17.3 24.11 416.57Peak 17.3 12.50 216.00
- 54 -

Net Income & Return On Investment
Net Income ROINon Peak 150.28 56.44%Non Peak, without labor 297.60 250.15%Peak -50.29 -18.89%Peak, without labor 97.03 81.56%
Two Year NPV (5)Discount rate: 35% (5)
Season 1 Season 2 Season 3 Season 4Cash Inflows, without tools 202.34 1.76 202.34 1.76Cash Inflows, without tools & labor 349.66 97.03 349.66 97.03
NPV $211.12 NPV, without labor $523.92
Notes:(1) Useful life of a pepper plant can be extended from 6 months up to 2 years.Here using a conservative 4 month estimate, since many farmers only harvestfor one season.(2) Further field research is needed on the average yield for a pepper plant. (3) Most farmers, including those growing on a larger scale, undertake cultivation with far fewer tools than included here.(4) Traditional units seeds supplied by a local farmer used here. 85 grams of seed neededfor .3 Ha of land.(5) Here one year's cash flows are calculated as Peak plus Non-Peak Season. No depreciation of equipment calculated, since given low quality assumption of two year life.(6) Unable to check with microcredit institutions on current rates of interest, so given Inflation rate of 15% to 20% and high operational costs, estimate cost of capital at 35%.
- 55 -
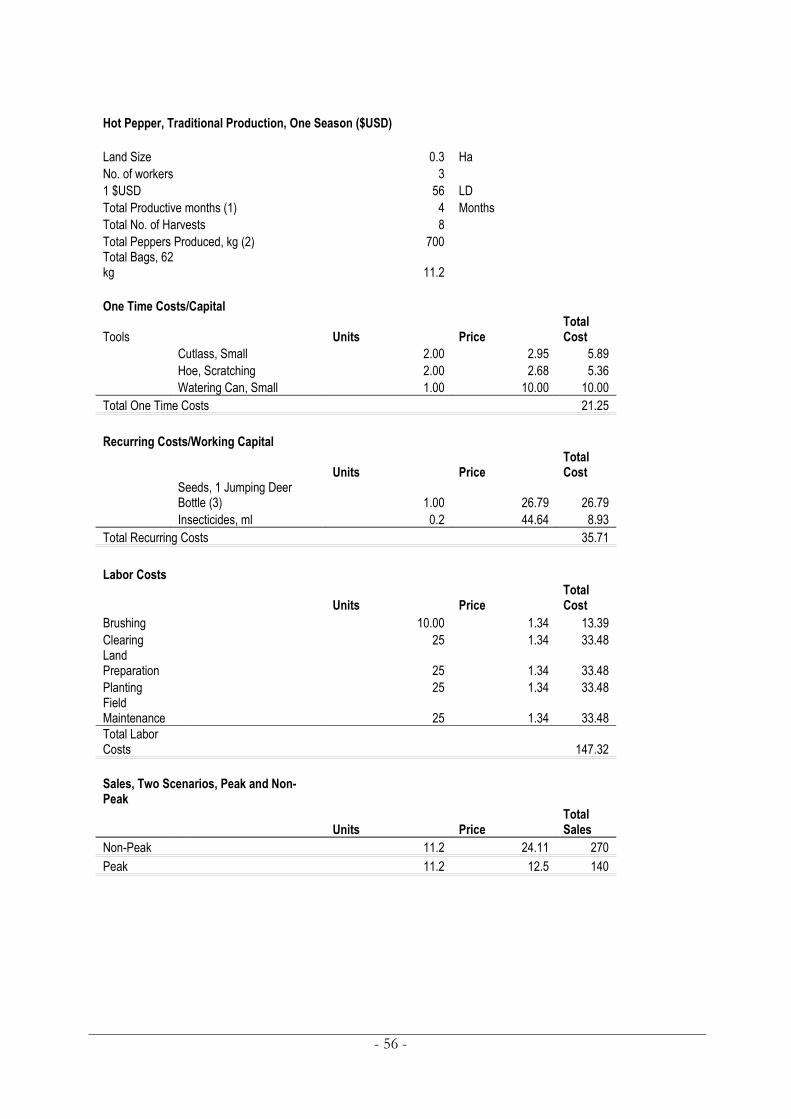
Hot Pepper, Traditional Production, One Season ($USD)
Land Size 0.3 HaNo. of workers 31 $USD 56 LDTotal Productive months (1) 4 MonthsTotal No. of Harvests 8Total Peppers Produced, kg (2) 700Total Bags, 62 kg 11.2
One Time Costs/Capital
Tools Units PriceTotal Cost
Cutlass, Small 2.00 2.95 5.89Hoe, Scratching 2.00 2.68 5.36Watering Can, Small 1.00 10.00 10.00
Total One Time Costs 21.25
Recurring Costs/Working Capital
Units PriceTotal Cost
Seeds, 1 Jumping Deer Bottle (3) 1.00 26.79 26.79Insecticides, ml 0.2 44.64 8.93
Total Recurring Costs 35.71
Labor Costs
Units PriceTotal Cost
Brushing 10.00 1.34 13.39Clearing 25 1.34 33.48Land Preparation 25 1.34 33.48Planting 25 1.34 33.48Field Maintenance 25 1.34 33.48Total Labor Costs 147.32
Sales, Two Scenarios, Peak and Non-Peak
Units PriceTotal Sales
Non-Peak 11.2 24.11 270Peak 11.2 12.5 140
- 56 -

Net Income & Return On InvestmentNet Income ROI
Non Peak 76.96 39.87%Non Peak, without labor 224.29 490.63%Peak -53.04 -27.47%Peak, without labor 94.29 206.25%
Two Year NPV (4)Discount rate: 35% (5)
Season 1 Season 2Season 3
Season 4
Cash Inflows, without tools 98.21 -31.79 98.21 -31.79Cash Inflows, without tools & labor 245.54 115.54 245.54 115.54
NPV 64.41NPV, without labor 444.33
Notes:(1) Useful life of a pepper plant can be extended from 6 months up to 2 years.Here using a conservative 4 month estimate, since many farmers only harvestfor one season.(2) Further field research is needed on the average yield for a pepper plant. (3) Traditional units seeds supplied by a local farmer used here. 85 grams of seed neededfor .3 Ha of land.(4) Unable to check with microcredit institutions on current rates of interest, so given Inflation rate of 15% to 20% and high operational costs, estimate cost of capital at 35%.(5) Unable to check with microcredit institutions on current rates of interest, so given Inflation rate of 15% to 20% and high operational costs, estimate cost of capital at 35%.
- 57 -

Peanuts, Modern Production, One Season ($USD)
Land Size 0.3 HaNo. of workers 31 $USD 56 LDNo. of plants, with 10 % loss 1080Total Bags 3.5
One Time Costs/Capital
Tools Units PriceTotal Cost
Cutlass, Small 2.00 2.95 5.89Hoe, Regular 1.00 5.98 5.98Hoe, Scratching 2.00 2.68 5.36Sharpening File 1.00 3.50 3.50Shovel 1.00 10.00 10.00Twine 2.00 1.50 3.00Tapeline 1.00 7.50 7.50
Total One Time Costs 41.23
Recurring Costs/Working Capital
Units PriceTotal Cost
Seeds 18.00 0.89 16.07Total Recurring Costs 16.07
Labor Costs
Units PriceTotal Cost
Brushing 5.00 1.34 6.70Clearing 15 1.34 20.09Land Preparation 25 1.34 33.48Planting 25 1.34 33.48Field Maintenance 25 1.34 33.48Total Labor Costs 127.23
Sales
Units PriceTotal Sales
Non-Peak 3.5 28.57 $100.00Peak 3.5 15.18 $53.13
Net Income & Return On InvestmentNet Income ROI
Non-Peak -84.54 -45.872%Non Peak, without Labor 42.70 74.509%Peak -$4.18 -2.26%Peak, without labor -$131.41 -71.21%
- 58 -

Two Year NPV (4)Discount rate: 35% (5)
Season 1 Season 2 Season 3 Season 4Cash Inflows, without tools -43.30 37.05 -43.30 37.05Cash Inflows, without tools & labor 211.16 37.05 211.16 37.05
NPV -49.29NPV, without labor 278.82
- 59 -

Appendix 8: Input Supply Prices
SURVEY OF INPUT SUPPLY PRICES, (Liberty)Bong Grand Basso Margibi Montserrado
High Low High Low High Low High Low
Seeds
Local, Peanuts (Cro Cro), salmon cup 30 15 25 20 Imported, Peanuts, salmon cup 50 Local, Pepper, jumping deer bottle 1,100 950 950 325Imported, Pepper, 110 grams 550 500
Chemicals (2)
Fertilizer, 15-15-15, 50 kg 3,360 3,000 2,800 2,520Urea, 50 kg 3,080 3,000Insecticides, Decis, 1 liter 2,240 2,000Insecticides, Dursban, 1 liter 2,520 2,300
Tools
Cutlass, Small 150 140 196 165Cutlass, Large 175 165 165 160Hoe 335 225 280 200Shovel 560 500 560 500Watering Can, Large 392 380 672 600Watering Can, Small 560 500Sprayer, Knapsack 9,800 8,960Sprayer, Knapsack, 5 gallon 4,480 4,200
Irrigation (1)
Lg. Pump, 30 m tube, 5 gallon 25,200 25,000 29,400 29,000Sm. Pump, 30 m tube 22,400 22,000 26,400 26,0002 in. tube, per yard 280 3 in, tube, per yard 560
Processing Grinding, Retail 875 6,750 Processing Hand Grinding, Retail 3,750 Notes: Grinding, Service 450 400(1) Pump prices inc. 30 meters of tubing, which is sufficient to irrigate 1 Ha of land.(2) Other insecticides we found available and in use by farmers are:
Thionex 2,240Agristom 2,520Cydim 2,240
- 60 -

Market Research Findings & Program Recommendations Tracy Gerstle
Appendix 9: Prices for Hot Pepper & Peanuts
HOT PEPPER PRICES BY COUNTY, MARKET ACTOR & SEASON (50 Kg Bags, Liberty)County: Margibi County: Bong County: Grand Basso County: Montserrado
Wholesale Retail Wholesale Retail Wholesale Retail Wholesale RetailNon-Peak Peak Non-Peak Peak Non-Peak Peak Non-Peak Peak Non-Peak Peak Non-Peak Peak Non-Peak Peak Non-Peak Peak
FarmerFresh 1,500 550 3,750 1,125 1,500 1,225 3,000 1,125 950 725 Dried Lib 2,000 750
Traders
Fresh 1,000 900 1,750 800 3,500 650 Dried Lib Guinea, Dried 7,000 3,500 2,000 4,875Cote d'Ivoire, Dried 5,000 4,000 Guinea, Fresh 3,500 1,400 Cote d'Ivoire, Fresh 1,500 1,200
Retailers
Fresh 850 1,125 3,000 1,875 975 4,500 2,625Dried Lib 3,750 Guinea, Dried 5,000 4,500 4,500 Guinea, Fresh 6,500 5,250 6,000 2,888Cote d'Ivoire, Dried 4,500 5,250 Cote d'Ivoire, Fresh
PEANUT PRICES BY COUNTY, MARKET ACTOR & SEASON (50 Kg Bags, Liberty)County: Margibi County: Grand Basso County: Bong County: Montserrado
Wholesale Retail Wholesale Retail Wholesale Retail Wholesale RetailNon-Peak Peak Non-Peak Peak Non-Peak Peak Non-Peak Peak Non-Peak Peak Non-Peak Peak Non-Peak Peak Non-Peak Peak
Farmer Fresh 1250 850 1250 800 1500 600 3250 1000 1850 850 3375 1850
TradersFresh 6000 5000Imported 4750 3250 4500 3750 4000 5000
Small RetailFresh 3500 3000 5000 4000 Imported 6000 5000 6875 5000
- 61 -

Market Research Findings & Program Recommendations Tracy Gerstle
Appendix 10: Activity Plan Meeting with Farmers8
Materials needed to facilitator the meeting:o 1 calculatoro 1 peno 1 notepado Flipchart/picture of calendar
June July August September
o Reference sheet with tool costs, seed costs, transportation costs
1. Introduction• Welcome and thank farmers for coming together• Ask them for their names and record this on a paper• Go over the purpose of the meeting: to develop an activity plan so that they
will be ready to plant cowpeas• Review some of the constraints and solutions and the reason that they are
getting together to develop a plan – go over pictures• During meeting they will select a leader of the farmers group and develop an
activity plan
2. Selecting a Leader• Brainstorm what are the characteristics of a good leader: good character, respected by
everyone, can run a meeting, is not single• Have pictures ready of the characteristics• Ask: “Who has these characteristics amongst you?”• Vote for the individual
3. Making an Activity Plan• Facilitator asks: How much land does each farmer want to plant? Each farmer announces
what they want to plant and puts one stone down for each ½ acre they want to plan. (if they want to plant 1 acre they put two stones, 1.5 acres – 3 stones, etc.) As a facilitator – beside each farmers name put down how much land they are committing to cultivate of cowpeas
8 Developed by Mary Morgan.
- 62 -

Market Research Findings & Program Recommendations Tracy Gerstle
• Facilitator asks: If the group wants to plant by October, what are the things that need to be done by September? Ask them to pick the pictures out from the constraints. When thy have picked out the pictures, then ask them to put the pictures in order:
o Buy toolso Make farm biggero Buy seedso Contact buyerso Contract transport company
• Facilitator asks: “When will we do all these things?”o Ask the farmers to put the pictures of the activities in the month that it should
be done• Facilitator asks: “How can we pay for these things?” – putting small small money
together – ask someone to pick out the picture of the savings group• Facilitator asks: “how much can each person save a week?” Farmers can put down the
number of stones that represents LD$1.00 for each stone. This can then be counted together.
• Facilitator asks: “How many weeks in each month?” – 4- how much can we save in a month?- Facilitator multiplies number of stones by 4 and this is the amount in a month
Buying Tools• Facilitator asks: “what tools do you want to buy? And how many?”• Facilitator then uses calculator to go over how much each tool costs – draw picture on
sheet of paper of tool and amount of the individual tool and write the total amount for the number they want to buy
•Buying Seeds• Facilitator has pictures of amount of seeds needed with cost for .5, 1, 1.5, 2 and 2.5 acres• How much seeds do we need to buy? – quantify amount in relation to the land being
cultivated• Calculate the amount and write on a paper – total kilograms and price
Preparing the land• Facilitator asks: When do we start to prepare the land?• Who will help each other?
Facilitator needs to record all this and then hand over to the leader as well as keep copy for themselves.
4. Closure• Have farmers set next meeting• Thank farmers again for coming• Let them know when you will be back
- 63 -

Market Research Findings & Program Recommendations Tracy Gerstle
Appendix 11 Value Chain Governance Structures
Governance structures in Value Chains determine the nature of trade relationships between all the chain actors. Depending on the structure they may also determine how benefits and profits are shared throughout the chain and decisions on what will be produced and sold in the chain. It is important to understand the governance structure both in terms of looking at benefits sharing and the chain’s overall competitiveness. Does the chain’s governance structure provide it with the qualities it needs to stay competitive in the market place in which it operates?
The characteristics of the following four governance structures are as follows: Market Based
– “arm’s length” transactions between buyers & sellers– little or no formal cooperation among participants
Balanced– fairly equal decision making among participants– cooperation but no one dominates
Directed– controlled by firm(s) who determine product specifications, trade rules, etc.
Hierarchy– vertically integrated enterprise that controls various functions along the value
chain
Hierarchy(Cut Flowers)
Integrated Firm
Major Buyer
Suppliers
(Export Crafts)
Directed
Buyers
Suppliers
(Organic Coffee)
Balanced
Price
Buyers
Suppliers
(Tomatoes)
Market
- 64 -

Market Research Findings & Program Recommendations Tracy Gerstle
Appendix 12 List of Handouts and Materials Given to the Research Team & Program ManagementIDE and Triple Trust, Other examples of LNGOs moving from a service provider role to a facilitator.
FAO Handbooks for Organizing SmallHolder Groups
Care Case Study on Informal Producer Groups in Bangladesh and Selling Points
- 65 -


![]978002]25-26]...H. Gerstle, "EBCAP: A ComputerProgram to Analyze Rotor Fragment Gerstle, "EBCAP: A ComputerProgram to Analyze Rotor Fragment Impact on Plate/Shell ContainmentShields,"](https://img.pdfslide.us/doc/110x75/610cf66f633ff43bff0d891e/97800225-26-h-gerstle-ebcap-a-computerprogram-to-analyze-rotor-fragment.jpg)