Embed Size (px)
Citation preview
Miscellanea
MICHAŁ PIETRZAK DOI: 10.5604/00441600.1147846Warsaw University of Life Sciences (SGGW)MARCIN MUCHAAssociation of Sugar Producers in Poland (ZPC)Warsaw
MARKET DELIMITATION ON THE EXAMPLE OF THE SUGAR SECTOR
AbstractThis paper is aimed at: (1) discussion of the geographical market de-
limitation, considering the decision-making methods used by antitrust authorities; and (2) verification of the geographical range of the sugar market using the Elzinga-Hogarty test. This market is defined as domestic market in the decisions of the European Commission and Polish antitrust authorities.
The comprehensive research (covering ca. 80 countries of the world sup-plying ca. 98% of the global sugar supply) showed that – in the light of the Elzinga-Hogarty method – most of the countries fail to meet the criteria of the LOFI/LIFO tests, which means that the geographical range of the sugar market is usually transnational. The findings comply – in the gen- eral dimension – with the mainstream of the criticism of the European antitrust authorities for too narrow definition of the markets and, in the de-tailed dimension – with the opinion of the representatives of the industry and scientists dealing with the sugar sector concerning the transnational range of the sugar market.
This controversy points to the need for further research and discussions on the geographical market delimitation. Moreover, the issue should be covered with reference to other agri-food markets – using both the methodology de-veloped with antitrust proceedings in mind, as well as the concepts stemming from strategic management.
Miscellanea 121
IntroductionMarket is the key economic category (Werden G.J., Froeb L. 1993) for which
the spatial dimension is very important. Nonetheless, on many occasions mar-ket is not openly defined in the geographic dimension or it is not implicitly de- fined as captured by mass statistics (i.e. often as a national sector) – failing to jus- tify such an approach. Because of intensifying processes of economic integra-tion (due to regionalisation and globalisation), domestic markets (also agri-food ones) become a part of the global market. Consequently, the issue of delimit- ation of the geographic market of agricultural products and food processing products turns out to be especially relevant (Hryszko K., Szajner P. 2013; Pie-trzak M. 2014).
How to define the geographic limits of the sector, then? Pietrzak suggested a method for delimiting the geographic scope of the market, which is a compil- ation1 of the concepts linked to the assessment of the globalisation potential of sectors, derived from strategic management theory. This method was next empir- ically verified on the example of the sector of multicomponent fertilisers (Pie-trzak M. 2014; Pietrzak M., Sulewski P., Jałosiński K. 2014). It should be noted that definition of the geographic dimension of the market is an important chal-lenge in the decision-making process of the antitrust authorities. In the 1970s and 80s, the “empirical” methods of delimitation2 started to grow in populari-ty, especially in the USA. In his paper Pietrzak emphasised the need for further research in the field of assessment of the geographic scope of the markets, in particular in the case of agricultural and food products (Pietrzak M. 2014). In this regard, the concept suggested by him may be used, but it should be also at- tempted to delimit the markets based on the quantitative methods developed by theoreticians and practitioners involved in the competition protection issues.
This paper is aimed at: (1) discussion of the geographic market delimitation, considering the decision-making methods used by antitrust authorities; and (2) verification of the geographic scope of the sugar market, defined in the decisions of the European Commission and Polish antitrust authorities as the national mar-ket, using the Elzinga-Hogarty test. However, according to the representatives of the industry, the sugar market should be defined wider. Authors of the paper concur with the opinion, which is also expressed in the literature (Hryszko K., Szajner P. 2013; Iwan C. 2007; Nolte S., Grethe H. 2013). Thus, the follow- ing research hypothesis was adopted: sugar market is a market of transnational geographic scope.
The choice of the sector for research was intentional. In most of the signifi-cant sugar-producing countries, market intervention covers control of the domes- tic market, and import duties or export support (Hryszko K., Szajner P. 2013; Mucha M. 2014). The market regulation in the EU sugar markets has been applic-
1 Extending the spectrum of assessment with the possible subnational geographical scope of the markets. 2 Consisting in applying different types of quantitative tests. One of them is the Elzinga-Hogarty (E-H) test used in the paper.
Miscellanea122
able for over 45 years. As part of a reform, started in 2006, the EU politicians have decided to partially deregulate the sugar market (Mucha M. 2010). The-refore, there appears a question about the international competitiveness of the sugar sector – in the EU as an economic block and in individual Member States. Because the market is the arena, where enterprises win or lose the competitive advantage, relevant definition of the market in the geographic dimension creates an especially important problem for the sector.
The discussion on the problem of delimitation of geographic markets is based on a critical analysis of literature. The paper also includes a comprehensive re-view of the decisions of the European Commission and Polish antitrust authori-ties concerning delimitation of the relevant market, with reference to the sugar sector. Secondary data were used to characterise the global sugar industry and verify the geographic scope of the sugar market. Basing thereon, Elzinga-Ho-garty test was used to assess the justification for treating the national markets as relevant markets. The researched countries represent 98% of the sugar supply, thus it can be assumed that the research was comprehensive.
Defining the market in the context of the European competition lawAccording to Allaire Y. and Firsirotu M.E. (2000), an attempt to define the
term “market” is a serious challenge fraught with difficulties. The opinions of Audy E. and Erutku C. (2005), Crane S.E. and Welch P.J. (1991), and Wårel L. (2007) on market definition are similar as well. Also Gorynia M. (1993) em-phasises the difficulties in drawing the demarcation line between different in-dustries3. Declaration of Tirole – 2014 Nobel Prize winner in economic sci- ences for “analysis of market power and the regulation” – is quite telling as in the introduction to his book on industry economics he admits: “For the purpose of the present book, this empirical difficulty of defining a market will be igno-red. It will be assumed that the market is well defined” (Tirole J. 1988). As far as in the strictly theoretical considerations this approach is acceptable, but from the practical perspective it is impossible to ignore problems regarding accurate def- inition of the markets. Allaire and Firsirotu review the definitions of the market in different scientific disciplines, referring to the theory of economy, economy of the industry, marketing, competition law, sociology and public policy. These authors also point out that: “The most precise analysis of the term ‘market’ can be most certainly found in legal phrases”4(Allaire Y., Firsirotu M.E. 2000; Cra-ne S.E., Welch P.J. 1991).
As noted by Gore et al. market definition is a permanent element of merger control. It aims at ensuring the context for competition analysis in the processes of impact assessment of company mergers. In this light, the so-called relevant market means a set of suppliers and products, subject to competitive interactions
3 A brief discussion on the terms “market” and “sector/industry” is included in the introduction to Pietrzak’s paper, in which he adopts an approach treating the terms as synonyms (2014). The reader will find a much broader discussion of the issue (and other conclusions) in the paper of Grzybowska (2012).4 Own translation – translator’s footnote.
Miscellanea 123
of the sort that changes in control over these suppliers and products may result in a growth in market power (Gore D., Lewis S., Lofaro A., Dethmers F. 2013).
The European Commission’s approach to defining the relevant market is laid down in its Notice of 1997 on the definition of the relevant market for the pur- poses of Community competition law. This document aimed at explaining how the Commission uses the term relevant market, so as to increase the transparency of the policy and decision-making process in the field of competitive policy. The rele-vant market is defined in the dimension of products (products treated as substitutes due to their properties, prices and use) and geographic dimension (area on which given entities participate in supply and demand; on which competition conditions are sufficiently homogenous and which may be distinguished from neighbouring areas because of these conditions). The relevant market is defined by the combin- ation of product and geographic markets. The Commission’s document points to three sources of competitive constraints: demand substitutability, supply substi-tutability and potential competition (entry barriers) (Commission notice... 1997).
Defining demand substitutability requires identification of the scope of prod- ucts, which are perceived by the customer as substitutes, and areas, which could act as alternative sources of supply in case of price growth. In the Notice of the Commission demand substitutability is a vital criterion. Supply substitutability can be also taken into account on condition that its effects are equal to demand substitutability. This implies that suppliers are able to rapidly switch to produc-tion of other types of products (classes or brands of one product) at no signifi- cant additional cost. Similar thinking pertains to different geographic areas (Commission notice... 1997).
There is a body of various evidence (arguments) in favour of each of the given extents of substitution and the Commission highlights an open approach to the empirical arguments and does not use any fixed hierarchy of information sources and types of evidence. This means that, in general, decisions will have to con-sider diverse criteria and various types of evidence. Such an approach ensures substantial elasticity in antitrust proceedings, but there appears a serious doubt as regards objectivity of decisions made on the basis thereof.
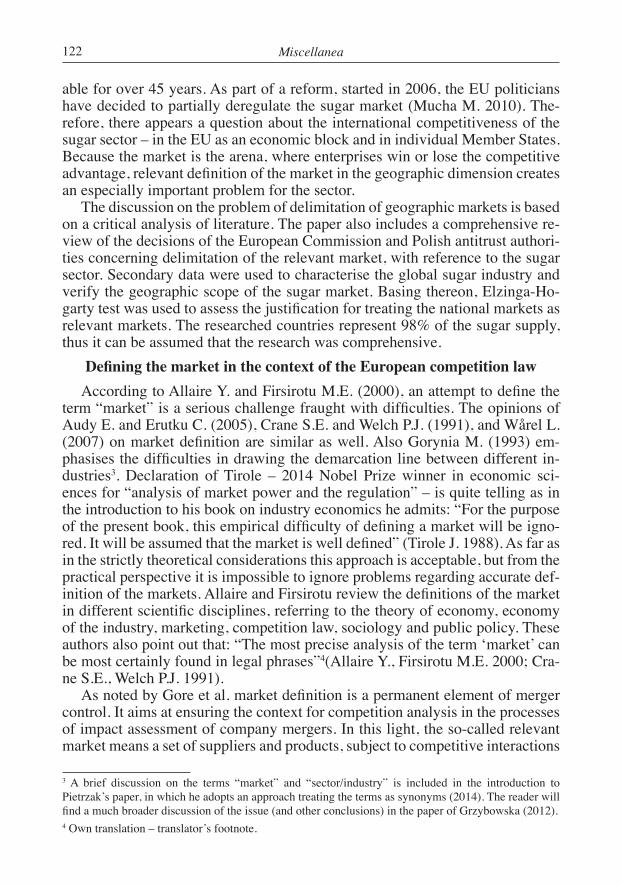
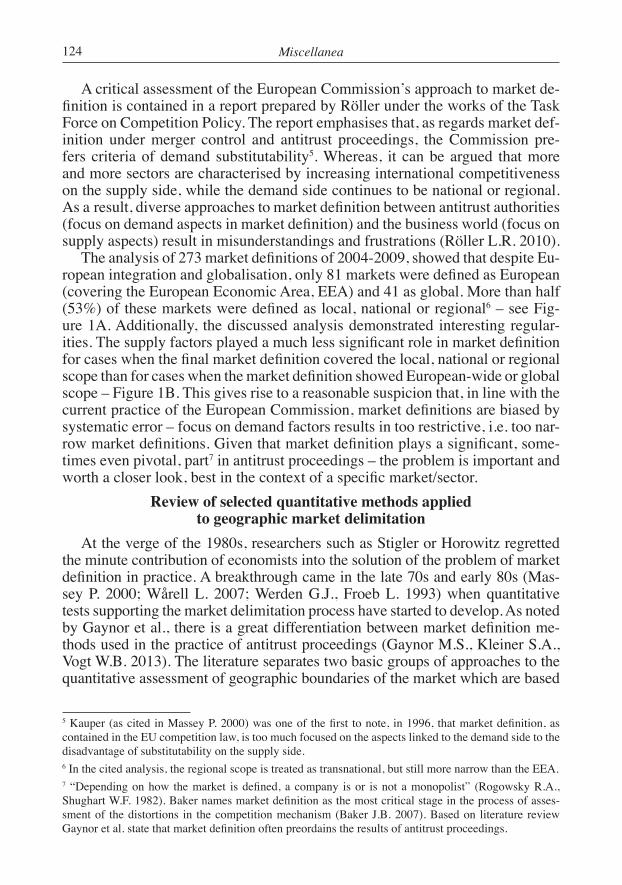
Fig. 1. Results of analysis of 273 market definitions from 37 cases of merger control in the EU Source: own compilation on the basis of (Röller L.R. 2010).
A: Zakresy geograficzne 273 definicji rynków B: Rola czynników podażowych a przyjęta definicja rynku
41; 15%
7; 3%6; 2%
81; 30%
35; 13%
103; 37%
Lokalne
Narodowe
Regionalne
Europejskie(EOG)Globalne
Inne
0%
20%
40%
60%
80%
100%
Lokalne Narodowe Regionalne Europejskie(EOG)
Globalne Ogółem
Przyjęte zakresy geograficzne rynku
Rola czynn
ików
po stronie
poda
ży
A: Geographic range of 273 market definitions
local
local national regional European global total (EEA)
national
regional
European (EEA)global
other
The
role
of s
uppl
y fa
ctor
s
Adopted geographic market scopes
B: Role of supply factors vs the adopted market definition
Miscellanea124
A critical assessment of the European Commission’s approach to market de-finition is contained in a report prepared by Röller under the works of the Task Force on Competition Policy. The report emphasises that, as regards market def- inition under merger control and antitrust proceedings, the Commission pre-fers criteria of demand substitutability5. Whereas, it can be argued that more and more sectors are characterised by increasing international competitiveness on the supply side, while the demand side continues to be national or regional. As a result, diverse approaches to market definition between antitrust authorities (focus on demand aspects in market definition) and the business world (focus on supply aspects) result in misunderstandings and frustrations (Röller L.R. 2010).
The analysis of 273 market definitions of 2004-2009, showed that despite Eu-ropean integration and globalisation, only 81 markets were defined as European (covering the European Economic Area, EEA) and 41 as global. More than half (53%) of these markets were defined as local, national or regional6 – see Fig- ure 1A. Additionally, the discussed analysis demonstrated interesting regular- ities. The supply factors played a much less significant role in market definition for cases when the final market definition covered the local, national or regional scope than for cases when the market definition showed European-wide or global scope – Figure 1B. This gives rise to a reasonable suspicion that, in line with the current practice of the European Commission, market definitions are biased by systematic error – focus on demand factors results in too restrictive, i.e. too nar-row market definitions. Given that market definition plays a significant, some- times even pivotal, part7 in antitrust proceedings – the problem is important and worth a closer look, best in the context of a specific market/sector.
Review of selected quantitative methods applied to geographic market delimitation
At the verge of the 1980s, researchers such as Stigler or Horowitz regretted the minute contribution of economists into the solution of the problem of market definition in practice. A breakthrough came in the late 70s and early 80s (Mas-sey P. 2000; Wårell L. 2007; Werden G.J., Froeb L. 1993) when quantitative tests supporting the market delimitation process have started to develop. As noted by Gaynor et al., there is a great differentiation between market definition me-thods used in the practice of antitrust proceedings (Gaynor M.S., Kleiner S.A., Vogt W.B. 2013). The literature separates two basic groups of approaches to the quantitative assessment of geographic boundaries of the market which are based
5 Kauper (as cited in Massey P. 2000) was one of the first to note, in 1996, that market definition, as contained in the EU competition law, is too much focused on the aspects linked to the demand side to the disadvantage of substitutability on the supply side.6 In the cited analysis, the regional scope is treated as transnational, but still more narrow than the EEA.7 “Depending on how the market is defined, a company is or is not a monopolist” (Rogowsky R.A., Shughart W.F. 1982). Baker names market definition as the most critical stage in the process of asses-sment of the distortions in the competition mechanism (Baker J.B. 2007). Based on literature review Gaynor et al. state that market definition often preordains the results of antitrust proceedings.
Miscellanea 125
on: prices and movements of goods (Crane S.E., Welch P.J. 1991). Simultaneous application of tests falling to both of these categories also takes place in publica-tions concerning practical market delimitation (Kostic M. 2014; Wårell L. 2005).
The approaches based on prices are strongly grounded in the papers of Cour-not and Marshall. Cournot defined the market as the entire territory, whose parts are interrelated with trade relations so as to easily and rapidly achieve the same level (as cited in Werden G.J., Froeb L. 1993). In line with the Marshall’s law of one price, the closer the market is to perfection the stronger the tendency to equalise the prices of the same good across different parts of the market, but for extensive markets transport costs correction should be considered. The methods based on prices include analyses of correlation, rate of adjustments, Granger caus- ality test, and tests of exogeneity and cointegration. The easiest version of the ap-proaches is verification of the simple correlation between prices of goods in the discussed areas. The closer the correlation of price movements between two mar-kets8, the stronger their integration. A strong interrelation between prices may, thus, point to strong trade relations, thereby suggesting that the areas form a sin-gle market. More complex methods are based on verification of cointegration of prices and Granger’s causality. The logic of the tests is the following – two sep- arate geographic areas create a single market if prices in these areas are cointe-grated. These tests are more complicated in econometric terms than the simple correlation analysis, but they provide additional information (Audy E., Erutku C. 2005; Crane S.E., Welch P.J. 1991; Wårell L. 2005; Werden G.J., Froeb L. 1993).
Methods based on prices, although strongly rooted in the economic theory, are often criticised in the literature. The critics focus primarily on (Audy E., Erutku C. 2005; Brorsen B.W. et al. 1997; Wårell L. 2005):• difficulties with access to good quality comparable data (e.g. there is often no
data on transport costs9, the prices of various variants of a product are differ- entiated, the prices for central locations are aggregated, which is a problem on geographically scattered markets);
• methodical and statistical constraints (e.g.: random convergence of price move- ments or convergence caused by variation of a factor of production com-mon for the considered markets, such as e.g. crude oil when assessing the geographic scope of the petrol market; no uniform criterion, from which the link between prices is sufficiently strong as to recognise the researched are-as as a single market, the correlation measures the current linear relation be- tween prices – prices may be relatively independent in a short term, but depend- ent in a long term, which, in turn, can cause too narrow market definition).It needs to be emphasised that the more advanced econometric price tests allow
avoiding some of the aforementioned statistical constraints. A separate category of criticism is linked to the differentiation between the terms: “economic mar-ket” and “antitrust relevant market” applied specifically by authors from circles
8 In our deliberations we mean markets-geographical areas.9 Thus, hindering price comparisons, especially when they are given in different formulas of Incoterms, e.g. CIF, FOB, etc., or – what is worse – no formula is given.
Miscellanea126
dealing with competition protection. They stress the distinctiveness of the latter term, which is primarily focused on the identification of the possibilities of in-creasing the market strength. From this perspective, the price tests allow to deli-mit the markets by referring to the phenomenon of arbitrage pricing (“economic markets”), but do not consider the key factors from the perspective of the mar-ket strength and especially demand substitutability, i.e. as regards the purchaser (Baker J.B. 2007; Werden G.J., Froeb L. 1993).
The methods based on data concerning movements of goods constitute an al-ternative to the price tests are. These methods assume that if the areas trade with each other at a significant scale it means that they belong to the same market. It is also presumed that movements of foods (in quantitative terms) reflect the sub-stantial shifts in demand and supply which affect prices. As a result, to conduct geographic market delimitation it is enough to gather quantitative data on pro-duction and consumption, and import and export thus avoiding many difficulties and traps linked to price tests. The most often used method based on data con-cerning movements of goods is the Elzinga-Hogarty method also known as the E-H test (Crane S.E., Welch P.J. 1991; Wårell L. 2005, 2007).
The E-H test consists in simultaneous verification of two partial tests: LOFI (Little-Out-From-Inside), referring to the supply side of the market, and LIFO (Little-In-From-Outside), pertaining to the demand side of the market. As de- fined by the authors of the E-H method: “If the firms in a hypothetical geogra-phic market area receive little of their business from customers outside of the geographic market area, this is an indicator of the propriety of defining that area as a market” – the LOFI test, and “if only a small proportion of the product con-sumed in the hypothetical geographic market is ‘imported’ into the area from the outside, this is an indicator of a unique geographic market area”. Elzinga and Hogarty suggest two critical levels indicating the framework for meeting the LOFI and LIFO tests – 75% (“weak market”) and 90% (“strong market”), but the adopted limit values have to be met for both tests. In other words, a si-gnificant scale of trade between areas indicates that they form a part of the same market, while lack of considerable supplies points to an isolation – i.e. separa-te markets (Crane S.E., Welch P.J. 1991; Gaynor M.S., Kleiner S.A., Vogt W.B. 2013; Kostic M. 2014; Wårell L. 2005).
The E-H test met with mixed response – on the one hand, it was conside-red to be included into the American Merger Guidelines (official guidelines on mergers), on the other, it was criticised on multiple occasions, especially in the last period it faced a wave of criticism caused by its often – and accor-ding to many authors unfounded – use for the assessment of hospital mergers in the USA10. However, the Elzinga-Hogarty method has important advantages, such as relatively low requirements concerning the necessary data and simpli-city, which, regardless of the criticism, make it one of the most popular me-thods used in the proceedings of antitrust authorities, in particular in the USA
10 Elzinga himself admits that, given the specificity of hospital services, the usefulness of the E-H test may be limited thus in such cases it should be used with caution (Elzinga K.G., Swisher A.W. 2011).
Miscellanea 127
(Brorsen B.W., von Bailey D., Thomsen M.R. 1997; Kostic M. 2014; Gaynor M.S. et al.; Wårell L. 2005; Werden G.J., Froeb L. 1993).
It should be also noted that there is a number of other quantitative methods used in market delimitation, e.g.: SSNIP (Small but Significant and Non-tran-sitory Increase in Price) test, CLA (Critical Loss Analysis) test, DB (Differen-tiated Bertrand oligopoly model) method, OD (Option Demand model) method – but discussion thereof goes beyond the framework of this paper.
Definitions of the geographic scope of the sugar market in the decisions of antitrust authorities
The authors reviewed the decisions of antitrust authorities as regards the issues of sugar market. The review takes into account all decisions of the European Commission concerning competition protection (excluding decisions on state aid) mentioned in the database of the Commission11 and signed as C.10.81 – sig- nifying the sugar industry12, and all decisions of the President of the Office of Competition and Consumer Protection regarding this sector. Therefore, within the considered scope the review may be recognised as comprehensive research.
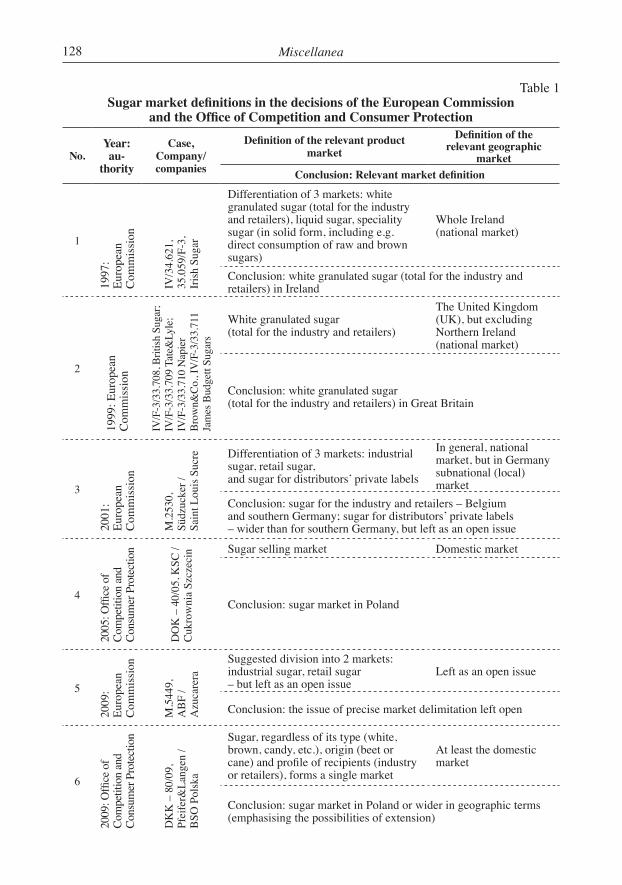
Analysis of the decisions of the European Commission and the Polish anti-trust authority reveals a fairly high degree of conformity pertaining to conclu-sions on the definition of the geographic dimension of the sugar market. In most of the cases the national/domestic market was termed as the relevant market. Only once the market was defined as broader than domestic, i.e. “southern Ger-many” (Südzucker / Saint Louis Sucre) and once as likely broader than national, i.e. “at least domestic” (Pfeifer&Langen / BSO Polska). In the case of the defin- ition of the relevant product market the differences are much more explicit. In general, the approach of the Office of Competition and Consumer Protection is much less restrictive, i.e. the product market is defined rather broadly. The deci-sions of the European Commission are clearly more restrictive. Product markets are narrowly defined, but the approach to their separation is not uniform. In for-mer decisions, the markets are differentiated by types of products. Later Com-mission’s decisions tend to delimit the markets by types of recipients – initially three (industry, retail and distributors’ private labels), then only two (industry, retail), and the last decision additionally uses a division into types (white sugar) – differentiating white industrial sugar and white retail sugar (which is the most narrow product market definition in the analysed decisions) – see Table 1.
It should be mentioned that to delimit the relevant market in the decisions covered by the review, antitrust authorities used mainly quality analyses. A very broad and in depth analysis in this scope is included in the decision on Südzucker / ED&F Man – this case only refers to the aforementioned quantitative methods. As part of deliberations on the market definition, apart from qualitative methods a simple price analysis was held.11 http://ec.europa.eu/competition/index_en.html12 The cases signed C.10.81, in which sugar production was not the primary area of enterprises activi-ty, were overlooked. Additionally, the case M.5449, ABF/Azucarera was included which was signed as a case concerning food industry in general, because the core of the case related to sugar industry.
Miscellanea128
Table 1Sugar market definitions in the decisions of the European Commission
and the Office of Competition and Consumer Protection
No.Year: au-
thority
Case, Company/companies
Definition of the relevant product market
Definition of the relevant geographic
marketConclusion: Relevant market definition
1
1997
: Eu
rope
an
Com
mis
sion
IV/3
4.62
1,
35.0
59/F
-3,
Iris
h Su
gar
Differentiation of 3 markets: white granulated sugar (total for the industry and retailers), liquid sugar, speciality sugar (in solid form, including e.g. direct consumption of raw and brown sugars)
Whole Ireland (national market)
Conclusion: white granulated sugar (total for the industry and retailers) in Ireland
2
1999
: Eur
opea
n
Com
mis
sion
IV/F
-3/3
3.70
8, B
ritish
Sug
ar;
IV/F
-3/3
3.70
9 Ta
te&
Lyle
; IV
/F-3
/33.
710
Nap
ier
Brow
n &Co
., IV
/F-3
/33.
711
Jam
es B
udge
tt Su
gars
White granulated sugar (total for the industry and retailers)
The United Kingdom (UK), but excluding Northern Ireland (national market)
Conclusion: white granulated sugar (total for the industry and retailers) in Great Britain
3
2001
: Eu
rope
an
Com
mis
sion
M.2
530,
Sü
dzuc
ker /
Sa
int L
ouis
Suc
re Differentiation of 3 markets: industrial sugar, retail sugar, and sugar for distributors’ private labels
In general, national market, but in Germany subnational (local) market
Conclusion: sugar for the industry and retailers – Belgium and southern Germany; sugar for distributors’ private labels – wider than for southern Germany, but left as an open issue
4
2005
: Offi
ce o
f Co
mpe
titio
n an
d Co
nsum
er P
rote
ctio
n
DO
K –
40/
05, K
SC /
Cuk
row
nia
Szcz
ecin Sugar selling market Domestic market
Conclusion: sugar market in Poland
5
2009
: Eu
rope
an
Com
mis
sion
M.5
449,
A
BF
/ A
zuca
rera
Suggested division into 2 markets: industrial sugar, retail sugar – but left as an open issue
Left as an open issue
Conclusion: the issue of precise market delimitation left open
6
2009
: Offi
ce o
f Co
mpe
titio
n an
d Co
nsum
er P
rote
ctio
n
DK
K –
80/
09,
Pfei
fer&
Lang
en /
BSO
Pol
ska
Sugar, regardless of its type (white, brown, candy, etc.), origin (beet or cane) and profile of recipients (industry or retailers), forms a single market
At least the domestic market
Conclusion: sugar market in Poland or wider in geographic terms (emphasising the possibilities of extension)
Miscellanea 129
cont. Table 1
7
2012
: Eur
opea
n C
omm
issi
on
M.6
286,
Sü
dzuc
ker /
ED
&F
Man
Differentiation of 2 markets: white industrial sugar, white retail sugar (concerns Italy, in case of Greece – irrelevant)
National (domestic) market – for Italy, for Greece – left as an open issue (but suggested as the domestic market).
Conclusion: as for Italy, white industrial sugar and white retail sugar have national scope
Source: own compilation on the basis of (Commission decision... 1997, 1998, 2001; Decyzja... 2005, 2009; Case No COMP/M.5449; Case No COMP/M.6286).
The opinions of the authors, as for product market definition, differ substan-tially from the Commission’s decisions, they concur to a much greater extent with the conclusions of the Office of Competition and Consumer Protection in the field – the authors will discuss the issue more broadly in the next section of the paper. Therein they will also refer to the geographic dimension of the sugar market by conducting the E-H test and its discussion.
Research results and discussionTo verify the research hypothesis, the authors decided to use a method based
on movements of goods, i.e. the Elzinga-Hogarty test, because different methods based on prices (correlation analysis, cointegration analysis) have already been applied in national research of the sugar sector (Hryszko K., Szajner P. 2013). But before starting to define the geographic scope of the market, it has to be defined in the supply dimension, i.e. sellers offering products of high substitution rate, and demand dimension, i.e. purchasers of specific needs (Pietrzak M. 2014). In the no-menclature of competition protection, this stage is termed as product market defin- ition, but it seems rather imprecise as, e.g., some decisions of the European Com-mission define the product market in supply terms, for instance, the market of whi-te granulated sugar, liquid sugar, speciality sugar, while others in demand terms, for example, sugar for industrial recipients, sugar for retail trade (see Table 1). Hence, it seems reasonable to separate the supply and demand aspects from each other, as suggested by Pietrzak. Similar approach to the market is in, e.g., Bourge-ois (1979), and also Sleuwaegen (1999) draws attention to the issue.
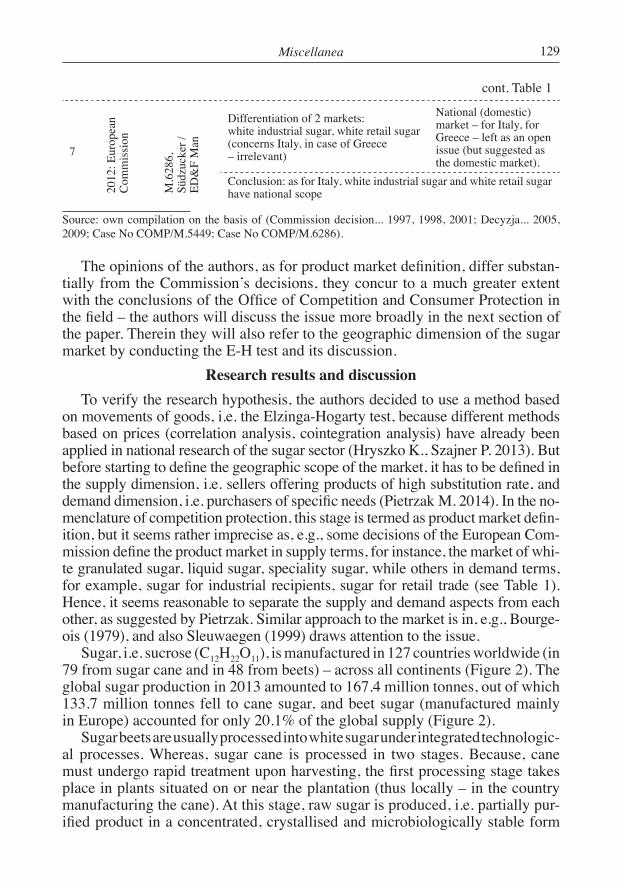
Sugar, i.e. sucrose (C12H22O11), is manufactured in 127 countries worldwide (in 79 from sugar cane and in 48 from beets) – across all continents (Figure 2). The global sugar production in 2013 amounted to 167.4 million tonnes, out of which 133.7 million tonnes fell to cane sugar, and beet sugar (manufactured mainly in Europe) accounted for only 20.1% of the global supply (Figure 2).
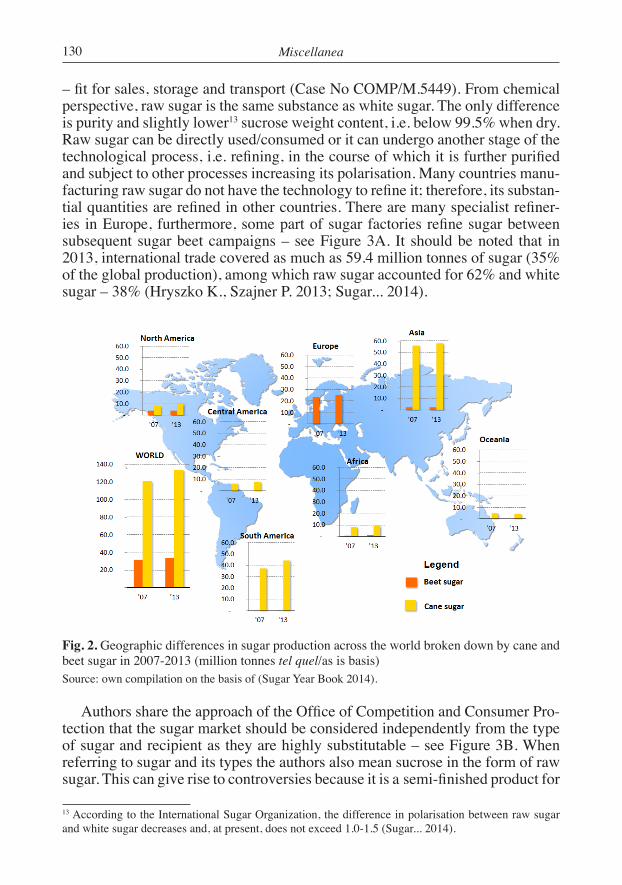
Sugar beets are usually processed into white sugar under integrated technologic- al processes. Whereas, sugar cane is processed in two stages. Because, cane must undergo rapid treatment upon harvesting, the first processing stage takes place in plants situated on or near the plantation (thus locally – in the country manufacturing the cane). At this stage, raw sugar is produced, i.e. partially pur- ified product in a concentrated, crystallised and microbiologically stable form
Miscellanea130
– fit for sales, storage and transport (Case No COMP/M.5449). From chemical perspective, raw sugar is the same substance as white sugar. The only difference is purity and slightly lower13 sucrose weight content, i.e. below 99.5% when dry. Raw sugar can be directly used/consumed or it can undergo another stage of the technological process, i.e. refining, in the course of which it is further purified and subject to other processes increasing its polarisation. Many countries manu- facturing raw sugar do not have the technology to refine it; therefore, its substan-tial quantities are refined in other countries. There are many specialist refiner- ies in Europe, furthermore, some part of sugar factories refine sugar between subsequent sugar beet campaigns – see Figure 3A. It should be noted that in 2013, international trade covered as much as 59.4 million tonnes of sugar (35% of the global production), among which raw sugar accounted for 62% and white sugar – 38% (Hryszko K., Szajner P. 2013; Sugar... 2014).
Fig. 2. Geographic differences in sugar production across the world broken down by cane and beet sugar in 2007-2013 (million tonnes tel quel/as is basis)Source: own compilation on the basis of (Sugar Year Book 2014).
Authors share the approach of the Office of Competition and Consumer Pro-tection that the sugar market should be considered independently from the type of sugar and recipient as they are highly substitutable – see Figure 3B. When referring to sugar and its types the authors also mean sucrose in the form of raw sugar. This can give rise to controversies because it is a semi-finished product for
13 According to the International Sugar Organization, the difference in polarisation between raw sugar and white sugar decreases and, at present, does not exceed 1.0-1.5 (Sugar... 2014).
Miscellanea 131
white sugar production (see Figure 3A). Overlooking the (less important) issue of some degree of demand substitutability (see Figure 3A), the authors reckon that supply substitutability is especially significant.
Fig. 3. Assumptions of the research concerning the scope of sugar marketSource: own compilation on the basis of (Pietrzak M., Jałosiński K. 2014).
In the case of a growth in the so-called white sugar premium (a differen-ce in the global prices of white and raw sugar), both specialist refineries and sugar factories are motivated to import raw sugar and to refine it – since high premium gives a chance for attractive margin left after covering the transport and refining costs14. Thus, the arbitration mechanism between the white and raw sugar segment is created. Assuming justness of the reasoning, both seg-ments should be treated as a single market. Similar line of thinking is presented by Hryszko and Szajner (2013). If the conclusions are accurate, there should be a clear interrelation between the prices of products from the two segments. Authors conducted an analysis of simple correlation based on time series cover- ing 84 observations of monthly prices of the two products. The analysis showed a very strong interrelation between raw and white sugar prices (corre-lation coefficient was 0.99 and is statistically significant for α = 0.05) which confirms an assumption about the interrelation of the two sugar market seg-ments. Hryszko and Szajner reach similar conclusions by assessing the regres-sion model based on significantly longer time series covering 406 observa-tions (since 1980).
Basing on the F.O. Licht data on production, consumption and foreign trade in sugar in total (raw and white sugar as an equivalent of raw sugar) for select- ed campaigns from the period between 2001 and 2014, the authors conducted Elzinga-Hogarty test for most of the significant sugar-producing countries. The research covered a total of 92 countries, and the number of countries presenting complete data that allow to calculate both the LOFI and LIFO test ranged from 75 to 80, depending on campaign. For example, 80 countries for which a set of
14 Of course, customs duties should be considered, if any. It should be emphasised that as a result of the reform, large quantities of customs-free raw sugar are imported to the EU from the ACP and LDCs.
Sucrose (C12H22O11) in different types, forms
and packages, including also as raw sugar
Beet sugar
Cane sugar
Retailers Industry
RECIPIENTS
Demand dimension
PRODUCT
AREA
Supply dimension
What is the geographic scope of the
sugar market?
A: Simplified sugar supply market B: Market scope by supply and demand dimensions
Miscellanea132
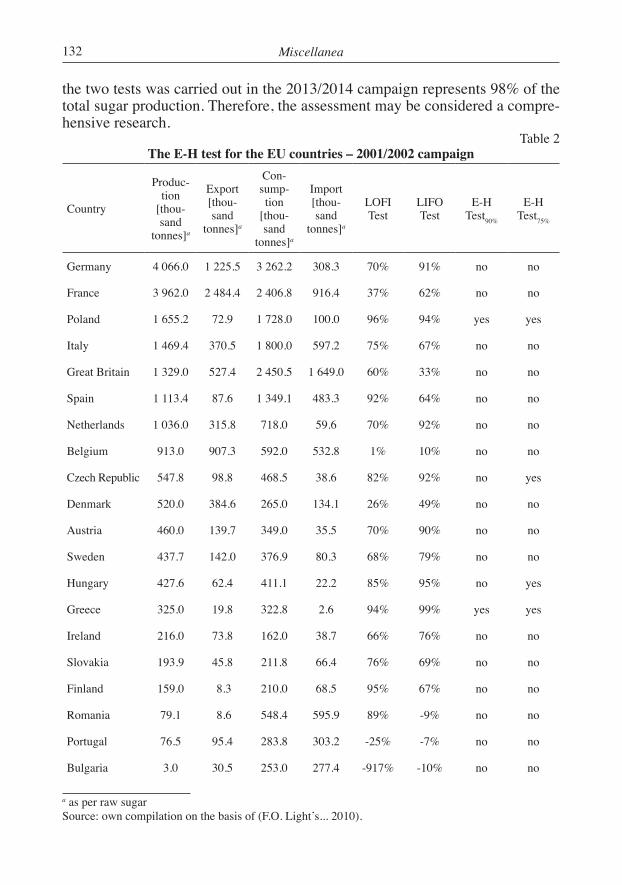
the two tests was carried out in the 2013/2014 campaign represents 98% of the total sugar production. Therefore, the assessment may be considered a compre-hensive research.
Table 2The E-H test for the EU countries – 2001/2002 campaign
Country
Produc-tion
[thou-sand
tonnes]a
Export [thou-sand
tonnes]a
Con-sump-tion
[thou-sand
tonnes]a
Import [thou-sand
tonnes]a
LOFITest
LIFOTest
E-HTest90%
E-HTest75%
Germany 4 066.0 1 225.5 3 262.2 308.3 70% 91% no no
France 3 962.0 2 484.4 2 406.8 916.4 37% 62% no no
Poland 1 655.2 72.9 1 728.0 100.0 96% 94% yes yes
Italy 1 469.4 370.5 1 800.0 597.2 75% 67% no no
Great Britain 1 329.0 527.4 2 450.5 1 649.0 60% 33% no no
Spain 1 113.4 87.6 1 349.1 483.3 92% 64% no no
Netherlands 1 036.0 315.8 718.0 59.6 70% 92% no no
Belgium 913.0 907.3 592.0 532.8 1% 10% no no
Czech Republic 547.8 98.8 468.5 38.6 82% 92% no yes
Denmark 520.0 384.6 265.0 134.1 26% 49% no no
Austria 460.0 139.7 349.0 35.5 70% 90% no no
Sweden 437.7 142.0 376.9 80.3 68% 79% no no
Hungary 427.6 62.4 411.1 22.2 85% 95% no yes
Greece 325.0 19.8 322.8 2.6 94% 99% yes yes
Ireland 216.0 73.8 162.0 38.7 66% 76% no no
Slovakia 193.9 45.8 211.8 66.4 76% 69% no no
Finland 159.0 8.3 210.0 68.5 95% 67% no no
Romania 79.1 8.6 548.4 595.9 89% -9% no no
Portugal 76.5 95.4 283.8 303.2 -25% -7% no no
Bulgaria 3.0 30.5 253.0 277.4 -917% -10% no no
a as per raw sugarSource: own compilation on the basis of (F.O. Light’s... 2010).
Miscellanea 133
Table 3The E-H test for the EU countries – 2013/2014 campaign
Country
Produc-tion
[thou-sand
tonnes]a
Export [thou-sand
tonnes]a
Con-sump-tion
[thou-sand
tonnes]a
Import [thou-sand
tonnes]a
LOFITest
LIFOTest
E-HTest90%
E-HTest75%
France 4 342.0 2 000.0 2 554.0 625.0 54% 76% no no
Germany 3 601.6 973.1 3 207.1 693.0 73% 78% no no
Poland 1 931.2 480.7 1 680.0 226.6 75% 87% no yes
Great Britain 1 319.0 325.0 2 160.0 1 300.0 75% 40% no no
Netherlands 1 030.0 380.0 937.0 225.0 63% 76% no no
Belgium 849.0 565.0 620.0 570.0 33% 8% no no
Czech Republic 587.5 330.3 380.0 115.5 44% 70% no no
Austria 570.0 285.0 460.0 200.0 50% 57% no no
Spain 515.1 119.2 1 456.1 1 054.7 77% 28% no no
Denmark 502.0 280.0 320.0 150.0 44% 53% no no
Sweden 410.8 88.6 377.3 46.6 78% 88% no yes
Italy 372.4 46.3 2 030.0 1 644.6 88% 19% no no
Slovakia 188.1 100.4 180.0 77.8 47% 57% no no
Romania 160.0 119.5 500.0 396.2 25% 21% no no
Hungary 125.9 91.8 301.6 260.4 27% 14% no no
Finland 80.0 34.0 191.0 120.0 58% 37% no no
Greece 52.1 46.3 342.9 344.9 11% -1% no no
Portugal - 187.0 260.0 366.2 nob -41% no no
Bulgaria - 9.8 205.4 161.6 nob 21% no no
Ireland - 11.0 168.0 148.0 nob 12% no no
a as per raw sugar; b no production gives zero in the denominator of the index – it is not possible to calcu-late LOFI test, but from the test logic it follows that if there is no production the test is not metSource: own compilation on the basis of (F.O. Light’s… 2014).
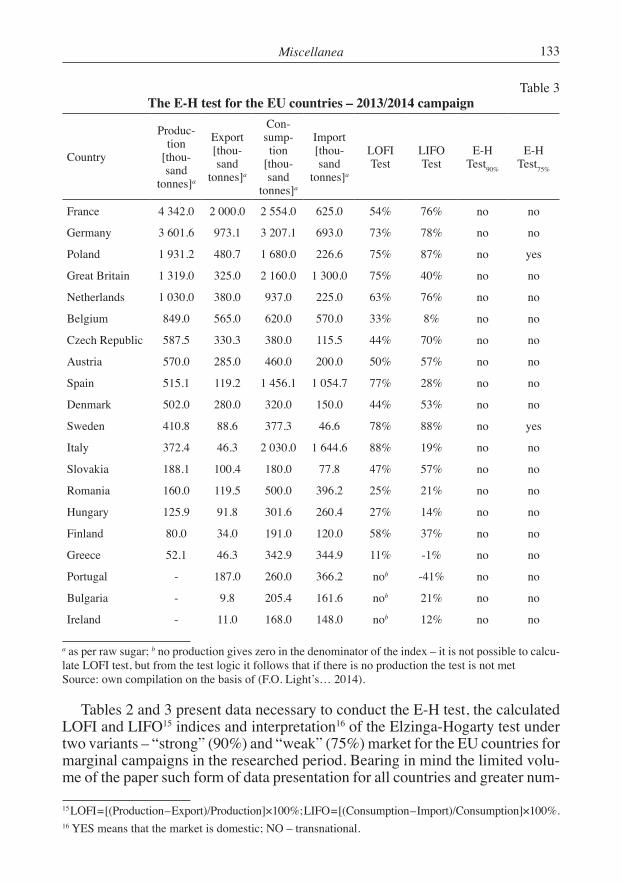
Tables 2 and 3 present data necessary to conduct the E-H test, the calculated LOFI and LIFO15 indices and interpretation16 of the Elzinga-Hogarty test under two variants – “strong” (90%) and “weak” (75%) market for the EU countries for marginal campaigns in the researched period. Bearing in mind the limited volu-me of the paper such form of data presentation for all countries and greater num-
15 LOFI = [(Production – Export)/Production]×100%; LIFO = [(Consumption – Import)/Consumption]×100%.16 YES means that the market is domestic; NO – transnational.
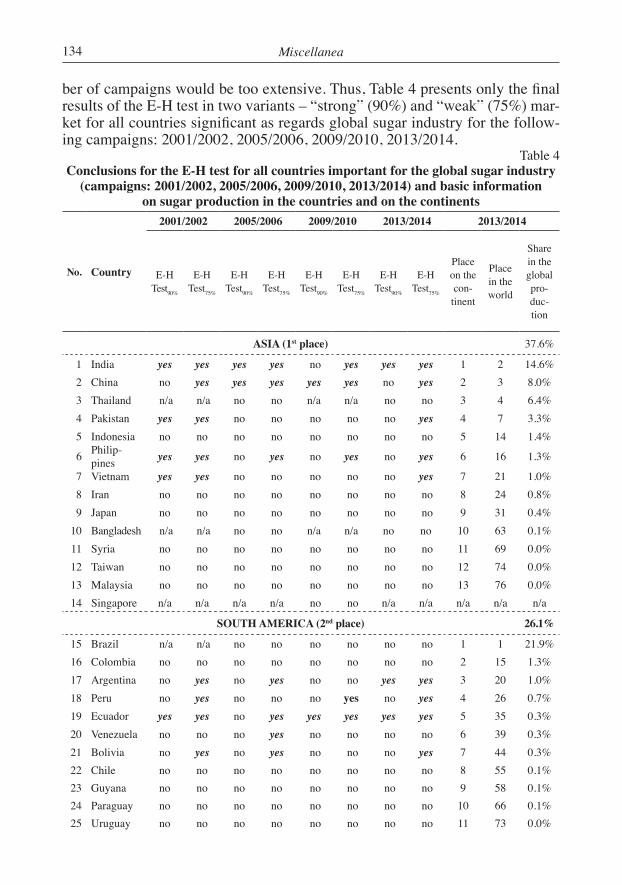
Miscellanea134
ber of campaigns would be too extensive. Thus, Table 4 presents only the final results of the E-H test in two variants – “strong” (90%) and “weak” (75%) mar-ket for all countries significant as regards global sugar industry for the follow- ing campaigns: 2001/2002, 2005/2006, 2009/2010, 2013/2014.
Table 4Conclusions for the E-H test for all countries important for the global sugar industry
(campaigns: 2001/2002, 2005/2006, 2009/2010, 2013/2014) and basic information on sugar production in the countries and on the continents
No. Country
2001/2002 2005/2006 2009/2010 2013/2014 2013/2014
E-H Test90%
E-HTest75%
E-HTest90%
E-HTest75%
E-HTest90%
E-HTest75%
E-HTest90%
E-HTest75%
Place on the con- tinent
Place in the world
Share in the global pro-duc-tion
ASIA (1st place) 37.6%
1 India yes yes yes yes no yes yes yes 1 2 14.6%2 China no yes yes yes yes yes no yes 2 3 8.0%3 Thailand n/a n/a no no n/a n/a no no 3 4 6.4%4 Pakistan yes yes no no no no no yes 4 7 3.3%5 Indonesia no no no no no no no no 5 14 1.4%
6 Philip-pines yes yes no yes no yes no yes 6 16 1.3%
7 Vietnam yes yes no no no no no yes 7 21 1.0%8 Iran no no no no no no no no 8 24 0.8%9 Japan no no no no no no no no 9 31 0.4%
10 Bangladesh n/a n/a no no n/a n/a no no 10 63 0.1%11 Syria no no no no no no no no 11 69 0.0%12 Taiwan no no no no no no no no 12 74 0.0%13 Malaysia no no no no no no no no 13 76 0.0%14 Singapore n/a n/a n/a n/a no no n/a n/a n/a n/a n/a
SOUTH AMERICA (2nd place) 26.1%
15 Brazil n/a n/a no no no no no no 1 1 21.9%16 Colombia no no no no no no no no 2 15 1.3%17 Argentina no yes no yes no no yes yes 3 20 1.0%18 Peru no yes no no no yes no yes 4 26 0.7%19 Ecuador yes yes no yes yes yes yes yes 5 35 0.3%20 Venezuela no no no yes no no no no 6 39 0.3%21 Bolivia no yes no yes no no no yes 7 44 0.3%22 Chile no no no no no no no no 8 55 0.1%23 Guyana no no no no no no no no 9 58 0.1%24 Paraguay no no no no no no no no 10 66 0.1%25 Uruguay no no no no no no no no 11 73 0.0%

Miscellanea 135
cont. Table 4
EUROPE (3rd place) 15.1%
including the EU 9.4%
26 France no no no no no no no no 1 10 2.4%27 Germany no no no no no no no no 2 11 2.0%28 Poland yes yes no no no yes no yes 3 19 1.1%
29 Great Britain no no no no no no no no 4 25 0.7%
30 Netherlands no no no no no no no no 5 27 0.6%31 Belgium no no no no no no no no 6 28 0.5%
32 Czech Republic no yes no no no no no no 7 36 0.3%
33 Austria no no no no no no no no 8 38 0.3%34 Spain no no no no no no no no 9 42 0.3%35 Denmark no no no no no no no no 10 43 0.3%36 Sweden no no no no no no no yes 11 51 0.2%37 Italy no no no no no no no no 12 52 0.2%38 Slovakia no no no no no no no no 13 59 0.1%39 Romania no no no no no no no no 14 62 0.1%40 Hungary no yes no no no no no no 15 65 0.1%41 Finland no no no no no no no no 16 70 0.0%42 Greece yes yes no no no no no no 17 71 0.0%43 Bulgaria no no no no no no no no 18 77 0.0%44 Ireland no no no no no no no no 19 78 0.0%45 Portugal no no no no no no no no 20 79 0.0%
including the REST OF EUROPE 5.8%
46 Russian Federation no no no no no no no yes 1 8 2.6%
47 Turkey no yes yes yes yes yes yes yes 2 13 1.4%48 Ukraine no yes yes yes no yes yes yes 3 23 0.8%49 Serbia no no no no no no no no 4 37 0.3%50 Switzerland no no no no no yes no no 5 56 0.1%
NORTH AND CENTRAL AMERICA (4th place) 12.2%
51 USA no yes no no no no no no 1 5 4.2%52 Mexico no yes no yes no yes no no 2 6 3.5%53 Guatemala no no no no no no no no 3 12 1.6%54 Cuba no no no no no no no no 4 22 0.9%55 Nicaragua n/a n/a no no n/a n/a no no 5 29 0.4%56 Salvador no no no no no no no no 6 30 0.4%
57 Dominican Republic no no no no no no no no 7 40 0.3%
58 Honduras no no no no no yes no no 8 41 0.3%
Miscellanea136
cont. Table 459 Costa Rica no no no no no no no no 9 46 0.3%60 Panama no yes no no no no no no 10 61 0.1%61 Jamaica no no no no no no no no 11 64 0.1%62 Canada no no no no no no no no 12 67 0.1%63 Barbados no no no no no no no no 13 75 0.0%
64 Trinidad/Tobago no no no no no no no no 14 80 0.0%
AFRICA (5th place) 6.3%
65Republic of South Africa
no no no no no no no no 1 17 1.3%
66 Egypt no no no no no no no no 2 18 1.2%67 Sudan no no no no no no no no 3 32 0.4%68 Swaziland n/a n/a no no no no no no 4 33 0.4%69 Kenia no yes no no no no no yes 5 34 0.4%70 Zimbabwe no no no no no no no no 6 45 0.3%71 Mauritius no no no no no no no no 7 47 0.3%72 Zambia no no no no no no no no 8 48 0.2%73 Morocco no no no no no no no no 9 49 0.2%
74 Mozam-bique no no no no no no no no 10 50 0.2%
75 Tanzania no no no no no no no no 11 53 0.2%76 Malawi no no no no no no no yes 12 54 0.2%
77 Ivory Coast no no no no no no no no 13 60 0.1%
78 Madagascar no no no no no no no no 14 68 0.1%79 Nigeria no no no no no no no no 15 72 0.0%
OCEANIA (6th place) 2.6%80 Australia no no no no no no no no 1 9 2.4%81 Fiji no no no no no no no no 2 57 0.1%
Source: own compilation on the basis of (F.O. Light’s 2014).
The obtained results confirm the assumed research hypothesis that the geo-graphic dimension of the sugar market has a transnational scope. On the global scale, only from 4% to 9% of countries meet the criteria of a “strong” nation- al market, while in the case of a lower limit – from 13% to 25% of countries are characterised as “weak” domestic market. When referring only to the countries of the EU, statistics are even worse. The criteria of a “strong” national market were met by only 2 countries (10%) and only in the 2001/2002 campaign. In la-ter campaigns none of the EU countries was recognised as a “strong” domes- tic market. In case of mitigated criteria, the share of countries characterised by “weak” national market ranged from 0% to 20%.
Miscellanea 137
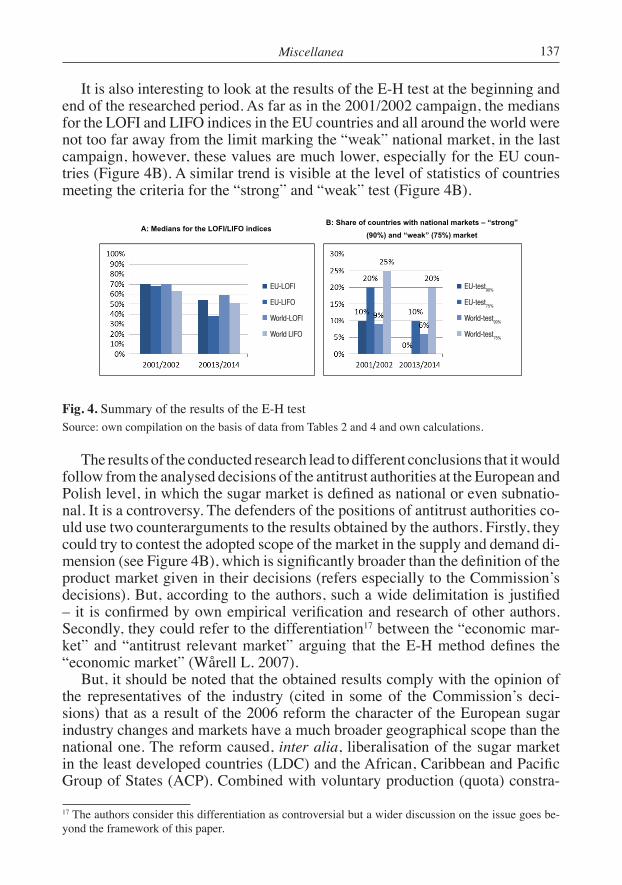
It is also interesting to look at the results of the E-H test at the beginning and end of the researched period. As far as in the 2001/2002 campaign, the medians for the LOFI and LIFO indices in the EU countries and all around the world were not too far away from the limit marking the “weak” national market, in the last campaign, however, these values are much lower, especially for the EU coun- tries (Figure 4B). A similar trend is visible at the level of statistics of countries meeting the criteria for the “strong” and “weak” test (Figure 4B).
Fig. 4. Summary of the results of the E-H testSource: own compilation on the basis of data from Tables 2 and 4 and own calculations.
The results of the conducted research lead to different conclusions that it would follow from the analysed decisions of the antitrust authorities at the European and Polish level, in which the sugar market is defined as national or even subnatio-nal. It is a controversy. The defenders of the positions of antitrust authorities co-uld use two counterarguments to the results obtained by the authors. Firstly, they could try to contest the adopted scope of the market in the supply and demand di-mension (see Figure 4B), which is significantly broader than the definition of the product market given in their decisions (refers especially to the Commission’s decisions). But, according to the authors, such a wide delimitation is justified – it is confirmed by own empirical verification and research of other authors. Secondly, they could refer to the differentiation17 between the “economic mar-ket” and “antitrust relevant market” arguing that the E-H method defines the “economic market” (Wårell L. 2007).
But, it should be noted that the obtained results comply with the opinion of the representatives of the industry (cited in some of the Commission’s deci-sions) that as a result of the 2006 reform the character of the European sugar industry changes and markets have a much broader geographical scope than the national one. The reform caused, inter alia, liberalisation of the sugar market in the least developed countries (LDC) and the African, Caribbean and Pacific Group of States (ACP). Combined with voluntary production (quota) constra-
17 The authors consider this differentiation as controversial but a wider discussion on the issue goes be-yond the framework of this paper.
17
Figure 4. Summary of the results of the E-H test
A: Medians for the LOFI/LIFO indices B: Share of countries with national markets – “strong”
(90%) and “weak” (75%) market
UE – EU
Świat - World
Source: own compilation on the basis of data from Tables 2 and 4 and own calculations.
The results of the conducted research lead to different conclusions that it would follow from the analysed decisions of the antitrust authorities at the European and Polish level, in which the sugar market is defined as national or even subnational. It is a controversy. The defenders of the positions of antitrust authorities could use two counterarguments to the results obtained by the authors. Firstly, they could try to contest the adopted scope of the market in the supply and demand dimension (cf. Figure 4B), which is significantly broader than the definition of the product market given in their decisions (refers especially to the Commission’s decisions). But, according to the authors, such a wide delimitation is justified – it is confirmed by own empirical verification and research of other authors. Secondly, they could refer to the differentiation17 between the “economic market” and “antitrust relevant market” arguing that the E-H method defines the “economic market” (Wårell L. 2007).
But, it should be noted that the obtained results comply with the opinion of the representatives of the industry (cited in some of the Commission’s decisions) that as a result of the 2006 reform the character of the European sugar industry changes and markets have a much broader geographical scope than the national one. The reform caused, inter alia, liberalisation of the sugar market in the least developed countries (LDC) and the African, Caribbean and Pacific Group of States (ACP). Combined with voluntary production (quota) constraints and suspension of payments to export, it resulted in a significant increase in sugar export to the EU, which results in greater internationalisation of the EU sugar sector.
What is more, a similar opinion – i.e. concerning the transnational character of the sugar market, is expressed by other researchers of the industry (Iwan C. 2007; Nolte S., 17 The authors consider this differentiation as controversial but a wider discussion on the issue goes beyond the framework of this paper.
EU-LOFI
EU-LIFO
World-LOFI
World LIFO
EU-test90%
EU-test75%
World-test90%
World-test75%
Miscellanea138
ints and suspension of payments to export, it resulted in a significant increase in sugar export to the EU, which causes greater internationalisation of the EU sugar sector.
What is more, a similar opinion – i.e. concerning the transnational character of the sugar market, is expressed by other researchers of the industry (Iwan C. 2007; Nolte S., Grethe H. 2013). Hryszko and Szajner indicate that the reform has caused significant movements in foreign trade in sugar in the EU coun- tries that changed from exporters into net importers in the conditions of foreign trade intensification. At the same time, white sugar dominates in export (95% in quantity terms), while raw sugar accounts for a half of imports, mainly from the ACP and LDC. Summing up their research they state: “the industry is more and more linked to external markets, (…) the impact of the global market on the local markets is clearly visible. Cointegration of the domestic market with the international market is illustrated with a strong dependence of the national sell- ing prices and prices on the international commodity exchanges” (Hryszko K., Szajner P. 2013).
Even if we do not consider the results obtained by the authors as decisive, they are an argument for a broader look at the geographic dimension of the sugar market than it is done by the antitrust authorities. The authors reckon that the issue of geographic delimitation of the market requires further research and dis- cussions. It should be noted that too restrictive approach in merger control (and it becomes such when the market definition is too narrow as regards the econo-mic realities) entails a risk that by restricting integration of companies their com-petitive ability, on the verge of further sugar market liberalisation, will weak- en (abrogation of quotas as of 2017).
ConclusionsThe progressing dynamic processes of regional economic integration and
globalisation irreversibly change markets (also agri-food markets), of which we are used to think as local, into transnational markets by extending their spatial borders. Thus, the issue of delimitation of the geographic market of agricultur- al products and food processing products becomes especially important. How to demit the geographic border of a market? In the last paper published in “Zagad-nienia Ekonomiki Rolnej” one of the authors tried to answer the question by re-ferring to the concepts and methods deriving from strategic management. Whe-reas, definition of the geographic dimension of a market interests also economi-sts and legal practitioners dealing with establishing and enforcing competition law, hence there are interesting works in the field both in the form of decisions of antitrust authorities and methodology of market delimitation – also as quan-titative methods.
One of them is Elzinga-Hogarty basing on the data on movements of goods between markets in proportion to production and consumption. The use of the test to all countries important in the global sugar industry showed that, from the perspective of the method, only few countries have fairly closed national sugar
Miscellanea 139
markets. In most of the countries the international links are strong enough to point to a need for wider than national market delimitation. These results are contra-ry to the decisions of the European and Polish antitrust authorities, but they are compliant with the opinions of representatives of the industry and researchers specialising in this field. Thus, an important controversy in spatial definition of the sugar market is revealed.
Bearing in mind that the conducted analysis rather signals issues than gives final decisions, the authors postulate further research in the field. First of all, the use of the E-H method, whose potential was only partially used in this research, should be extended to verify the hypothesis on the national scope of the sugar market. But the method served primarily to define the actual limits of the market by “sticking together” subsequent markets that do not meet the LOFI/LIFO tests until the postulate of relative isolation as regards movements of goods is met by thus created geographical aggregate of market segments. It would be worthwhile to hold such research not only for the sugar market but also for other agri-fo-od sectors. Secondly, other methodologies should be used in parallel, not only to the sugar market, both those quantitative (e.g. price cointegration analysis) and qualitative, including those rooted in strategic management. This complies with the postulate of Sleuwaegen, who considered it interesting to combine dif-ferent market delimitation methods – especially antitrust methods with strategic methods (1999).
Literature:1. Allaire Y., Firsirotu M.E.: Myślenie strategiczne. PWN, Warsaw 2000.2. Audy E., Erutku C.: Price Tests to Define Markets: An Application to Wholesale Gasoline
in Canada. Journal of Industry Competition and Trade, vol. 5, no. 2, 2005, 137-154.3. Baker J.B.: Market Definition: An Analitical Overview. Antitrust Law Journal, vol. 74,
issue 1, 2007, 129-173.4. Bourgeois J.C.: A Measure for Market Delineation. Advances in Consumer Research,
vol. 6, issue 1, 1979, 514-518.5. Brorsen B.W., von Bailey D., Thomsen M.R.: Mapping Market Areas Using
Nonparametric Smoothing. Geographical Analysis, vol. 29, no. 3 1997, 214-231.6. Case No COMP/M.5449, ABF/Azucarera, http://ec.europa.eu/competition/antitrust /ca-
ses/decisions/ M5449_20090330_20310_265127_EN.pdf, access date 01.12.2014.7. Case No COMP/M.6286, Südzucker/ED&F Man, http://ec.europa.eu/competition/anti-
trust/cases/ decisions/m6286_20120516_20600_3495062_EN.pdf, access date 01.12.2014.8. Commission decision of 14 May 1997 relating to a proceeding pursuant to Article 86 of
the Treaty (IV/34.621, 35.059/F-3 – Irish Sugar plc), Official Journal of the European Communities L258, vol. 40, 1997.
9. Commission decision of 14 October 1998 relating to a proceeding pursuant to Article 85 of the EC Treaty Case IV/F-3/33.708 – British Sugar plc, Case IV/F-3/33.709 – Tate&Lyle plc, Case IV/F-3/33.710 – Napier Brown&Company Ltd, Case, IV/F-3/33.711 James Budgett Sugars Ltd, http:ec.europa.eu/competition/antitrust/cases/dec_docs/33708/33708_6_7.pdf, access date 01.12.2014.
Miscellanea140
10. Commission decision of 20 December 2001 declaring a concentration to be compatible with the common market and the EEA Agreement (Case COMP/ M.2530, Südzucker/Saint Louis Sucre). Official Journal of the European Union L103, vol. 46, 2003.
11. Commission notice on the definition of relevant market for the purposes of Community competition law. Official Journal of the European Communities C372, vol. 40 9 December 1997.
12. Crane S.E., Welch P.J.: The Problem of Geographic Market Definition: Geographic Proximity vs. Economic Significance. Atlantic Economic Journal, vol. 19, issue 2, 1991, 12-20.
13. DECYZJA nr DOK – 40/05 z dnia 25.04.2005, http://decyzje.uokik.gov.pl/dec_prez.nsf/0/2264BA7B635FBE72C12574F3003ED067/$file/Decyzja_nr_DOK40_2005_z_dnia_25.04.2005.pdf, access date 01.12.2014.
14. DECYZJA nr DKK – 80/09 z dnia 16.11.2009, http://decyzje.uokik.gov.pl/dec_prez.nsf/0/2AC6D1438A68FFABC1257679004CD46B/$file/Decyzja%20Nr%20DKK%2080_2009%20z%2016.11.2009%20-%20Pfeifer%20&%20Langen%20i%20BSO%20Polska%20-%20koncenracja.pdf, access data 01.12.2014.
15. Elzinga K.G., Swisher A.W.: Limits of the Elzinga-Hogarty Test in Hospital Mergers: The Evanston Case. International Journal of the Economics of Business, vol. 18, no. 1, 2011, 133-146.
16. F.O. Licht’s International Sugar and Sweetener Report. World Sugar Balances, 2001/2002 – 2010/2011, Ratzeburg, 2010.
17. F.O. Licht’s International Sugar and Sweetener Report. World Sugar Balances, 2005/2006 – 2014/2015, Ratzeburg, 2014.
18. Gaynor M.S., Kleiner S.A., Vogt W.B.: A Structural Approach to Market Definition with an Application to the Hospital Industry. The Journal of Industrial Economics, vol. LXI, no. 2, 2013, 243-289.
19. Gore D., Lewis S., Lofaro A., Dethmers F.: The Economic Assessment of Mergers under European Competition Law, Cambridge University Press, 2013.
20. Gorynia M.: Delimitacja systemów gospodarczych w naukach ekonomicznych. Ruch Prawniczy, Ekonomiczny i Socjologiczny, Rok LV, zeszyt 2, 1993, 65-72.
21. Grzybowska B.: Innowacyjność przemysłu spożywczego w Polsce – ujęcie regionalne, Wyd. Uniwersytetu Warmińsko-Mazurskiego w Olsztynie, Olsztyn 2012.
22. Hryszko K., Szajner P.: Sytuacja na światowym rynku cukru i jej wpływ na możliwości uprawy buraków cukrowych w Polsce. Program Wieloletni 2011-2014: Konkurencyjność polskiej gospodarki żywnościowej w warunkach globalizacji i integracji europejskiej no. 71, IERiGŻ-PIB, Warsaw 2013.
23. Iwan C.: The Impact of Privatization With Foreign Involvement on the Restructuring Process of the Sugar Industry in Poland, Frankfurt am Main, 2007.
24. Kostic M.: Testing the Boundaries of the Relevant Market in the Competition Policy. Economic Horizons, vol. 16, no. 1, 2014, 31-44.
25. Massey P.: Market Definition and Market Power in Competition Analysis: Some Practical Issues. The Economic and Social Review, vol. 31, no. 4, 2000, 309-328.
26. Mucha M.: Podsumowanie reformy regulacji rynku cukru w Unii Europejskiej w latach 2006/2007–2009/2010. Burak cukrowy 3/2010, 65-67.
27. Mucha M.: Stan i perspektywy branży cukrowniczej w Polsce. Prezentacja na konferen-cji pokampanijnej STC, Warsaw 2014.
28. Nolte S., Grethe H.: Developments in the EU and world sugar markets in 2009. Sugar Industry no. 135 (1/2013), 29-36.
Miscellanea 141
29. Pietrzak M.: Problem geograficznego zakresu rynków/sektorów w dobie globalizacji i regionalizacji. Zagadnienia Ekonomik Rolnej, no. 1, 2014, 3-21.
30. Pietrzak M., Jałosiński K.: Czynniki rynkowe a potencjał globalizacyjny na przykładzie wybranego sektora branży chemicznej. Marketing i Rynek no. 8, 2014, 30-40.
31. Pietrzak M., Sulewski P., Jałosiński K.: Określanie zakresu geograficznego rynku na przykładzie sektora kompleksowych nawozów wieloskładnikowych. Zagadnienia Ekonomik Rolnej, no. 2, 2014, 59-78.
32. Rogowsky R.A., Shughart W.F.: Market Definition in Antitrust Analysis: Comment. Working Paper Bureau of Economics Federeal Trade Comission, no. 77, 1982.
33. Röller L.R.: Challenges in EU Competition Policy. European Round Table of Industrialists, 2010, http://www.ert.eu/sites/default/files/2010-03%20COMPETITION%20POLICY% 20REPORT%20FINAL.pdf, access date 12.11.2014.
34. Sleuwaegen L.: Competitive distortions and state aid to firms. How to define the rele-vant market? 2014 (1999), http://ec.europa.eu/DocsRoom/documents/2652, access date: 11.12.2014.
35. Sugar Year Book 2014. International Sugar Organization, London 2014.36. Tirole J.: The Theory of Industrial Organization. The MIT Press, Cambridge MA 1988.37. The Prize in Economic Sciences 2014, 13.10.2014. http://www.nobelprize.org/nobel_
prizes/economic-sciences/laureates/2014/press.pdf, access date 02.11.2014.38. Wårell L.: Defining Geographic Coal Markets Using Price Data and Shipments Data.
Energy Policy, vol. 33, issue 17, 2005, 2216-2230.39. Wårell L.: Market Integration and Merger Assessments in the Mineral Industries.
Doctoral Thesis 2007:38, Economics Unit, Luleå University of Technology, Luleå 2007.40. Werden G.J., Froeb L.: Correaltion, Casuality and All that Jazz: The Inherent
Shortcomings of Price Tests for Antitrust Market Delineation. Review of Industrial Organization no. 8, 1993, 329-353.
key words: market delimitation, antitrust authorities, Elzinga-Hogarty method, LOFI/LIFO tests, transnational market, relevant market, merger control, substitutability
Accepted for print: 24.02.2015.


![OntheInfluenceofMessageLengthinPMAC’s SecurityBounds · isreducedbyconstruction:Yasuda’sPMAC-with-Parity[23]andZhang’s PMACX[24]getboundsoftheformq2‘2=22n. ForEMAC,Pietrzak[17]provedthatif‘](https://img.pdfslide.us/doc/110x75/5f0432117e708231d40cc905/ontheiniuenceofmessagelengthinpmacas-securitybounds-isreducedbyconstructionyasudaaspmac-with-parity23andzhangas.jpg)