Embed Size (px)
Citation preview
INVESTMENT STRATEGY
Market Currents IllustratedOctober2011
U.S. TRUST t
Fearing Fear
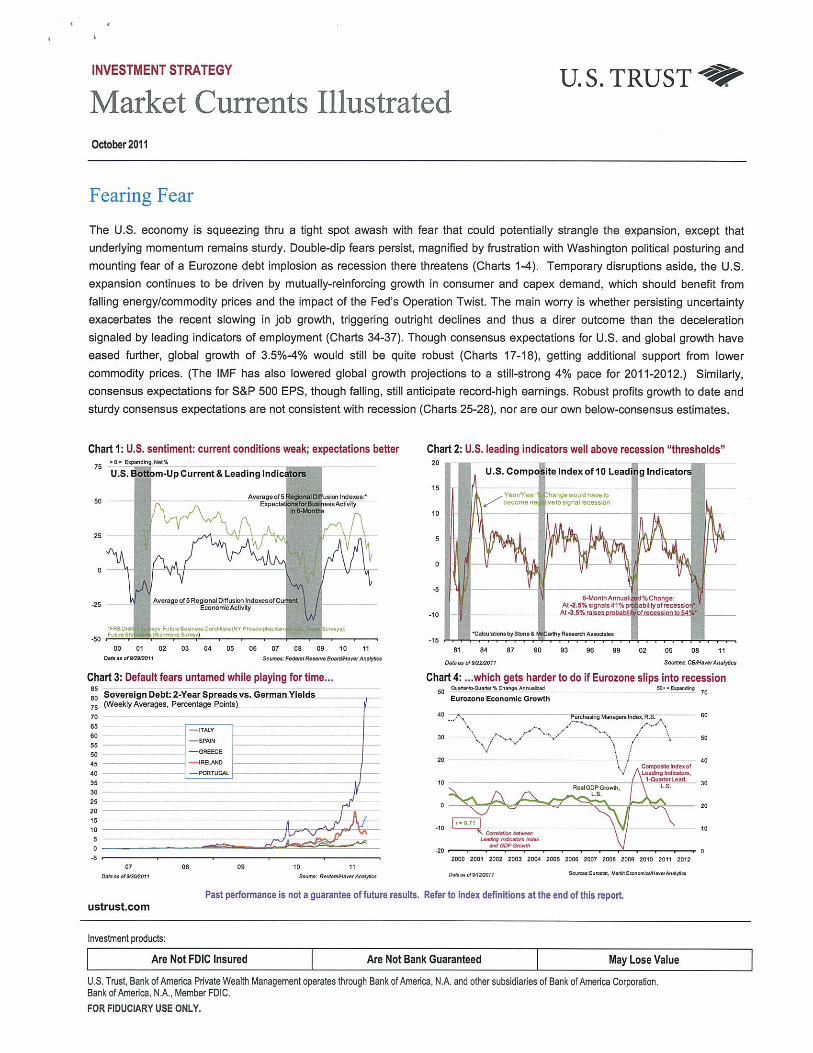
The U.S. economy is squeezing thru a tight spot awash with fear that could potentially strangle the expansion, except that
underlying momentum remains sturdy. Double-dip fears persist, magnified by frustration with Washington political posturing and
mounting fear of a Eurozone debt implosion as recession there threatens (Charts 14). Temporary disruptions aside, the U.S.
expansion continues to be driven by mutually-reinforcing growth in consumer and capex demand, which should benefit from
falling energy/commodity prices and the impact of the Feds Operation Twist. The main worry is whether persisting uncertainty
exacerbates the recent slowing in job growth, triggering outright declines and thus a direr outcome than the deceleration
signaled by leading indicators of employment (Charts 34-37). Though consensus expectations for U.S. and global growth have
eased further, global growth of 3.5%4% would still be quite robust (Charts 17-18), getting additional support from lower
commodity prices. (The IMF has also lowered global growth projections to a still-strong 4% pace for 2011-2012.) Similarly,
consensus expectations for S&P 500 EPS, though falling, still anticipate record-high earnings. Robust profits growth to date and
sturdy consensus expectations are not consistent with recession (Charts 25-28), nor are our own below-consensus estimates.
ustrust.comPast performance is not a guarantee of future results. Refer to index definitions at the end of this report.
Invesbnent products:
~ Are Not FDIC Insured Are Not Bank Guaranteed May Lose ValueU.S. Tnist, Bank of America Private wealth Management operates through Bank of America, NA. and other subsidiaries of Bank of America Corporation.Bank of America. NA., Member FDIC.FOR FIDUCIARY USE ONLY.
Chart 1: U.S. sentiment: current conditions weak; expectations betterrO- €q.ndkig.Wd%
U.S. a m-Upcurrent&Leadlngindi cm
AvngeotS ustaln4exer50 E,up for e.sAL4~ity
25
AvompofSR.ghnaIDtfu&cnlndera.olC~25 EounorrkAtbvty
‘FOe Di fute 8u,in... Ce’ateaiNV Phenupu.Rs. I 0uueyej~Futu,Sh -. iPJd,,tudSu,~.
00 01 02 03 04 05 06 07 08 09 10 11Dean .14080002 Sent F.4a4 R...v. 008044e.wM4*.
Chart 3: Default fears untamed while playing for time...Sovereign Debt: 2,Year Spreadsvs.Germanyields
,~ (Week~.Averages. Percentage Poi,tsL........7085 m: -—-———150 I0~[~ —1 ‘~ F4-~353D25201510
.5.
Chart 2: U.S. leading Indicators well above recession “thresholds”20
U.S. Camp ftc index of 10 Lead g Indicate15
YearNs., hangewouu travetoeCOfll8 2 ItO tOQtraIreC,5,iOn
10
.56.OAouthAnnu %Ch.nge:
At4.5%signaS4l%p ablttyofmcesslo
-10 ‘3.S%’omnom sajonlo -
caaubltn, byS,uu•& yR.e..d,Ancd’a.-Is
81 84 87 90 93 98 99 02 05 08 11
Oboe S. Dl 802001! Sooner ca8oe,.,.,m8~
Chart 4: ...whlch gets harder to do if Eurozone slips into recessionO.ul.*.0,fld.%CIu..oak...i.4 08’ •b’~
Eurozon. EconoiNc Growth
40 .‘.~ P..th.th,ç Ma,sgonTnd.iR.S. 60
/‘
30 ‘-sç/—~~~’/ 50
2t \-1 40/ Con,~obobb,dnot
Lndbtgba.
_______________________________________________ 1.Ow.w, sad.
10 R.boGDPGmrst, — 8 3°
.5.
0 20
.10 ———___________________________ - 10— _S.— —
— D~ 9w~-20
2000 2001 2002 2003 2004 2005 2000 2007 2000 2009 2010 2011 2012
OS” VbOH —~tEa~ &totnt.botMbuwMWØa07 08 09 It
———
Domestic Front
urCha,o-OrtyHoorte Pete
RE.
ablkuoImJubk Lb ~•Ouailer4o.QaailerMnuaEzed% Change
-2—
1~ Year4o-Y.ar%Chen~e
-4
98 06 07 08 09 10 II 12Dean &alO.goai sneseea
—12 20
-50
96 97 98 99 00 01 02 03 04 05 00 07 09 09 10 II 12
0980) aC.a.j.loano,Mrndar.k.dh.boOk a49011o989h991
at 0.Ihs.~m. iooaoa, pm. Loam SI., Vea.osc.Iy.Rot.o005 0.1.. Fed &.o91y•}
-5001 Cl~ 0-1 04 09 040 07 04 09 10 II
016w 0180498? I Soon: n-Pa FRaceow. &n.aH.neko.a
Past performance is not a guarantee of future results. Refer to index definitions at the end of this report.
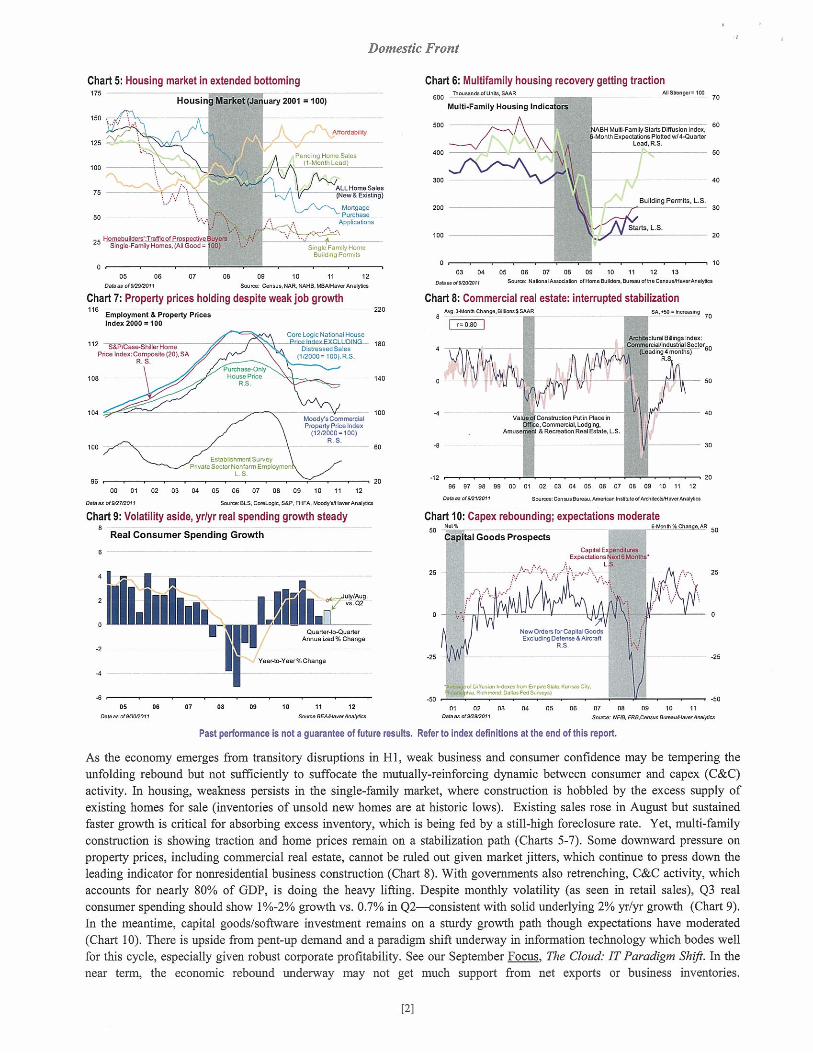
As the economy emerges from transitory disruptions in HI, weak business and consumer confidence may be tempering theunfolding rebound but not sufficiently to suffocate the mutually-reinforcing dynamic between consumer and capex (C&C)activity. In housing, weakness persists in the single-family market, where construction is hobbled by the excess supply ofexisting homes for sale (inventories of unsold new homes are at historic lows). Existing sales rose in August but sustainedfaster growth is critical for absorbing excess inventory, which is being fed by a still-high foreclosure rate. Yet, multi-familyconstruction is showing traction and home prices remain on a stabilization path (Charts 5-7). Some downward pressure onproperty prices, including commercial real estate, cannot be ruled out given market jitters, which continue to press down theleading indicator for nonresidential business construction (Chart 8). With governments also retrenching, C&C activity, whichaccounts for nearly 80% of GDP, is doing the heavy lifting. Despite monthly volatility (as seen in retail sales), Q3 realconsumer spending should show 1%-2% growth vs. 0.7% in Q2—consistent with solid underlying 2° o yr yr growth (Chart 9).In the meantime, capital goods/software investment remains on a sturdy growth path though expectations have moderated(Chart 10). There is upside from pent-up demand and a paradigm shift underway in information technology which bodes wellfor this cycle, especially given robust corporate profitability. See our September Focus. The Cloud: IT Paradigm Shtfi. In thenear term, the economic rebound underway may not get much support from net exports or business inventories.
Chart 5: Housing market in extended bottoming175
Housin Martce (.Ja uary 2001 100)
150
128 .~‘ -0~~
PendIng Honn- Sales
_____________ (l-MOnpht000)
100
_________ ALLHO.noSa______________ — - — (NSWOEdioSiiig)
MortgagePorchaso
Appocatons
25:ngtFam&vHoomBujId.ngPaoo:Io
05 06 07 08 09 10 11 12D.I... .160800)1 se: On-twa R04 WJll. aneM4a,arMe6fla.
Chart?: Property prices holding despite weak job growthlie Epit $5 ~ 220
Index 200Q • 100
Co.eLogcNatsnalHouse112 S*PC.s.-ShOe POt0T000xEXCLUDINGF me DpatraosedSalos
Price Index: Cornpo,ita (20). SA (112000 = 100(. R.SR S.
108 140
104
100 — ~E0~DichmeicSuN0y
SeclorNonlarm Ia S.
96
Chart 6: Mu tifamily housing recovery getting tractionThedfl0*dUal~0MR M19n-9sn ‘~
MuItl.FamIIy Housing mdi .*
ASH Mab#amay 81st. DM obo loOn-c 60-bAonmE,p.c0a1ocePbe0dw/4~0u8S4’
Lead R.S50
40
Building Permits, as.30
Staris. L.S. 20
0 1003 94 05 06 07 08 09 10 11 12 13
Seam. N.amdkaed.8oe 19o.6.Ida,.eo,aa49.C.rsauMen.Metpoca
Chart 8: Commercial real estate: interrupted stabilizationkeg, an .DUeea$SMR 04000 emenIno 70
1—0.80
- ragOdicgaIndeo,thalOndoafradSeclot
- 60
ye Coonan-chon Patio Ptaceh,ComSn-c16j0d0*
M,tee & Recr.shenRegt9.Iale.L.S.
so
60
2000 01 02 03 04 05 06 07 08 09 10 11 12
DaanotRtT,20n) Soase:eLS.Oe.l.05aS&P PHFA. eltadflMW..M16p191
Chart 9: Volatility aside, yrlyr real spending growth steadyReal Consumer Spending Growth
Chart 10: Capex rebounding; expectations moderate
Cap tel Goods ProspectsCepchl tenet,..
Eopflhom [eoldIOce -
[2]
Inflation Trends
Chart 12: Oil trading at low end of our $8O-$lOSIbarrel estimate125
U.S. Refiner& Acquisition Cost of Crude Oil(Ousiteoly Averages, $ Per Barrel) A
—3
0
60 65 70 75 80 85 90 95 00 05 101hwF4te00Eda~tsbd3%atelaneilcendoiarh.n’erao~ lve.coeane.oIse*flhc~ l~er1tfln’1 9,03202! bates Deesnere of ewey. 20h 44a
Chart 13: Near-term rise In food CPI unlikely to persistso
Food PricesYear-to-Year % Change
Prodocet PricesFodareed ConaamerGooda
3.Monlbtead
Chart 14: Core inflation running in 1.5% - 2% range4
2
Aveosge ol SOBer Messy,,,oIU,deoOytng ‘talon’
Ma,tetSased Coo,P~€ Deflslor
Core CPICPlexc,EooddEneooy)
- t*nsed PsI W15d ha, CPIo_a.pos.S_ I,,, Is usalaty a9 ~iMI O.oe,% io,.abrl 0.59, Oeen P.O leb Tnnon.d Mar CPI l*rrl_as 5% I osredesroslt O,,-. rose,, Peoo*w 99,s .s., 55 ire’by ,lar.flsd.obss I.A—a F5d Co., sAolwa’S Soe an Ma. ot9oeoisere .9%. llo*y W,sea~0rl
-. EstsadsPnod. Mao, In_a 115054 Is_aMa. fleaoSss I aç.nfI ieee_a, s~ye hs’
o99 00 01 02 03 04 00 05 07 05 09 10 11 12
assay 519,002005 tarot ,ve, Fe* Risen. earl WAia,A.61.,wAn.Wn
Chart 16: Market-based expectations rolling down5 Ywe-Yt.r%CIr.i, —_________________________________________ l5fl~lO0 200
Loriger-Tenn U.S. Inflation Expectation,150
Past perfonnance Is not a guarantee of future results. Refer to Index definitions at the end of this report.
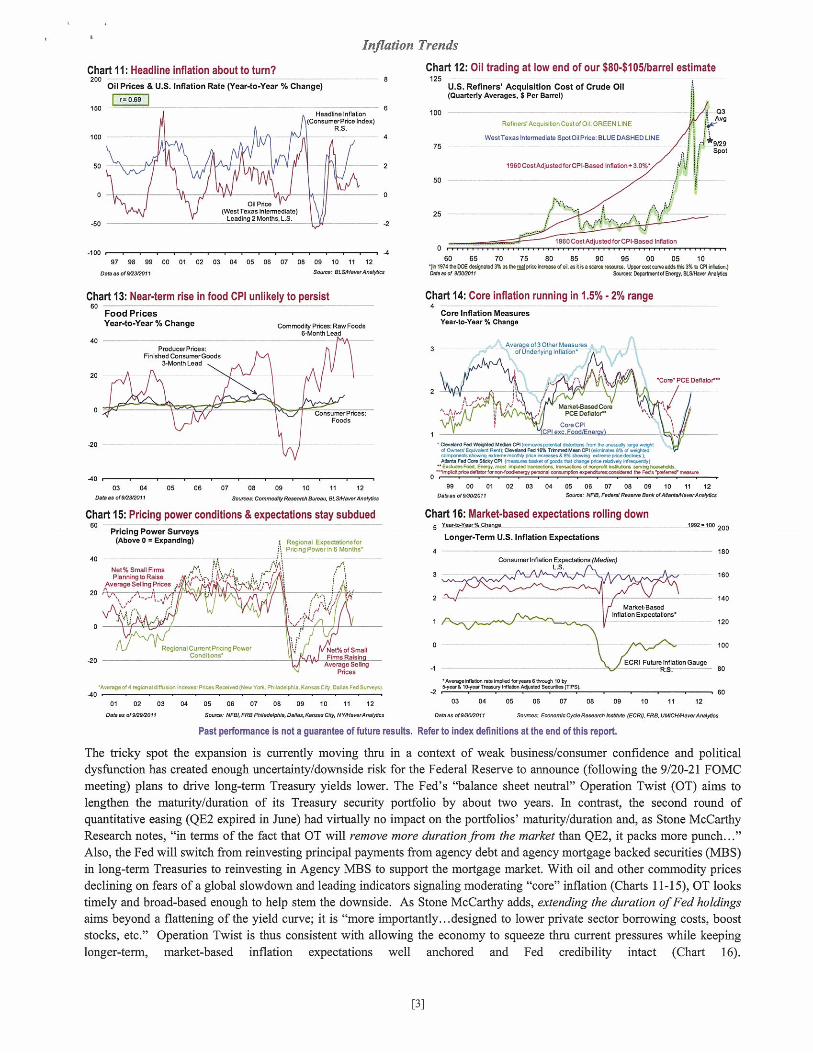
The tricky spot the expansion is currently moving thni in a Context of weak business/consumer confidence and politicaldysfunction has created enough uncertainty/downside risk for the Federal Reserve to announce (following the 9/20-21 FOMCmeeting) plans to drive long-term Treasury yields lower. The Fed’s “balance sheet neutral” Operation Twist (OT) aims tolengthen the maturity/duration of its Treasury security portfolio by about two years. In contrast, the second round ofquantitative easing (QE2 expired in June) had virtually no impact on the portfolios’ maturity/duration and, as Stone McCarthyResearch notes, “in terms of the fact that OT will remove more duration from the market than QE2, it packs more punch...”Also, the Fed will switch from reinvesting principal payments from agency debt and agency mortgage backed securities (MBS)in long-term Treasuries to reinvesting in Agency MBS to support the mortgage market. With oil and other commodity pricesdeclining on fears of a global slowdown and leading indicators signaling moderating “core” inflation (Charts 11-15), OT lookstimely and broad-based enough to help stem the downside. As Stone McCarthy adds, extending the duration ofFed holdingsaims beyond a flattening of the yield curve; it is “more importantly.. .designed to lower private sector borrowing costs, booststocks, etc.” Operation Twist is thus consistent with allowing the economy to squeeze thnu current pressures while keepinglonger-term, market-based inflation expectations well anchored and Fed credibility intact (Chart 16).
Chart 11: Headline inflation about to turn?200
Oil Prices & U.S. Inflation Rate Wear-to-Year % Change)
I r-o~° IISO 100
RolnnAcqusobonCoslotOl:0000N LINE
Weal Teoas hlsorrediere Sr,000iI Prte: SLIJE DASHED LINE
1960CosoAdjssoadlorCP~0assd IrIflabon,3.0%
.100 -‘
97 90 99 00 Dl 02 03 04 05 05 07 00 09 10 II 12
Cia a! ff0220091 Soot.: 5L54450.,MateoI
9129spa’
1960 Coo MjvslsdforCP~8esed nO.00,
ConecdibyPslcetoswFoodo6-Nodi Lead
core Inflation MeasuresYear-Year lte change
orssurnier mossFoods
40
20
.4003 04 05 06 07 05 09 10 II 12
Oaan ‘15020000 Sosyrea: Ceswnearyseaetl. betas BLMOe’.rMa4es.
Chart 15: Pricing power conditions & expectations stay subduedPricing Power Surveys
(Above 0— Expanding) Rogona: EopeclaloonllorPrcnoPoworaOIwbnths
tor, PCE o.flatr’
40
20
-20
NeO% 5,1.11 FirmsPlaInageooelse , ~ra..or’.’,
Average Selling Poses q‘-‘~
R0g0nelCunlnIPr~OrrgPyw0r Nen%oo SmallCOAdIL010 E~sEebto
AversgeS&WgPrices
A,are9044 rrgosadll’so, IrasnPrllaiReti,.OlntronYs%PsyadavPlI. KIIISC.Iy OMlaoPedS.r.ey,.40 - —
01 02 03 04 05 05 07 05 09 10 II 12
0_in ow a,a,osi Say,.: 9Ba~ FRa Phw.deWde, Pales Cars.. 099, iYY40.’wreØn
Conajr.erlnOaten Expeclallora (Median)1-s.
3 160
2 — _____________________________________ — 140Olarkefaesed
bifiaco., Expeclaoora120
O 100
ECRI Fast,, lnflaion Gauge-1 R.S.
4.eeeei, a 11~eed oors..seIne, 10 by
-2 —‘ l0,.eTrea Mace IØaad S—OWS - -
03 04 06 08 07 05 09 10 II 12
Caress 095002052 tenet E,e,oolr Code Reseaca Baa (ECRS P09, UACKNSW,MsWre
Global Context
I’ ___
2~ —— v~~l
4 N—- ‘~
.4
0’ 1)0 ltd 10 II 120.9.0 So,new.9Cøt CA5Sl~ CIG%44, SO8A~aw
Past performance is not a guarantee of future results. Refer to index definitions at the end of this repoit.
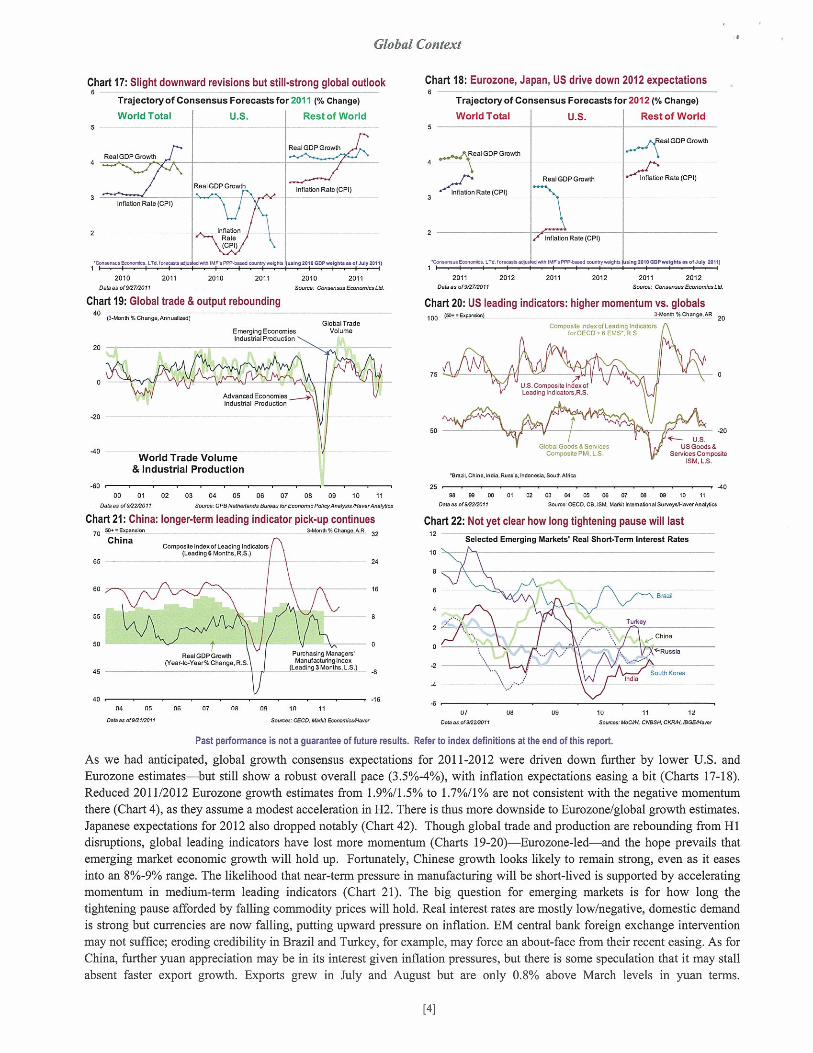
As we had anticipated, global growth consensus expectations for 2011-2012 were driven down further by lower U.S. andEurozone estimates—but still show a robust overall pace (3.5%-4%), with inflation expectations easing a bit (Charts 17-18).Reduced 2011/2012 Eurozone growth estimates from 1.9%/I .5% to I .7%il % are not consistent with the negative momentumthere (Chart 4), as they assume a modest acceleration in H2. There is thus more downside to Eurozone/global growth estimates.Japanese expectations for 2012 also dropped notably (Chart 42). Though global trade and production are rebounding from Hidisruptions, global leading indicators have lost more momentum (Charts 19-20)—Eurozone-led—and the hope prevails thatemerging market economic growth will hold up. Fortunately, Chinese growth looks likely to remain strong, even as it easesinto an 8%-9% range. The likelihood that near-term pressure in manufacturing will be short-lived is supported by acceleratingmomentum in medium-term leading indicators (Chart 21). The big question for emerging markets is for how long thetightening pause afforded by falling commodity prices will hold. Real interest rates are mostly low/negative, domestic demandis strong but currencies are now falling, putting upward pressure on inflation. EM central bank foreign exchange interventionmay not suffice; eroding credibility in Brazil and Turkey, for example, may force an about-face from their recent easing. As forChina, further yuan appreciation may be in its interest given inflation pressures, but there is some speculation that it may stallabsent faster export growth. Exports grew in July and August but are only O.8°~ above March levels in yuan terms.
[4]
Chart 17: Slight downward revisions but still-strong global outlook
Trajectoryof Consensus Forecasts for 2011 @~ Change)
World Total Rest of World
Chart 18: Eurozone, Japan, Us drive down 2012 expectations
Trajectoryof Consensus Forecastsfor 2012(54 Change)
World Total .5. Rest of World
ReaIGDPGrowSnReaiGDPG.twt
: ~ Rn’inOaoon Role (cPi~
InflaOo,Ral.(CPI)
2 — - ._. ...Rala(CPI)
te,isaaEoa,o,*. Lt0IOncS .eIMP..na.d0000neflln .,.1m01!80DPea~~~!J.fl1V
RealGDPGmwth4
alGDPOarowth
ReaIGOP040wOl ~LOO0ROl.(CPl
1100400 Role (CPI)
coososs#oma..LT4Iona* e.I.FPIOlestooo..410. .Ing201~009..e1Ø0onelJdy 24111
2011 2012 2011 2012 2011 2012bathes sf80712011 2090,: C&innoj. 2oaw.~LlL
Chart 20: US leading indicators: higher momentum vs. globals100 p4..E.awaon 340an0%Ch.1&dR 20
CompoIlle l140xolLaod:ng Indalorslo.OECD’6EMS~RS.
Mvar.cod Economiesiridos11al Pmduclion
Wofld Trade Volume& Industrial Production
USCompos4aln~olaadinglndtaIols.RS.
2010 2011 2010 2011 2010 20l1DaIses o1807120I1 Sonon. Coonns,o 82.nanlo,Lil
Chart IS: Global trade & output rebounding40 fl48ooth%C4e~,,Mndl
GlebalTradeEmerging Economies VolumelndusljlalP,odu080n
20
0
-20
-40
4000 01 02 03 04 05 06 07 08 09 10 II
Oath.. 0(8020011 So.ot.: CPa tktaaOaf.dl thotas IOC000OIn*POISWM8&UaFtoan≠AsU,4m
Chart 21: China: longer-term leading indicator pick-up continues70 ~ .p.a.lnn 349a,%che,a,.&R. 32
chinaComposdo lndesof Leading lnds
(L,adIsoSMonths.RS.)65 24
60- —— —— Is
55 8
50 0R.alGOPGrov.44 PothaangManagara
CVoar4o-Yaar%COrnnge.R.S Manufxbte0lMex
___________________________________________ Ilesding sMooths t.s
45 — _________ _____________
40 . - .1804 06 416 07 09 10 11
CaAas 0(912 112011 Saotn: 04C0 44.40 000no&eslosr
-~
GlobalGoods& SonscenCoxnnposdoPMlLS
~paa 091,. bla..RauILlndon,aI..80081N01.
-t 9.4-~ US~pJ’ Us000ds&
SaMoa Compost.IS IS.
.402598 0, 60 01 02 ~ 04 09 09 07 60 09 ‘0 II
Dan. a(8020011 0n,na: 0600 08. 1104 9.41 lsthmalaesaSsnsy.M.wMdfla
Chart 22: Not yet Clear how long tightening pause will last12 selected Emerging MarketW Real short.Tennn Interest Rates
10 —
Top-Down/Bottom-Up Consensus Views
Chart 23: Growth trajectory slower but still upward boundConsensus Expectations for U.S. Growth & inflation(% Chg. vs. Previous Quarter, Annualized Rate)
5
— — —~ Roel0DPGmv~
-2
.4 —-
-0
--
InflabonConsurnetPAce Inten)
4
07 00 10 II 12-10
pass arrnnv2ola Ch~EconOmkkIdcanatA,. C* Finead.Watea*
Chart 25: Q2 profits revised up; no profits recession in sight50 3
Corporate Pr
Eamlega ASnn.Dedn ~(orTop 30004000 Coon
Lcng.TermAvg S. R.S.
Y.arlo-YearGsa*,le PefAa.L-S
0.IeaOaamanaO t.c.insalghra.rnle~tlanaa. .eabn..mb.ia(cOa.__!w_*.a h0.,wflole....Oal aIn~O
.40 owpa,ka..Ø~0ss. aaibI.~.a.p.. CouaydTh S.d40a.ap%LtC C05 88 91 94 97 00 03 05 09 12
Dan c15880910 Soon.: 804. Th.La.Ni0160mnLLC44nrMd%a
Chart 27: 2011 GDP profit growth upwardly revised; S&P downwardly40 Consensus Estimatesfor CorporateProfits Growth %Chang•)
CY2O1I CV 2012
%A s.psoon.EPS
OpernangEPS
Chart 24: Fed on hold thai mid-2013; dollarflat12
Consensus Expectations (Quafledy Averages)
10 90FRI Majorcsnmncy
T,sdeWe~h(edOoUa,(Indan 3173a100. R Scale)
so
20
50
oat. at 100i200 Soon St. cA*FleaonwFo,5
Chart 26: Earnings revision factor turns negative40% 105
Earnings Revision Factor for 5 P 500 EPS~
20% ———— __________ — — 100
0% A SsPS000omlngsRenislonFecIce
90) U.S Trsd.W.igIaladPobr
RS.
OS
-60%- — —80
—1~10 —.an: I~d~~~aSa.hqooay3*ll — — 2012. -
2009 2010 2011OdIn &9%~fl Senat9te~.,&.ey 5.01.88 Thawe,a,nao JP 56554 a. Anon.
Chart 28: UST 2011/2012 estimates 5%!14% below consensus levels120
consensus Estimates for S&P 500 OperatIng EPS (SlShare)
cY2oll CY2012
100
aoDa4JpConanaSExpecWin.s
Eapec~0oin
U.S. Trust TopOewaiRang. Estinste: $22- $95
2001
Dan tl*11
Past performance Is not a guarantee of future results. Refer to Index de Itlons at the end of this report
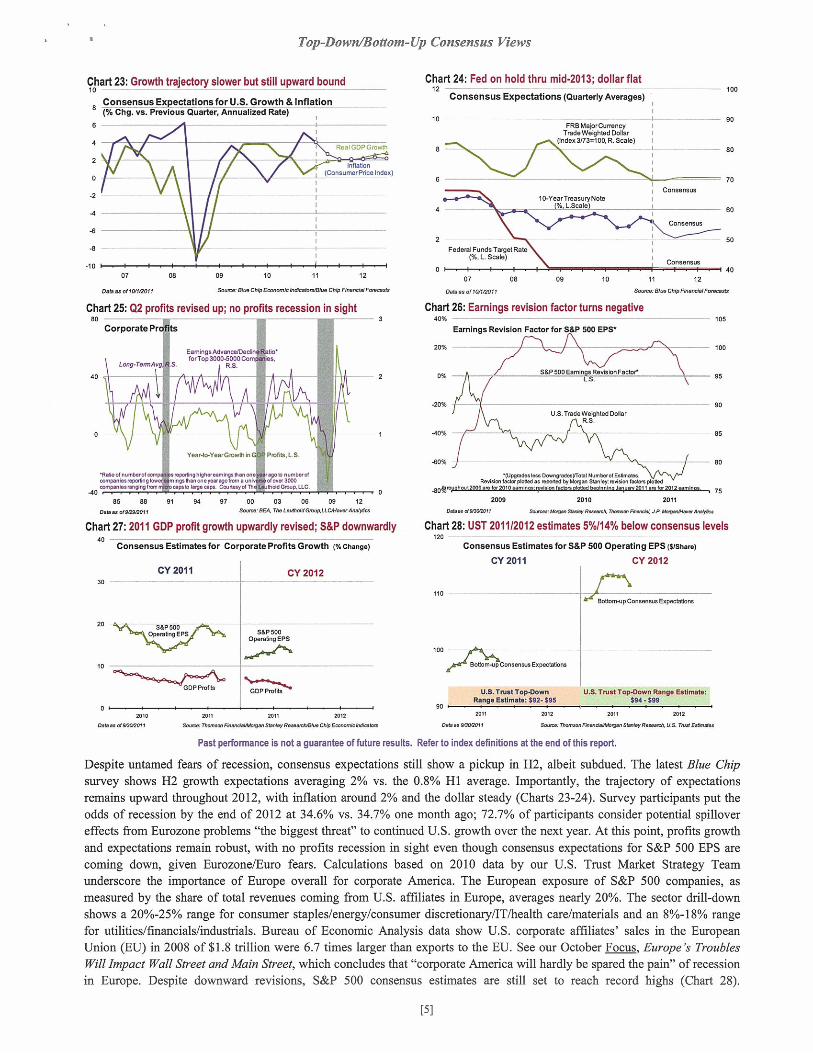
Despite untamed fears of recession, consensus expectations still show a pickup in 112, albeit subdued. The latest Blue Chipsurvey shows H2 growth expectations averaging 2% vs. the 0.8% Hi average. Importantly, the trajectory of expectationsremains upward throughout 20 i 2, with inflation around 2% and the dollar steady (Charts 23-24). Survey participants put theodds of recession by the end of 2012 at 34.6% vs. 34.7% one month ago; 72.7% of participants consider potential spillovereffects from Eurozone problems “the biggest threat” to continued U.S. growth over the next year. At this point, profits growthand expectations remain robust, with no profits recession in sight even though consensus expectations for S&P 500 EPS arecoming down, given Eurozone/Euro fears. Calculations based on 2010 data by our U.S. Tnist Market Strategy Teamunderscore the importance of Europe overall for corporate America. The European exposure of S&P 500 companies, asmeasured by the share of total revenues coming from U.S. affiliates in Europe, averages nearly 20%. The sector drill-downshows a 20%-25% range for consumer staples/energy consumer discretionary/IT/health care/materials and an 8%-i8% rangefor utilities/financials/industrials. Bureau of Economic Analysis data show U.S. corporate affiliates’ sales in the EuropeanUnion (EU) in 2008 of $1.8 trillion were 6.7 times larger than exports to the EU. See our October Focus. Europe ~ TroublesWit/Impact Wall Street and Main Street, which concludes that “corporate America will hardly be spared the pain” of recessionin Europe. Despite downward revisions, S&P 500 consensus estimates are still set to reach record highs (Chart 28).
8—
100
80
70Consensus
007 08 09 10 11 12
- Consenan40
2019Dan W920h2001
2010 2011 2012
0o&.se: ThaanoA,ndaSbs.oSa.*ylbnadoet.CA*Ena.i*”*.b,
U.S. Trust Top-Down Range EatImata:
3*12 2010 3*12
— Thasn.~nda46fln5sI.s-a% ——
[5]
Tracking (I.e Expansio
Chart 29: Expansion under pressure: 40% of states down; 60% upN.dD50iRfl.afdlE0c0~ff1icTh1i19Mod.t 120
(Band ConI.srnaoaod bides c4 sid Econ bidtal&s)
4080 83 86 89 02 05 96 01 04 07 10
oases of 6*80001 0808.~Nad0..aAh.PIdWp5bP.dHcoeM.b0a
Chart 31: Rebound underway despite weak confidence15
-20
Rnl Gross Domestic Product & Indusutsl Productionr-sn (Ouart.r4o-Ouavtar % Change. Mnusllood)
100
Chart 33: Worrisome private job growth deceleration: short-lived?Payroll Employment(3-Month % Change, Anmiallz.d)
10
-1000 01 92 03 04 05 08 0? 98 90 00 01 02 03 04 05 06 0? 08 09 10 11 12 13 14 15— 01622000 taSLMlaesrMa4lco
Past performance is not a guarantee of future results.
Chart 30: Recession odds <20%; Chicago gauge above threshold50-Ahoy. Tend Gs,oth:d0 -BdosTisndcoean, O-R0000UnISabTslO— RacaooyUkaay
Sta oftheU.S.Econ- yB — -. —100
Nod Day’s Rosoo,chRecession ProbabUy
s k~d,(5,st~_y’1 7550-Shoe Co~scideinEconomicActody Indexes
RS.
-2
-4 -8084 90 95 02 08
008ea 019082005 SosocernedDe,4d R.na,00, Fede,oERnirws Book of OOlcaçeWos.,Mo4eoa
Chart 32: Inventory investment may temporarily become a drag20 Not% 3sAo.9n0480500An.*o.. 30000101000ng.B1IIo,50%SA 30
Manufacturing Inventories NamnaIMayoIadunn9Iyy’eyy’nesRS
20
AvoogeoliSMManstockalno&Nonnyasnstsdo
Omplsym.nt IndexesLeadin9 3 Months fl.S.)
91 94 9? 00 03 06 09 12Socoes tops. 8L844.y.’An.44a080a8001620001
Refer to index definitions at the end of this report.
-10
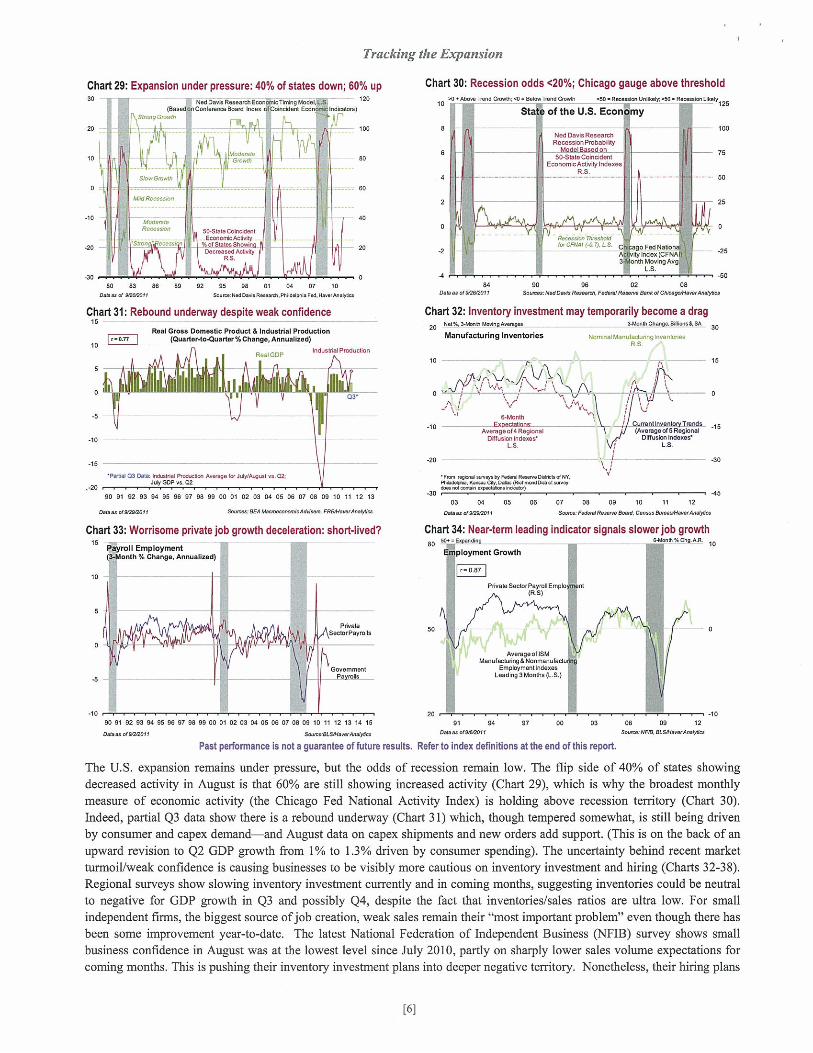
The U.S. expansion remains under pressure, but the odds of recession remain low. The flip side of 40% of states showingdecreased activity in August is that 60% are still showing increased activity (Chart 29), which is why the broadest monthlymeasure of economic activity (the Chicago Fed National Activity Index) is holding above recession territory (Chart 30).Indeed, partial Q3 data show there is a rebound underway (Chart 31) which, though tempered somewhat, is still being drivenby consumer and capex demand and August data on capex shipments and new orders add support. (This is on the back of anupward revision to Q2 GDP growth from 100 to 1 .30o driven by consumer spending). The uncertainty behind recent marketturmoil/weak confidence is causing businesses to be visibly more cautious on inventory investment and hiring (Charts 32-38).Regional surveys show slowing inventory investment currently and in coming months, suggesting inventories could be neutralto negative for GDP growth in Q3 and possibly Q4, despite the fact that inventories/sales ratios are ultra low. For smallindependent firms, the biggest source of job creation, weak sales remain their “most important problem” even though there hasbeen some improvement year-to-date. The latest National Federation of Independent Business (NFIB) survey shows smallbusiness confidence in August was at the lowest level since July 2010, partly on sharply lower sales volume expectations forcoming months. This is pushing their inventory investment plans into deeper negative territory. Nonetheless, their hiring plans
[6]
sio~o 070alk
LEd P0100200
Mddd*ioPoceosce
000
50-SlascoknddedEcnooonicAc&s4~t~i~~Ls~0
Decreased —RE.
50
25
-25
Rsce&seflontooff~CFNN(.01~LS. C oFodNako
tylndex(CFNA3 nthMovingAvg
IS.
10
-5
-10
-15
10
6-MonthExpeclM100t
Aneisge ofdRegionalDofuasin md ess
LS~
-20
5th4 Proaauei Avorsi no, Jo4IAugoaI ss. 023InOOes02
90 91 92 03 04 95 56 0? 08 90 00 01 02 03 04 05 06 0? 08 09 10 11 12 13
Oslo.. 4(5*00071 soLoist 854 Moon00000,*Asldnit FR80400.,M9Wis
15
-15
441
Cunrenhlnvenloryjiends(Av8o59.&SReolooaJ
001sisho, bidens1-5-
‘I~FJnon iM .80.05W FeaeaR..096 n(n4YPsadedSe. Esisee dy. Ode G°uds.a.d09000055w
5°°’~ °‘~~ .
03 04 05 06 0? 05 09 10 11 12Dies as cfa*5*041 sncos. P.deWR.a.n. 00.4. Canon essecOOaswAq.ea
Chart 34: Near-term leading indicator signals slower job growth~ °°~~°~° _________________ ______________ s0_tr~2’o4~ 10
ployment Growth
PdvaleSeclsrPaymsEmplo no(PS)
P,*,anoSedan Payrolls
Govemmeaneayreds
Tracking the Expansion - Continued
Chart 35: Current employment uptick; expectations moderate50
Reglo al urveys: Employment Trends &
Avei.g.R ~EO6r nb,derEmpioym.ntEi IBMo,9,s Net
-5000 01 02 03 04 05 06 7 08 09 10 II 12
099nW5*9&Ol1 69.9. PflSTh4e.,cMU,Cc.
Chart 37: Small finns: firmer job plans despite lower optimism in Aug.40 PrIvat, sector Employment -Small In d nt Firms
%ofSo,ailndepend.NF wrn.Oneo, Joe. n.L Scale
.60
LiNEkbnute~j,*ig(NM 1909.8199)
04 05 09 10 110.anoOsllOOIl 8oup9.6t~M.,wMm1a
Chart 38: Claims downtrend re-entering “sticky” period700 ~ 9b.IIQAO*lsejbC..9eWL85A 250
I I
pon~n~tRaWI. R. Scab
Mons.flvng.ofWnk~ Initial Unetnploymeil
bn,umnceC~Imt, IS
TolalAnnounc.aJob Cuts3-Mont,tead.RS,
200
150
100
50
-~ lace oIsn%cOWeeølenbutilumensn9.c4-10 0
01 02 03 04 05 06 07 06 09 10 11
Dale ct5fl0901 369506 P#S BLS.040.rM.44c.
Chart 39: Flight-to-safetylOperation Twist benign for deficit financinga h,1949c6e 16
F I Budget DeficIt & Interest spreadsnlhFedetMBudgeOS
S otNome.P.eio --12
0 —— — _________ —--—~ —
-209 (0 01 02 02 04 06 06 07 96 09 10 11
Dales. USD02012 SnawR,ce,e FRa44at.rMeI$c.
Past performance Is not a guarantee of future results. Refer to index definitions at the end of this report.
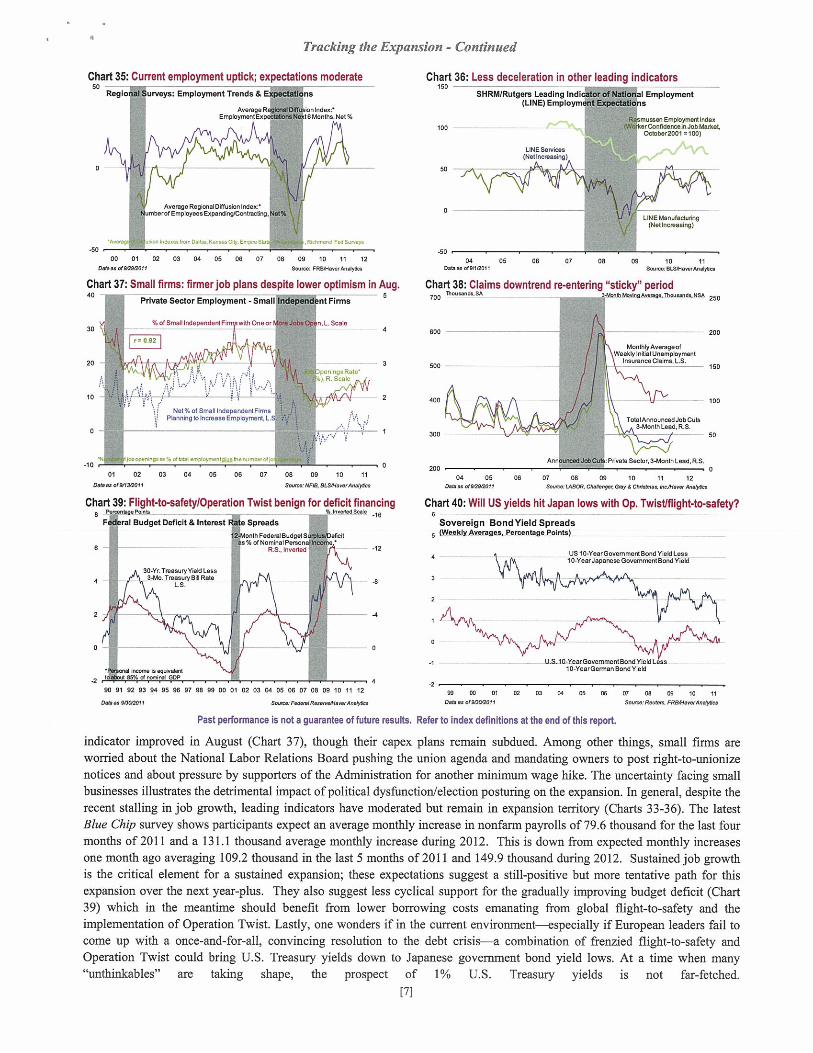
indicator improved in August (Chart 37), though their capex plans remain subdued. Among other things, small firms areworried about the National Labor Relations Board pushing the union agenda and mandating owners to post right-to-unionizenotices and about pressure by supporters of the Administration for another minimum wage hike. The uncertainty facing smallbusinesses illustrates the detrimental impact of political dysfhnctionlelection posturing on the expansion. In general, despite therecent stalling in job growth, leading indicators have moderated but remain in expansion territory (Charts 33-36). The latestBlue Chip survey shows participants expect an average monthly increase in nonfarm payrolls of 79.6 thousand for the last fourmonths of 2011 and a 131.1 thousand avenge monthly increase during 2012. This is down from expected monthly increasesone month ago averaging 109.2 thousand in the last 5 months of 2011 and 149.9 thousand during 2012. Sustained job growthis the critical element for a sustained expansion; these expectations suggest a still-positive but more tentative path for thisexpansion over the next year-plus. They also suggest less cyclical support for the gradually improving budget deficit (Chart39) which in the meantime should benefit from lower borrowing costs emanating from global flight-to-safety and theimplementation of Operation Twist. Lastly, one wonders if in the current environment—especially if European leaders fail tocome up with a once-and-for-all, convincing resolution to the debt crisis—a combination of frenzied flight-to-safety andOperation Twist could bring U.S. Treasury yields down to Japanese government bond yield lows. At a time when many“unthinkables” are taking shape, the prospect of 1% U.S. Treasury yields is not far-fetched.
Chart 36: Less deceleration in other leading indicators150
SHRMIRutgers Leading IndI of Matte Employment(LINE) Emplo t a
ne, Om*ynset Index100 (W tCOnfdaftaklJObIlalket
Octbet200l alD0)
II4ES.reicae(NeIb09651bg)
50 -~, ji
~VAe.e~. R.ge.&Diffunionindex:
umberofEmpbyae9C~ardn9lCoibec6ng. •l%
- — tile.. frle CIte. K99,flC~b. E’,on cIa
‘It
30-Yr TressuryOleldIe3-94o inscayB Pale
Is
88~ le .qtInMaa
00 91 92 03 04 05 06 07 08 9900 01 02 03 04 05 06 07 08 09 10 11 12
Dale — 520209$ SeSttFIda&R1451446.atAtnatJct
Mnd.~ P,lvateS.cbr3-Montht.ad.RS200 0
04 05 06 07 08 00 10 11 12Dale as USD9203, SeAn tA9Dt 0.4Mg.c Gin, I CMabne b.cA#a,vAn.c,
Chart 40: Will US yields hit Japan lows with Op. Twistlflight-to-safety?Sovereign Bond Yield Spreads~lVeekly Averages. Percentage Points)_____________________________
US 10-YearGov6mmoNBond Yleb Less
-2
U.&10-YearGovemrr.ntBond19s~I. S10-YesrGeern.nBoredYItd
[7)
Japan Watch
50
25
130
120
‘ID
100
90
80
70
60
Le~mg I,dicotoco~ ~ LCoriiposile Index of
RB.
Japan Consumer & Production indicators
Consu,TerConI~~:0U5OR.S
25
-25
200
900
900
700
800
500
400
300
0a0.noIwImoll
2Ol2GroWti
2011 b~0aton
2048,flafion
2011
2011 Growth
2012Sow,.: C.co.n.j, EcoocoutcoLK
MobrVehI,Ie~adaProducton R.S
7/Panong.rcarProduclion,R.S
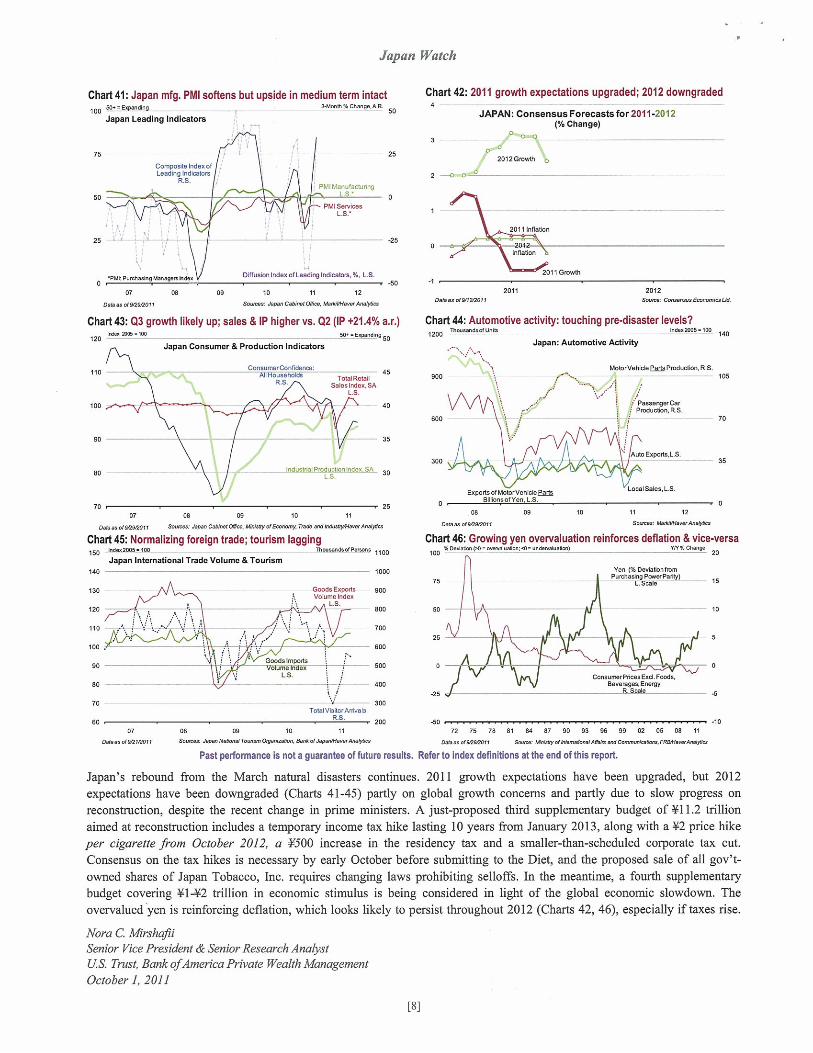
Japan’s rebound from the March natural disasters continues. 2011 growth expectations have been upgraded, but 2012expectations have been downgraded (Charts 41-45) partly on global growth concerns and partly due to slow progress onreconstruction, despite the recent change in prime ministers. A just-proposed third supplementary budget of ~1 1.2 trillionaimed at reconstruction includes a temporary income tax hike lasting 10 years from January 2013, along with a Y2 price hikeper cigarette from October 2012, a 1~500 increase in the residency tax and a smaller-than-scheduled corporate tax cut.Consensus on the tax hikes is necessary by early October before submitting to the Diet, and the proposed sale of all gov’towned shares of Japan Tobacco, Inc. requires changing laws prohibiting selloffs. In the meantime, a fourth supplementarybudget covering ~l42 trillion in economic stimulus is being considered in light of the global economic slowdown. Theovervalued yen is reinforcing deflation, which looks likely to persist throughout 2012 (Charts 42, 46), especially if taxes rise.
Nora C MirshafIiSenior Vice President & Senior Research AnalystUS. Trust, Bank ofAmerica Private Wealth ManagementOctober 1, 2011
Chart 41: Japan mfg. PMI softens but upside in medium term intact100 ~,.u’d,o 5.Mcne%C1,s,g..&R.
Japan Leading indicators
Chart 42: 2011 growth expectations upgraded; 2012 downgraded
JAPAN: Consensus Forecasts for 2011-(% change)
afusion Index ofLeadolg Indicau,s.%. LB.
07 06 09 10 Ii 12
0,bm of 9292001 Soa,w Japan Cab*,a2 Deco, 0ap88981m,An.48co
Chart 43: Q3 growth likely up; sales & IP higher vs. Q2 (IP +21.4% as.)120 Ia09—lm 50.—E,~.ndIns50
110 45TolaIRela,
Saleo Index BALB.
70 . . 2507 08 09 10 11
Diem 019392011 Boetie- Jlpa$ C.~sDex~ I.9By of Economy, nsa. and Si kiepDfaxtrAodtca
Chart 45: Normalizing foreign trade; tourism lagginghtdll2O05~l00 Tho...cdsxOPSilO09 1100
Japan international Trade Volume & Tourism140 1009
Chart 44: Automotive activity: touching pre-disaster levels?1200 1ose,d$dUniS 91dm5105100 140
Japan: Automotive Activity
900 105
0Expolla of Motor VehIcle Eaoto
flIhnowaIVm, IS
Auto ExpolaLS.
LocaIBaIea.L.S.
08 09 10 11 12
100
Diem 0$ 5292011 $001010: 0.lanam.M.Øeo
Chart 46: Growing yen overvaluation reinforces deflation & vice-versa
0
75
50
20
25
15
ToIaIViaiIotArifvebRB.
10
-25
07 08 09 10 11Diem ox as 0120Sf Snnnir Japan N.lnn Tmalnm OpaIzneon, 8sWo.dJ.panl4.vwM.5t~o
Past perfomianca is not a guarantee of future results.
0
-6
72 75 78 81 84 87 90 93 98 99 02 05 08 11
Deem of 9’18001 I Swap. OloIay of 0.onelnml L~ oId Cm.,,ife.06,e 10800.nwAIahee
Refer to Index nitions at the end of this report.
-10
CONCEPTSIDEFINITIONSSecurities Indexes assume reinvestment of all distributions and interestpayments. Indexes are unmanaged and do not take into account fees orexpenses. It is not possible to Invest directly in an index.Conference Boards Coincident Index: composite of nonfami payrolls, real personalincome less transfer payments, industrial production, real manufacturing trade sales.COLA is a Cost of Living AdjustmentCPI is the Consumer Price IndexThe Dow Jones Global Indexes (DJGI) real time international equity indexes (world,regional, country, economic sector, market sector, industiy-group, subgroups.EMs refers to Emerging MarketsFOMC: Federal Open Market Committee - makes decisions on official interest rates.FRB Chicago National Actvity Index: This proxy for U.S. GDP is the broadestmonthly index of national economic activity containing 85 indicators. Above0=Above Trend Growth; 0=Trend Growth. Below @Sub-frend Growth
IMF: International Monetary FundPMIs: Purchasing Managers Indexes based on World Bank’s GDP country weights.Manufacturing PMI covers 26 countries (83% of factory ou~ut); Services PM covers11 countlies (60% of services activity). Advanced economies & EMs represented.Leading Indexes signal activity 3-6 months ahead (factory orders, average weeklyhours, vendor performance, initial unemployment claims, building permits, moneysupply (M2), consumer expectations, stock market prices, interest rate spreads).
U.S. TRUST tBank of America Private Wealth Management
LIBOR: Dollar based London Interbank Offered RateL.S.: Left scale.National Federation of Independent Business Small Business Optimism Index:Reflects sentiment on key aspects of business conditions.OECD Index of Leading Indicators is a composite of data for 30 member countriesproviding advance signals of changes in economic activityPhiladelphia Fed Diffusion Index nets out monthly changes in aclivity among 50states. Based on nonfarni payrolls, unemployment rate, average hours worked inmanufacturing and wages and salaries.Pps refers to Percentage PointsRefiners Acquisition Cost of Oil: Weighted composite of domestic and imported oiprices, includes transportation costs + other fees. Effective price of oil in U.S.R.S.: Right scale.S&PICase-Shiller Home Price Index tracks housing prices for 10 or 20 key marketsStandard & Poo~s 500 Index tracks stock prices for 500 US companiesTIPS definition: Bloomberg’s real yield benchmark for Treasury Inflation-ProtectedSecurities (TIPS) is an unmanaged index calculated from the yield of the current on-the-run TIPS bond of a selected, stated maturityTrade-Weighted Dollar Index: Reflects the dollar’s international value against abasket of currencies, weighted according to bilateral exportsAmport flows.
This report is provided for informational purposes only and was not issued in connection with any proposed offering of securities. It was issued without regard to the specificinvestment objectives, financial situation or particular needs of any specific recipient and does not contain investment recommendations. Bank of America and its affiliates do notaccept any Ilabiity for any direct, indirect or consequential damages or losses arising from any use of this report or its contents. The information in this report was obtained fromsources believed to be accurate, but we do not guarantee that it is accurate or complete. The opinions herein are those of U.S. Trust, Bank of America Private WealthManagement are made as of the date of this material, and are subject to change without notice. There is no guarantee the views and opinions expressed in this communicationwill come to pass. Other affiliates may have opinions that are different from and/or inconsistent with the opinions expressed herein and may have banldng, lending and/or othercommercial relationships with Bank of America and its affiliates. All charts are based on historical data for the tine period indicated and are intended for illustrative purposes only
This publication is designed to provide general information about economics, asset classes and strategies. It is for discussion purposes only, since the avalability andeffectiveness of any strategy are dependent upon each individual’s facts and circumstances. Mways consult with your independent attomey, tax advisor and investment managerfor final recommendations and before changing or implementing any financial strategy.
Other Important Information
Past performance is no guarantee of future results.Equity securities are subject to stock market fluctuations that occur in response to economic and business developments.Investing in fixed income securities may involve certain risks, including the credit quality of individual issuers, possible prepayments, market or econon~ic developments and yieldsand share price fluctuations due to changes in interest rates. When interest rates go up, bond prices typically drop, and vice versa.International investing involves special risks, including foreign taxation, cunency risks, risks associated with possible differences in financial standards and other risks associatedwith future political and economic developments.Investing in emerging markets may involve greater risks than investing in more developed countries. In addition, concentration of investments in a single region may result ingreater volatility.Stocks of small and mid cap companies pose special risks, including possible liquidity and greater price volatility than stocks of larger, more established companies.There are special risks associated with an investment in commodities, including market price fluctuations, regulatory changes, interest rate changes, credit risk, economicchanges, and the impact of adverse political or financial factors.Investments in real estate securities can be subject to fluctuations in the value of the underlying properties, the effect of economic conditions on real estate values, changes ininterest rates, and risks related to renting properties, such as rental defaults.Asi investment in a hedge hind involves a substantially more compicated set of risk factors than traditional inveslmenls in stocks or bonds, including the risks of using derivatives,leverage, and short sales which can magnify potential losses or gains. Restrictions exist on the ability to redeem units in a hedge hind. Hedge hinds are speculative and involve ahigh degree of risk.This report may not be reproduced or distributed by any person for any purpose without prior written consent.
02011 Bank of America Corporation. MI rights reserved. I ART6B3N5 09/2011