Embed Size (px)
Citation preview
MARKET CITY AND THE WA HORTICULTURE VALUE CHAIN
Stephen Ward
CEO Perth Markets Limited
16th August 2018
CONTENTS
Stephen Ward, CEO Perth Markets LimitedAugust 2018
The Horticulture Industry Value Chain in WA.• Value Chain Participants, and Market Changes over the Last 2 Years
• WA Grown Produce
• Exports
• Economics and Demographics
The Market City Complex• Key Statistics & Facts
• Market City Competitive Strategic Position
• Corporate History
• Transition from Government Ownership
• Financial Results
• New Cool Chain Warehouse and Site Development
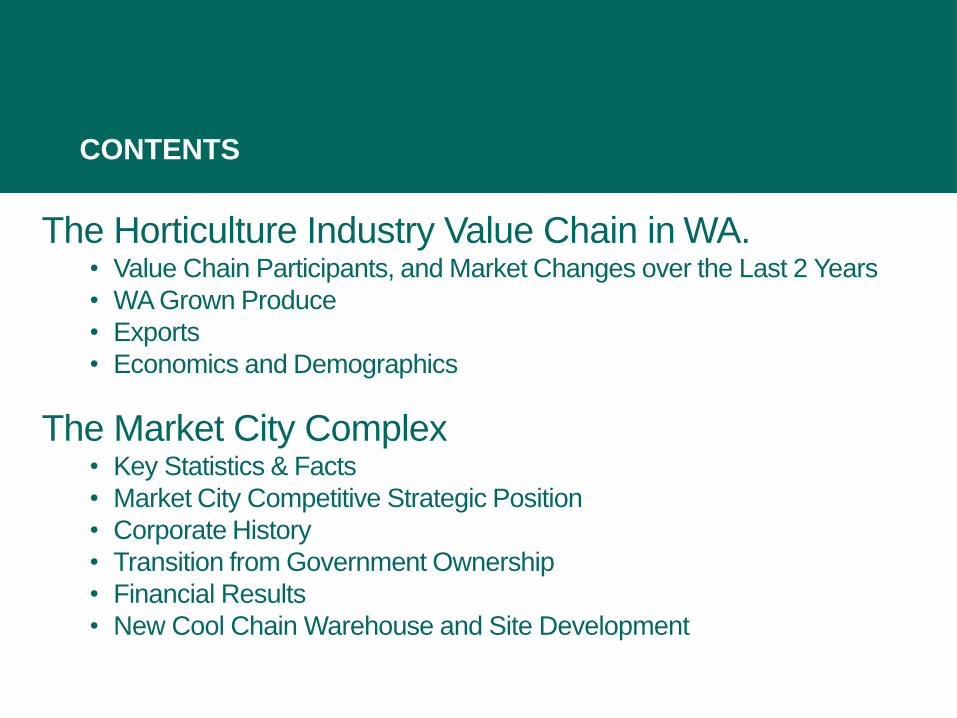
Perth Markets Limited (PML) has commissioned independent research group
freshlogic to map and define the total WA Horticulture Market. This includes
determining the wholesale market share of tenants operating from the Market
City site.
The analysis was undertaken for the year ending 30 June 2017 and 2018 and
has been undertaken since 2011 giving 8 years of consistent data.
WA HORTICULTURE VALUE CHAIN
• The total WA market volume increased but value decreased marginally over the two years in review with a number of +ve & -veevents effectively almost balancing out at a State level.
• This indicates that fruit and vegetable volumes increased marginally more than market values for the years in review.
• The WA wholesale market is now marketing an additional 12-14,000 t of avocados per annum. At the national avocado wholesale price of $5.50 per kg that is generating an additional $66 - $77 million in wholesale value annually.
• Pest & disease challenges led to constraints for interstate exports. This left more product in the WA market and combined with improving Carnarvon output to increase supply and pressure down wholesale prices.
KEY FINDINGS
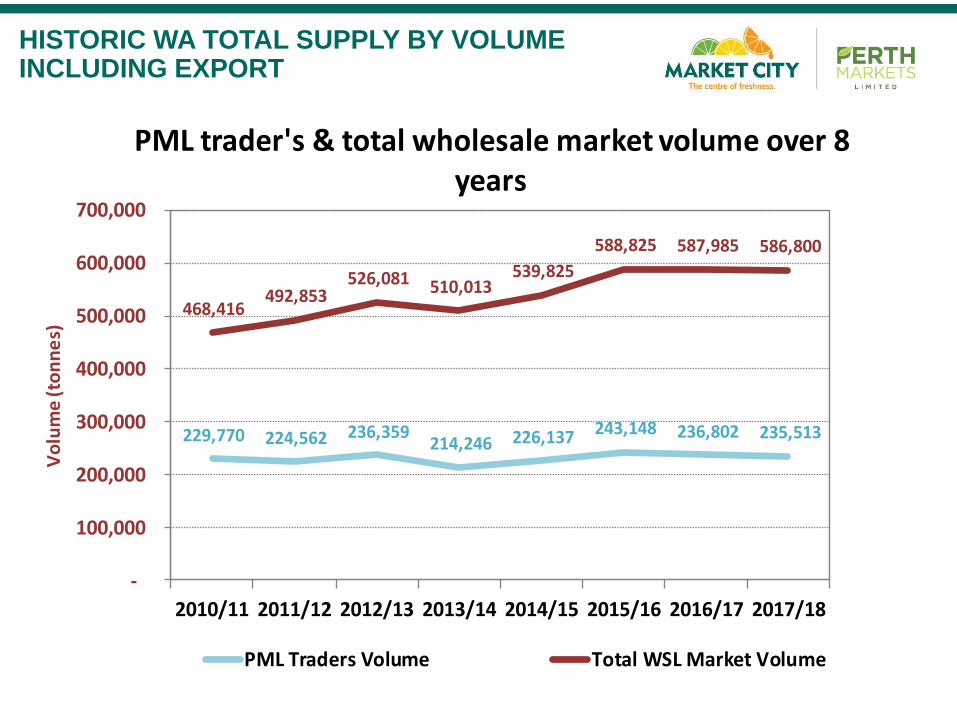
HISTORIC WA TOTAL SUPPLY BY VOLUME INCLUDING EXPORT
229,770 224,562 236,359 214,246 226,137 243,148 236,802 235,513
468,416 492,853
526,081 510,013 539,825
588,825 587,985 586,800
-
100,000
200,000
300,000
400,000
500,000
600,000
700,000
2010/11 2011/12 2012/13 2013/14 2014/15 2015/16 2016/17 2017/18
Vo
lum
e (t
on
ne
s)
PML trader's & total wholesale market volume over 8 years
PML Traders Volume Total WSL Market Volume
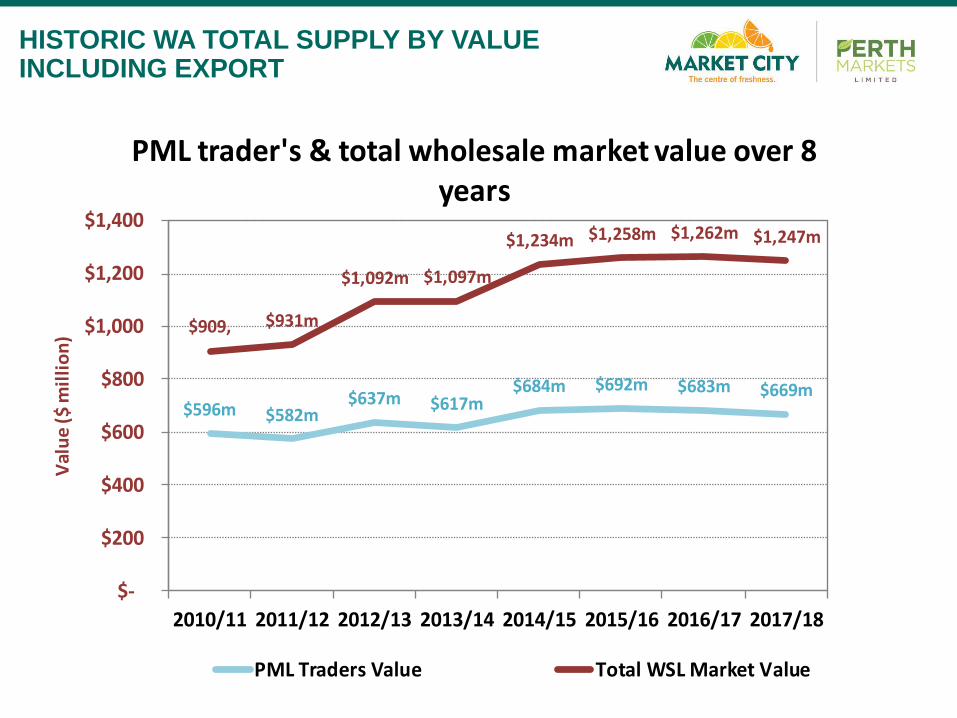
HISTORIC WA TOTAL SUPPLY BY VALUE INCLUDING EXPORT
$596m $582m$637m $617m
$684m $692m $683m $669m
$909, $931m
$1,092m $1,097m
$1,234m $1,258m $1,262m $1,247m
$-
$200
$400
$600
$800
$1,000
$1,200
$1,400
2010/11 2011/12 2012/13 2013/14 2014/15 2015/16 2016/17 2017/18
Val
ue
($ m
illi
on
)
PML trader's & total wholesale market value over 8 years
PML Traders Value Total WSL Market Value
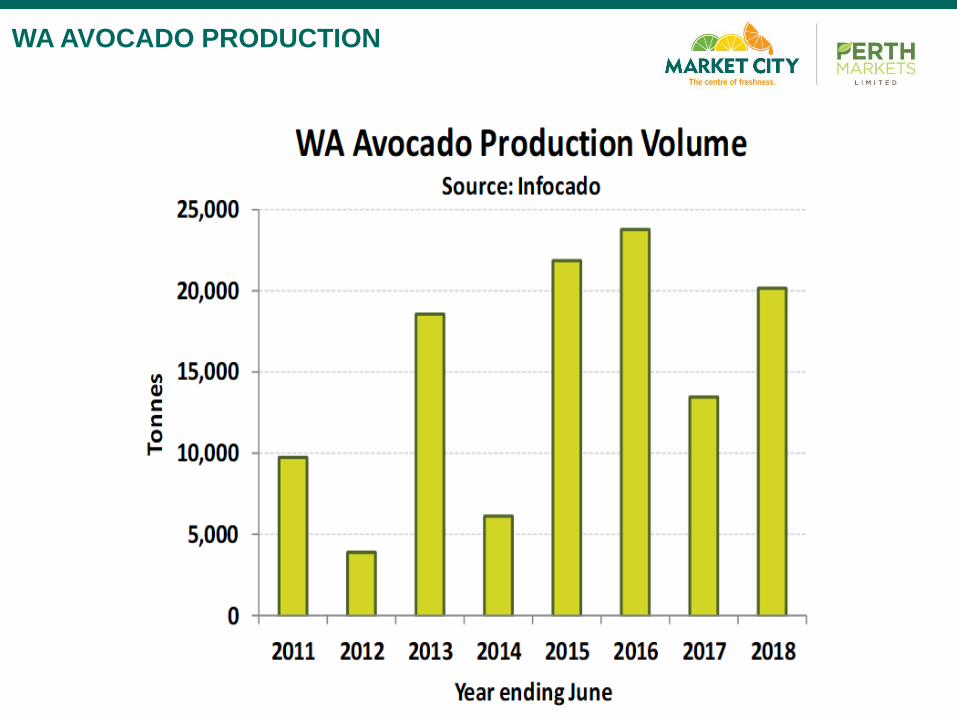
WA AVOCADO PRODUCTION
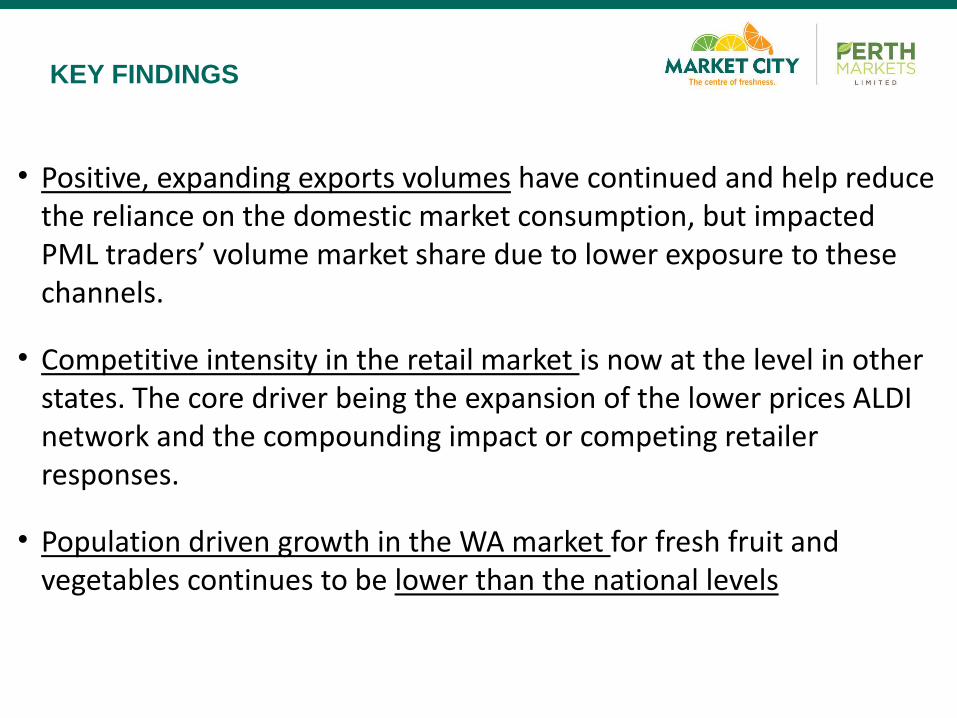
• Positive, expanding exports volumes have continued and help reduce the reliance on the domestic market consumption, but impacted PML traders’ volume market share due to lower exposure to these channels.
• Competitive intensity in the retail market is now at the level in other states. The core driver being the expansion of the lower prices ALDI network and the compounding impact or competing retailer responses.
• Population driven growth in the WA market for fresh fruit and vegetables continues to be lower than the national levels
KEY FINDINGS
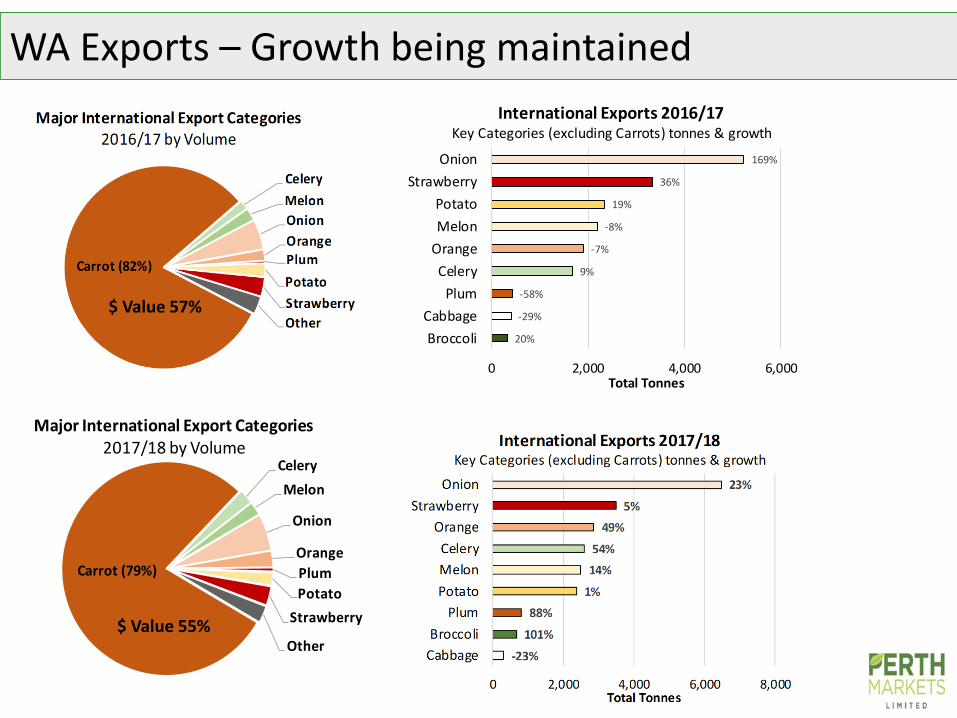
WA Exports – Growth being maintained
Carrot (79%)
Celery
Melon
Onion
Orange
Plum
Potato
Strawberry
Other
Major International Export Categories 2017/18 by Volume
20%
-29%
-58%
9%
-7%
-8%
19%
36%
169%
0 2,000 4,000 6,000
Broccoli
Cabbage
Plum
Celery
Orange
Melon
Potato
Strawberry
Onion
Total Tonnes
International Exports 2016/17Key Categories (excluding Carrots) tonnes & growth
$ Value 57%
$ Value 55%
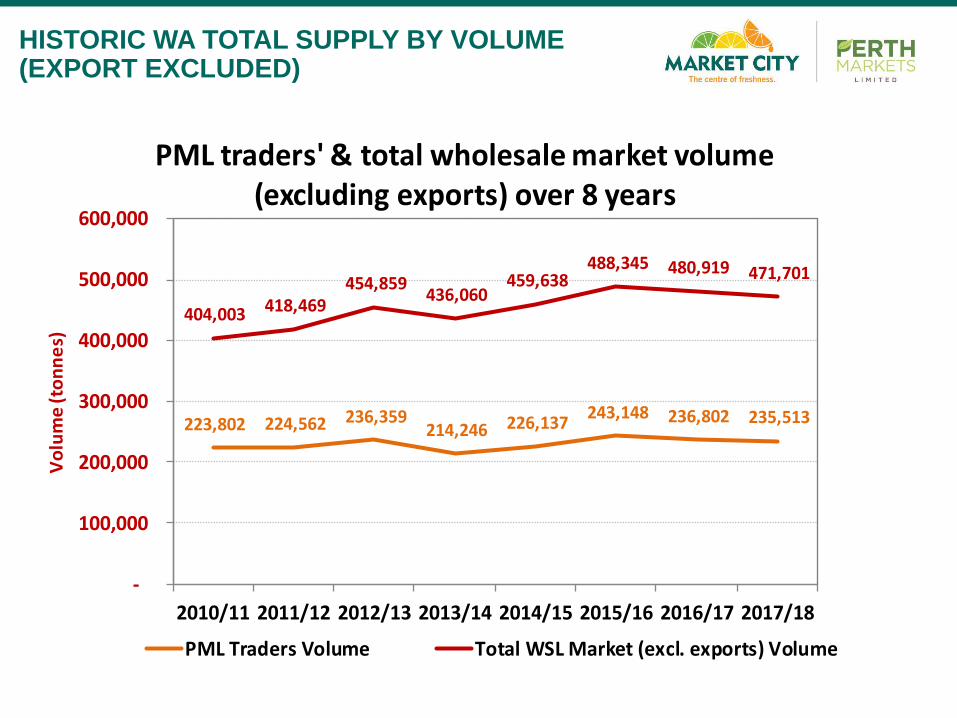
HISTORIC WA TOTAL SUPPLY BY VOLUME (EXPORT EXCLUDED)
223,802 224,562 236,359 214,246 226,137
243,148 236,802 235,513
404,003 418,469 454,859
436,060 459,638
488,345 480,919 471,701
-
100,000
200,000
300,000
400,000
500,000
600,000
2010/11 2011/12 2012/13 2013/14 2014/15 2015/16 2016/17 2017/18
Vo
lum
e (t
on
ne
s)
PML traders' & total wholesale market volume (excluding exports) over 8 years
PML Traders Volume Total WSL Market (excl. exports) Volume
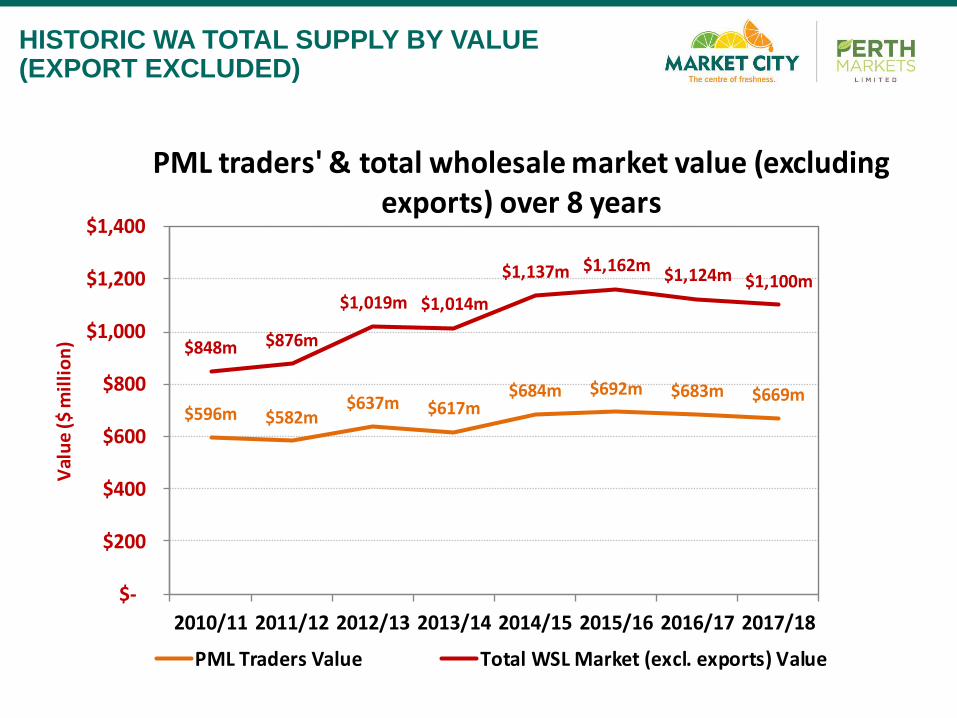
HISTORIC WA TOTAL SUPPLY BY VALUE (EXPORT EXCLUDED)
$596m $582m$637m $617m
$684m $692m $683m $669m
$848m $876m
$1,019m $1,014m
$1,137m $1,162m$1,124m $1,100m
$-
$200
$400
$600
$800
$1,000
$1,200
$1,400
2010/11 2011/12 2012/13 2013/14 2014/15 2015/16 2016/17 2017/18
Val
ue
($ m
illi
on
)
PML traders' & total wholesale market value (excluding exports) over 8 years
PML Traders Value Total WSL Market (excl. exports) Value
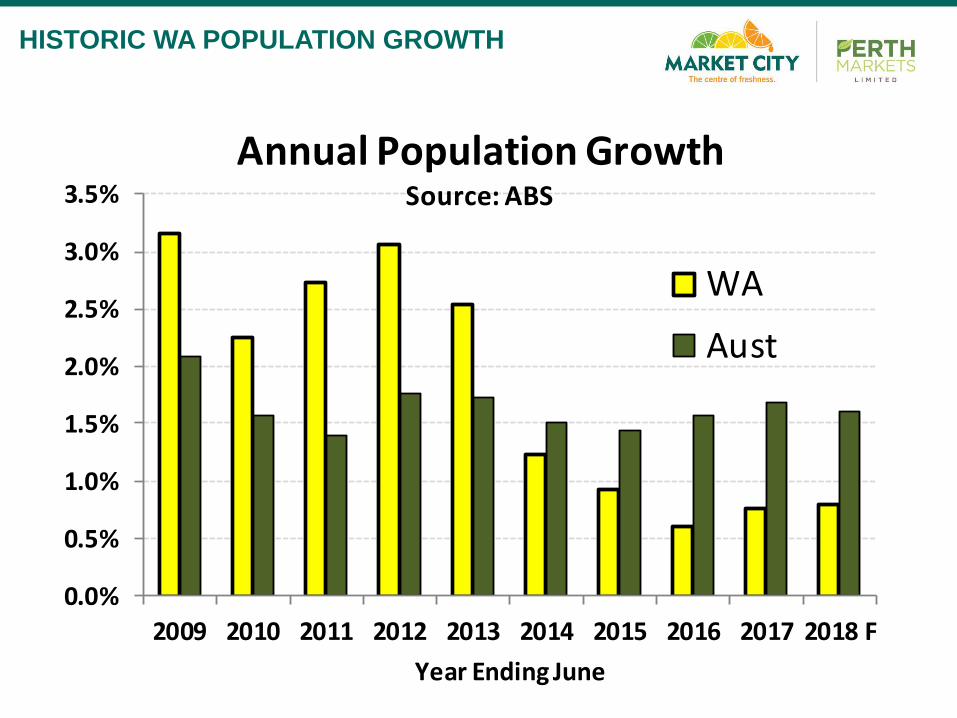
HISTORIC WA POPULATION GROWTH
0.0%
0.5%
1.0%
1.5%
2.0%
2.5%
3.0%
3.5%
2009 2010 2011 2012 2013 2014 2015 2016 2017 2018 F
Year Ending June
Annual Population GrowthSource: ABS
WA
Aust
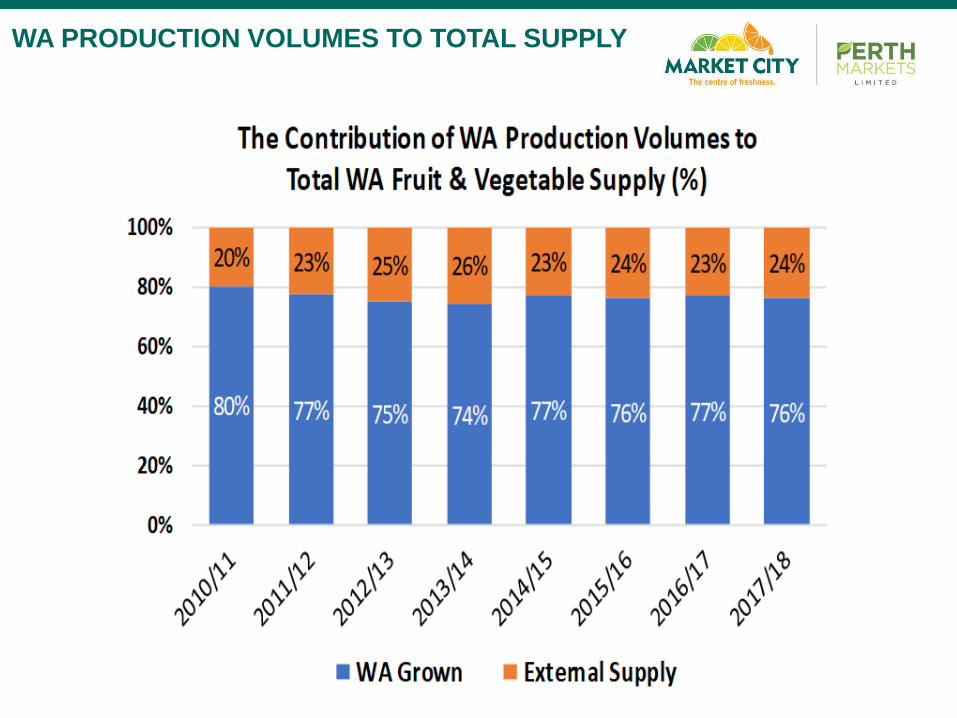
WA PRODUCTION VOLUMES TO TOTAL SUPPLY
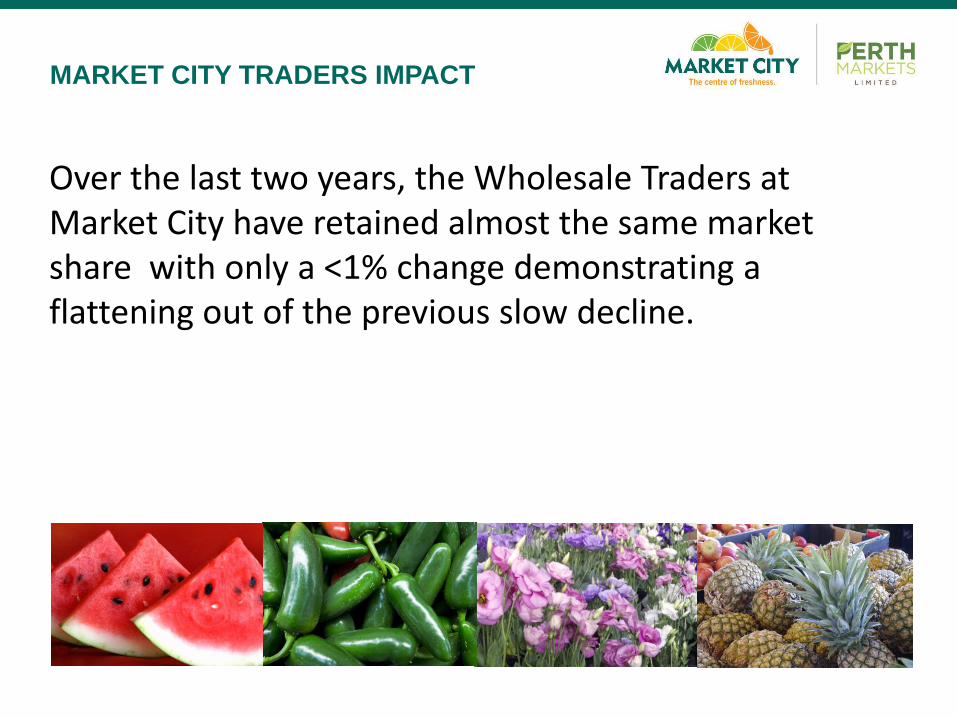
Over the last two years, the Wholesale Traders at Market City have retained almost the same market share with only a <1% change demonstrating a flattening out of the previous slow decline.
MARKET CITY TRADERS IMPACT
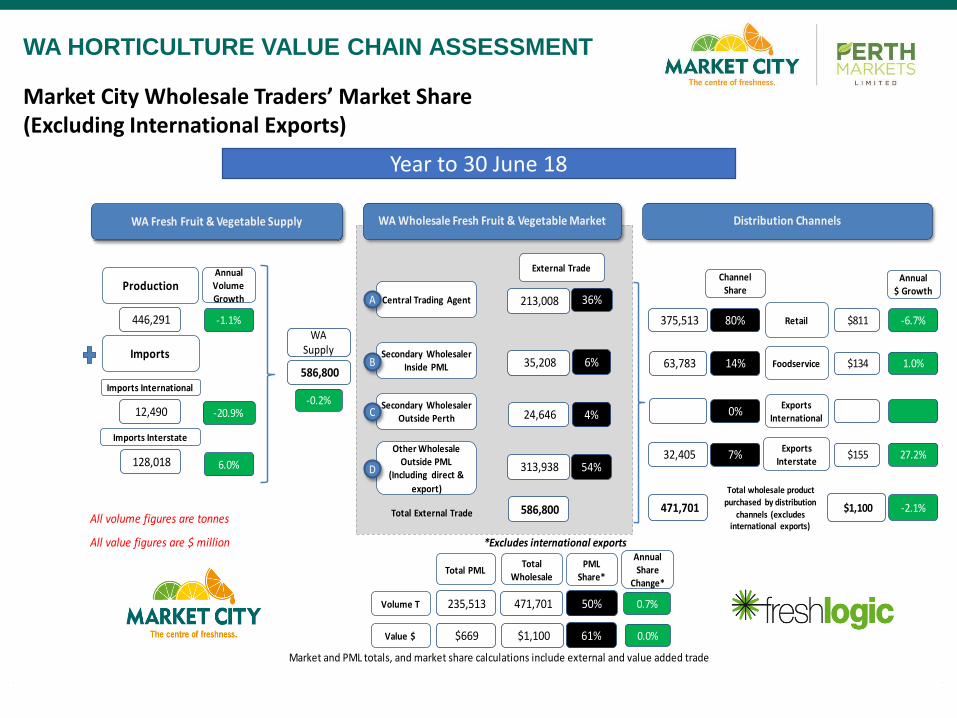
Year to 30 June 18
WA HORTICULTURE VALUE CHAIN ASSESSMENT
All volume figures are tonnes
All value figures are $ million *Excludes international exports
Market and PML totals, and market share calculations include external and value added trade
Distribution ChannelsWA Fresh Fruit & Vegetable Supply WA Wholesale Fresh Fruit & Vegetable Market
Production
Imports
Imports International
Imports Interstate
Annual Volume Growth
446,291
12,490
128,018
-1.1%
-20.9%
6.0%
586,800
WA Supply
-0.2%
Central Trading Agent
Secondary Wholesaler Inside PML
Secondary Wholesaler Outside Perth
Other Wholesale Outside PML
(Including direct &
export)
A
B
C
D
Total External Trade
213,008 36%
35,208 6%
24,646 4%
313,938 54%
External Trade
586,800
Foodservice63,783 14%
Retail
32,405
375,513 80%
Exports International
Exports Interstate
0%
7%
$811
$134
$155
-6.7%
1.0%
27.2%
Annual $ Growth
ChannelShare
471,701 $1,100
Total wholesale product
purchased by distribution channels (excludes
international exports)
-2.1%
471,701 235,513
$1,100 $669
50%
61%
Total Wholesale
Total PMLPML
Share*
Volume T
Value $
0.7%
0.0%
Annual Share
Change*
Market City Wholesale Traders’ Market Share (Excluding International Exports)
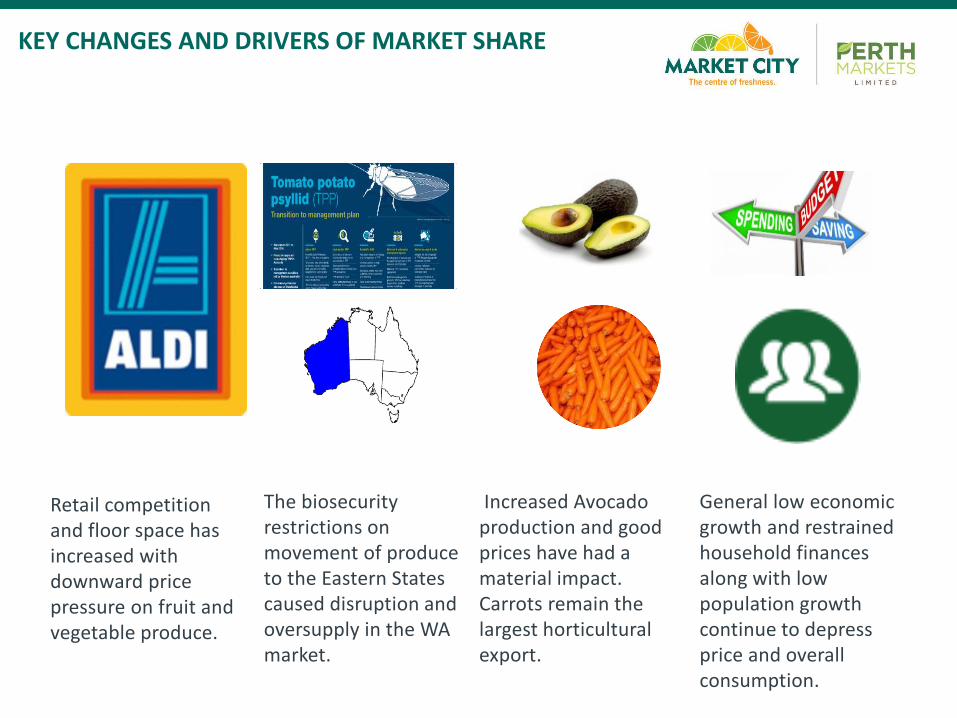
Retail competition and floor space has increased with downward price pressure on fruit and vegetable produce.
The biosecurity restrictions on movement of produce to the Eastern States caused disruption and oversupply in the WA market.
Increased Avocado production and good prices have had a material impact. Carrots remain the largest horticultural export.
General low economic growth and restrained household finances along with low population growth continue to depress price and overall consumption.
KEY CHANGES AND DRIVERS OF MARKET SHARE
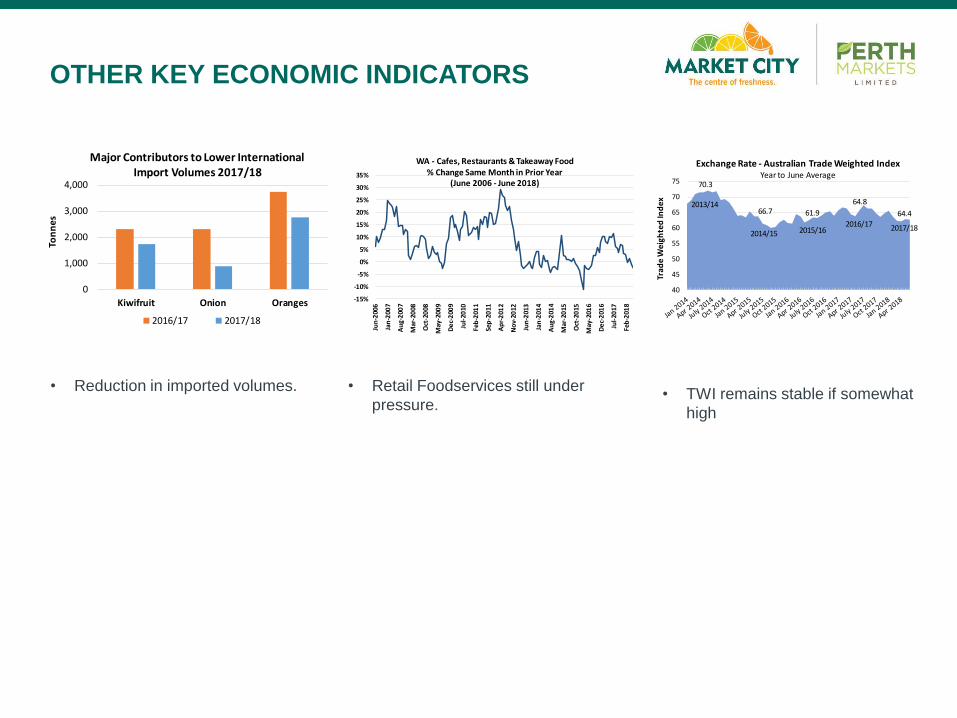
• Reduction in imported volumes. • Retail Foodservices still under
pressure.• TWI remains stable if somewhat
high
OTHER KEY ECONOMIC INDICATORS
0
1,000
2,000
3,000
4,000
Kiwifruit Onion Oranges
Ton
ne
s
Major Contributors to Lower International Import Volumes 2017/18
2016/17 2017/18
-15%
-10%
-5%
0%
5%
10%
15%
20%
25%
30%
35%
Jun
-200
6
Jan
-200
7
Au
g-2
007
Mar
-20
08
Oct
-20
08
May
-200
9
De
c-2
009
Jul-
2010
Feb
-201
1
Sep
-20
11
Ap
r-2
012
No
v-20
12
Jun
-201
3
Jan
-201
4
Au
g-2
014
Mar
-20
15
Oct
-20
15
May
-201
6
De
c-2
016
Jul-
2017
Feb
-201
8
WA - Cafes, Restaurants & Takeaway Food % Change Same Month in Prior Year
(June 2006 - June 2018)
40
45
50
55
60
65
70
75
Tra
de
We
igh
ted
Ind
ex
Exchange Rate - Australian Trade Weighted IndexYear to June Average
70.3
66.7 64.4 61.9
64.82013/14
2014/152017/182016/17
2015/16
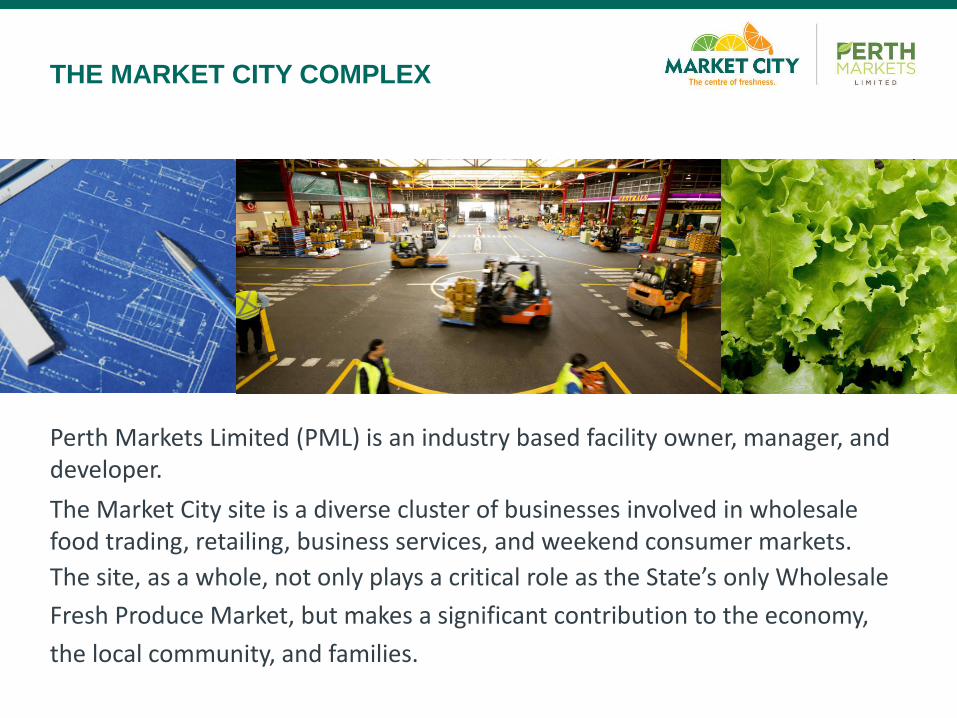
Perth Markets Limited (PML) is an industry based facility owner, manager, and developer.
The Market City site is a diverse cluster of businesses involved in wholesale food trading, retailing, business services, and weekend consumer markets.
The site, as a whole, not only plays a critical role as the State’s only Wholesale
Fresh Produce Market, but makes a significant contribution to the economy,
the local community, and families.
THE MARKET CITY COMPLEX
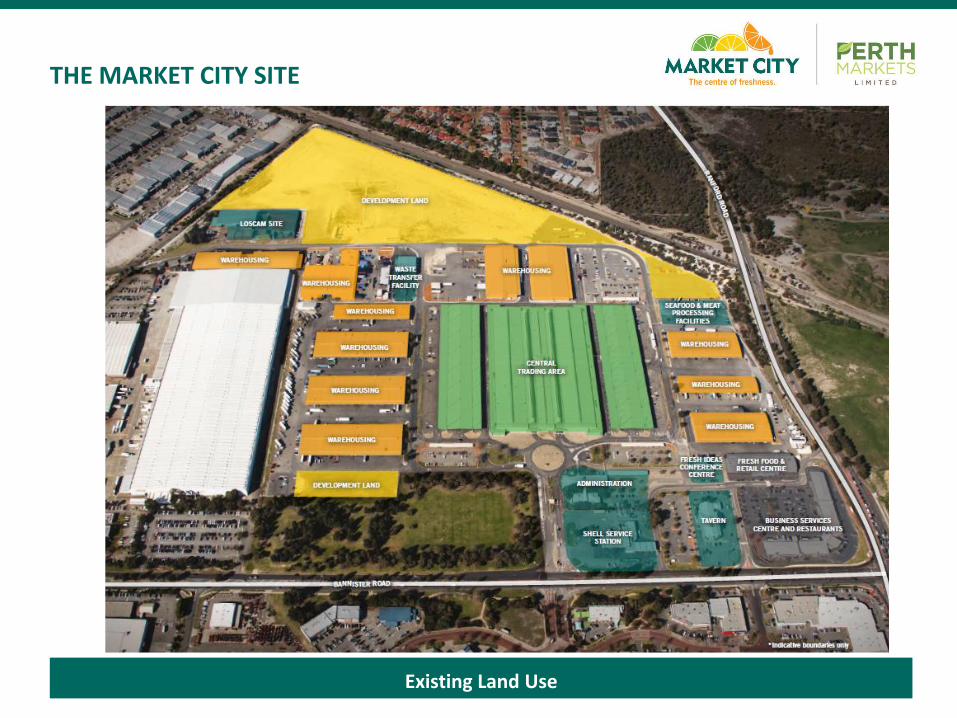
THE MARKET CITY SITE
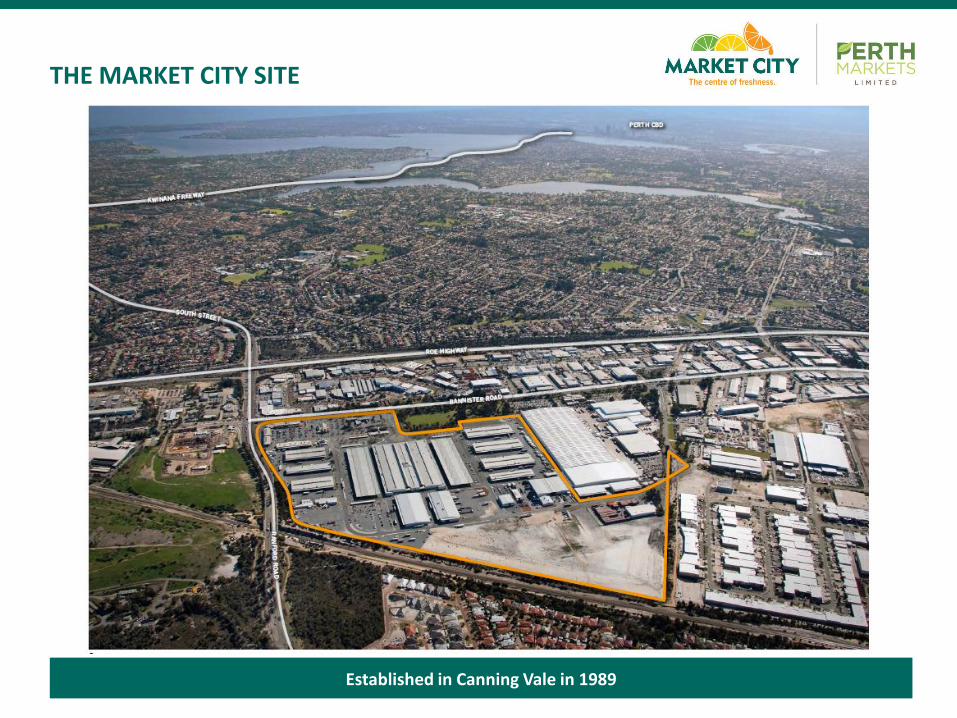
Established in Canning Vale in 1989
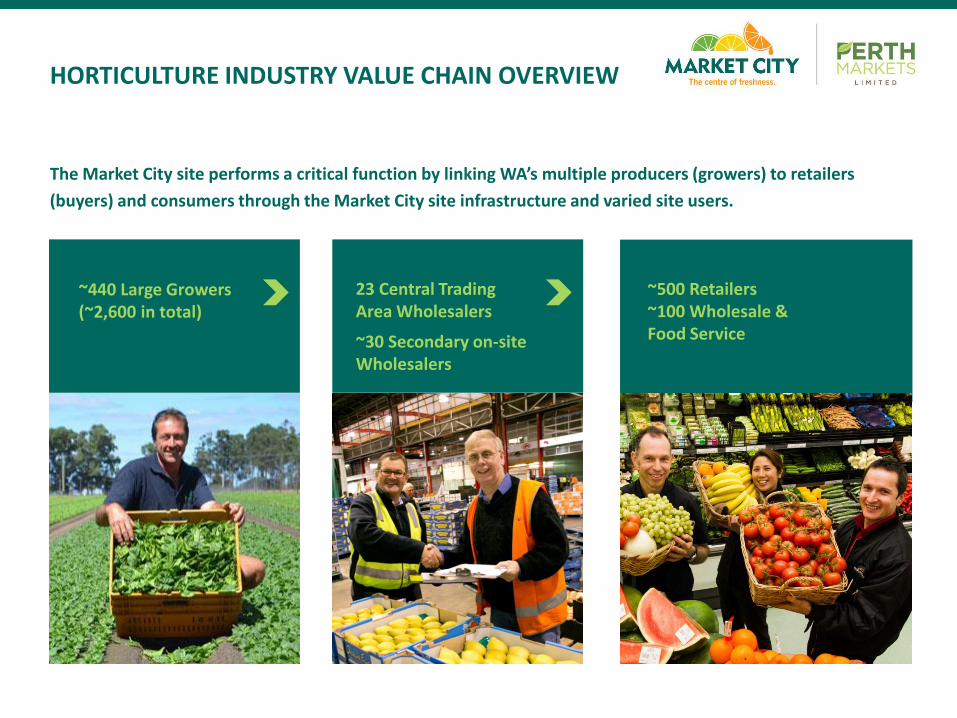
HORTICULTURE INDUSTRY VALUE CHAIN OVERVIEW
23 Central Trading Area Wholesalers
~30 Secondary on-site Wholesalers
The Market City site performs a critical function by linking WA’s multiple producers (growers) to retailers
(buyers) and consumers through the Market City site infrastructure and varied site users.
~440 Large Growers (~2,600 in total)
~500 Retailers~100 Wholesale & Food Service
THE MARKET CITY SITE
Existing Land Use
KEY SITE FACTS
• 51ha complex (≈15ha to be developed)
• Site activities include Wholesale F&V
Market, Fresh Fish Market, related
businesses, Retail, Professional Services
• 86,819m2 GLA building area
• 170 leases and licenses
• 99+% occupancy over last 8 years
• The Market City site operates 24/7/364
• Over 100 business located on site with
≈ 2,000 direct employees
• ≈ 4,500 daily site vehicle movements
• ≈ 4,100 site users (access cards)
• ≈ 355 registered forklifts
KEY SITE FACTS
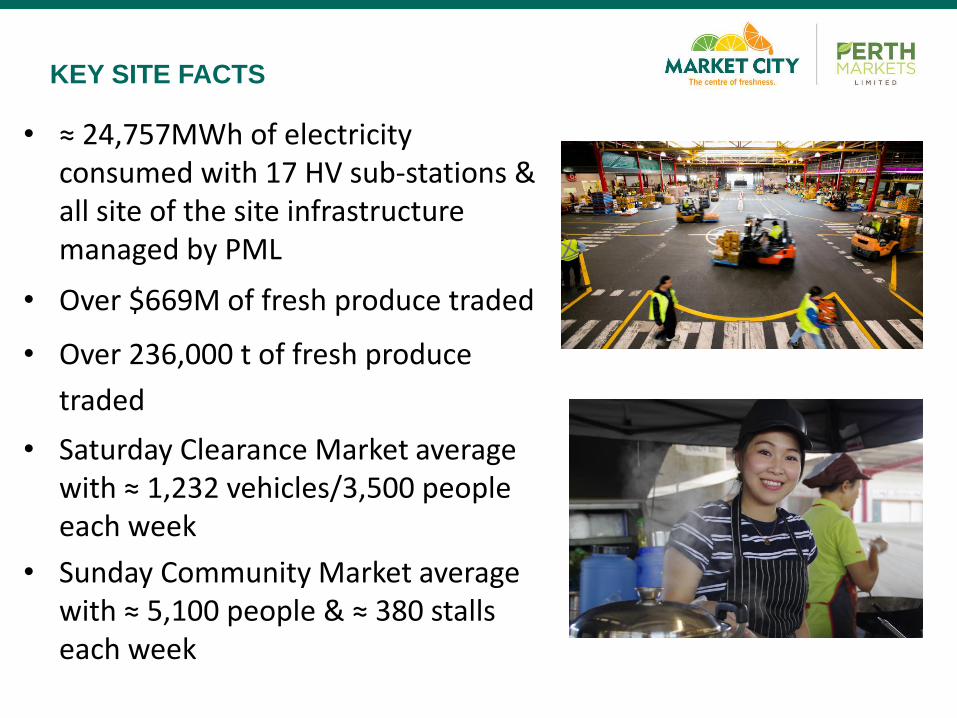
• ≈ 24,757MWh of electricity consumed with 17 HV sub-stations & all site of the site infrastructure managed by PML
• Over $669M of fresh produce traded
• Over 236,000 t of fresh produce
traded
• Saturday Clearance Market average with ≈ 1,232 vehicles/3,500 people each week
• Sunday Community Market average with ≈ 5,100 people & ≈ 380 stalls each week
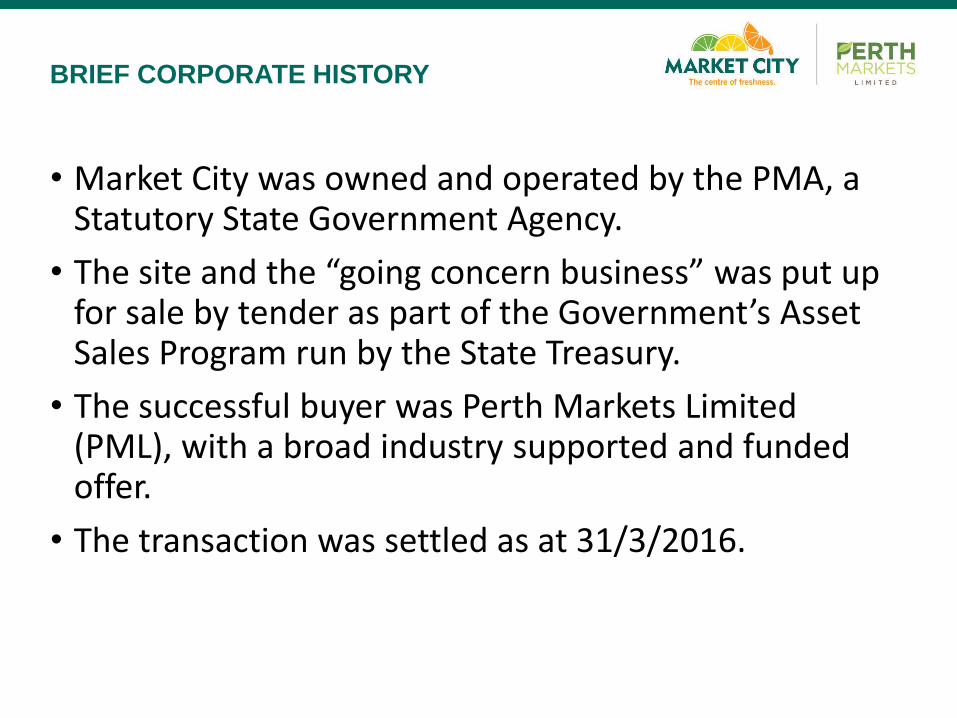
• Market City was owned and operated by the PMA, a Statutory State Government Agency.
• The site and the “going concern business” was put up for sale by tender as part of the Government’s Asset Sales Program run by the State Treasury.
• The successful buyer was Perth Markets Limited (PML), with a broad industry supported and funded offer.
• The transaction was settled as at 31/3/2016.
BRIEF CORPORATE HISTORY
Impact of Privatisation
on
Market Operations
1
In simple terms
No Change
To general site operations
IMPACT OF PRIVATISATION
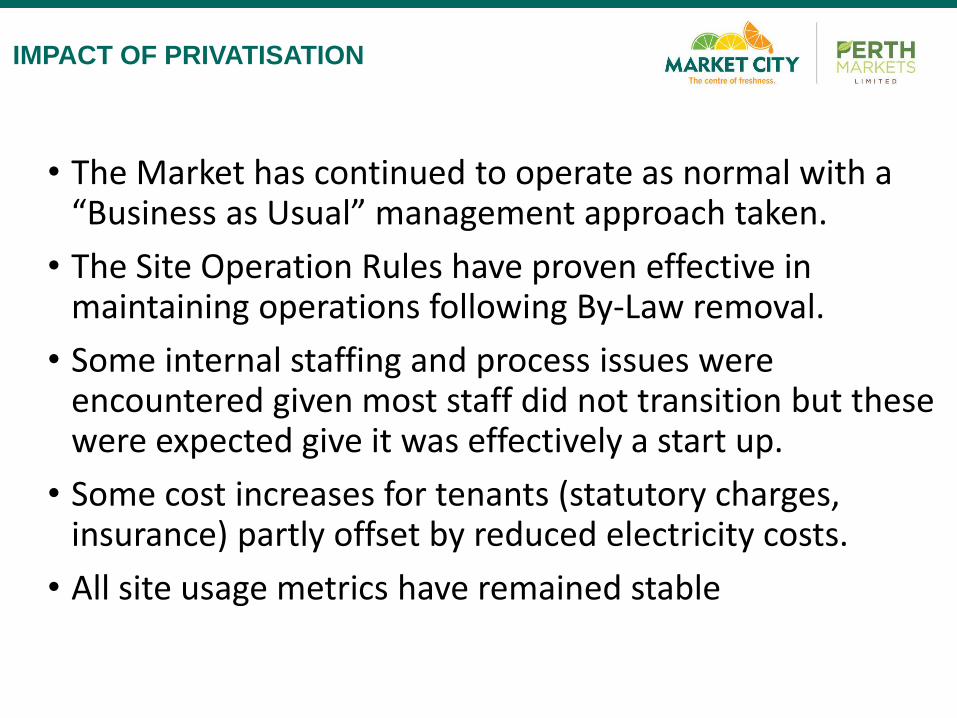
• The Market has continued to operate as normal with a “Business as Usual” management approach taken.
• The Site Operation Rules have proven effective in maintaining operations following By-Law removal.
• Some internal staffing and process issues were encountered given most staff did not transition but these were expected give it was effectively a start up.
• Some cost increases for tenants (statutory charges, insurance) partly offset by reduced electricity costs.
• All site usage metrics have remained stable
IMPACT OF PRIVATISATION
• A very good first 18 months results from 6/2016 to 12/2017 results. (6/2018 just about to be released).
• Key Highlights for the period to 12/2017:
• Total Assets Up 27% to $177.2m
• Net Tangible Assets Up 76% to $89.4m
• This includes a gain on revaluation of investment property of $35.8m following 2 revaluations of the site.
• 100% occupancy maintained with unmet demand
• Average above CPI rent increases but capped at 3% or 5% for existing tenants.
FINANCIAL RESULTS SNAP SHOT
• Total distribution returns of $7.2m to 31/3/2018, have been paid to investors.
• Total Land Tax of +$4.1m to 31/12/2017 has been paid (previously exempt)
• Total Council Rates +$1.9m to 31/12/2017 has been paid (previously exempt)
OTHER FINANCIAL ITEMS
• Master Plan review completed
• SE Development Triangle identified as the priority
• Possible commercial/residential development mid term with Metronet being the catalyst.
SITE DEVELOPMENT ACTIVITY
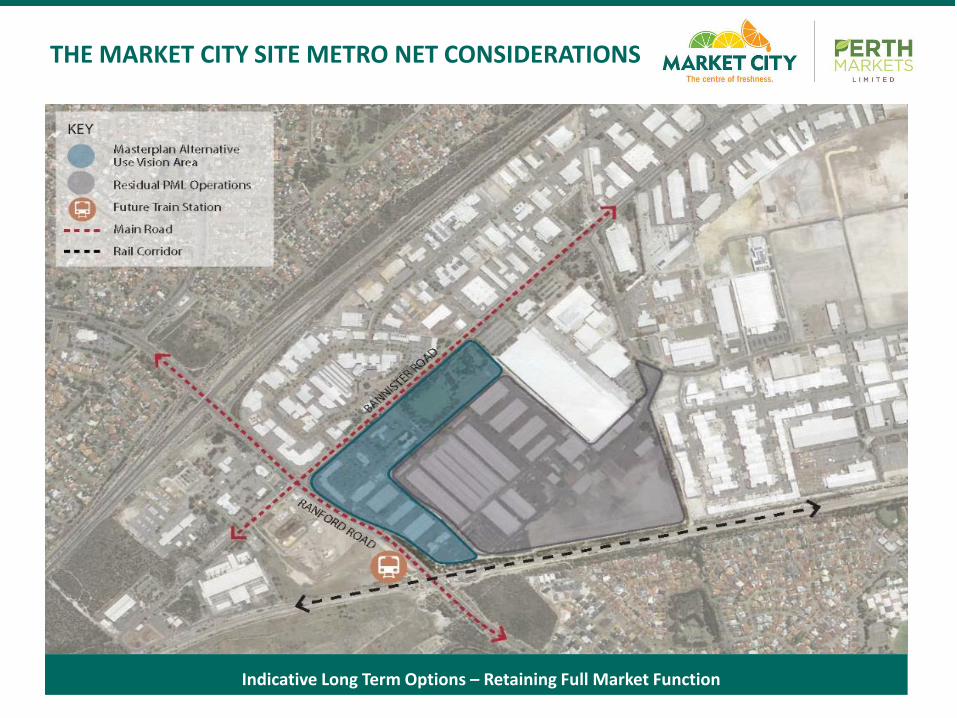
THE MARKET CITY SITE METRO NET CONSIDERATIONS
Indicative Long Term Options – Retaining Full Market Function
• EOI process confirms significant demand for new Cool Chain buildings on the development site
• Full Design Team appointed, with preliminary works underway
• Development Approval (DA) about to be submitted.
SITE DEVELOPMENT ACTIVITY
1SK501
2SK501
3SK501
RAILWAY RESERVE
PROPERTY BOUNDARYPROPERTY BOUNDARY
POWEREASEMENTPOWEREASEMENT POWEREASEMENT
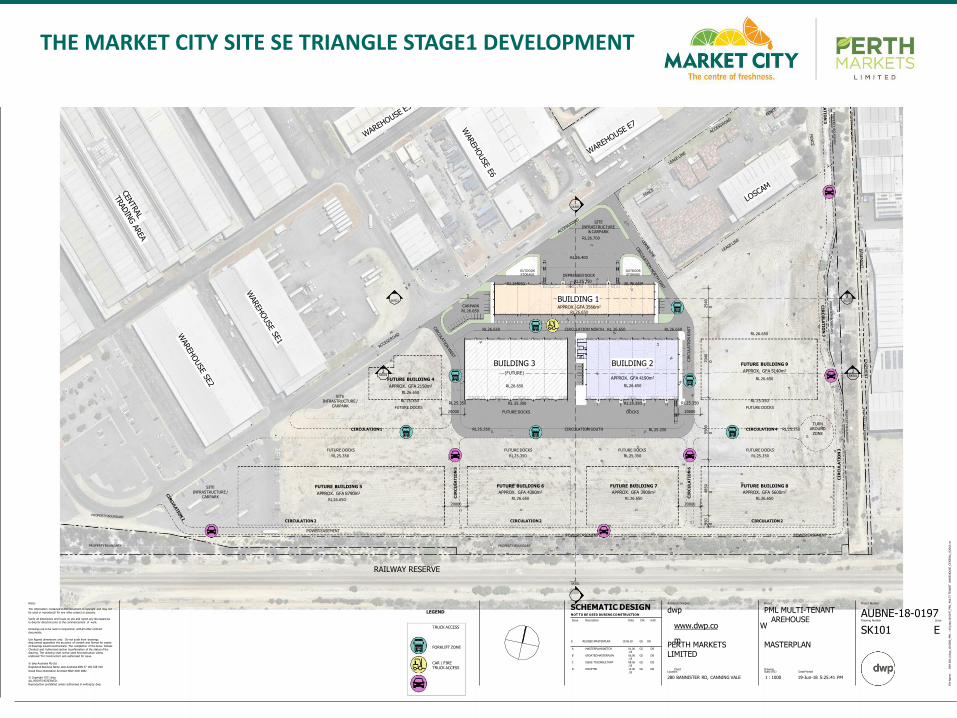
BUILDING 1
BUILDING 2
2540
07040
05500
04850
0950
0
BUILDING 3(FUTURE)
SITE INFRASTRUCTURE /
CARPARK
CIRCULATION1 CIRCULATION SOUTH
CIRCULATION2CIRCULATION2CIRCULATION2
CIR
CU
LA
TIO
N3
CIR
CU
LA
TIO
N6
CIR
CU
LA
TIO
N5
20000 20000
TURN AROUND
ZONE
SITE INFRASTRUCTURE /
CARPARK
DEPRESSEDDOCK
RL25.350
RL26.400
RL26.650
RL 25.350
FUTURE DOCKS
RL25.250 RL25.250
RL 25.350
DOCKS
CIRCULATION NORTH RL 26.650
1SK501
SITE INFRASTRUCTURE
& CARPARK
RL26.700
3SK501
CARPARK
RL26.650
RL26.650 RL26.650
RL26.650
RL25.350
20000
RL25.350
20000
APPROX. GFA 3566m2
RL26.650
APPROX. GFA 4190m2
RL26.650RL26.650
FUTURE BUILDING 9
APPROX. GFA 5140m2
RL26.650
FUTURE BUILDING 8
APPROX. GFA 5600m2
RL26.650
FUTURE BUILDING 7
APPROX. GFA 3900m2
RL26.650
FUTURE BUILDING 6
APPROX. GFA 4380m2
RL26.650
FUTURE BUILDING 5
APPROX. GFA 8790m2
RL26.650
2SK501
FUTURE BUILDING 4
APPROX. GFA 2150m2
RL26.650
CIR
CU
LATIO
NEAST
RL 25.350
FUTURE DOCKS
FUTURE DOCKS
RL25.350
FUTURE DOCKS
RL25.350
FUTURE DOCKS
RL25.350
FUTURE DOCKS
RL25.350
RL 25.350
FUTURE DOCKS
CIRCULATION 4 RL 25.250
RL26.650
OUTDOOR
STORAGE
OUTDOOR
STORAGE
TRUCK ACCESS
FORKLIFT ZONE
CAR / FIRE TRUCK ACCESS
LEGENDSCHEMATIC DESIGNNOT TO BE USED DURING CONSTRUCTION
Notes
The information contained in this document is copyright and may not
be used or reproduced for any other project or purpose.
Verify all dimensions and levels on site and report any discrepancies
to dwp for direction prior to the commencement of work.
Drawings are to be read in conjunction with all other contract
documents.
Use figured dimensions only. Do not scale from drawings.dwp cannot guarantee the accuracy of content and format for copies
of drawings issued electronically. The completion of the Issue Details
Checked and Authorised section isconfirmation of the status of the
drawing. The drawing shall not be used forconstruction unless
endorsed 'For Construction' and authorised for issue.
Architect/Designer
dwp
© dwp Australia Pty Ltd
Registered Business Name dwp Australia ABN 37 169 328 018
David Rose Nominated Architect NSW ARB 4882
© Copyright 2011 dwp.
ALL RIGHTS RESERVED.
Reproduction prohibited unless authorised in writing by dwp. File
Nam
e:
BIM
360:/
/dw
p_18-0
000_PM
L-
All
jobs/
18-0
197_PM
L_M
ULT
I-TEN
AN
TW
AR
EH
OU
SE_CEN
TR
AL_
R2018.r
vt
Scale (A1)
1 : 1000
DatePrinted
19-Jun-18 5:25:41 PM
MASTERPLAN
Drawing Number Issue
SK101 E
Project Number
AUBNE-18-0197
PERTH MARKETS LIMITED
Project
PML MULTI-TENANT AREHOUSE
Location
280 BANNISTER RD, CANNING VALE
Issue Description Date Chk Auth
www.dwp.co
m
W
A MASTERPLANSKETCH 01.06.18
GS DB
B UPDATEDMASTERPLAN 06.06.18
GS DB
C ISSUE TOCONSULTANT 08.06.18
GS DB
D DRAFTSD 13.06.18
GS DB Client Drawing
E REVISEDMASTERPLAN 19.06.18 GS DB
THE MARKET CITY SITE SE TRIANGLE STAGE1 DEVELOPMENT
The information provided by the Perth Markets
Limited (PML) is given in good faith on an "as is"
basis for general information purposes only and
is not intended to constitute or substitute other
professional advice. You must make your own
assessment of the information and rely on it
wholly at your own risk as the PML makes no
representations about the suitability, reliability,
timeliness, comprehensiveness and accuracy of
the information provided.
PML GROUP - LEGAL NOTICE
The PML shall not be liable directly or indirectly
in contract, tort, negligence, equity or otherwise
for any damage whatsoever in connection with
any information provided, including any direct,
indirect, special, incidental or consequential
damage (including but not limited to loss of
profits, interest, data, business revenue,
anticipated savings, business or goodwill). The
recipient of any information from the PML agrees
to indemnify the PML from any loss, damages or
other cost whatsoever arising out of or in
connection with any claim commenced against
the PML arising out of it in connection with
reliance upon the subject matter of, or any part
of, any information provided by the PML.
Perth Markets Limited
280 Bannister Road
Canning Vale, WA 6155
www.perthmarket.com.au
Thank you