Embed Size (px)
Citation preview

MARKET AND ECONOMIC DEVELOPMENT IN
BULGARIA Eleni Zafeiriou
1, Christos Karelakis
2, Chrisovalantis Malesios
3 and Theodoros Koutroumanidis
4,
1Lecturer of the Department of Agricultural Development, Democritus University of Thrace, Pantazidou 193, Orestiada,
68200, GREECE, tel. +302552041185, fax +302552041185, email: [email protected]; 2Lecturer of the Department of Agricultural Development, Democritus University of Thrace, Pantazidou 193, Orestiada,
68200, GREECE, tel. +302552041133, fax +302552041191, email: [email protected] 3Special Technical Laboratory Stuff of the Department of Agricultural Development, Democritus University of Thrace,
Pantazidou 193, Orestiada, 68200, GREECE, tel. +302552041158, email: [email protected] 4Professor of the Department of Agricultural Development, Democritus University of Thrace, Pantazidou 193, Orestiada,
68200, GREECE, tel. +302552041158, email: [email protected]
ABSTRACT
The present paper tests empirically the existence of a causal relationship between the economic growth and the
development in the banking and stock market in transition economies and especially the case of Bulgaria. The Johansen
cointegration test indicated one long – run relationship between the banking sector, the stock market and the economic
growth while the application of the Granger causality test indicated a bilateral relationship between the economic growth
and the development in the stock market, as well as between the economic growth and the development in banking
sector. Finally, a unilateral relationship was concluded between the development in credit and stock market.
KEYWORDS
Cointegration, Granger Causality, Stock market, Credit Market, Economic Growth
JEL CLASSIFICATION CODES
There is a maximum of 3 JEL classification codes. See the following webpage to choose the appropriate classification
codes: http://www.aeaweb.org/journal/jel_class_system.html
1. INTRODUCTION
In transition economies the issue of economic growth has been of great interest during the last two
decades. The subject of economic growth according to Schumpeter (1912), is related to the development of a
country‟s financial sector. Bulgaria is a recurrent transition economy that its economic reform took place in
the middle of 1990. This reform preceded a peaceful transition to a pluralistic democracy during the time
period 1989 – 1991 while a political crisis and a period of hyperinflation followed for the time period 1996 –
1997 (Wyzan, 1996). The economic performance of Bulgaria is characterized by great conflicts. To be more
specific, a significant reduction in the Gross Domestic Product (GDP) was observed, within the time period
1990 – 1991, a moderate increase was then recorded while a significant decrease was apparent in the time
brought to you by COREView metadata, citation and similar papers at core.ac.uk
provided by Aston Publications Explorer

period 1996 - 1997 (Jamal et al, 2006). One of the features often observed in transitions economies is the
rapid credit growth of the private sector (IMF, 2004).
Credit growth may imply not only advantages but also disadvantages for the economy since it may
lead to increased growth and efficiency but also to a macroeconomic and financial crisis. This may cause a
dilemma for the policy makers given that they have to minimize the risks of financial crisis while
simultaneously they have to extend bank lending to households and to corporations in order to higher growth
and efficiency to be achieved. The credit growth of Bulgaria is extremely high since it belongs to the top ten
transition economies having as a criterion the development of the credit market. What must be mentioned is
that in the year 2002 the average credit growth is above 5% of GDP whereas the level of credit is still low
(below 36%). Regarding the banking system of Bulgaria we can say that is relatively small despite the large
number of banks and the rapid asset growth at the beginning of the last decade. To be more specific the
banking system of this country consists of 29 banks and 6 branches of foreign banks while its total assets
reaches 46% of GDP. The majority of the banks in Bulgaria are private while the state – ownership banks are
limited to two. Furthermore, through the privatization process, large European banks acquired most of the
assets that were owned by the banking system.
Regarding the institutional framework of the financial sector we can say that it is adequate, whereas a
strengthening in supervision on consolidated basis is needed as well as the training of the bank supervisors in
the issue of international accounting standards. The economic instability on the other hand has caused
dollarization and despite the fact that the confidence to the economic system was restored, the share of
foreign – currency – denominated deposits is still large. Additionally, aiming at exchange rate stability the
frameworks of monetary policy have encouraged demand for foreign – currency – denominated loans. These
frameworks involve the operation of a currency board arrangement. This framework has three key features;
A fixed exchange rate peg to the Euro.
Automatic convertibility.
A prohibition on domestic credit creation by the Bulgarian National Bank (BNB).
The only monetary instrument that remained to the government is to reserve requirements on
commercial bank liabilities, as well as to impose quarterly ceilings on bank credit growth with punitive

marginal reserve requirements if those are exceeded (Duenwald et al., 2005). The main impact of this
financial boom in the case of Bulgaria is the expansion of the trade and of the current account deficits.
The policies that had to be adapted in order to offset and moderate the rapid credit growth are limited
due to the currency board arrangement. The tightening of the fiscal policy and the restrain on expenditures
were the two main measures adapted. As far as the monetary measures are concerned the most important are
the quantitative restrictions on credit, the limitation on reserve requirements and prudential supervision. The
tightening of reserve requirements does not seem to reduce the credit growth. On the other hand the impact of
the limits on credit cannot be assessed yet given that initially took effect on April, 1, 2005.
Regarding the stock market we could say that a great inflow of foreign capitals was recorded since the
economic environment was appropriate for the investors to make profitable investments, while numerous of
foreign direct investments were recorded due to the accession of Bulgaria in the EU. Additionally, there are
regulations regarding the controls on the capital account. Finally, regarding the prudential indicators they are
relatively strong in terms of capital adequacy, provisioning profitability, and nonperforming loans (NPLs).
The structure of the total product may be represented by the added gross value. As it can be seen in the
following table there is a decrease in the percentage of the industrial product while there is a significant
increase in the sector of services.
Table 1: The structure of the Gross Added Value
Activity Groupings 1996 2000 2006 2011*
Agriculture, forestry and fishing 63,9 89,3 99,5 98,9
Mining and quarrying; manufacturing; electricity, gas, steam and air conditioning supply; water supply; sewerage, waste management and remediation activities
24,2 112,0 107,1 109,1
Construction 36,0 100,8 114,5 98,9
Wholesale and retail trade; repair of motor vehicles and motorcycles; transportation and storage; accommodation and food service activities
58,2 106,8 107,6 98,9
Information and communication 157,4 120,2 108,6 101,9
Financial and insurance activities 235,9 131,2 112,0 99,9
Real estate activities 234,0 101,3 106,5 99,4
Professional, scientific and technical activities; administrative and support service activities
217,2 101,8 117,8 108,1

Public administration and defence; compulsory social security; education; human health and social work activities
63,1 108,3 99,0 99,0
Arts, entertainment and recreation, repair of household goods and other services
72,9 110,6 115,4 91,9
Total Economic 90,4 105,1 106,7 101,8
Adjustments (taxes less subsidies on products ) 95,4 110,7 105,5 100,8
Gross Domestic Product 91,0 105,7 106,5 101,7
Source: NSI(National Statistical Institution)
Within this time period no significant change has taken place implying that the normality in every
sector of the economy has been restored. Additionally, the changes in the agricultural sector had a negative
impact on the contribution to the gross added value, while it should not be neglected the expansion of the
businesses of the private services. Regarding the financial sector we can conclude that the development in the
particular sector is moderate. Given the economic environment as described above, the present study will
examine the existence of a relationship between economic growth and development in the financial sector
(including the banking and the stock market).
2. Literature Review
The role of stock and credit market in the economic development has been an
important subject of economic analysis. The main question is whether the stock or the
credit market either follows or precedes economic development (Dritsaki and Dritsaki
Bargiota, 2006). The particular subject was initially studied by Schumpeter (1912), who
considers that the development of the financial sector of a country affects not only the level
but also the rate of economic growth.
Other important studies are those of Lewis (1955) and Jung (1986). Lewis (1955)
confirmed the existence of a bilateral relationship between the financial development and
the real growth while Jung (1986) found a unilateral relationship with direction from
financial development to economic growth for the LDCs (Less Development Countries)
and the validity of the reverse causal direction for the DCs (Developed Countries).
According to Levine and Zervos (1993), the stock market development is strongly

correlated to the growth rate of real GDP per capita, while they confirmed that the stock
market liquidity and the banking development may predict the future growth rate of the
economy.
Other important studies that used the Granger causality test as an empirical method
of this subject, are those conducted by Luintel and Kahn (1999), Kar and Pantecost (2000),
Shan and Morris (2002), and Dritsaki and Dritsaki - Bargiota (2006). To be more specific,
Luintel and Kahn (1999), found a bi – directional causality between the financial
development and economic growth through the empirical investigation of the long – run
relationship in ten sample countries. Furthermore, Kar and Pantecost (2000) used data from
Turkey and found that economic growth leads to financial development. The most
significant finding though, is that the direction of causality between financial development
and economic growth in the case of Turkey is related to the choice of measurement for
financial development.
The findings of Shan and Morris (2002) contradict those of Kar and Pentecost
(2000). The application of the Granger causality test confirmed that there is no causal
relationship between financial development and economic growth in most countries of the
sample used. Finally, Dritsaki and Dritsaki - Bargiota (2006), studying the case of Greece,
found a bilateral causal relationship between the banking sector development and
economic growth and a unidirectional relationship between economic growth and stock
market.
The objective of the present paper is to investigate the causal relationship between
the stock market, the credit market and their role in economic growth of a transition
economy, Bulgaria. Its importance stands on the particularities of the function of the sub -

markets in a transition economy. The access of Bulgaria in the EU as well as the adaption
of euro as a national currency of the economy played also an important role in the
formation of the economic environment.
Furthermore, the openness of the economy, the inflow of the foreign capitals to the
domestic economy and the high rates of inflation may affect the linkage between the credit
market, the stock market and the economic growth; To be more specific Boyd et al. (2000),
have shown that for countries with low – to moderate inflation, (Bulgaria is a moderate
inflated country within the last decade) there is a strongly negative relationship of the
inflation and the development in the banking sector as well as with the stock market
development. Additionally, higher long – run inflation rates may lead to slower economic
growth. For the reasons mentioned above, the inflation should be tested as exogenous
variable. Furthermore, the Granger causality test may confirm, the existence of a unilateral
or bilateral relationship among the economic growth, the development in the banking
sector and the development in the stock market. Thus, the present paper studies the validity
of the theories that suggest that the financial development plays an important role in the
process of the economic growth.
3. Theoretical Framework
In the analysis of economic growth as a function of the financial and credit growth the
following relationship was used;
EG=f(FG, CG) (1)
where;
EG: Economic Growth
FG: Functions of Stock Market
CG: Development of Credit Market.
The present paper intends to investigate the existence of this relationship that is in
line to the theory as expressed initially by Schumpeter (1912), while the proxies used for
describing each sector are described in the following paragraph.
4. Data – Methodology
As a proxy for the financial development the index of capitalization (CI) was used,
while as proxy for the credit market was used the interest of long term liabilities (LTL) in
order to describe the situation in the bank sector. Finally, in order to describe the economic
growth we employed the Industrial Production Index (IPI). The data were acquired by the
data base of Eurostat. The period span from 01.2000 – 05.2007. All the data used are in
logarithmic form. To be more specific the data used are denoted as follows;
ci= ln(CI) (2)
ipi=ln(IPI) (3)
ltl=ln(LTL) (4)
The capitalization index presents a great volatility since it started with a value less
than unity and reached the value of 16.37 in December of 2007. Regarding the interest
rates the volatility is limited while the increase is gradual, giving an upward trend to the
graph. Finally the industrial production index is characterized by a volatility of a small size
with an upward trend.

Figure 1: The evolution of the capitalization index in logarithmic form
Figure 2:The evolution of the interest of the long – term liabilities in logarithmic form

Figure 3: The evolution of the industrial production index in logarithmic form
The study of this relationship has been achieved with the implementation of
cointegration test. The cointegration test was preceded by a stationarity test (ADF test). In
particular, a multivariate autoregressive VAR model in the case of Bulgaria was used while
the exchange rates and the inflation were used as exogenous variables. Weak exogeneity of
the exchange rates and the inflation was confirmed. Furthermore, Granger causality tests
were applied in order the causal relationship between banking sector development (long
term liabilities), economic growth (IPI) and stock market development (capitalization
index) to be examined.
The process of cointegration should be followed by the estimation of a VAR model
in which a vector error correction mechanism should be included. This process is necessary
given the fact that the variables under preview in logarithmic form are cointegrated.
5. Unit Root Test
In order to apply the cointegration technique as mentioned above, we examine the
stationarity of the time series studied. A precondition for the implementation of a multi -

Var contegration technique is the unit root test. The unit root test employed in our data
is Augmented Dickey Fuller (ADF) test (1979). The ADF (1979) test has been widely
used for testing the existence of a unit root in the time series studied. This test is based
on the following auxiliary regression of the general form;
tttt epLptp 11210 )( (5)
where;
This test aims at testing the null hypothesis that γ2 = 0 which is tantamount for a
single unit root in the data – generating process for pt. In order to determine the ADF form
the significance of the constant was examined as well as the significance of the coefficient
of the trend. Following these steps we ended up to the final form of the regression that
includes no constant and no time trend.
6. Cointegration with the Johansen technique
The cointegration analysis was based on Johansen‟s multivariate cointegration
methodology. Additionally, the estimation of the cointegration vectors was applied with
the treatment of the Johansen‟s maximum likelihood approach. According to Johansen
(1988) any p – dimensional vector autoregression can be written in the following “error
correction” representation.
k
i
tktititX1
(6)
),0(~
:)(
2Ne
LoperatorlagtheinpolynomialorderthpL
t

where;
Xt: p – dimensional vector of I(1) processes,
μ: a constant
εt: a p – dimensional vector with zero mean (Π is the variance – covariance matrix)
The Π matrix has a rank that is limited in the (0,r) and can be decomposed into:
' (7)
where;
α, β: p x r matrices
r: distinct cointegrating vectors.
The procedure of Johansen provides the maximum likelihood estimates of α, β, while
Π and the two likelihood ratio test statistics determine the order of the cointegration space.
The trace and the maximum eigenvalue statistics are used to determine the rank of Π and to
reach a conclusion on the number of cointegrating equations, r, in our multivariate VAR
system. The economic time series studied are I(1), while their combination is I(0), when
there is only one relationship in the long run.
7. VAR Model with an Error Correction Mechanism
The error correction model can be derived with the use of the long – run
cointegration vector and has the following form;
tt ueciirlaggedip 1),( (8)
where;
Δ: denotes the first differences of the variables.
1te : are the estimated residuals from the cointegrated regression
δ: is the short run parameter that takes values in the (0,1)
ut: is a white noise.
What must be underlined in the process of the estimation of a VAR model is the
criterion applied for the correct specification of the model. In particular, the researcher
should pre – determine the deterministic components as well as the number of lags used in
the model. In this study the Schwartz – Bayesian (1978) criterion was used, that according
to Mills and Prasad (1992) outperforms other criteria.
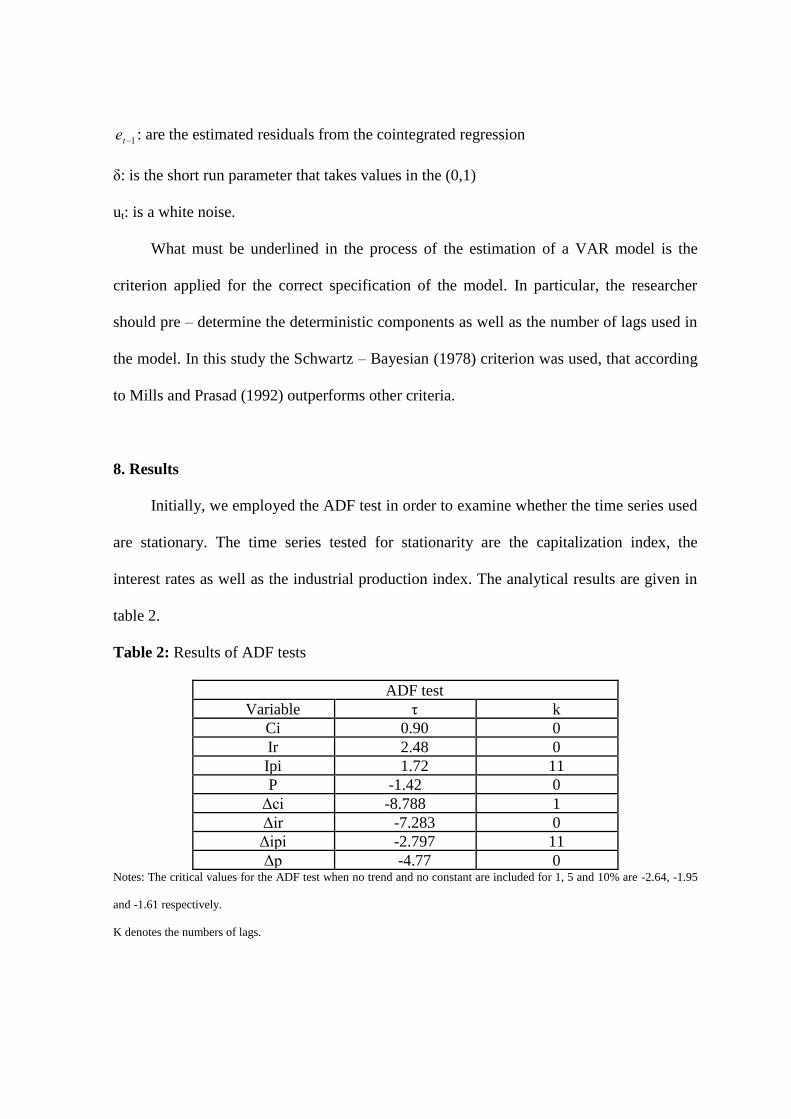
8. Results
Initially, we employed the ADF test in order to examine whether the time series used
are stationary. The time series tested for stationarity are the capitalization index, the
interest rates as well as the industrial production index. The analytical results are given in
table 2.
Table 2: Results of ADF tests
ADF test
Variable τ k
Ci 0.90 0
Ir 2.48 0
Ipi 1.72 11
P -1.42 0
Δci -8.788 1
Δir -7.283 0
Δipi -2.797 11
Δp -4.77 0 Notes: The critical values for the ADF test when no trend and no constant are included for 1, 5 and 10% are -2.64, -1.95
and -1.61 respectively.
K denotes the numbers of lags.

According to the results given above all the time series studied are stationary in first
differences but not in levels, thus all the time series are I(1). This result shows that we
can use Johansen technique to test whether a combination of these variables is
stationary. The variables studied in this case are cointegrated and thus there is a long –
run relationship between them. The order of VAR was determined by the Schwarz –
Bayesian criterion and the Akaike criterion, while with the application of LR test was
found equal to zero.
In Table 3 are given the results of Johansen and Juselious cointegration test (1990,
1992), regarding the variables ci, ir, ipi while the number of lags in VAR = 3.
Table 3: Johansen and Juselious cointegration test for the variables ci, ir, ipi, while lags in
VAR=3.
Null Eigenvalue
Trace
Statistic
0.05
Critical Value
r=0 0.17067 46.85758 47.85613
r 1 0.15861 26.47564 29.79707
r 2 0.561518 9.807282 15.49471
Null Eigenvalue
Max – Eigen
Statistic
0.05
Critical Value
r =0 0.17067 60.9593 56.43
r 1 0.15861 30.9456 35.37
r 2 0.561518 14.8518 18.08

As it is obvious, according to the results given to the aforementioned table 3, there is
one long run relationship among the variables studied with the method of the maximum
eigenvalue statistic ad no long- run relationship with the trace statistic. The cointegrating
vector that was suggested by the program is the following;
ip = 39.70125ci+0.25ltl (9)
From the cointegration vector it can be concluded that the industrial production index
(Economic Growth) is positively related to the interest rates (Development in the Banking
Sector) as well as to the capitalization index (Development in the Stock Market).
Additionally, the coefficients of the vector represent the long – term elasticity and thus, it
is evident that the functions of Stock Market are elastic, whereas the functions of the
banking sector are inelastic. As it has already been mentioned the capitalization index
represents the stock market, the interest rates represent the banking sector while the
industrial production index represents the economic growth of Bulgaria. The long run
relationship indicates the integration in the market as well as the interdependence of the
different sectors of the economy. Finally, the signs of the cointegration vector allow us to
use the above relationship as an Error Correction Mechanism in a VAR Model, since they
are based on the economic theory.
The next step was to estimate the error correction model and to apply a number of
diagnostic tests. The final form of the Error – Correction Model was selected by the
approach suggested by Hendry (Maddala, 1992). The autocorrelation as well as the
heteroscedastity of the residuals were tested with the Lagrange (LM) test (Godfrey, 1978).
Thus, the autocorrelation, the heteroscedasticity, as well as the fit of the model were
examined. Furthermore the Bera – Jarque test (1980), was applied aiming at testing the

normality of the distribution of the residuals while the functional form of the model was
tested with the Ramsey‟s Reset test (Ramsey, 1969).
According to the results given in table 4, the model is statistically significant while
50% of the total variation of the dependent variable can be described by the model.
Regarding to the diagnostic tests we can conclude that although the model does not have a
problem of fit (results of RESET test), and heteroscedastity it does have a problem of serial
correlation. Furthermore, the Error – Correction term has a negative sign and is statistically
significant. The negative sign confirms that there is a long – run equilibrium relation that
links the dependent with the independent variables while its coefficient 0.00717 indicates a
satisfactory rate of convergence to the equilibrium each period. Τhe estimated error
correction model is the following;
Table 4: Error correction model
100171.074.119)( tepD 2.3846D(ci(-1))+22.1662D(ir(-1))+39.1775D(p(-1))+6.6871D(s(-1))-
(t) (-0.88258) (2.895) (-1.14) (-0.427) (1.0433) (0.195)
0.546D(pt(-1)) -0.432D(ci(-2))-3.4154D(ir(-2))-40.34D(p(-2))-2.8D(s(-2))-0.5769D(pt(-1))
(t) (-4.57) (-0.22) (-0.06) (-1.14) (-0.07) (-4.952)
2
R = 0.507 F-statistic=6.9289 D.W=1.7059
[0.000]
ΑΧ2(12)=53.4616[0.000], BΧ
2(1)=12.9698[0.000], C X
2(1)=0.64607 [0.421] D X
2(2)=6.7879[0.034]
Notes: Estimates via Microfit
D: Denotes the first differences of the variables
2
R : Coefficient of multiple determination adjusted for the degrees of freedom (d.f)
D.W. = Durbin Watson statistic
F(n,m) = F statistic with n,m d.f. respectively.

A: X2(n) Lagrange multiplier test of residual serial correlation, following X2 distribution with n d.f.
B: Ramsey's RESET test using the square of the fitted values
C: X2(n) Heteroscedasticity test following X2 distribution with n d.f.
D: X2(n) Normality test based on a test of skewness and kyrtosis of residuals, following X2 distribution with n d.f
( ) = We denote the t – ratio for the corresponding estimated regression coefficient.
[ ] = We denote prob. Levels
9. Granger Causality Test
Finally, the last step of the process included the realization of the Granger causality
tests regarding the three variables employed. The criterion used for this test is F – statistic.
The null hypothesis tested was that each variable used in the model Granger cause the
other. The results of the Granger causality tests are given in the following table 5; The
number of leads and lags used were determined with the assistance of the Akaike‟s
information criterion (AIC) as well as the criterion of Schwartz (SC). The results in the
following table 5 are the following;
There is a bilateral causal relationship between the capitalization index and the
industrial production index for the data used.
There is a bilateral relationship between the industrial production index and the
interest rates in the banking sector.
There is a unilateral causal relationship with direction from the inflation to the
industrial production index.
There is a unilateral causal relationship with direction from the interest rates to the
capitalization index.
There is a unilateral causal relationship with direction from inflation rate to the
capitalization index.

There is a unilateral causal relationship with direction from the interest rates to the
inflation rate.
Table 5: Results of Granger Causality tests
Null Hypothesis: F-Statistic Probability
ci does not Granger Cause ipi 3.76187 0.02735
ipi does not Granger Cause ci 6.02438 0.00362
ltl does not Granger Cause ipi 17.2346 5.6E-07
ipi does not Granger Cause ltl 4.04226 0.02117
p does not Granger Cause ipi 4.42194 0.01501
ipi does not Granger Cause p 0.75494 0.47328
ltl does not Granger Cause ci 5.81840 0.00434
ci does not Granger Cause ltl 0.80779 0.44936
p does not Granger Cause ci 6.30847 0.00283
ci does not Granger Cause p 0.33472 0.71651
p does not Granger Cause ltl 0.74114 0.47973
Ltl does not Granger Cause p 2.83692 0.06437
Notes: The figures in parenthesis after the F – statistics are the numbers of lags and leads for the dependent variables and
causal variables.
Critical value: (2.34) 5.34, 3.3 (3.34) 4.4, 2.87 (4.34) 3.87, 2.65 for 1% and 5% significance levels respectively
*, ** indicate that the statistics under preview are rejected in 1% and 5% significance levels respectively.
Thus, according to the aforementioned results there is a bilateral relationship
between the economic growth development in the stock market, as well as between the
economic growth and the development in banking sector. Additionally, the inflation
Granger – cause the industrial production index, the industrial production index Granger –
cause the interest rates, the inflation Granger – cause the capitalization index and finally,
the interest rates Granger – cause the inflation rate.
2. CONCLUSION
The present paper by employing monthly data in the case of Bulgaria examined the relationship between the
development in the stock and credit market and economic growth. Furthermore, the impact of the inflation on
economic growth was examined. For testing this relationship a multivariate autoregressive VAR model was
used for the case of Bulgaria, while the period studied is 01.2004 – 05.2011. The cointegration technique was
employed aiming at the testing of long – run relationships between the time series used while the VEM
(Vector Error Correction) provided a way of combining the dynamics of the short run (changes) and the long
– run (levels) adjustment processes simultaneously (Dritsaki and Dritsaki - Bargiota, 2006).
The application of the ADF test has indicated that all the individual time series are I(1), while the Johansen
cointegration technique indicated the existence of a long – run relationship among the variables used. This
result shows us that there is interdependence among the functions of stock market, credit market and
economic development in the case of a transition economy like Bulgaria. The estimated residual of the
cointegration appears as the error correction term in the dynamic VEC model. What must be mentioned is the
negative sign of the error correction term as well as its statistical significance. This model suffers from
problem of serial autocorrelation while there are no problems of heteroscedasticity, normality and functional
form. The significance of the error correction term is evident of the existence of the long – run relationship
among the variables of the model.
As far as the results of the causality analysis are concerned, we found a bilateral relationship between the
development in the stock market and the economic growth, as well as between the economic growth and the
development in the banking sector. Finally, the development in the banking sector Granger – cause the
development in the stock market. The alteration of the Bulgarian economy from a centralized to a market
economy, the fact that is a member state of European Monetary Union and the inflow of foreign investors
due to the emertion of the transition economy may account for the results found. Additionally, the inflation in
the case of Bulgaria was one of the most important problems that Bulgarian governments confronted by
tightening the fiscal policy a measure that had immediate results. This economic environment influenced the
function of the financial market which in turn affected the economic growth of the economy under preview.
According to Boyd et al. (2000), the sustained inflation affect in a negative way the financial development
despite the fact that high rates of inflation are past experience for Bulgaria. Regarding the policy that has to
be followed in terms of fiscal and monetary policy has to shelter the macroeconomic stability in order to
preserve the financial development as well as the economic growth of the economy under preview.
REFERENCES
Arestis, P., Demetriades, P., Luintel, K.B., 2001. Financial development and economic growth: the role of stock markets.J. Money Credit Bank. 33, 16–41.
Boyd, J. and Smith, B. (1996). “The co - evolution of the real and financial sectors in the growth process”, The World Bank Economic Review 10, 371–396.
Boyd, J., Levine R. and Smith, B. (2001). The impact of inflation on financial sector performance.
Dickey, D.A. and Fuller, W.A. (1979) “Distribution of the estimators for autoregressive time series with a unit root”, Journal of the American Statistical Association 74, 427–431.
Dritsaki C. And Dritsaki – Bargiota M., (2006). The Causal Relationship between Stock, Credit Market and Economic Development: An Empirical Evidence for Greece. Economic Change and Restructuring, 38:113 – 127.
Duenwald C., Gueorguiev N., and Schaechter A., (2005). Too Much of a Good Thing? Credit Booms in Transition Economies: The Cases of Bulgaria, Romania, and Ukraine. IMF Working Paper WP/05/128
Godfrey, L.G. (1978), Testing against general autoregressive and moving average error models when the regressors
include lagged dependent variables, Econometrica 46, 1293–1301.
Gujarati, D.N. (2003), Basic Econometrics. 4th ed., McGraw-Hill, New York.
International Monetary Fund, 2004, World Economic Outlook: Advancing Structural
Reforms, World Economic and Financial Surveys (Washington).
Jamal, A. M. M., Hsing, Y. and Ramsey, R. D. (2006), „Effects of Macroeconomic Policies on Output Fluctuations in
Bulgaria‟, Atlantic Economic Journal, 34:239 – 240.
Jarque, C. and Bera, A. (1980) “Efficient tests for normality, homoscedasticity and serial independence of regression residuals”, Economics Letters 6, 255–259.
Johansen, S. (1988), “Statistical analysis of cointegration vectors”, Journal of Economic Dynamics and Control 12, 231–254.
Johansen, S. and Juselious, K. (1990) “Maximum likelihood estimation and inference on cointegration with applications to the demand for the money”, Oxford Bulletin of
Economics and Statistics 52, 169–210.
Johansen, S. and Juselious, K. (1992) “Testing structural hypotheses in a multivariate
cointegration analysis at the purchasing power parity and the uncovered interest parity for the UK”, Journal of Econometrics 53, 211–244.
Jung, W.S. (1986), “Financial development and economic growth: international evidence”, Economic Development of Cultural Change 34, 336–346.
Kar, M. and Pentecost, E.J. (2000), „Financial development and economic growth in Turkey: further evidence on the
causality issue‟, Economic Research Paper No. 00/27, Department of Economics, Loughborough University.
Available from: http://www.lboro.ac.uk/departments/ ec/Dept%20Research%20papers/Papers2000/00-27/erp00-27.pdf.
Levine, R. and Zervos, S. (1993) “What we have learned about policy and growth from cross country regressions?” Papers and Proceedings 83, 426–430.
Levine, R., 1997. Financial development and economic growth: views and agenda. J. Econ. Lit. 35, 688–726.
Levine, R., 1999. Law, finance, and economic growth. J. Financ. Intermed. 8, 36–67.
Levine, R., 2002. Bank-based or market-based financial systems: which is better. J. Financial Intermed. 11, 398–428.
Levine, R., Zervos, S., 1998. Stock markets, banks and economic growth. American Economic Review 88, 537–558.
Levine, R., Loayza, N., Beck, T., 2000. Financial intermediation and growth: causality and causes. J. Monet. Econ. 46, 31–77.
Lewis, W.A. (1955), The Theory of Economic Growth, George Allen and Unwin London.
Luintel, K.B. and Khan, M. (1999) “A quantitative reassessment of the finance-growth nexus:evidence from a multivariate VAR, Journal of Development Economics 60, 381–405.
Maddala, G.S. (1992), Introduction to Econometrics, 2nd ed. New Jersey, Prentice Hall.
Mills, J. and Prasad, K. (1992) “A comparison of model selection criteria”, Econometric Reviews 11, 201–233.
National Statistical Institution of Buglaria – NSI
Ramsey, J.B. (1969), „Test for specification errors in classical linear least squares regression analysis‟, Journal of the Royal Statistical Society B 350–371.
Schumpeter, J.A. (1912), Theorie der Wirtschaftlichen Entwicklung (The Theory of Economic Development). Leipzig: Dunker and Humblot, Translated by Redvers Opie, Cambridge,MA, Harvard University Press, 1934.
Schwartz, R. (1978), “Estimating the dimension of a model”, Annuals of Statistics, 6, 461–464
Shan, J.Z. and Morris, A.G. (2002). “Does financial development „Lead‟ economic growth?” International Review of Applied Economics 16(2), 154–169.
Wyzan Μ. (1996), Economic Change in Bulgaria since the Fall of Communism, in Jeffries, I. (ed.) Problems of economic and political transformation in the Balkans, Pinter: London; New York.