Embed Size (px)
Citation preview

Master of Science Thesis KTH School of Industrial Engineering and Management
Energy Technology EGI-2013-049MSC EKV951 Division of Heat & Power SE-100 44 STOCKHOLM
Market Analysis for Gas Engine Technology in Algeria
Stéphane Michaut

Master of Science Thesis EGI-2013-049MSC EKV951
MARKET ANALYSIS FOR GAS ENGINE TECHNOLOGY IN ALGERIA
Stéphane Michaut
Approved
2013-06-04
Examiner
Prof. Torsten Fransson
Supervisor at KTH
Miroslav Petrov Commissioner
CLARKE ENERGY Ltd., Algeria
Contact person at industry
Didier Lartigue
Abstract The objective of this diploma thesis is to investigate the potential of combined heat and
power plants based on gas engine technology in Algeria. This market analysis has been performed in order to identify the key markets for the newly created French subsidiary of Clarke Energy Group to expand its business in North Africa. After analyzing the structure of the Algerian energy sector and the potential of each gas engine application, three key sectors were identified. For each sector, a technical and economical analysis was conducted in order to define its potential, its constraints, and the time frame under which they could become mature markets.
With a potential of 300 MW, the first targeted sector is related to the national power utility Sonelgaz and consists in small scale power plants with a nominal power output < 20 MW, in which the use of gas engines instead of gas turbines could reduce up to 50% the price of kWh generated over the lifecycle of the plant. With a total of 450 MW, the second market representing a great potential for gas engines development in Algeria is the industrial sector and in particular brick factories, in which cogeneration plants become profitable within 4 years, can save up to 40% of primary energy and generate electricity whose cost of production is 30% lower than the average grid price. Finally, the third sector identified is the associated petroleum gas from which 9% – 5.10⁹ cubic meters – are is still being flared in Algeria while they could be used to generate up to 300 MW for the O&G utilities if only 10% of them would be recovered, reducing thus CO2 emissions and diesel costs.
This report presents the method and the tools that were developed in order to analyze the economical viability of gas engine based power plants for the three targeted markets in Algeria, and the final results from the study.

Master Thesis:
Market analysis for gas engine technology in Algeria
Student: Stéphane Michaut
KTH Supervisor: Miroslav Petrov - Department of Energy Technology, ITM
Company Supervisor: Didier Lartigue - Clarke Energy France
June 2013

- 2 - Market Analysis for Gas Engine Technology in Algeria Stéphane Michaut, 2013
Contents CONTENTS ................................................................................................................................................. - 2 -
LIST OF FIGURES ........................................................................................................................................ - 5 -
LIST OF TABLES .......................................................................................................................................... - 7 -
ABBREVIATIONS ........................................................................................................................................ - 8 -
1. INTRODUCTION ................................................................................................................................. - 9 -
2. ALGERIAN ENERGY SECTOR ............................................................................................................. - 10 -
2.1 ORGANIZATION OF THE SECTOR ................................................................................................................ - 10 - 2.1.1 Ministry of Energy and Mines...................................................................................................... - 10 - 2.1.2 CREG ............................................................................................................................................ - 10 - 2.1.3 ARH .............................................................................................................................................. - 10 - 2.1.4 ALNAFT ........................................................................................................................................ - 10 - 2.1.5 APRUE .......................................................................................................................................... - 11 - 2.1.6 Sonatrach .................................................................................................................................... - 11 - 2.1.7 Sonelgaz ...................................................................................................................................... - 11 -
2.2 OVERVIEW OF THE ENERGY SECTOR ........................................................................................................... - 11 - 2.2.1 Hydrocarbons .............................................................................................................................. - 11 -
2.2.1.1 Oil ....................................................................................................................................................... - 11 - 2.2.1.2 Gas ...................................................................................................................................................... - 12 -
2.2.2 Electricity ..................................................................................................................................... - 13 -
3. IDENTIFICATION OF KEY MARKETS ................................................................................................... - 16 -
3.1 GAS ENGINES APPLICATIONS..................................................................................................................... - 16 - 3.2 POTENTIAL OF EACH APPLICATION ............................................................................................................. - 16 -
4. SMALL SIZE POWER PLANTS FOR ELECTRICITY GENERATION ............................................................ - 18 -
4.1 POTENTIAL OF THE SECTOR ...................................................................................................................... - 18 - 4.1.1 Development plan of Sonelgaz for renewables ........................................................................... - 18 - 4.1.2 Development plan of Sonelgaz for fossil fueled power plants ..................................................... - 19 - 4.1.3 Development plan of Sonelgaz for small size power plants ........................................................ - 19 - 4.1.4 Advantages and challenges with gas engine technology ............................................................ - 20 - .................................................................................................................................................................. - 21 -
4.2 SONELGAZ’ COMPARISON METHOD ........................................................................................................... - 22 - 4.2.1 Technical bids .............................................................................................................................. - 22 -
4.2.1.1 Site conditions .................................................................................................................................... - 22 - 4.2.1.2 Specific heat rate ................................................................................................................................ - 22 -
4.2.2 Financial assumptions ................................................................................................................. - 22 - 4.2.2.1 Natural gas price ................................................................................................................................. - 23 - 4.2.2.2 VAT and custom duties rates .............................................................................................................. - 24 - 4.2.2.3 Discount rates ..................................................................................................................................... - 24 - 4.2.2.4 Preference margin .............................................................................................................................. - 24 -
4.2.3 Financial evaluation .................................................................................................................... - 25 - 4.2.3.1 Commercial bid................................................................................................................................... - 25 - 4.2.3.2 Cash actualization ............................................................................................................................... - 26 - 4.2.3.3 Spare parts cost .................................................................................................................................. - 27 -

Market Analysis for Gas Engine Technology in Algeria - 3 - Stéphane Michaut, 2013
4.2.3.4 Cost of kWh ........................................................................................................................................ - 28 - 4.3 RESULTS OF THE ANALYSIS – SMALL POWER GENERATION PLANTS .................................................................... - 29 -
5. CHP POTENTIAL FOR THE INDUSTRY ................................................................................................ - 31 -
5.1 OVERVIEW OF THE SECTOR ...................................................................................................................... - 31 - 5.2 DEVELOPMENT OF AN EXCEL ANALYTIC TOOL BASED ON ANNUAL CONSUMPTION ................................................ - 31 -
5.2.1 SONELGAZ’ billing ........................................................................................................................ - 31 - 5.2.1.1 Electricity rates ................................................................................................................................... - 32 - 5.2.1.2 Gas rates ............................................................................................................................................. - 33 -
5.2.2 Incentives and subsidies .............................................................................................................. - 34 - 5.2.2.1 Feed-in tariffs ..................................................................................................................................... - 34 - 5.2.2.2 Subsidies ............................................................................................................................................. - 35 -
5.2.3 Engine choice ............................................................................................................................... - 35 - 5.2.4 Electrical and thermal annual gains ............................................................................................ - 37 -
5.2.4.1 Energy balance, single engine power plant ........................................................................................ - 37 - 5.2.4.2 Energy balance, multiple engine power plant .................................................................................... - 39 - 5.2.4.3 Annual savings on energy bill ............................................................................................................. - 41 -
5.2.5 Oil and Maintenance costs .......................................................................................................... - 43 - 5.2.5.1 Oil cost ................................................................................................................................................ - 43 - 5.2.5.2 Maintenance costs ............................................................................................................................. - 43 -
5.2.6 Analytical tools: Payback Time, Net Present Value, Rate of Return, Cost of kWh ....................... - 44 - 5.2.6.1 ROI, NPV, IRR ...................................................................................................................................... - 44 - 5.2.6.2 Cost of kWh ........................................................................................................................................ - 44 -
5.3 RESULTS OF THE ANALYSIS ....................................................................................................................... - 45 - 5.3.1 Influence of electrical and thermal efficiencies on profitability .................................................. - 47 - 5.3.2 Influence of plant size on profitability: economies of scale ......................................................... - 49 - 5.3.3 Influence of cogeneration type on profitability ........................................................................... - 50 -
5.3.3.1 Hot air ................................................................................................................................................. - 50 - 5.3.3.2 Hot water ............................................................................................................................................ - 50 - 5.3.3.3 Steam .................................................................................................................................................. - 50 - 5.3.3.4 Impact on profitability ........................................................................................................................ - 52 -
5.3.4 Single vs multiple engine power plant: influence of flexibility and grid reliability on profitability- 53 -
5.3.4.1 Value of grid stabilization ................................................................................................................... - 53 - 5.3.4.2 Value of grid independence ................................................................................................................ - 55 - 5.3.4.3 Last kWh produced ............................................................................................................................. - 56 -
5.3.5 Influence of electricity and gas rates evolution on profitability .................................................. - 57 - 5.3.5.1 Sonelgaz prices increase ..................................................................................................................... - 57 - 5.3.5.2 Introduction of feed-in tariffs ............................................................................................................. - 59 -
5.3.6 Application to a similar market: Tunisia ...................................................................................... - 60 - 5.4 EXAMPLES OF OPERATIONAL CHP PLANTS .................................................................................................. - 63 -
5.4.1 Applications to the brickyard industry: the TAFNA example ....................................................... - 63 - 5.4.2 Application to the food industry: the Nejma oil refinery example .............................................. - 64 -
5.5 PROJECTED CHP PLANTS ......................................................................................................................... - 65 - 5.5.1 Application in the tertiary sector: Algiers’ Mosque trigeneration project ................................... - 65 -
5.6 CONCLUSION ........................................................................................................................................ - 67 -
6. ELECTRICITY PRODUCTION AS AN ALTERNATIVE TO GAS FLARING .................................................... - 68 -
6.1 OVERVIEW OF THE SECTOR ...................................................................................................................... - 68 - 6.2 LIMITS OF THE ANNUAL CONSUMPTION – BASED MODEL ................................................................................ - 71 - 6.3 DEVELOPMENT OF AN EXCEL ANALYTIC TOOL BASED ON INSTANTANEOUS LOAD .................................................. - 71 -
- 4 - Market Analysis for Gas Engine Technology in Algeria Stéphane Michaut, 2013
6.3.1 Implementation of derating ........................................................................................................ - 71 - 6.3.1.1 Influence of fuel gas composition ....................................................................................................... - 71 - 6.3.1.2 Influence of temperature and altitude ............................................................................................... - 72 - 6.3.1.3 Response to temperature variations .................................................................................................. - 73 -
6.3.2 Multiple engine power plant: response to load variations .......................................................... - 75 - 6.3.3 Maintenance hours: role of stand-by engine .............................................................................. - 76 - 6.3.4 Annual revenues .......................................................................................................................... - 76 -
6.4 RESULTS OF THE ANALYSIS FOR THE INDUSTRY .............................................................................................. - 77 - 6.4.1 Influence of temperature on profitability .................................................................................... - 77 -
6.4.1.1 Without power output guaranteed .................................................................................................... - 77 - 6.4.1.2 With power output guaranteed ......................................................................................................... - 77 -
6.4.2 Influence of load variation and differences between models ...................................................... - 79 - 6.5 RESULTS OF THE ANALYSIS FOR THE O&G SECTOR ........................................................................................ - 81 -
6.5.1 Influence of fuel input: diesel, flare gas and natural gas ............................................................ - 81 - 6.5.1.1 on power output ................................................................................................................................ - 82 - 6.5.1.2 on power plant profitability ............................................................................................................... - 82 -
6.5.2 Influence of load variations on profitability ................................................................................ - 84 - 6.5.3 Study case: Waha flare gas project, Tunisia ................................................................................ - 85 -
7. CONCLUSIONS ................................................................................................................................. - 86 -
7.1 DRIVERS AND INHIBITORS ........................................................................................................................ - 86 - 7.2 S.W.O.T. ANALYSIS ............................................................................................................................... - 87 - 7.3 DISCUSSION .......................................................................................................................................... - 88 -
BIBLIOGRAPHY ........................................................................................................................................ - 89 -

Market Analysis for Gas Engine Technology in Algeria - 5 - Stéphane Michaut, 2013
List of Figures Figure 2-1: Oil in Algeria - Production and consumption .................................................................. - 12 - Figure 2-2: Gas in Algeria - Producion and Consumption ................................................................. - 12 - Figure 2-3: Production capacity installed in Algeria (MW) ................................................................ - 13 - Figure 2-4: Electricity production in Algeria (TWh) ........................................................................... - 13 - Figure 2-5: Primary sources for electricity generation ...................................................................... - 14 - Figure 2-6: Evolution of electrical demand ....................................................................................... - 14 - Figure 2-7: Sonelgaz net result 2011 by branch ................................................................................ - 15 - Figure 3-1: Gas engines applications ................................................................................................. - 16 - Figure 4-1: Contribution of renewable energies for power generation ............................................ - 18 - Figure 4-2: Structure of the national power generation ................................................................... - 18 - Figure 4-3: Diesel-fired power plants - 5 year plan ........................................................................... - 19 - Figure 4-4: Small gas-Fired Power plants - 5 year Plan ..................................................................... - 20 - Figure 4-5: Comparison gas turbine / gas engine .............................................................................. - 21 - Figure 4-6: Derating and part load efficiency of gas turbines and gas engines ................................ - 21 - Figure 4-7: World natural gas prices ($/MMBtu - Estimated 2013 ................................................... - 23 - Figure 4-8: Value actualization curves .............................................................................................. - 24 - Figure 5-1: Algerian industries localisation ....................................................................................... - 31 - Figure 5-2: Ge Jenbacher power range ............................................................................................. - 36 - Figure 5-3: Calculation of unserved energy - Production and load curves ....................................... - 40 - Figure 5-4: Feasability results - cost of kWh over 15 years ............................................................... - 47 - Figure 5-5: Influence of electrical and thermal efficiencies on cost of kWh ..................................... - 48 - Figure 5-6: Influence of plant size on cost of kWh ............................................................................ - 49 - Figure 5-7: Production of steam @ 8 bars - 2 MW engine ................................................................ - 51 - Figure 5-8: Influence of cogeneration on cost of kWh ...................................................................... - 52 - Figure 5-9: Single vs multi engine CHP plant - cost of kWh .............................................................. - 54 - Figure 5-10: Single vs multiple CHP plant - Cost of kWh for 100% availability ................................. - 56 - Figure 5-11: Single vs multiple engine CHP plant - Last kWh produced ........................................... - 57 - Figure 5-12: Influence of Sonelgaz rates increase on cost of kWh ................................................... - 58 - Figure 5-13: Influence of feed-in Tariffs on ROI ................................................................................ - 60 - Figure 5-14: Comparison Algeria / Tunisia - Cost of kWh in Algeria ................................................. - 61 - Figure 5-15: Comparison Algeria / Tunisia - Cost of kWh in Tunisia ................................................. - 62 - Figure 5-16: Comparison Algeria / Tunisia - 20 year revenues ......................................................... - 62 - Figure 5-17: Tafna example – Layout and realisation ....................................................................... - 64 - Figure 5-18: Nejma example - 3D layout and PID ............................................................................. - 65 - Figure 5-19: Algiers Mosque project ................................................................................................. - 66 - Figure 5-20: Algiers Mosque Project - Cost of kWh .......................................................................... - 67 - Figure 6-1: Flare gas reduction projects in Algeria ............................................................................ - 69 - Figure 6-2: Associated gas volumes produced and flared in Algeria ................................................ - 69 - Figure 6-3: Algeria flares ................................................................................................................... - 70 - Figure 6-5: flare gas recovery with gas engine .................................................................................. - 70 - Figure 6-6: Composition, LHV and MN of some gases ...................................................................... - 72 - Figure 6-7: Natural gas - Composition and KHV of some fields ........................................................ - 72 -

- 6 - Market Analysis for Gas Engine Technology in Algeria Stéphane Michaut, 2013
Figure 6-8: Derating at higher temperatures and altitudes - Normal version .................................. - 73 - Figure 6-9: Dearting at higher temperatures and altitudes - Hot country version ........................... - 73 - Figure 6-10: Response to temperature variations - Normal version ................................................ - 74 - Figure 6-11: Response to temperature variations - Hot country version ......................................... - 74 - Figure 6-12: Response to the load - Multi engine power plant - Winter case .................................. - 75 - Figure 6-13: Response to the Load - Multi engine power plant - Summer case ............................... - 76 - Figure 6-14: Influence of derating - 15 year revenue ........................................................................ - 78 - Figure 6-15: Influence of derating - Cost of kWh .............................................................................. - 79 - Figure 6-16: Comparison between models - Load variations ............................................................ - 80 - Figure 6-17: Comparison between models - 15 year revenue .......................................................... - 80 - Figure 6-18: Fuel input - Emissions ................................................................................................... - 81 - Figure 6-19: Fuel input - Cost of kWh ................................................................................................ - 84 - Figure 6-20: Fuel Input – 15 year revenue ........................................................................................ - 84 - Figure 6-21: Waha site location ........................................................................................................ - 85 - Figure 6-22: Waha site design and realisation .................................................................................. - 85 -
Market Analysis for Gas Engine Technology in Algeria - 7 - Stéphane Michaut, 2013
List of Tables Table 2-1: IPPs in Algeria ................................................................................................................... - 15 - Table 3-1: Market segmentation by energy production type ........................................................... - 16 - Table 3-2: Market segmentation by gas input type .......................................................................... - 17 - Table 4-1: Technical bids caracteristics ............................................................................................. - 22 - Table 4-2: Power generation - Financial assumptions ...................................................................... - 23 - Table 4-3: Preference margin - Example ........................................................................................... - 25 - Table 4-4: Commercial bids - EPC of the power plant ....................................................................... - 25 - Table 4-5: Cash actualization of commercial bids ............................................................................. - 27 - Table 4-6: Spare parts cost actualization .......................................................................................... - 28 - Table 4-7: Sonelgaz attribution criterion - price of kWh ................................................................... - 29 - Table 4-8: Cost comparison - In Amenas - 6 x 5 MW ........................................................................ - 29 - Table 4-9: Cost comparison - Illizi - 3 x 5 MW ................................................................................... - 30 - Table 4-10: Cost comparison - El Golea - 3 x 10 MW + 2 x 5 MW ..................................................... - 30 - Table 5-1: Electricity rates for medium and high voltage customers in Algeria ............................... - 32 - Table 5-2: Calculation of electricity bill ............................................................................................. - 33 - Table 5-3: Medium pressure gas rates in Algeria .............................................................................. - 33 - Table 5-4: Calculation of gas bill ........................................................................................................ - 34 - Table 5-5: resume of CHP characteristics .......................................................................................... - 37 - Table 5-6: Electrical production of the CHP - Annual consumption model....................................... - 38 - Table 5-7: Thermal production of the CHP - Annual consumption Model ........................................ - 39 - Table 5-8: Calculation of unserved energy - 4 engine power plant .................................................. - 40 - Table 5-9 : Calculation of unserved energy ....................................................................................... - 41 - Table 5-10: Comparison of annual energy costs - 4,5 MW industry ................................................. - 42 - Table 5-11: Analytical tools – Cost of kWh – 4,5 MW industry ......................................................... - 45 - Table 5-12: Feasibility results – Example of final analysis ................................................................. - 46 - Table 5-13: Influence of electrical and thermal efficiencies on ROI ................................................. - 48 - Table 5-14 : Influence of Plant Size on ROI ....................................................................................... - 49 - Table 5-15: Calculation of steam production - 2 MW engine ........................................................... - 51 - Table 5-16: Influence of cogeneration type on ROI .......................................................................... - 52 - Table 5-17: Single vs multiple engine CHP plant - Value of grid stabilization ................................... - 54 - Table 5-18: Single vs multiple engine CHP plant – Value of grid independence ............................... - 55 - Table 5-19: Influence of Sonelgaz rates increase on ROI .................................................................. - 58 - Table 5-20: Influence of feed-in tariffs on ROI .................................................................................. - 59 - Table 6-1: Estimated flared volumes from satellite data .................................................................. - 68 - Table 6-2: Influence of temperature variations on profitability without power output restrictions - 77 - Table 6-3: Influence of temperature variations on profitability with minimum power output restriction .......................................................................................................................................... - 78 - Table 6-4: Comparison of both models ............................................................................................. - 79 - Table 6-5: Fuel input - Compared Profitability .................................................................................. - 83 - Table 7-1: Algerian gas engine market - Drivers and inhibitors ........................................................ - 86 - Table 7-2: Algerian gas engine market - S.W.O.T. analysis ............................................................... - 87 -

- 8 - Market Analysis for Gas Engine Technology in Algeria Stéphane Michaut, 2013
Abbreviations CHP Combined Heat and Power LHV Lower Heating Value HHV Higher Heating Value MN Methane Number PID Piping and Instrumentation Diagram ROI Return on Investment NPV Net Present Value IRR Internal Rate of Return OH Operating Hours MPR Maximum Power Reached PAD Power At Disposal FAD Flow At Disposal EPC Engineering, Procurement and Construction OPEC Organization of the Petroleum Exporting Countries O&G Oil and Gas GGFR Global Gas Flaring Reduction SWOT analysis - Strengths, Weaknesses, Opportunities, Threats
Market Analysis for Gas Engine Technology in Algeria - 9 - Stéphane Michaut, 2013
1. Introduction General Electric is through its Jenbacher division a global leader in gas engine manufacturing. They produce since 1957 reciprocating engines ranging from 330kWe to 9.5MWe electrical output which are known worldwide for their increased operational efficiency, greater reliability, reduce maintenance costs and enhanced capability to operate on both natural gas and gases with lower calorific value or unusual composition, such as landfill, biogas, coal mine methane, flare gas, coke oven gas and syngas from gasification process.
Clarke Energy is a world leader in the design, turnkey installation and long term maintenance of gas engines in power generation and co-generation applications. As the largest independent GE Jenbacher distributor, they have been successfully distributing its product for 18 years in more than 10 countries. Exclusively focused on gas engines, they have an installed base of over 2,500 MW which represents 20% of GE Jenbacher’s fleet and the largest stock holding outside the factory.
As part of its global growth and geographical expansion plan, Clarke Energy through its French subsidiary decided to extend towards to North Africa. After successful start of Tunisian activities in 2008 with turnkey projects delivered in three key applications – waste food biogas, associated petroleum gas, industrial natural gas CHP – Clarke Energy asked for a further expansion in North Africa and became 2011 exclusive distributor and service provider for GE Gas Engines products in Algeria.
As the largest country in Africa and one of the major gas producers in the world, Algeria is a promising country. Powering almost 80% of national electrical needs, General Electric started activities there more than 40 years ago and is promised to a golden age after successfully winning a 8,4 GW deal. But with 97% of its electricity being produced from natural gas, mostly with low efficiency simple cycle gas turbines, Algerian reserves are rapidly depleting and the need for efficiency arose. In this framework, developing gas engine solutions with 45% electrical efficiency and up to 90% total efficiency is meaningful, and a deeper market analysis was needed to determine where and how Clarke Energy could develop the gas engine business by combining its worldwide know how with Algerian market specificities.
This paper presents the Algerian energy sector, the market assessments made for Algeria and the three key markets for which the overall potential amounts to more than 1000 MW: small size power plants for grid feeding, CHP applications for the industry and APG plants for flare gas reduction. It presents the tools developed to evaluate the potential of each of these sectors, and ultimately the S.W.O.T. analysis of Clarke Energy as the newly appointed GE Jenbacher distributor in Algeria.

- 10 - Market Analysis for Gas Engine Technology in Algeria Stéphane Michaut, 2013
2. Algerian Energy Sector 2.1 Organization of the sector
2.1.1 Ministry of Energy and Mines The Ministry of Energy and Mines is the ministry in charge of the energy sector. It is responsible for implementing relevant policies and strategies regarding production, transport and commercialization of all hydrocarbons, mine and energy resources. It is also responsible for implementing adequate policies regarding renewable energy and energy efficiency.
As 97% of Algeria’s export revenue comes from the hydrocarbons sector, the Ministry of Energy and Mines plays a key role in the country’s economy. It has a strong regulation role, by ensuring energy sector provides sufficient short term revenues for the country’s development needs while optimizing the long term production; and also by controlling domestic prices to make energy stay affordable for its population.
After many years of being state-run businesses, electricity sector and hydrocarbons sector were both liberalized in 2001 and 2005 in order for public companies to focus on their core businesses production, transport and commercialization. Independent authorities CREG, ARH and ALNAFT were created and entitled to implement and monitor application of energy policies draft by the Ministry, while public companies Sonelgaz and Sonatrach became “simple” economic players among other private players allowed to enter the energy market.
2.1.2 CREG CREG is the Energy and Gas Regulation Committee. It was created 2002 following the liberalization of electricity and gas distribution sector to endorse the responsibility of public service and provide guidance when it comes to electricity and gas national needs. Main task of this committee is thus to make sure Algerian population is provided with reliable electricity and gas at an affordable price. It makes yearly review of domestic consumptions, identifies possible pathways for middle-term evolution (10 years) and indicates additional production capacities to be installed in order to satisfy these needs. It decides the tariffs for end use customers and provides guidance for environmental regulation.
2.1.3 ARH ARH is the Hydrocarbon Regulation Authority. It was created 2005 following the liberalization of hydrocarbon sector and has the same prerogatives as the CREG: provide guidance for satisfying domestic demand of hydrocarbons. It monitors the development of retailing infrastructures, controls market prices and provides environmental recommendations.
2.1.4 ALNAFT ALNAFT is the National Agency for the Valorization of Hydrocarbons. It was also created 2005 following the liberalization of hydrocarbon sector. It is responsible for optimizing the use of Algerian hydrocarbon resources by giving exploration authorizations, monitoring both production and remaining resource levels and finally approving exploitation contracts and development plans. Though liberalized in 2005, market of hydrocarbons still remains “chasse gardée” of the national

Market Analysis for Gas Engine Technology in Algeria - 11 - Stéphane Michaut, 2013
company of hydrocarbons Sonatrach, with an obligation enforced in 2006 for all investments made in this sector (exploration, production, transport or refining) to be done in partnership with Sonatrach having a minimum 51% share in the capital.
2.1.5 APRUE APRUE is the Agency for the Promotion and Rationalization of Energy Use. They are implementing and financing measures to promote energy efficiency within four main sectors: industry, building, lighting and transport.
2.1.6 Sonatrach 2011 ranked Sonatrach 12th petroleum company in the world, and 5th natural gas exporter in the world. It was created following Algeria’s independence to run all hydrocarbon activities in the country. With a turnover of $72 billion, it is also the first company in Africa. As a state company, it had the monopoly and exclusivity over all activities related to exploration, production, transportation and commercialization until 2005 when the market was liberalized. Since 2005, Sonatrach is considered as an industrial group with public interest, that is an economical player among others. Major activities of Sonatrach are oil and gas exploration and production, transport through canalizations and commercialization on national territory as well as abroad through its four ports located along the Mediterranean sea, which brings 97% of Algeria’s export revenue and ensures on its own the Algerian economic growth.
2.1.7 Sonelgaz Also created after the independence, the 100% state owned company Sonelgaz was sole responsible for the production, transport and commercialization of electricity in Algeria, and also had monopoly over transport and distribution of natural gas until 2002 liberalization law. While introducing competition in electricity sector, this law also gave Sonelgaz its actual status of an industrial group constituted by several independent branches, each of them with an obligation to results. It also paved the way for private electricity production and for an electricity market in Algeria, with new entities such as market operator and system operator to be created within Sonelgaz.
2.2 Overview of the energy sector
2.2.1 Hydrocarbons
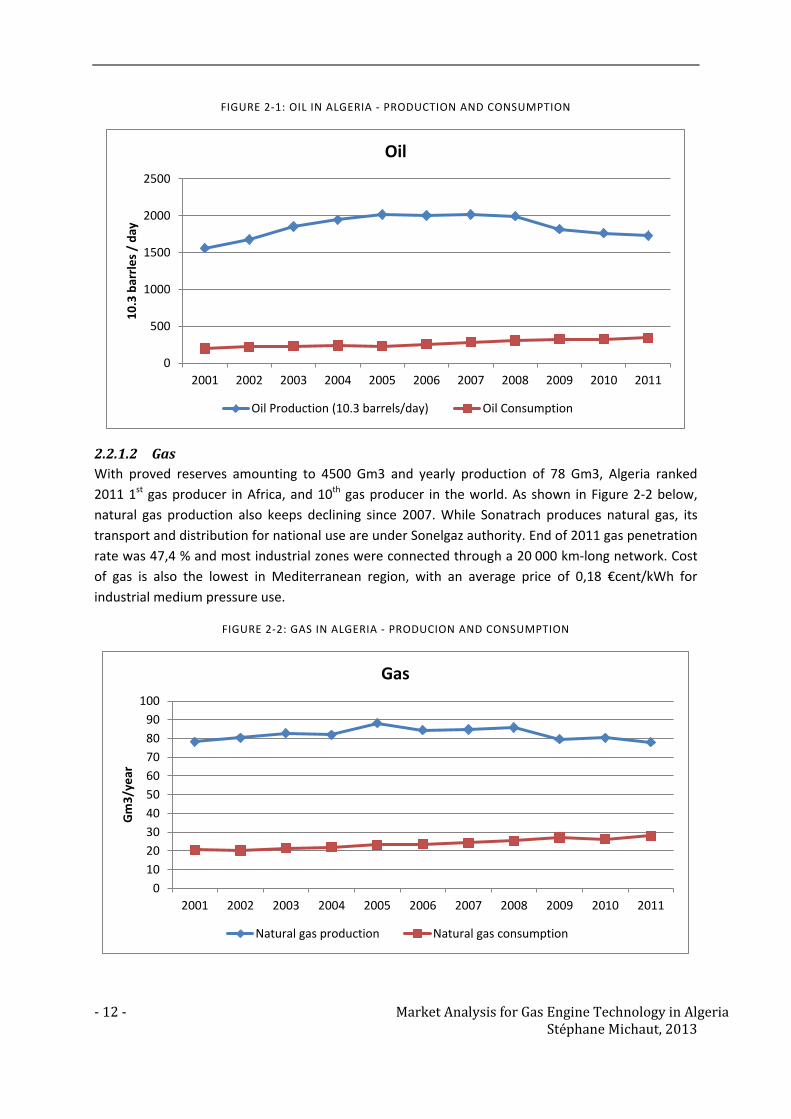
2.2.1.1 Oil Algeria is an important player of the OPEC since 1969. With proved reserves amounting to 12,2 Gbl in 2011 and a production of 1 729 000 bl/day, it ranks 15th in the world for oil reserves, 3rd oil producer in Africa and 18th oil producer in the world. Sonatrach produces, transports, processes and commercializes the Algerian oil on national territory and abroad. As shown in Figure 2-1, current production keeps declining since 2007.
- 12 - Market Analysis for Gas Engine Technology in Algeria Stéphane Michaut, 2013
FIGURE 2-1: OIL IN ALGERIA - PRODUCTION AND CONSUMPTION
2.2.1.2 Gas With proved reserves amounting to 4500 Gm3 and yearly production of 78 Gm3, Algeria ranked 2011 1st gas producer in Africa, and 10th gas producer in the world. As shown in Figure 2-2 below, natural gas production also keeps declining since 2007. While Sonatrach produces natural gas, its transport and distribution for national use are under Sonelgaz authority. End of 2011 gas penetration rate was 47,4 % and most industrial zones were connected through a 20 000 km-long network. Cost of gas is also the lowest in Mediterranean region, with an average price of 0,18 €cent/kWh for industrial medium pressure use.
FIGURE 2-2: GAS IN ALGERIA - PRODUCION AND CONSUMPTION
0
500
1000
1500
2000
2500
2001 2002 2003 2004 2005 2006 2007 2008 2009 2010 2011
10.3
bar
rles /
day
Oil
Oil Production (10.3 barrels/day) Oil Consumption
0102030405060708090
100
2001 2002 2003 2004 2005 2006 2007 2008 2009 2010 2011
Gm
3/ye
ar
Gas
Natural gas production Natural gas consumption

Market Analysis for Gas Engine Technology in Algeria - 13 - Stéphane Michaut, 2013
2.2.2 Electricity End of 2011 Sonelgaz had connected 99% of its population to electricity through a large interconnected system in the North of the country and some isolated grids in the South. As showed in the graphs below, the overall capacity installed in Algeria doubled between 2001 (5 600MW) and 2011 (11 400 MW), while electricity production reached 48,3 TWh. Energy mix entirely relies on fossil sources, with gas being the primary source used for 97% of electricity production (see Figure . The market being driven by the tremendous increase of the demand (+ 14% in 2012 when only 6% to 8% was expected, mostly due to steadily higher penetration of air conditioning systems), Sonelgaz launched an emergency plan in 2012 to double again the installed capacity by 2020, while having no other choice than proceeding to regional grid shedding in order to preserve system integrity during summer peak demand.
FIGURE 2-3: PRODUCTION CAPACITY INSTALLED IN ALGERIA (MW)
FIGURE 2-4: ELECTRICITY PRODUCTION IN ALGERIA (TWH)
0
2 000
4 000
6 000
8 000
10 000
12 000
1980 1990 2001 2007 2008 2009 2010 2011
Independant producer
Sonelgaz (SPE)
0
10
20
30
40
50
60
1980 1990 2007 2008 2009 2010 2011
Independant producer
Sonelgaz (SPE)

- 14 - Market Analysis for Gas Engine Technology in Algeria Stéphane Michaut, 2013
FIGURE 2-5: PRIMARY SOURCES FOR ELECTRICITY GENERATION
FIGURE 2-6: EVOLUTION OF ELECTRICAL DEMAND
Following 2002’s liberalization law, seven independent producers (see table below) entered the market with an increasing share in Algeria’s electricity generation fleet. However, if from a legal perspective the market is now opened it is de facto entirely regulated and Sonelgaz still has monopoly over all activities. It is the unique buyer, the unique retailer and the system operator. Sonelgaz produces around 75% of Algerian electricity, and has consequent shares in the remaining 25%, either through direct participation or through the entity AEC (Algerian Energy Company), a joint venture between Sonelgaz (50%) and Sonatrach (50%) created in 2001 whose goal is to produce and commercialize electricity. Moreover, these independent producers were not chosen by market mechanisms but through call of tenders. The electricity produced is also not bought given market mechanisms, but under long term purchasing agreement terms.
20%
45%
32%
1% 1% 1%
Steam turbine
Gas turbine
Combined cycle
Hydro
Diesel
Hybrid
0.00%
2.00%
4.00%
6.00%
8.00%
10.00%
12.00%
14.00%
16.00%
0
2000
4000
6000
8000
10000
12000
2002 2003 2004 2005 2006 2007 2008 2009 2010 2011 2012
Peak power demand (MW) Demand increase compared to previous year (%)

Market Analysis for Gas Engine Technology in Algeria - 15 - Stéphane Michaut, 2013
TABLE 2-1: IPPS IN ALGERIA
Name Company shares Commissioning Output Type
Kahrama AEC 95%, John Burrow Ltd 5% 2005 336 MW Gas turbine
SKS Sonelgaz 50%, Sonatrach 30%, AEC 20% 2006 825 MW Combined Cycle
SKB Sonelgaz 51%, Sonatrach 49% 2007 484 MW Gas turbine
SKH SNC Lavalin 51%, Sonelgaz Sonatrach AEC 49% 2009 1200 MW Combined Cycle
SPP1 Abener 51%, Neal 20%, Cofides 15%, Sonatrach 14% 2011 150 MW Hybrid CSP / Gas
SKT Sonelgaz 51%, Sonatrach 49% 2012 1200 MW Combined Cycle
SKD Sonelgaz 51%, Sonatrach 49% 2013 1200 MW Combined Cycle
Finally, retail tariffs are regulated by the state in order to maintain social peace with the lowest cost in Mediterranean region (2,3 €cent for industrial use), which leads Sonelgaz into a critical position every year: 2011 reached Sonelgaz a deficit of 10,7 millions €, with two distribution branches being bankrupt under the meaning of the Commercial Code. This leads to the necessary obligation for the state to compensate for these losses and subsidize price of electricity.
FIGURE 2-7: SONELGAZ NET RESULT 2011 BY BRANCH
Conclusion: Algeria has a state structured energy sector. Though some measures were taken to liberalize these activities, national companies like Sonelgaz and Sonatrach still have a de facto monopoly – or at least a complete control – over production, transport, distribution and commercialization of oil, gas and electricity. Algerian economy entirely relies on its hydrocarbons resources, with oil and gas providing both energy to the country at the lowest cost in the region, and comfortable export revenues. As hydrocarbon production declines and for the country to embrace sustainability and ensure a positive commercial balance in the future, Algeria has to think about smarter consumption models, develop renewables and local manufacturing instead of imports.
- 16 - Market Analysis for Gas Engine Technology in Algeria Stéphane Michaut, 2013
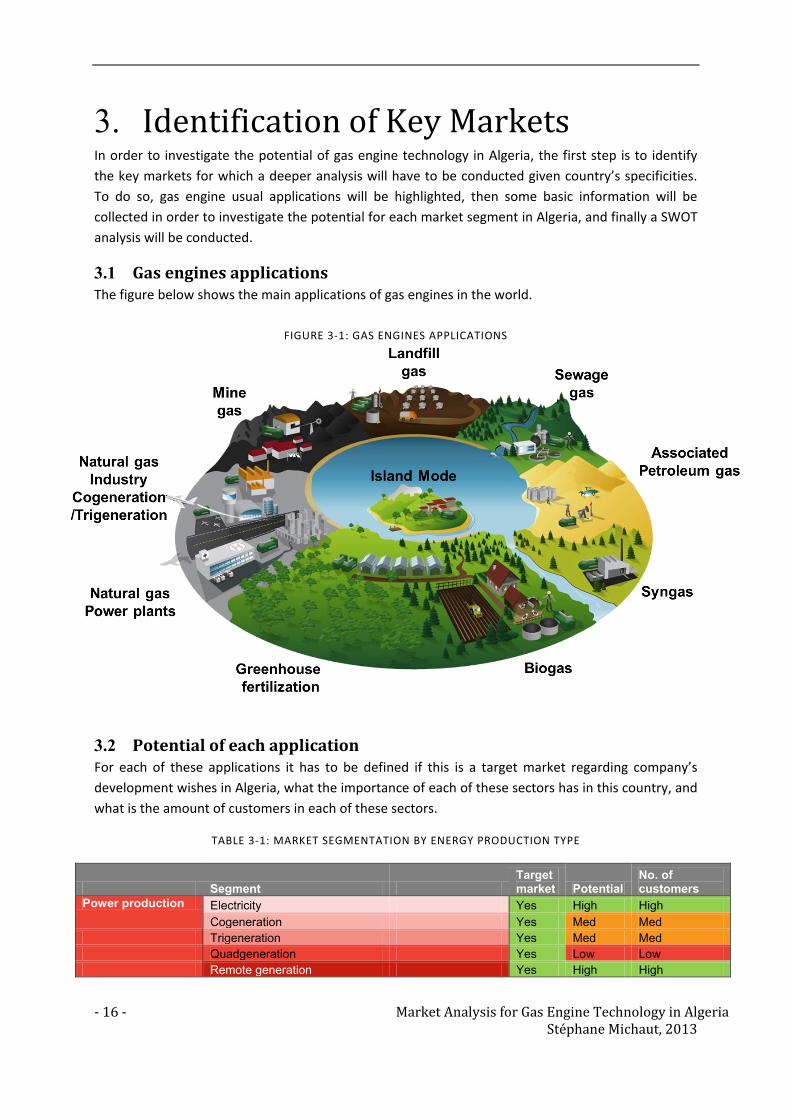
3. Identification of Key Markets In order to investigate the potential of gas engine technology in Algeria, the first step is to identify the key markets for which a deeper analysis will have to be conducted given country’s specificities. To do so, gas engine usual applications will be highlighted, then some basic information will be collected in order to investigate the potential for each market segment in Algeria, and finally a SWOT analysis will be conducted.
3.1 Gas engines applications The figure below shows the main applications of gas engines in the world.
3.2 Potential of each application For each of these applications it has to be defined if this is a target market regarding company’s development wishes in Algeria, what the importance of each of these sectors has in this country, and what is the amount of customers in each of these sectors.
TABLE 3-1: MARKET SEGMENTATION BY ENERGY PRODUCTION TYPE
Segment Target market Potential
No. of customers
Power production Electricity Yes High High Cogeneration Yes Med Med
Trigeneration Yes Med Med Quadgeneration Yes Low Low Remote generation Yes High High
FIGURE 3-1: GAS ENGINES APPLICATIONS

Market Analysis for Gas Engine Technology in Algeria - 17 - Stéphane Michaut, 2013
TABLE 3-2: MARKET SEGMENTATION BY GAS INPUT TYPE
Gas type Segment Sub-segment Target market Potential
No. of customers
Natural gas Electricity generation Yes High Low Commercial Offices Yes High High
Airports Yes Med Low Universities Yes Low Low Data Centres Yes Low Low Residential No Low Low Industrial Agrochemical Yes Low Low Bricks Yes High High Ceramics Yes High Med Coal No None None Construction Yes Low Low
Dyes and chemicals No Low Low
Engineering Yes Low Low Food processing Yes High High Glass Yes Med Med Oil and gas Yes High Low Packaging Yes Low Low Paper Yes Med Med Pharmaceuticals Yes Med Med Rubber No None None Steel No None None Textile Yes Low Low Greenhouse No None None Hospitals Yes Med Low Peaking station Yes Low Low Biological gas Biogas Agricultural No None None
Dairy No None None Distillery No None None MBT-AD No None None Waste No None None Sewage gas Yes Med Low Landfill gas Yes Med Low APG / flare gas Yes High Low Coal gas Coal seam methane No None None Working mine methane No None None Abandoned mine methane No None None Special gas Gasification Syngas No None None Wood gas No None None Pyrolysis Waste pyrolysis No None None Steel production gas Blast furnace gas No Low Low Converter gas No Low Low Coke gas No Low Low Coal gasification No None None
Conclusion: this market segmentation leads to identifying three key sectors representing high development potential of gas engines: industrial sector for CHP application, power generation sector for grid feeding, and Oil&Gas sector for associated petroleum gas use.

- 18 - Market Analysis for Gas Engine Technology in Algeria Stéphane Michaut, 2013
4. Small size power plants for electricity generation
4.1 Potential of the sector
4.1.1 Development plan of Sonelgaz for renewables Algeria’s development plan for renewables is one of the most ambitious in the world. It comprises the installation of a total capacity of 22 000MW of renewables (PV, CSP and wind) between 2011 and 2030, with 12 000MW dedicated to national consumption generating 40% of Algeria’s need in electricity, and 10 000MW dedicated to export.
FIGURE 4-1: CONTRIBUTION OF RENEWABLE ENERGIES FOR POWER GENERATION
FIGURE 4-2: STRUCTURE OF THE NATIONAL POWER GENERATION

Market Analysis for Gas Engine Technology in Algeria - 19 - Stéphane Michaut, 2013
In the first phase (2011-2013) available technologies are to be tested through pilot projects, while the deployment of the program will start during the second phase (2014-2015) and the large scale deployment is due to take place from 2016 on.
4.1.2 Development plan of Sonelgaz for fossil fueled power plants As seen in Part 2, electricity demand is acutely rising in Algeria. Over the past few years, both in terms of energy and in terms of peak power the average increase was between 6% and 8% per year (see Figure 2-6). But in 2011 and 2012, this increase reached 14%, which led Sonelgaz into a critical situation, where grid sheddings became necessary to preserve the stability of the grid. Consequently, Sonelgaz decided to launch, in addition to the 4000 MW planned for 2017, an additional emergency plan of 7x1200 MW combined cycle power plants. This mega deal (8400 MW) was won by General Electric and will ensure the company’s further development in Algeria for at least the next 20 years, with gas turbines to be commissioned by 2015 and complete combined cycles to be commissioned by 2017. Altogether Algeria will double its fossil fueled power production fleet within 5 years. Unfortunately the side effect of this demand driven emergency program is that renewable development program has been delayed, mostly due to the need for human resources allocation to the mega deal project.
4.1.3 Development plan of Sonelgaz for small size power plants Except in some particular cases, power plants above 50 MW are generally using gas turbines, due to the higher power output that can be reached per machine. Hence, the market analysis will focus on small size power plants. These small plants are all located in the south, feeding isolated networks with gas turbines whenever gas is available, or with diesel generators when there is no connection to the gas network. Figure 4-3 and Figure 4-4 show the 5-year development plan for these regions.
FIGURE 4-3: DIESEL-FIRED POWER PLANTS - 5 YEAR PLAN

- 20 - Market Analysis for Gas Engine Technology in Algeria Stéphane Michaut, 2013
FIGURE 4-4: SMALL GAS-FIRED POWER PLANTS - 5 YEAR PLAN
Additional capacity to be installed by 2017 is 140 MW of diesel fueled plants, and 501 MW of gas turbines compared to 2011’s fleet. Among these 501 MW, 198 MW are already in the construction phase, but the remaining 303 MW are still in the tendering phase. This represent a strong potential if gas engines are not only competitive compared to gas turbines, but also if Sonelgaz accepts to open up to a new technology that has so far never been used in Algeria.
4.1.4 Advantages and challenges with gas engine technology Figure 4-5 and Figure 4-6 give basic comparison data between the three technologies: gas engines, gas turbines and diesel engines. While gas engines considerably reduce investment costs, they also reduce the fuel gas consumption by 25% (better efficiency). Only maintenance costs are somehow higher, but this is also to be balanced by a higher life time before major overhaul.
A critical point and crucial advantage for gas engines development in Algeria is also their very low derating compared to gas turbines. While the power output of a turbine starts going down from its ISO rating after 15°C, gas engines will keep up to full load until 45°C. In regions characterized by their desert and hot conditions, and where peak load happens during hottest times of the year, this would considerably reduce oversizing of power plants since available power at all times would approach installed power.

Market Analysis for Gas Engine Technology in Algeria - 21 - Stéphane Michaut, 2013
FIGURE 4-6: DERATING AND PART LOAD EFFICIENCY OF GAS TURBINES AND GAS ENGINES
Though gas engines seem to suit particularly well to the southern regions, some challenges specific to Algeria prevented their development. During the 70’s and the 80’s the gas engine technology wasn’t mature enough to penetrate the Algerian market. Then in the 90’s while many developing countries started using them, Algeria went through a decade of terrorism during which dual fuel (ability to run both on gas and heavy duty oil in case gas delivery is compromised) became the main requirement, with which GEJ gas engines cannot comply.
Added to the plentiful and cheapness of gas, the reluctance to technological change and the bureaucracy that characterizes Algeria explain why so far gas engine has not been used in this country.
FIGURE 4-5: COMPARISON GAS TURBINE / GAS ENGINE

- 22 - Market Analysis for Gas Engine Technology in Algeria Stéphane Michaut, 2013
4.2 Sonelgaz’ comparison method When issuing a tender, Sonelgaz also issues a model in which each bid will be compared to the others. The comparison tool must be clear, fair and easily understandable by all bidders so that integrity of Sonelgaz cannot be questioned. Many factors such as currencies, efficiencies, payment schedule, etc… have to be implemented.
In this part will be explained how Sonelgaz compares bids and how to build the corresponding Excel tool. The values taken below are those of a gas turbine and a gas engine manufacturer bidding for a 2 x 25 MW project. The results of both bids are then showed in Part 4.3.
4.2.1 Technical bids Once the evaluation committee validates the technical bid, only few parameters need to be taken into account in the comparison method.
TABLE 4-1: TECHNICAL BIDS CARACTERISTICS
OFFER TYPE Gas turbine Gas Engine Guaranteed power output at site conditions kW 32 440 25 421 Number of units 2 2 Total guaranteed power output at site conditions kW 64 880 50 842 Specific heat rate LHV at site conditions kJ/kWh 11 773 8 333 Time until commissioning Months 27 16
4.2.1.1 Site conditions As previously explained temperature and altitude will strongly affect the power output of the plant. For an exact approach the evaluation method would need to implement both temperature and altitude responses of proposed equipment like it will be detailed in Part 6, in order to count precisely the amount of kWh produced. However for the sake of simplicity, the only value that will be used in this evaluation model is the guaranteed power output at site conditions.
4.2.1.2 Specific heat rate In this model, efficiency is taken into account by determining the specific heat rate of each equipment. A gas engine with 43,2% electrical efficiency will have a specific heat rate of 8333 kJ/kWh, while a gas turbine with 30,6% electrical efficiency will have a specific heat rate of 11 773 kJ/kWh.
4.2.2 Financial assumptions After successful technical evaluation, the unique criterion for awarding the deal is the lowest cost of kWh produced during the amortization period of the power plant. Some assumptions have hence to be clearly stated in order to calculate this cost.

Market Analysis for Gas Engine Technology in Algeria - 23 - Stéphane Michaut, 2013
TABLE 4-2: POWER GENERATION - FINANCIAL ASSUMPTIONS
Unit Values OFFER TYPE Gas turbine Gas Engine Amortization period Years 20 20 Discount rate foreign currency % 6% 6% Discount rate dinar % 6% 6% VAT rate % 17% 17% Average annual use of available capacity hours/year 6 000 6 000 Cost per thermie (based on natural gas price : 4,25 $/MMBTU) c$/thermie1 1,687 1,687 Operation cost and maintenance cost ( % of investment / year) % 2,0% 2,0% Rate of custom duties % 5% 5% Preferential margin on goods and services of Algerian origin , % 25% 25%
4.2.2.1 Natural gas price Efficiency of equipment proposed in the bids have to be taken into account by Sonelgaz in its evaluation. By identifying the cost of natural gas supply, Sonelgaz can effectively compare a low-efficient but cheap equipment to a high-efficient but costly equipment.
Market price in Algeria (i.e. price for Sonelgaz to buy gas from Sonatrach) is around 4,25$/MMBtu. This value is very low compared to world prices (see Figure below), with a price level almost as low as in the US where domestic prices dramatically fell with shale gas development.
Meanwhile, this value is almost 7 times higher than the price to which natural gas is being sold to industries: 0,18 DZD/Th = 0,25 c$/Th = 0,63 $/MMBtu, which explains why Sonelgaz has a recurrent deficit.
FIGURE 4-7: WORLD NATURAL GAS PRICES ($/MMBTU - ESTIMATED 2013
1 thermie is the unit in which natural gas is accounted in Algeria. 1 th = 1 Mcal.
- 24 - Market Analysis for Gas Engine Technology in Algeria Stéphane Michaut, 2013
4.2.2.2 VAT and custom duties rates In order to account for all expenses, Sonelgaz also includes VAT at a 17% rate and custom duties. For most equipment a 15% rate is the rule, but when it concerns energy facilities like power plants a specific rate at 5% was set.
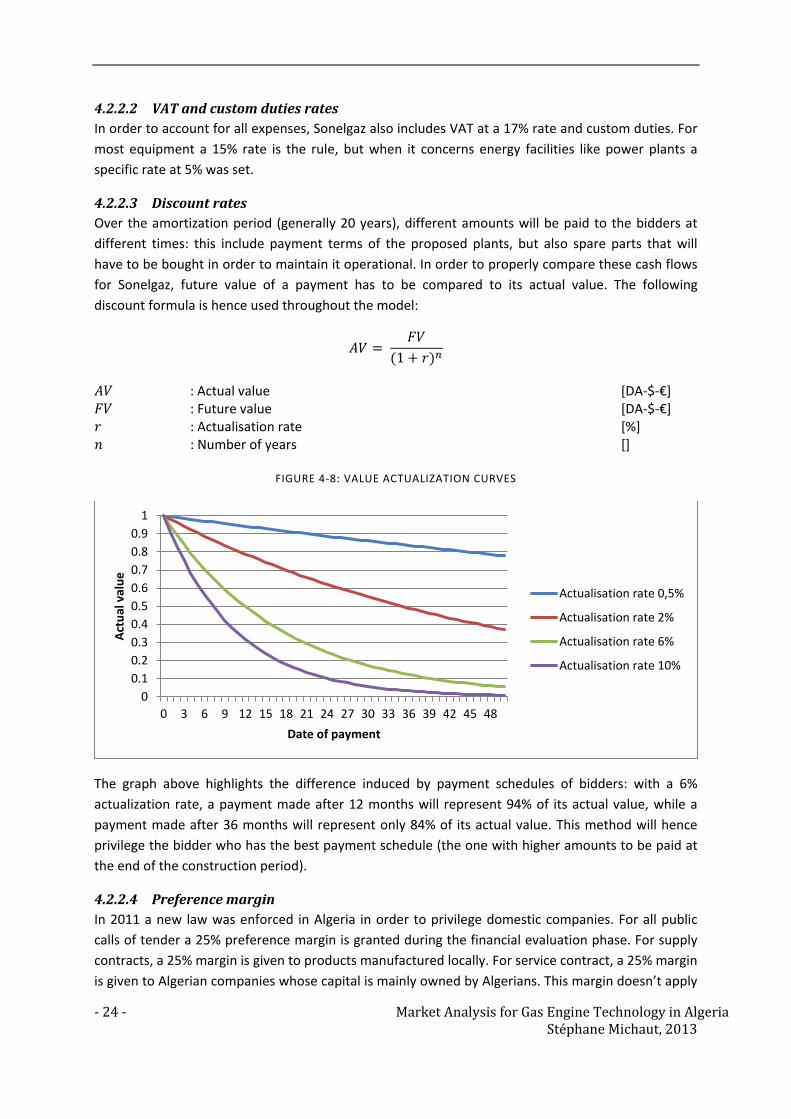
4.2.2.3 Discount rates Over the amortization period (generally 20 years), different amounts will be paid to the bidders at different times: this include payment terms of the proposed plants, but also spare parts that will have to be bought in order to maintain it operational. In order to properly compare these cash flows for Sonelgaz, future value of a payment has to be compared to its actual value. The following discount formula is hence used throughout the model:
𝐴𝑉 = 𝐹𝑉
(1 + 𝑟)𝑛
𝐴𝑉 : Actual value [DA-$-€] 𝐹𝑉 : Future value [DA-$-€] 𝑟 : Actualisation rate [%] 𝑛 : Number of years []
FIGURE 4-8: VALUE ACTUALIZATION CURVES
The graph above highlights the difference induced by payment schedules of bidders: with a 6% actualization rate, a payment made after 12 months will represent 94% of its actual value, while a payment made after 36 months will represent only 84% of its actual value. This method will hence privilege the bidder who has the best payment schedule (the one with higher amounts to be paid at the end of the construction period).
4.2.2.4 Preference margin In 2011 a new law was enforced in Algeria in order to privilege domestic companies. For all public calls of tender a 25% preference margin is granted during the financial evaluation phase. For supply contracts, a 25% margin is given to products manufactured locally. For service contract, a 25% margin is given to Algerian companies whose capital is mainly owned by Algerians. This margin doesn’t apply
00.10.20.30.40.50.60.70.80.9
1
0 3 6 9 12 15 18 21 24 27 30 33 36 39 42 45 48
Actu
al v
alue
Date of payment
Actualisation rate 0,5%
Actualisation rate 2%
Actualisation rate 6%
Actualisation rate 10%

Market Analysis for Gas Engine Technology in Algeria - 25 - Stéphane Michaut, 2013
to Algerian companies whose capital is mainly owned by foreigners, and for mixed groups (Algerian company jointly bidding with a foreign company) this 25% percentage is diminished accordingly to the percentage held by the Algerian side.
During the financial evaluation, this preference margin is implemented by increasing the prices of other financial bids from corresponding percentage, as showed in the table below.
TABLE 4-3: PREFERENCE MARGIN - EXAMPLE
Bidder 1 Bidder 2 Bidder 3 Bidder 4 Foreign share 100% 40% - - National share - 60% 100% 100% Preference margin 0% 15% 25% 25% Financial bid (1) 1000 1100 1300 1200 Preference margin (2) 0 165 325 300
Total (1) + (2) from other bidders : 1790 1725 1765 1690 In the example above, Bidder 1 did not increase other bidders’ price while Bidder 2 increased other bidders’ price of 15%, and Bidder 3 of 25%. Even though Bidder 4 doesn’t have the best financial offer, it wins the call of tender thanks to the preference margin.
In practice, this law did not let a chance to foreign companies to win tenders when there were local companies with same competencies. It had a small effect on diesel based power plants projects since there are many Algerian distributors. But it had no effect on gas fired power plants projects since all gas turbine manufacturer or EPC contractors were foreign companies.
4.2.3 Financial evaluation Once principal financial assumptions have been stated and sent to the bidders, three tables must be filled in when bidding: commercial bid for furniture, installation and commissioning of the plant, detailed payment schedule and commercial bid for long-term furniture of spare parts.
4.2.3.1 Commercial bid The table below contains two bids of EPC contractors for 2 x 25 MW, one with gas turbines and the other with gas engines.
TABLE 4-4: COMMERCIAL BIDS - EPC OF THE POWER PLANT
Commercial offers (excluding spare parts) OFFER TYPE Gas Turbine Gas Engine
Currency € US $ DZD € US $ DZD
Exchange rate / DZD 101,20 73,49 1,00 101,20 73,49 1,00
Gross Bid (Foreign Currencies) 74 086 826 21 384 671 - 70 379 892 - -
VAT (17%) 12 594 760 3 635 394 - 11 964 582 - -
Gross Bid + Preference Margin (Dinars) - - 2 512 465 313 - - 196 200 000
VAT (17%) - - 427 119 103 - - 33 354 000
Custom duties (5%) in Dinars 326 264 659 61 669 985 - 320 502 744 - -
The difference in terms of initial investment is to be balanced by the effective output of the plant: in the example above, gas turbine manufacturer offered 32 MW turbines which mostly explains the

- 26 - Market Analysis for Gas Engine Technology in Algeria Stéphane Michaut, 2013
price difference. Most of the time these supplementary MW are taken into account by Sonelgaz, so that a manufacturer who doesn’t have the product with the exact power output requested in the tender won’t be penalized over another.
Another factor influencing the price of the equipment is the derating at site conditions: as previously explained, if design temperature is 45°C (and this is the case for most of southern sites in Algeria) the turbine proposed in the tender will have at least a 30% derating compared to nominal output while gas engine output would be at 100% of its nominal value, with direct consequence being a turbine size – and cost – 30% oversized.
In that case the evaluation model will not take into account the additional capacity available at temperatures lower than 45°C (turbine case only), since this additional capacity is in practice never used: the peak demand happens to be during hottest days, when country-widespread air conditioners are switched on. Gas engine will hence have a further advantage, which is being dimensioned on the exact power demand during hot days.
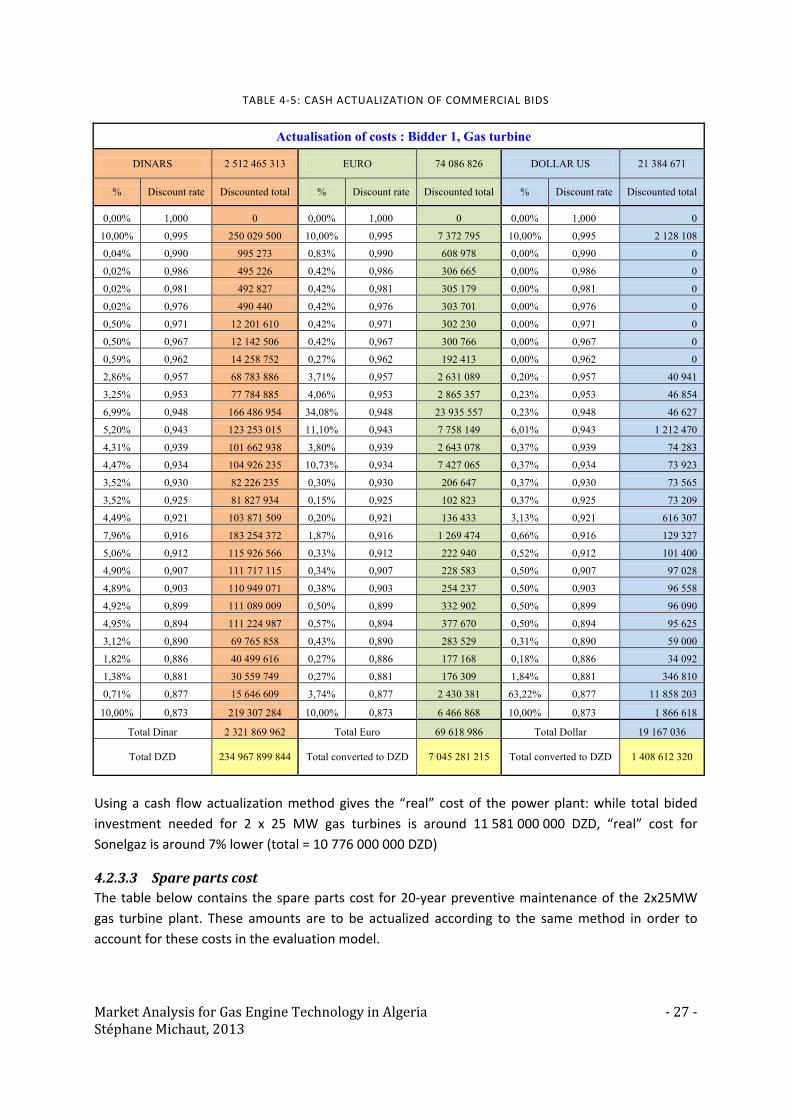
4.2.3.2 Cash actualization Commercial bids needs to be actualized / discounted according to the method explained in Part 4.2.2.3 and to the payment schedule of the bidder. Below is the payment schedule of gas turbine EPC bidder, and the corresponding cash actualization.
Market Analysis for Gas Engine Technology in Algeria - 27 - Stéphane Michaut, 2013
TABLE 4-5: CASH ACTUALIZATION OF COMMERCIAL BIDS
Actualisation of costs : Bidder 1, Gas turbine
DINARS 2 512 465 313 EURO 74 086 826 DOLLAR US 21 384 671
% Discount rate Discounted total % Discount rate Discounted total % Discount rate Discounted total
0,00% 1,000 0 0,00% 1,000 0 0,00% 1,000 0
10,00% 0,995 250 029 500 10,00% 0,995 7 372 795 10,00% 0,995 2 128 108
0,04% 0,990 995 273 0,83% 0,990 608 978 0,00% 0,990 0
0,02% 0,986 495 226 0,42% 0,986 306 665 0,00% 0,986 0
0,02% 0,981 492 827 0,42% 0,981 305 179 0,00% 0,981 0
0,02% 0,976 490 440 0,42% 0,976 303 701 0,00% 0,976 0
0,50% 0,971 12 201 610 0,42% 0,971 302 230 0,00% 0,971 0
0,50% 0,967 12 142 506 0,42% 0,967 300 766 0,00% 0,967 0
0,59% 0,962 14 258 752 0,27% 0,962 192 413 0,00% 0,962 0
2,86% 0,957 68 783 886 3,71% 0,957 2 631 089 0,20% 0,957 40 941
3,25% 0,953 77 784 885 4,06% 0,953 2 865 357 0,23% 0,953 46 854
6,99% 0,948 166 486 954 34,08% 0,948 23 935 557 0,23% 0,948 46 627
5,20% 0,943 123 253 015 11,10% 0,943 7 758 149 6,01% 0,943 1 212 470
4,31% 0,939 101 662 938 3,80% 0,939 2 643 078 0,37% 0,939 74 283
4,47% 0,934 104 926 235 10,73% 0,934 7 427 065 0,37% 0,934 73 923
3,52% 0,930 82 226 235 0,30% 0,930 206 647 0,37% 0,930 73 565
3,52% 0,925 81 827 934 0,15% 0,925 102 823 0,37% 0,925 73 209
4,49% 0,921 103 871 509 0,20% 0,921 136 433 3,13% 0,921 616 307
7,96% 0,916 183 254 372 1,87% 0,916 1 269 474 0,66% 0,916 129 327
5,06% 0,912 115 926 566 0,33% 0,912 222 940 0,52% 0,912 101 400
4,90% 0,907 111 717 115 0,34% 0,907 228 583 0,50% 0,907 97 028
4,89% 0,903 110 949 071 0,38% 0,903 254 237 0,50% 0,903 96 558
4,92% 0,899 111 089 009 0,50% 0,899 332 902 0,50% 0,899 96 090
4,95% 0,894 111 224 987 0,57% 0,894 377 670 0,50% 0,894 95 625
3,12% 0,890 69 765 858 0,43% 0,890 283 529 0,31% 0,890 59 000
1,82% 0,886 40 499 616 0,27% 0,886 177 168 0,18% 0,886 34 092
1,38% 0,881 30 559 749 0,27% 0,881 176 309 1,84% 0,881 346 810
0,71% 0,877 15 646 609 3,74% 0,877 2 430 381 63,22% 0,877 11 858 203
10,00% 0,873 219 307 284 10,00% 0,873 6 466 868 10,00% 0,873 1 866 618
Total Dinar 2 321 869 962 Total Euro 69 618 986 Total Dollar 19 167 036
Total DZD 234 967 899 844 Total converted to DZD 7 045 281 215 Total converted to DZD 1 408 612 320
Using a cash flow actualization method gives the “real” cost of the power plant: while total bided investment needed for 2 x 25 MW gas turbines is around 11 581 000 000 DZD, “real” cost for Sonelgaz is around 7% lower (total = 10 776 000 000 DZD)
4.2.3.3 Spare parts cost The table below contains the spare parts cost for 20-year preventive maintenance of the 2x25MW gas turbine plant. These amounts are to be actualized according to the same method in order to account for these costs in the evaluation model.

- 28 - Market Analysis for Gas Engine Technology in Algeria Stéphane Michaut, 2013
TABLE 4-6: SPARE PARTS COST ACTUALIZATION
Cost of spare parts : Bidder 1, Gas turbine
Year Spare parts costs
Total DZD VAT Custom Duties TOTAL DZD (with actualisation)
€ USD DZD
1 (Warranty) 0 0 0 0 0
2 (Warranty) 0 0 0 0 0
3 3 505 417 257 618 003 43 795 060 12 880 900 231 462 291
4 0 0 0 0 0
5 5 340 250 392 462 449 66 718 616 19 623 122 313 827 081
6 3 505 417 257 618 003 43 795 060 12 880 900 194 340 203
7 0 0 0 0 0
8 0 0 0 0 0
9 8 845 667 650 080 452 110 513 677 32 504 023 411 752 224
10 0 0 0 0 0
11 0 0 0 0 0
12 3 505 417 257 618 003 43 795 060 12 880 900 137 002 174
13 0 0 0 0 0
14 5 340 250 392 462 449 66 718 616 19 623 122 185 753 767
15 3 505 417 257 618 003 43 795 060 12 880 900 115 029 667
16 0 0 0 0 0
17 0 0 0 0 0
18 8 845 667 650 080 452 110 513 677 32 504 023 243 715 509
19 0 0 0 0 0
20 0 0 0 0 0
TOTAL SPARE PARTS (1 unit) 1 832 882 915
This table will allow the model to take into account differences in lifetime before major overhaul: while major overhaul for gas turbine generally takes places after 48 000 OPH (= 8 years of operation), the overhaul for gas engines will be necessary after 60 000 OPH.
In the cost calculation over 20 years of operation, gas turbines will thus need two major overhauls while gas engines will only need one.
4.2.3.4 Cost of kWh Final stage of the evaluation model is to sum actualized costs of investment, fuel gas, operation and maintenance and divide them by total energy generated over the amortization period in order to calculate the price of kWh produced by each bidder’s power plant. Bidder with conform technical bid and lowest of kWh will win the tender.

Market Analysis for Gas Engine Technology in Algeria - 29 - Stéphane Michaut, 2013
TABLE 4-7: SONELGAZ ATTRIBUTION CRITERION - PRICE OF KWH
Cost of kWh and kW installed
Unit Gas Turbine Gas Engine
Total actualised investment with VAT and custom duties DA 12 995 577 935 9 071 775 519 Total spare parts over 20 years DA 3 665 765 830 2 442 222 647 Cost of investment per kWh DA 3,318 2,927 Cost of gas per kWh DA 3,485 2,467 Cost of operation per kWh DA 0,761 0,672 Cost of spare parts per kWh DA 0,936 0,788
Cost of kW installed DA / kW 200 299 178 431
Average actualised cost of kWh DA / kWh 8,50 6,85
RANKING 2 1
In our example of a 2 x 25 MW power plant, the bid based on gas engine technology outweighs the bid based on gas turbine technology by approximately 20%. For this particular plant, Sonelgaz finally decided to cancel the call of tender because only two companies submitted bids.
4.3 Results of the analysis – small power generation plants In 2009 three contracts for small power generation plants were awarded in southern Algeria to a gas turbine manufacturer. In order to evaluate the potential of gas engine in these regions, same approach as in Part 4.2 was conducted and prices at which the tenders were attributed were compared to prices at which similar power plants with gas engine technology could have been built. The three tables below show the comparison results.
TABLE 4-8: COST COMPARISON - IN AMENAS - 6 X 5 MW
Cost of kWh and kW installed
Unit Gas Turbine Gas Engine
Cost of investment per kWh DA 5,962 1,235 Cost of gas per kWh DA 3,390 2,400 Cost of operation per kWh DA 0,878 0,240 Cost of spare parts per kWh DA 0,414 0,908
Cost of kW installed DA / kW 304 950 84 966
Average actualised cost of kWh DA / kWh 10,64 4,78
RANKING 2 1

- 30 - Market Analysis for Gas Engine Technology in Algeria Stéphane Michaut, 2013
TABLE 4-9: COST COMPARISON - ILLIZI - 3 X 5 MW
Cost of kWh and kW installed
Unit Gas Turbine Gas Engine
Cost of investment per kWh DA 7,829 1,235 Cost of gas per kWh DA 3,390 2,400 Cost of operation per kWh DA 1,152 0,240 Cost of spare parts per kWh DA 0,414 0,908
Cost of kW installed DA / kW 400 410 84 966
Average actualised cost of kWh DA / kWh 12,78 4,78
RANKING 2 1
TABLE 4-10: COST COMPARISON - EL GOLEA - 3 X 10 MW + 2 X 5 MW
Cost of kWh and kW installed
Unit Gas Turbine Gas Engine
Cost of investment per kWh DA 5,115 1,298 Cost of gas per kWh DA 3,390 2,400 Cost of operation per kWh DA 0,753 0,252 Cost of spare parts per kWh DA 0,308 0,842
Cost of kW installed DA / kW 261 601 89 333
Average actualised cost of kWh DA / kWh 9,57 4,79
RANKING 2 1
For these three power plants ranging from 5 to 10 MW units, the cost of kWh reached with a gas engine technology would approximately be 50% lower than what was awarded in 2009. For 25 MW, this difference gets down to 20%. In practice this is the upper limit above which gas turbine starts to be competitive.
Conclusion: for small generation units < 25 MW, gas engine can generate electricity with a higher efficiency, a smaller derating and a better flexibility than what has been developed so far in Algeria, for almost half the price of production. This tells how relevant gas engine technology is for southern regions of Algeria, and how promising its development is. However some concerns remain and explain why Sonelgaz executives are still reluctant to allow use of gas engines for these regions: dual fuel requirement, longstanding experience in gas turbine maintenance, bureaucracy and reluctance to technological change are some of the few obstacles that Sonelgaz will have to overcome for gas engine manufacturers to start doing business in this market.

Market Analysis for Gas Engine Technology in Algeria - 31 - Stéphane Michaut, 2013
5. CHP potential for the industry 5.1 Overview of the sector Industry accounts for 16% of Algeria’s final energy consumption, the APRUE says. Main industries are: O&G related industries transforming by products of oil production (fertilizers), drink and food processing industries like the giant company Cevital (oil refinery, sugar refinery, mills), raw construction material like brick, ceramic, tile and cement factories and finally some pharmaceutical groups. Other industry types are starting to rise up like steel, packaging or car manufacturing industries, but these are not spread out nor significant players throughout the country. Imports and low maintenance production lines are still privileged.
In terms of power consumption, the industrial sector represents around 25% of the demand, i.e around 3000 MW, increasing at a 8,3% rate. This power requirement is spread throughout the country as shown in the map below, and around one third of these 3000 MW are connected to an important heat demand for the need of the process.
FIGURE 5-1: ALGERIAN INDUSTRIES LOCALISATION
Out of these energy intensive industries, APRUE estimates that the potential for cogeneration applications in Algeria amounts to 450 MW. In order to study in more details what the key industries are for gas engine based CHP plants, an analytic tool has been developed.
5.2 Development of an Excel analytic tool based on annual consumption In order to identify the factors influencing the profitability of gas engine based CHP plants in Algeria and draw conclusions over the potential of the industrial sector, an Excel simulation file was made based on the variation of each of the following items.
5.2.1 SONELGAZ’ billing Due to governmental regulation to avoid any protest from the population, Sonelgaz electricity and gas rates have remained unchanged since 2005, leading to a deficit in Sonelgaz’ operating budget of

- 32 - Market Analysis for Gas Engine Technology in Algeria Stéphane Michaut, 2013
55 billiards DA (~550 M€) in 2011. The prices of energy have hence been steadily subsidized by the state, like most of primary resources (gasoline, sugar, oil, wheat, etc).
5.2.1.1 Electricity rates Electricity penetration rate in Algeria was around 98% in 2011. As in most countries, SONELGAZ applies different rates to low, medium and high-voltage customers. The medium and high voltage rates are showed in the table below, and for most of the industries whose power needs are between 500 kW and 15 MW the rate E41 applies:
TABLE 5-1: ELECTRICITY RATES FOR MEDIUM AND HIGH VOLTAGE CUSTOMERS IN ALGERIA
SONELGAZ ELECTRICITY RATES (2005)
Active Power Reactive Power Power At
Disposal Max Power
Reached Monthly
Fee NIGHT DAY PEAK Malus Bonus
𝐶1 𝐶2 𝐶3 𝐺 𝐺 𝑃1 𝑃2 𝐹
(cDA / kWh) (cDA / kVARh) (DA/kW/month) (DA/kW/month) (DA/month)
E31 49,19 113,9 550,7 25,84 5,168 31,61 157,88 421 177,73 E32 114,1 114,1 114,1 25,84 5,168 84,12 421,15 421 177,73 E41 85,33 161,5 726,7 37,94 7,588 21,54 96,79 32 227,79 E42 150,5 150,5 726,7 37,94 7,588 32,25 150,48 429,71 E43 85,33 356,9 356,9 37,94 7,588 32,25 128,8 429,71 E44 313 313 313 37,94 7,588 32,25 150,48 429,71 E51 106,4 191,1 716,3 29,85 0 286,44 E52 157,2 157,2 716,3 29,85 0 66,40 E53 106,4 429,9 429,9 14,81 0 66,40 E54 417,9 417,9 417,9 4,37 0 0,00
Sonelgaz’ method for monthly power billing within the industry follows the formulas below:
𝑃𝑃𝑒𝑥𝑐𝑙.𝑉𝐴𝑇 = �𝐶𝑒𝑙,𝑐𝑜𝑛𝑠𝑖 .𝐸𝑒𝑙,𝑐𝑜𝑛𝑠𝑖3
𝑖=1
+ 𝐺. �𝐸𝑟,𝑐𝑜𝑛𝑠 − 0,5.𝐸𝑒𝑙,𝑐𝑜𝑛𝑠� + 𝑃𝐴𝐷.𝑃1 + 𝑀𝑃𝑅.𝑃2 + 𝐹
𝑃𝑃𝑖𝑛𝑐𝑙.𝑉𝐴𝑇 = 1,07 ∗ 𝑃𝑃𝑒𝑥𝑐𝑙.𝑉𝐴𝑇 + 0,02.𝐸𝑒𝑙,𝑐𝑜𝑛𝑠
𝑃𝑃𝑒𝑥𝑐𝑙.𝑉𝐴𝑇 : Power Price excluding VAT [DA] 𝑃𝑃𝑖𝑛𝑐𝑙.𝑉𝐴𝑇 : Power Price including VAT [DA] 𝐶𝑒𝑙,𝑐𝑜𝑛𝑠𝑖 : Unitary cost of active power for each pricing period (Night, Day, Peak) [DA/kWh] 𝐸𝑒𝑙,𝑐𝑜𝑛𝑠𝑖 : Active power consumed during each pricing period (Night, Day, Peak) [kWh] 𝐺 : Unitary cost of reactive power, bonus if tan𝜑 < 0,5. [DA/kVAh] 𝐸𝑟,𝑐𝑜𝑛𝑠 : Total reactive power consumed during the month, 𝐸𝑟 = tan𝜑 .𝐸𝑒𝑙 [kVAh] 𝐸𝑒𝑙,𝑐𝑜𝑛𝑠 : Total active power consumed during the month, 𝐸𝑒𝑙 = ∑ 𝐸𝑒𝑙𝑖3
𝑖=1 [kWh] 𝑃𝐴𝐷 : Subscribed power at disposal [kW] 𝑃1 : Unitary price of power at disposal [DA/kW] 𝑀𝑃𝑅 : Maximum power reached during the month [kW] 𝑃2 : Unitary price of maximum power reached [DA/kW] 𝐹 : Monthly fixed fee [DA]

Market Analysis for Gas Engine Technology in Algeria - 33 - Stéphane Michaut, 2013
Night, Peak and Day periods are defined as follow:
- Night : each day of the year between 10.30 PM and 06.00 AM - Day : each day of the year between 06.00 AM and 05.30 PM, and between 09.00 PM and
10.30 PM - Peak : each day of the year between 05:00 PM and 09:00 PM
The average cost of electricity for an industry with constant power needs over the day is hence 2,32 DA ~ 2,32 cts€ / kWh , to which must be added PAD, MPR, reactive power and taxes. The figure below shows the Excel sheet developed to calculate the electricity bill, for each of the electricity rates mentioned above.
TABLE 5-2: CALCULATION OF ELECTRICITY BILL
5.2.1.2 Gas rates The gas penetration rate approaches 57% in 2011 and most of the industries can have access to this (very) cheap kind of energy. Rates for medium and high pressure customers are shown in the table below, and for most of the industries with boilers, air dryers, ovens, etc... whose consumption is way over the limit of 25 Nm3/hour the rate 21 or 21T applies:
TABLE 5-3: MEDIUM PRESSURE GAS RATES IN ALGERIA
SONELGAZ GAS RATES
Thermal Energy Flow At Disposal Monthly Fee
𝑇1 𝐹1 𝐹
(cDA / Thermie) (DA / month /Thermie/h) (DA/month)
21 17,87 10,8 6 854,55 21T 18,49 11,16 7 092,45 22 37,07 2,63 685,42 23 32,45 0,324 28,50
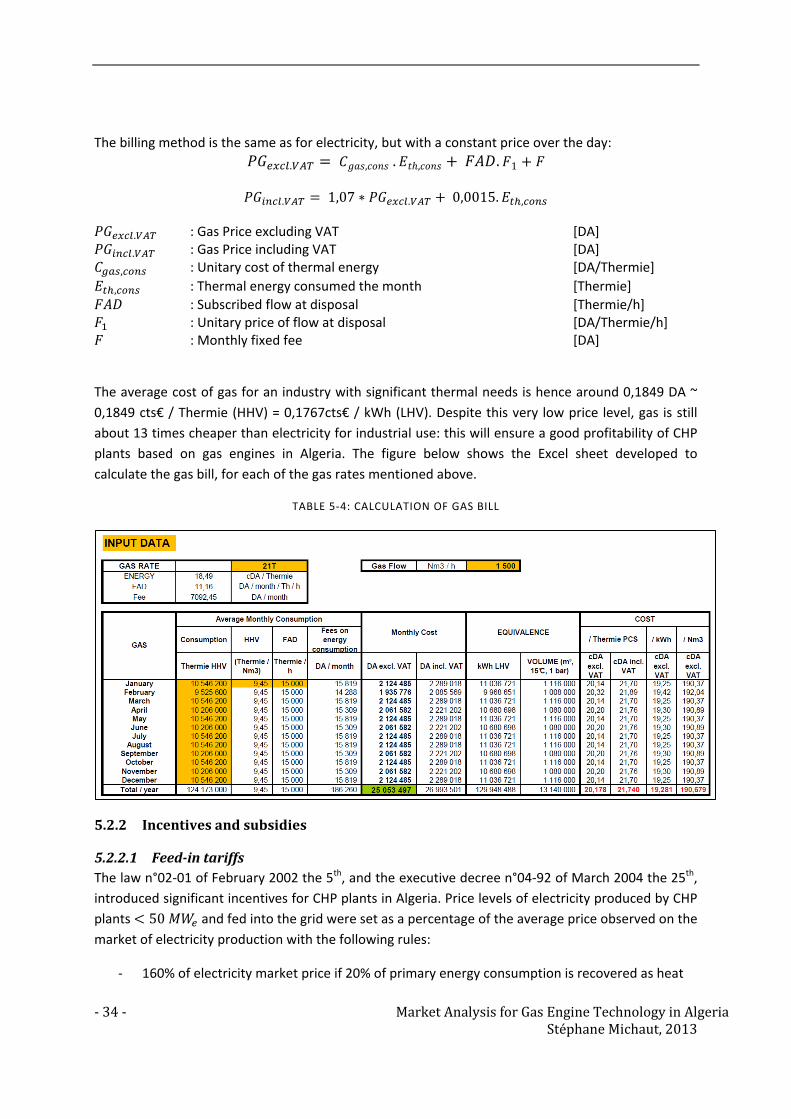
- 34 - Market Analysis for Gas Engine Technology in Algeria Stéphane Michaut, 2013
The billing method is the same as for electricity, but with a constant price over the day: 𝑃𝐺𝑒𝑥𝑐𝑙.𝑉𝐴𝑇 = 𝐶𝑔𝑎𝑠,𝑐𝑜𝑛𝑠 .𝐸𝑡ℎ,𝑐𝑜𝑛𝑠 + 𝐹𝐴𝐷. 𝐹1 + 𝐹
𝑃𝐺𝑖𝑛𝑐𝑙.𝑉𝐴𝑇 = 1,07 ∗ 𝑃𝐺𝑒𝑥𝑐𝑙.𝑉𝐴𝑇 + 0,0015.𝐸𝑡ℎ,𝑐𝑜𝑛𝑠
𝑃𝐺𝑒𝑥𝑐𝑙.𝑉𝐴𝑇 : Gas Price excluding VAT [DA] 𝑃𝐺𝑖𝑛𝑐𝑙.𝑉𝐴𝑇 : Gas Price including VAT [DA] 𝐶𝑔𝑎𝑠,𝑐𝑜𝑛𝑠 : Unitary cost of thermal energy [DA/Thermie] 𝐸𝑡ℎ,𝑐𝑜𝑛𝑠 : Thermal energy consumed the month [Thermie] 𝐹𝐴𝐷 : Subscribed flow at disposal [Thermie/h] 𝐹1 : Unitary price of flow at disposal [DA/Thermie/h] 𝐹 : Monthly fixed fee [DA]
The average cost of gas for an industry with significant thermal needs is hence around 0,1849 DA ~ 0,1849 cts€ / Thermie (HHV) = 0,1767cts€ / kWh (LHV). Despite this very low price level, gas is still about 13 times cheaper than electricity for industrial use: this will ensure a good profitability of CHP plants based on gas engines in Algeria. The figure below shows the Excel sheet developed to calculate the gas bill, for each of the gas rates mentioned above.
TABLE 5-4: CALCULATION OF GAS BILL
5.2.2 Incentives and subsidies
5.2.2.1 Feed-in tariffs The law n°02-01 of February 2002 the 5th, and the executive decree n°04-92 of March 2004 the 25th, introduced significant incentives for CHP plants in Algeria. Price levels of electricity produced by CHP plants < 50 𝑀𝑊𝑒 and fed into the grid were set as a percentage of the average price observed on the market of electricity production with the following rules:
- 160% of electricity market price if 20% of primary energy consumption is recovered as heat
Market Analysis for Gas Engine Technology in Algeria - 35 - Stéphane Michaut, 2013
- 120% of electricity market price if 15% to 20% of primary energy consumption is recovered as heat
- 80% of electricity market price if 10% to 15% % of primary energy consumption is recovered as heat
- 0% if less than 10% of primary energy consumption is recovered as heat (self consumption only)
For electricity produced with biogas sources such as sewage and landfill gas, price levels for feeding the grid was set at 200% of electricity market price.
In reality, this decree has never been applied and the market of decentralized CHP plants for electricity production never took up. Another decree is currently under consideration by the regulating committee, but as long as no new incentive schemes have officially been published, CHP plants can only be used for self consumption.
5.2.2.2 Subsidies Even though no feed-in tariff has been applied yet for renewables and CHP plants, a large fund for promoting the rational use of energy was voted by the Law of Finance 2000 and adopted by the Decree n°2000-116 of May 2000 the 29th.
The revenues of this fund come from the above mentioned taxes on energy consumption and are set at the following levels:
- 0,0015 Da/ thermie for natural gas - 0,02 DA / kWh for electricity
Although expected to come, no tax has been established yet for other energy sources such as oil, LPG, etc... Those amounts are directly collected by Sonelgaz and Sonatrach, and are redistributed by the national agency APRUE, responsible for sharing this fund into four main programmes of energy use rationalization within:
- the industrial sector - the residential sector - the lighting sector - the transport sector
For the industry, as soon as thermal energy is recovered the CHP plant becomes eligible for and the APRUE agency offers to give the following subsidies:
- 30% of feasibility studies costs capped to 4 million DA ~ 12 000 € - 70% of installation costs capped to 10 million DA ~ 70 000 €
The query has to be done by the client and is submitted to final approval by a committee of experts.
5.2.3 Engine choice Whereas in Europe heating networks are often supplied by CHP plants, which results in dimensioning the engine on thermal needs and feeding the national grid with the produced electrical power, there is no grid feeding possibility in Algeria (or better said, no grid selling possibility). Hence, the engine is

- 36 - Market Analysis for Gas Engine Technology in Algeria Stéphane Michaut, 2013
always dimensioned by the electrical load on site. The GE Jenbacher engines used by Clarke Energy range from 250kW to 4,4 MW, as shown in the graph below :
FIGURE 5-2: GE JENBACHER POWER RANGE
They are split into four “types” depending on the size and the number of cylinders:
- type 2 for 2L cylinder, available with 08 cylinders, power range 250 – 330 kW - type 3 for 3L cylinder , available with 12, 16 and 20 cylinders, power range 500 – 1100 kW - type 4 for 4L cylinder, available with 12, 16, and 20 cylinders, power range 800 – 1500 kW - type 6 for 6L cylinder, available with 12, 16, 20 and 24 cylinders, power range 1,5 – 4,4 MW
A 9L 24 cylinder engine is also under development (the J920 engine), for a power output of almost 10 MW and an electrical efficiency of 48,7%, but would not be available before 2014 in North Africa.
Other factors that could influence, as a second criterion, the choice of the engine are:
- electrical efficiency (ranges from 39% to 45%) - thermal efficiency (ranges from 42% to 47%) - voltage output at the alternator outlet (400V, 5,5kV, 10kV) - auxiliaries consumption (ranges from 20 to 144 kW) - specific installation, maintenance and overhaul cost
In order to compare the impact of the variation of each factor, a database of prices and technical characteristics has been implemented, and three similar Excel sheets (Option 1, Option 2 and Option 3) were created with the following table. By changing the factors in each option, it will be possible to analyse the results.

Market Analysis for Gas Engine Technology in Algeria - 37 - Stéphane Michaut, 2013
TABLE 5-5: RESUME OF CHP CHARACTERISTICS
CHP PLANT 3
Engine type 1 JMS 612 GS-N/LC F111
Number of engines 1
Maintenance cost € HT / h xxxxx
Major overhaul € HT xxxxx Engine type 2 None Number of engines - Maintenance cost € HT / h - Major overhaul € HT - Annual Availability Guaranteed % 95% Cost of installed kW € HT / kW xxx Subsidies € xxx CO2 Certificates
Interest rate of the loan 3,00%
Total duration of the loan 7 years
Thermal Energy Use Hot Air
Grid feeding NO
Gas consumption kWh PCI 4 674 Power Output (gross, cos phi =1) kW 2 000
Power Output (net) kW 1 897
Thermal Energy Output kW 2 094 Electrical Efficiency % 42,79% Thermal Efficiency % 44,80%
Annual Operating Hours 8 322
5.2.4 Electrical and thermal annual gains Based on both electricity and gas bills of a customer, and after choosing the right engine given site conditions, the annual energy balance can easily be made. From the energy balance, annual savings can be calculated by applying the relevant energy rates.
5.2.4.1 Energy balance, single engine power plant Assuming the electrical load to be constant over the day (which is the case for most of the industries with 24H/24 production), the monthly electrical production of the CHP can be calculated with the following formula, taking into consideration the availability guaranteed :
𝐼𝐹 𝑃𝑒𝑙 𝑛𝑒𝑡,𝑝𝑟𝑜𝑑 .𝐻𝑛.𝐴 < 𝐸𝑒𝑙,𝑐𝑜𝑛𝑠𝑛 𝐸𝑒𝑙,𝑝𝑟𝑜𝑑𝑛 = 𝑃𝑒𝑙 𝑛𝑒𝑡,𝑝𝑟𝑜𝑑 .𝐻𝑛.𝐴 𝐼𝐹 𝑃𝑒𝑙 𝑛𝑒𝑡,𝑝𝑟𝑜𝑑 .𝐻𝑛.𝐴 > 𝐸𝑒𝑙,𝑐𝑜𝑛𝑠𝑛 𝐸𝑒𝑙,𝑝𝑟𝑜𝑑𝑛 = 𝐸𝑒𝑙,𝑐𝑜𝑛𝑠𝑛 .𝐴
𝑃𝑒𝑙 𝑛𝑒𝑡,𝑝𝑟𝑜𝑑 : Net electrical output of the CHP [kW] 𝐻𝑛 : Number of hours in the considered month n [hours] 𝐴 : Availability guaranteed as % of total running hours [%] 𝐸𝑒𝑙,𝑐𝑜𝑛𝑠𝑛 : Monthly electrical consumption of the factory [kWh] 𝐸𝑒𝑙 𝑝𝑟𝑜𝑑𝑛 : Monthly electrical production of the CHP [kWh]

- 38 - Market Analysis for Gas Engine Technology in Algeria Stéphane Michaut, 2013
The thermal production, determined by the electrical load, is then calculated by using both electrical and thermal efficiency of the CHP, and the efficiency of existing boilers (or air dryers if applicable):
𝐼𝐹 𝐸𝑒𝑙 𝑝𝑟𝑜𝑑𝑛 . 𝜂𝑡ℎ𝜂𝑒𝑙
< 𝐸𝑡ℎ,𝑐𝑜𝑛𝑠𝑛 𝐸𝑡ℎ,𝑟𝑒𝑐
𝑛 = 𝐸𝑒𝑙,𝑝𝑟𝑜𝑑𝑛 . 𝜂𝑡ℎ𝜂𝑒𝑙
𝐼𝐹 𝐸𝑒𝑙 𝑝𝑟𝑜𝑑𝑛 . 𝜂𝑡ℎ𝜂𝑒𝑙
> 𝐸𝑡ℎ,𝑐𝑜𝑛𝑠𝑛 𝐸𝑡ℎ,𝑟𝑒𝑐
𝑛 = 𝐸𝑡ℎ ,𝑐𝑜𝑛𝑠,𝑢𝑠𝑛
with
𝜂𝑒𝑙 : Electrical efficiency of the CHP [%] 𝜂𝑡ℎ : Thermal efficiency of the CHP [%] 𝜂𝑏 : Existing boiler efficiency [%] 𝐸𝑡ℎ,𝑟𝑒𝑐𝑛 : Thermal energy recovered during month n [kWh]
𝐸𝑡ℎ,𝑐𝑜𝑛𝑠𝑛 : Thermal energy consumption during month n [kWh]
𝐸𝑡ℎ,𝑐𝑜𝑛𝑠,𝑢𝑠.𝑛 : Usable thermal energy needs of the factory, 𝐸𝑡ℎ,𝑐𝑜𝑛𝑠,𝑢𝑠
𝑛 = 𝐸𝑡ℎ,𝑐𝑜𝑛𝑠𝑛 . 𝜂𝑏 [kWh]
Example: 2 MW constant consumption, single engine JMS 612 power plant
The following table contains the results of this calculation for a factory with a 2 MW constant power need, on which a 2 MW single engine (JMS 612) power plant is installed, with the characteristics given above. The amount of kWh produced by the CHP corresponds to 90,1% of the annual needs.
TABLE 5-6: ELECTRICAL PRODUCTION OF THE CHP - ANNUAL CONSUMPTION MODEL
CHP 3 Needs without CHP Needs with CHP
Month Days Off days Hours
Effective running hours
Actual electrical
consumption
Electrical energy,
potential production
(T<40°C, 100%
availability)
Real electrical energy
produced (T<40°C,
95% availability)
Missing electrical energy (bought
from Sonelgaz)
Excess of electrical energy (sold to
Sonelgaz)
kWhe kWh e kWh e kWh e kWh e Jan 31 0 744 706,8 1 488 000 1 411 342 1 340 775 147 225 0 Feb 28 0 672 638,4 1 344 000 1 274 761 1 211 023 132 977 0
March 31 0 744 706,8 1 488 000 1 411 342 1 340 775 147 225 0 Apr 30 0 720 684 1 440 000 1 365 815 1 297 524 142 476 0 May 31 0 744 706,8 1 488 000 1 411 342 1 340 775 147 225 0 Jun 30 0 720 684 1 440 000 1 365 815 1 297 524 142 476 0 Jul 31 0 744 706,8 1 488 000 1 411 342 1 340 775 147 225 0 Aug 31 0 744 706,8 1 488 000 1 411 342 1 340 775 147 225 0 Sept 30 0 720 684 1 440 000 1 365 815 1 297 524 142 476 0 Oct 31 0 744 706,8 1 488 000 1 411 342 1 340 775 147 225 0 Nov 30 0 720 684 1 440 000 1 365 815 1 297 524 142 476 0 Dec 31 0 744 706,8 1 488 000 1 411 342 1 340 775 147 225 0
Total 365 0 8760 8322 17 520 000 16 617 417 15 786 546 1 733 454 0
90,1% 9,9% Based on the a thermal consumption of 1500 Nm3/h and on an existing boiler efficiency of 90% for the factory, about 14,1% of the factory thermal needs will be produced by the CHP set given engine efficiencies as above.

Market Analysis for Gas Engine Technology in Algeria - 39 - Stéphane Michaut, 2013
TABLE 5-7: THERMAL PRODUCTION OF THE CHP - ANNUAL CONSUMPTION MODEL
Thermal needs Thermal energy recovered Gas consumption
Actual thermal needs
Thermal energy,
potential production
(T<40°C, 100%
availability)
Real thermal energy
recovered (T<40°C,
95% availability
Thermal energy
lost
Thermal energy
produced by boilers
Actual gas consumption
Gas input equivalent to thermal
energy recovered
(with boilers eff.)
CHP gas consumption
Total gas consumption
kWh th kWh th kWh th kWh th kWh th kWh th PCI kWh th PCI kWh th PCI kWh th PCI 9 933 049 1 557 936 1 403 792 0 8 529 257 11 036 721 1 559 768 3 133 392 12 610 344 8 971 786 1 407 168 1 267 941 0 7 703 845 9 968 651 1 408 823 2 830 160 11 389 988 9 933 049 1 557 936 1 403 792 0 8 529 257 11 036 721 1 559 768 3 133 392 12 610 344 9 612 628 1 507 680 1 358 508 0 8 254 120 10 680 698 1 509 453 3 032 314 12 203 559 9 933 049 1 557 936 1 403 792 0 8 529 257 11 036 721 1 559 768 3 133 392 12 610 344 9 612 628 1 507 680 1 358 508 0 8 254 120 10 680 698 1 509 453 3 032 314 12 203 559 9 933 049 1 557 936 1 403 792 0 8 529 257 11 036 721 1 559 768 3 133 392 12 610 344 9 933 049 1 557 936 1 403 792 0 8 529 257 11 036 721 1 559 768 3 133 392 12 610 344 9 612 628 1 507 680 1 358 508 0 8 254 120 10 680 698 1 509 453 3 032 314 12 203 559 9 933 049 1 557 936 1 403 792 0 8 529 257 11 036 721 1 559 768 3 133 392 12 610 344 9 612 628 1 507 680 1 358 508 0 8 254 120 10 680 698 1 509 453 3 032 314 12 203 559 9 933 049 1 557 936 1 403 792 0 8 529 257 11 036 721 1 559 768 3 133 392 12 610 344 116 953
640 18 343 440 16 528 514 0 100 425 126 129 948 488 18 365 015 36 893 158 148 476 631
14,1% 85,9%
5.2.4.2 Energy balance, multiple engine power plant The previous method is valid as soon as a single engine power plant is under consideration and with a constant load over the day: with a guaranteed availability of 95%, the plant produces either 95% of electrical needs, or 95% of its maximum production potential (case when the load is higher than the power output of the CHP).
For a multiple engine power plant, the achieved amount of kWh produced has to be calculated differently since other engines keep running when one is under maintenance. Hence, a basic method consists in calculating the “unserved energy” with a probabilistic approach, and integrating the difference between power production curve and site load curve.
𝐸𝑁𝑆𝑛 = � [𝑃𝑒𝑙,𝑝𝑟𝑜𝑑(𝑡) − 𝐿𝑒𝑙,𝑐𝑜𝑛𝑠(𝑡)].𝑑𝑡𝑡
𝐸𝑁𝑆𝑛 : Energy Not Served for the month n [kWh] 𝑃𝑒𝑙,𝑝𝑟𝑜𝑑(𝑡) : Power production curve of the CHP [kW] 𝐿𝑒𝑙,𝑐𝑜𝑛𝑠(𝑡) : Load curve of the site [kW]
Example: 4,5 MW constant electrical consumption, 4-engine power plant
The following table contains each engine’s net output and availability.

- 40 - Market Analysis for Gas Engine Technology in Algeria Stéphane Michaut, 2013
TABLE 5-8: CALCULATION OF UNSERVED ENERGY - 4 ENGINE POWER PLANT
TOTAL INSTALLED POWER
Engine Number Type Installed Power
(gross) Installed
Power (Net) Availability
1 JMS 612 GS-N/LC F111 2000 1897 95,0%
2 JMS 612 GS-N/LC F111 2000 1897 95,0%
3 JMS 320 GS-N/LC C05 1063 1007 95,0%
4 JMS 320 GS-N/LC C05 1063 1007 95,0%
0 None 0 0 0,0%
0 None 0 0 0,0%
TOTAL 6126 5809
In this example, the guaranteed availability of each engine is 95%, and maintenance of each of them will be scheduled to take place separately. Hence the following graph and tables can be used:
FIGURE 5-3: CALCULATION OF UNSERVED ENERGY - PRODUCTION AND LOAD CURVES
The production curve never exceeds the load curve since there is no grid feeding.
0
1000
2000
3000
4000
5000
6000
7000
5 10 15 20 25 30 35 40 45 50 55 60 65 70 75 80 85 90 95 100
[kW
]
[% of time]
Load covered by the CHP (january) Load Net Available Power Real production curve

Market Analysis for Gas Engine Technology in Algeria - 41 - Stéphane Michaut, 2013
TABLE 5-9 : CALCULATION OF UNSERVED ENERGY
ENS CALCULATION % of time 5 … 80 85 90 95 100 Load (January) kW 4500 … 4500 4500 4500 4500 4500 Net Avail. Power kW 5809 … 5809 4801 4801 3912 3912
Real El. Prod. kWh/h 4500 … 4500 4500 4500 3912 3912
Missing Energy kWh/h 0 … 0 0 0 29 29
Average electrical energy needed
Average missing energy CHP prod. Grid cons.
kWh / h kWh / h % of needs % of needs
4500 59 98,7% 1,3%
While a 2-MW engine is under maintenance, (4500 kW - 3912 kW)* 5 % = 29 kWh/h have to be imported from the grid. If the factory runs 8760 hours/year and the engine has a guaranteed availability of 95%, the average ENS at the end of the year will be 29 kWh/h * 8760 h/year = 254 040 kWh/year.
The result of the calculation gives a percentage of 98,7% of factory needs covered by the CHP, while the previous method would have given a percentage of 95%. The calculation method has hence a great influence on final energy balance, as well as on final savings analysis.
5.2.4.3 Annual savings on energy bill
5.2.4.3.1 Electricity value In this model, the load of the plant was considered as constant over the day (which has been observed, for the targeted industries, as very close to reality). Hence, the cost of each kWh that has to be bought from the grid is easily calculated by applying the following formula:
𝐶𝑒𝑙,𝑎𝑣𝑔 =∑ 𝐶𝑒𝑙,𝑐𝑜𝑛𝑠
𝑖 .𝐻𝑖3𝑖=1∑ 𝐻𝑖3𝑖=1
𝐶𝑒𝑙,𝑎𝑣𝑔 : Average cost of active power bought from the grid [DA/kWh] 𝐶𝑒𝑙,𝑐𝑜𝑛𝑠𝑖 : Unitary cost of active power for each pricing period (Night, Day, Peak) [DA/kWh] 𝐻𝑖 : Number of hours when each rate applies [h]
The value of electricity produced (annual gain) is simply calculated by multiplying the amount of kWh produced by 𝐶𝑒𝑙,𝑎𝑣𝑔: 𝑉𝑒𝑙 = 𝐸𝑒𝑙,𝑝𝑟𝑜𝑑.𝐶𝑒𝑙,𝑎𝑣𝑔
Application : for most industries in Algeria, the rate E41 applies, and 𝐶𝑒𝑙,𝑎𝑣𝑔= 2,318 DA/kWh. In the 4,5 MW plant example above where 98,7 % of the needs were covered by the CHP, 𝐸𝑒𝑙,𝑝𝑟𝑜𝑑 =38 904 527 𝑘𝑊ℎ . The annual electricity gain is 𝑉𝑒𝑙 = 2,32 x 38 904 527 = 90 211 000 DA ~ 902 000 €/year. With the previous calculation

- 42 - Market Analysis for Gas Engine Technology in Algeria Stéphane Michaut, 2013
method, only 95% of the electrical needs were covered for an annual gain of 868 817 000 €. This is more than 30 000 € / year difference!
5.2.4.3.2 Thermal value The calculation of the value for thermal energy produced follows the same rule and must include the efficiency of existing boilers.
Application : for most industries in Algeria, the rate 21T applies and 𝐶𝑡ℎ,𝑎𝑣𝑔 = 𝐶𝑔𝑎𝑠,𝑐𝑜𝑛𝑠 = 18,49 cDA/thermie = 17,67 cDA/kWh (LHV). In the same example as above, with a factory consumption of 1500 Nm3/h and a boiler efficiency of 90%, the CHP plant can produce 𝐸𝑡ℎ,𝑝𝑟𝑜𝑑 = 41 940 173 kWh, which represents 17,9% of final thermal needs. The value of thermal energy is
hence 𝑉𝑡ℎ = 𝐸𝑡ℎ,𝑝𝑟𝑜𝑑 .𝐶𝑡ℎ,𝑎𝑣𝑔
𝜂𝑏 � = 8 234 254 𝐷𝐴 ~ 82 000 €/𝑦𝑒𝑎𝑟
5.2.4.3.3 Fuel gas cost The calculation of fuel gas costs follows almost the same formula as the thermal energy produced.
Application : with rate 21T, fuel consumption in example above was 𝐸𝑡ℎ,𝑐𝑜𝑛𝑠. = 92 453 821 𝑘𝑊ℎ. 𝑉𝑔𝑎𝑠,𝑐𝑜𝑛𝑠. = 𝐸𝑡ℎ,𝑐𝑜𝑛𝑠..𝐶𝑡ℎ,𝑎𝑣𝑔 = 16 336 600 𝐷𝐴 ~ 163 000 €/𝑦𝑒𝑎𝑟
For each of the three economical calculations above, a more precise analysis can be conducted by adding or retrofitting the modifications of MPR, PAD and FAD due to the introduction of the CHP plant. This has been taken into consideration in the model, though minor influence on the results.
5.2.4.3.4 Total cost Given the previous calculation, the following table was created for each option, resuming the annual energy costs for an industry.
TABLE 5-10: COMPARISON OF ANNUAL ENERGY COSTS - 4,5 MW INDUSTRY
Energy balance without CHP plant
Annual electrical consumption kWh 39 420 000 Average cost DA HT/kWh 2,6751 Annual cost Electricity DA HT/year 105 450 672 Annual gas consumption Th PCS/year 124 173 000
Existing boiler efficiency % 90%
Thermal needs of the factory kWh th PCI/year 116 953 640 Average cost DA HT/Th PCS 0,1849 Annual cost Gas DA HT/year 25 053 497 TOTAL COST ELEC + GAS DA HT/year 130 504 169

Market Analysis for Gas Engine Technology in Algeria - 43 - Stéphane Michaut, 2013
Energy balance with CHP plant
Annual Elec. Production (with 100% availability) kWh/year 50 882 688 Annual Elec. Production (real) kWh/year 38 904 527 Electrical Energy missing kWh/year 515 473 Electrical Energy that could be sold into the grid kWh/year 9 434 026 Percentage of electricity excess sold into the grid % 19 % Feed in tariff DA HT/kWh 0,00 Value of sold electricity DA HT/kWh -
Average Electricity rate for missing power DA HT/kWh 2,3188
Annual cost Electricity DA HT/kWh 6 041 533
Gas consumption Nm3/h 14 558
Thermal Output (100% availability) kWh PCI/ year 57 851 040 Thermal Output (real) kWh PCI/ year 41 940 173 Annual gas consumption of CHP Plant kWh PCI/ year 92 453 821 Total gas consumption of the factory kWh PCI/ year 175 802 117 Gas price DA HT / Th PCS 0,1849 Annual cost Gas for CHP Plant DA HT/ year 16 447 495 Annual gain on thermal consumption of the factory DA HT/ year 8 290 154 Annual cost Gas DA HT/ year 33 958 538 TOTAL COST ELEC + GAS DA HT/ year 40 000 071
In this example (industry with 4,5 MW constant electrical needs, consuming 1500 Nm3/h of natural gas, on wich a 4-engine power plant is installed), the annual earnings are hence around 900 000 €/ year.
5.2.5 Oil and Maintenance costs From annual savings on energy bill must be retrieved maintenance and consumables (mainly oil) costs.
5.2.5.1 Oil cost In this paper, the following figures were considered in order to calculate the cost of oil along engines’ life cycle:
- Specific oil consumption for GE Jenbacher gas engines: 0,3 [g/kWh] - Oil density : 0,887 [kg/l] - Oil price : 3,5 [€/l]
The cost of oil is hence considered as a fixed cost, around 11,84 cDA / kWh produced.
5.2.5.2 Maintenance costs Life time of GE gas engine before major overhaul is 60 000h. In this paper, three variables were taken into consideration:
- operating costs: it is the cost of labour needed for operating the engine on a daily basis. They are very low in Algeria, because the engine can basically run by itself without much surveillance and because of low labour costs.

- 44 - Market Analysis for Gas Engine Technology in Algeria Stéphane Michaut, 2013
- the cost of preventive and curative maintenance. It is the sum of all minor maintenance operations that have to be carried out during these 60 000 hours of operation, remote assistance, spare parts and labour, usually accounted in € per operating hour.
- the cost of major overhaul after 60 000h of operating hours.
These costs highly depend on engine type. As mentioned above, the costs mentioned and used in this paper have voluntarily been changed for confidentiality purposes.
5.2.6 Analytical tools: Payback Time, Net Present Value, Rate of Return, Cost of kWh From the previous calculations can be highlighted important indicators for estimating the profitability of a project.
5.2.6.1 ROI, NPV, IRR The annual gross income is the sum of all cash flows : annual gains compared to current operation, from which are retrieved annual maintenance and oil costs. The Return On Investment (ROI) or payback time is the time after which annual gross incomes “repay” the original investment, calculated as the initial investment minus subsidies divided by annual gross income.
The Net Present Value is used in capital budgeting for estimating long-term projects profitability by taking into consideration the present value of money at the time of the investment, to the present value of money in the future. It uses hence the series of cash flows, with a discount rate. It is an indicator of how much value adds a project to a company. Higher is the NPV, better is the project.
The Internal Rate of Return (IRR) is the rate that makes the NPV equal to zero. It is an indicator of the efficiency of an investment (how fast a project adds value to a company), whose result has to be greater than a minimum rate set by rational investors.
In the industrial sector, these three indicators can be used by the owner of the factory to defend the viability of a project to the bank and get a loan. In most cases though, industrial groups in Algeria have enough cash to auto finance their projects.
5.2.6.2 Cost of kWh Rather than projects indicators, industries are usually more interested by cost of production of the kWh, which is a physical variable that can be easily compared to Sonelgaz prices. For each variable (investment, loan costs, maintenance costs, overhaul, input gas, oil cost, thermal gains, eventual feed in revenue, etc...) the value over a certain period is divided by the amount of kWh produced over the same period.
The time frame usually considered in this paper is 15 years ( 2 x 7,5 years in order to include the major overhaul in the analysis), considering that the CHP plant will work all the year round (8760 hours). In France, the cogeneration period covers only November – April, and the CHP plant operates only 6000 hours / year : the period considered would rather be 24 years.
The financial analysis conducted for each option is described in the table below.
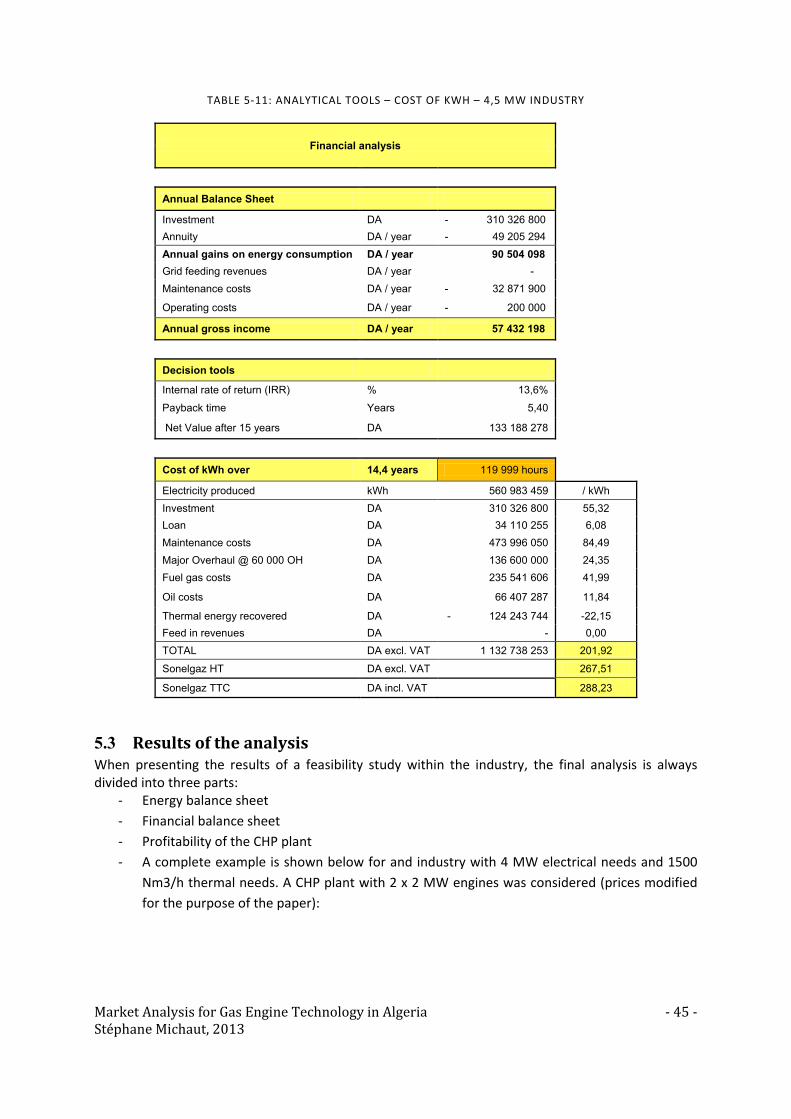
Market Analysis for Gas Engine Technology in Algeria - 45 - Stéphane Michaut, 2013
TABLE 5-11: ANALYTICAL TOOLS – COST OF KWH – 4,5 MW INDUSTRY
Financial analysis
Annual Balance Sheet Investment DA - 310 326 800 Annuity DA / year - 49 205 294 Annual gains on energy consumption DA / year 90 504 098 Grid feeding revenues DA / year - Maintenance costs DA / year - 32 871 900 Operating costs DA / year - 200 000 Annual gross income DA / year 57 432 198
Decision tools Internal rate of return (IRR) % 13,6% Payback time Years 5,40 Net Value after 15 years DA 133 188 278
Cost of kWh over 14,4 years 119 999 hours Electricity produced kWh 560 983 459 / kWh Investment DA 310 326 800 55,32 Loan DA 34 110 255 6,08 Maintenance costs DA 473 996 050 84,49 Major Overhaul @ 60 000 OH DA 136 600 000 24,35 Fuel gas costs DA 235 541 606 41,99
Oil costs DA 66 407 287 11,84
Thermal energy recovered DA - 124 243 744 -22,15 Feed in revenues DA - 0,00 TOTAL DA excl. VAT 1 132 738 253 201,92
Sonelgaz HT DA excl. VAT 267,51
Sonelgaz TTC DA incl. VAT 288,23
5.3 Results of the analysis When presenting the results of a feasibility study within the industry, the final analysis is always divided into three parts:
- Energy balance sheet - Financial balance sheet - Profitability of the CHP plant - A complete example is shown below for and industry with 4 MW electrical needs and 1500
Nm3/h thermal needs. A CHP plant with 2 x 2 MW engines was considered (prices modified for the purpose of the paper):

- 46 - Market Analysis for Gas Engine Technology in Algeria Stéphane Michaut, 2013
TABLE 5-12: FEASIBILITY RESULTS – EXAMPLE OF FINAL ANALYSIS
ENERGY BALANCE SHEET OPTION 1 Average Power Needed 4 000 kW Installed Power 4 000 kW Engine type 2 x JMS 612 Electricity Current Sonelgaz consumption 35 040 000 kWe Future CHP plant production 31 573 092 kWe Future Sonelgaz consumption 3 466 908 kWe Gas Current Sonelgaz consumption 129 948 488 kWth Future CHP plant consumption 73 786 316 kWth Future CHP plant thermal production -36 730 030 kWth Future Sonelgaz consumption 167 004 774 kWth
FINANCIAL BALANCE SHEET OPTION 1 Without CHP plant Cost of Electricity 93 776 901 DA Cost of Gas 25 053 497 DA TOTAL 118 830 398 DA With CHP plant Cost of Electricity 12 389 755 DA Cost of Gas 18 519 240 DA CHP plant gas consumption 13 126 554 DA TOTAL 44 660 039 DA ANNUAL GAINS ON ENERGY 74 170 359 DA
PROFITABILITY OPTION 1 Investment -253 000 000 DA Subsidies -7 000 000 DA Annual gains on energy consumption 74 170 359 DA Grid feeding revenues 0 DA Maintenance costs -16 644 000 DA Operating costs -200 000 DA Annual gross income 57 326 359 DA Cost of kWh Sonelgaz 268 cDA CHP plant 166 cDA Decision tools Internal rate of return 19,4% Payback time (1) 4,41 Years Net Value after 15 years 216 556 326 DA

Market Analysis for Gas Engine Technology in Algeria - 47 - Stéphane Michaut, 2013
FIGURE 5-4: FEASABILITY RESULTS - COST OF KWH OVER 15 YEARS
For the purpose of this paper and for readability reasons, only the profitability results will be analysed and the four key variables highlighted (ROI, NPV, IRR, Cost of kWh) in the rest of this chapter.
5.3.1 Influence of electrical and thermal efficiencies on profitability Efficiency of a generator is usually one of the most important criterions, above all in countries where fuel is expensive. In this section the following input data were used:
- Electricity rate E41, gas rate 21T - Industry with 2000kW constant active power consumption, 1500 Nm3/h gas consumption - 85% reactive power consumption, PAD = 2600kW, MPR = 2800kW - three options, each of them with a 2-MW engine installed with varying efficiencies as follow :
Investment
Loan
Maintenance
Overhaul @60k
Fuel gas
Oil
Thermal energy recovered
excl. VAT incl. VAT
-30.00-20.00-10.00
0.0010.0020.0030.0040.0050.0060.0070.0080.0090.00
100.00110.00120.00130.00140.00150.00160.00170.00180.00190.00200.00210.00220.00230.00240.00250.00260.00270.00280.00290.00
CHP plant 1:166 cDA
Sonelgaz:268 cDA
Sonelgaz:288 cDA
Cost of kWh over 15 years

- 48 - Market Analysis for Gas Engine Technology in Algeria Stéphane Michaut, 2013
TABLE 5-13: INFLUENCE OF ELECTRICAL AND THERMAL EFFICIENCIES ON ROI
PROFITABILITY OPTION 1 OPTION 2 OPTION 3 Average Power Needed 2 000 kW 2 000 kW 2 000 kW Installed Power 2 000 kW 2 000 kW 2 000 kW Engine type 1 1 x JMS 612 1 x JMS 612 1 x JMS 612 η electrical 40,81% 42,79% 44,68% η thermal 46,37% 44,80% 44,30% Cost of kWh Sonelgaz 269 cDA 269 cDA 269 cDA CHP plant 167 cDA 167 cDA 166 cDA Decision tools Internal rate of return 23,3% 23,4% 23,7% Payback time (1) 3,77 Years 3,77 Years 3,73 Years Net Value after 15 years 113 216 050 DA 113 578 589 DA 115 746 106 DA
FIGURE 5-5: INFLUENCE OF ELECTRICAL AND THERMAL EFFICIENCIES ON COST OF KWH
As can be seen in the previous graph, efficiencies (both electrical and thermal) have a very small impact on ROI, NPV and IRR, mostly due to low fuel gas costs in Algeria. The cost of electricity production is very much similar between a 40% electrical efficient power plant and a 44% electrical efficient power plant and the difference between these both plants in terms of annual income is insignificant (less than 3000€/year!).
Conclusion: the engine choice in Algeria would rather not be based on efficiencies but will rely more on initial investment and maintenance costs.
Investment Investment Investment
Loan Loan Loan
Maintenance Maintenance Maintenance
Overhaul @60k Overhaul @60k Overhaul @60k
Fuel gas Fuel gas Fuel gas
Oil Oil Oil
Thermal energy recovered
Thermal energy recovered
Thermal energy recovered
excl. VAT incl. VAT
-20.00-10.00
0.0010.0020.0030.0040.0050.0060.0070.0080.0090.00
100.00110.00120.00130.00140.00150.00160.00170.00180.00190.00200.00210.00220.00230.00240.00250.00260.00270.00280.00290.00
CHP plant 1:167 cDA
CHP plant 2:167 cDA
CHP plant 3:166 cDA
Sonelgaz:269 cDA
Sonelgaz:290 cDA
Cost of kWh over 15 years

Market Analysis for Gas Engine Technology in Algeria - 49 - Stéphane Michaut, 2013
5.3.2 Influence of plant size on profitability: economies of scale The bigger the cheaper (proportionally): same rule prevails for gas engines. In this section the following input data were used:
- Electricity rate E41, gas rate 21T - Industry with 1MW, 2MW and 4MW constant active power consumption, 1500 Nm3/h gas
consumption - 85% reactive power consumption, - 1-MW, 2-MW, 4-MW engines installed, running at full load 95% of the year
TABLE 5-14 : INFLUENCE OF PLANT SIZE ON ROI
ENERGY BALANCE SHEET OPTION 1 OPTION 2 OPTION 3 Average Power Needed 1 063 kW 2 000 kW 4 035 kW Installed Power 1 063 kW 2 000 kW 4 035 kW Engine type 1 1 x JMS 320 GS-N/LC C05 1 x JMS 612 GS-N/LC F111 1 x JMS 624 GS-N/LC G111 Cost of kWh Sonelgaz 271 cDA 269 cDA 268 cDA CHP plant 172 cDA 165 cDA 160 cDA Decision tools Internal rate of return 20,9% 24,4% 25,0% Payback time (1) 4,12 Years 3,64 Years 3,60 Years Net Value after 15 years 53 981 377 DA 116 978 589 DA 253 614 693 DA
FIGURE 5-6: INFLUENCE OF PLANT SIZE ON COST OF KWH
Investment Investment Investment
Loan Loan Loan
Maintenance Maintenance Maintenance
Overhaul @60k Overhaul @60k Overhaul @60k
Fuel gas Fuel gas Fuel gas
Oil Oil Oil
Thermal energy recovered
Thermal energy recovered
Thermal energy recovered
excl. VAT incl. VAT
-20.00-10.00
0.0010.0020.0030.0040.0050.0060.0070.0080.0090.00
100.00110.00120.00130.00140.00150.00160.00170.00180.00190.00200.00210.00220.00230.00240.00250.00260.00270.00280.00290.00
CHP plant 1:172 cDA
CHP plant 2:165 cDA
CHP plant 3:160 cDA
Sonelgaz:268 cDA
Sonelgaz:288 cDA
Cost of kWh over 15 years

- 50 - Market Analysis for Gas Engine Technology in Algeria Stéphane Michaut, 2013
The size of the plant has obviously a strong effect on the variables: IRR and ROI are better for a 4-MW plant than for a 1-MW plant (the investment pays back faster), and on the long term the 4-MW plant will obviously bring more value to the company (NPV higher).
The capital cost part is around 15% lower for a 4-MW plant than for a 1-MW plant (proportionally), and maintenance costs around 10%. As electrical efficiency goes up with the size, fuel gas costs are also lower of some 5%.
Conclusion: the result of all this is a cost of production per kWh 7,04 % cheaper in the case of a 4-MW plant compared to a 1-MW plant.
5.3.3 Influence of cogeneration type on profitability When it comes to gas engine based CHP plants, the figure below shows the two main points where heat can be recovered:
- Engine cooling water circuit, at low temperature (70°C / 90°C customer side) - Exhaust gases at high temperature (around 400°C), whose direct use is conditioned by the
quality of fuel input gas and might need treatment
Three main uses of this available heat exist.
5.3.3.1 Hot air It consists in transferring the heat of engine cooling water into hot air with a water/air heat exchanger, combined with the direct use of exhaust gases into the client’s process. Very low capital costs, high heat recovery efficiency (>50%). All usable heat can usually be recovered.
5.3.3.2 Hot water Engine cooling water can be used directly, further heated in an exhaust gas heat exchanger. Higher capital costs due to the use of the heat exchanger on exhaust gases, lower heat recovery efficiency due to the fact that exhaust gases can’t be cooled down lower than 120°C in order to avoid apparition of condensate. All usable heat can usually be recovered.
5.3.3.3 Steam Engine cooling water is used to preheat the feed water which will then be evaporated in an exhaust gas boiler. High capital cost, higher maintenance and operation costs due to the necessary monitoring of a pressurized system, lower heat recovery efficiency since the evaporating point goes up as the steam pressure increases.
A 2-MWe engine will for instance produce 1 134 kg/h of steam @4 bars, with an exhaust gas thermal output of 760 kW, while the production @8 bars is only 980 kg/h and the thermal output 666 kW.

Market Analysis for Gas Engine Technology in Algeria - 51 - Stéphane Michaut, 2013
TABLE 5-15: CALCULATION OF STEAM PRODUCTION - 2 MW ENGINE
Steam prod. JMS 612 4 bars 8 bars
T°C water in : 15,00 °C 15,00 °C
T°C water out : 90,00 °C 90,00 °C
Cp water avr 15°C - 90°C : 4,1955 kJ/kg 4,1955 kJ/kg
Exhaust mass flow rate : 11 456 kg/h 11 456 kg/h
T°C exhaust gas : 390,00 °C 390,00 °C
Cp exhaust gas : 1,1040 kJ/kg 1,1040 kJ/kg
T°C feed water : 90,00 °C 90,00 °C
Enthalpy h1' : 377,00 kJ/kg 377,00 kJ/kg
T°C vap : 143,62 °C 170,41 °C
Enthalpy h2' : 604,67 kJ/kg 720,94 kJ/kg
Enthalpy h2'' : 2737,60 kJ/kg
2767,50 kJ/kg
Pinch point : 30,00 °C 30,00 °C
Cooling exhaust down to : 173,62 °C 200,41 °C
P th exhaust gas : 760 kW 666 kW
Steam prod. : 1 134 kg/h 980 kg/h
For gas engines, the exhaust gas temperature is relatively low (around 400°C) which lowers the amount of steam that can be produced. Furthermore the shares of “power available at low temperature for water pre heating” / “power available at high temperature for water evaporating” is generally around 60% / 40%. Hence, a gas engine can only vaporize a small part of the produced hot water at 90°C, and when there is no further need for warm water the remaining available heat at low temperature is lost and has to be dissipated through air coolers.
The example below shows the recoverable thermal output of a 2 MWe engine producing steam at 8 bars. Only 752 kW can be used, the remaining 1332 kW are lost.
FIGURE 5-7: PRODUCTION OF STEAM @ 8 BARS - 2 MW ENGINE
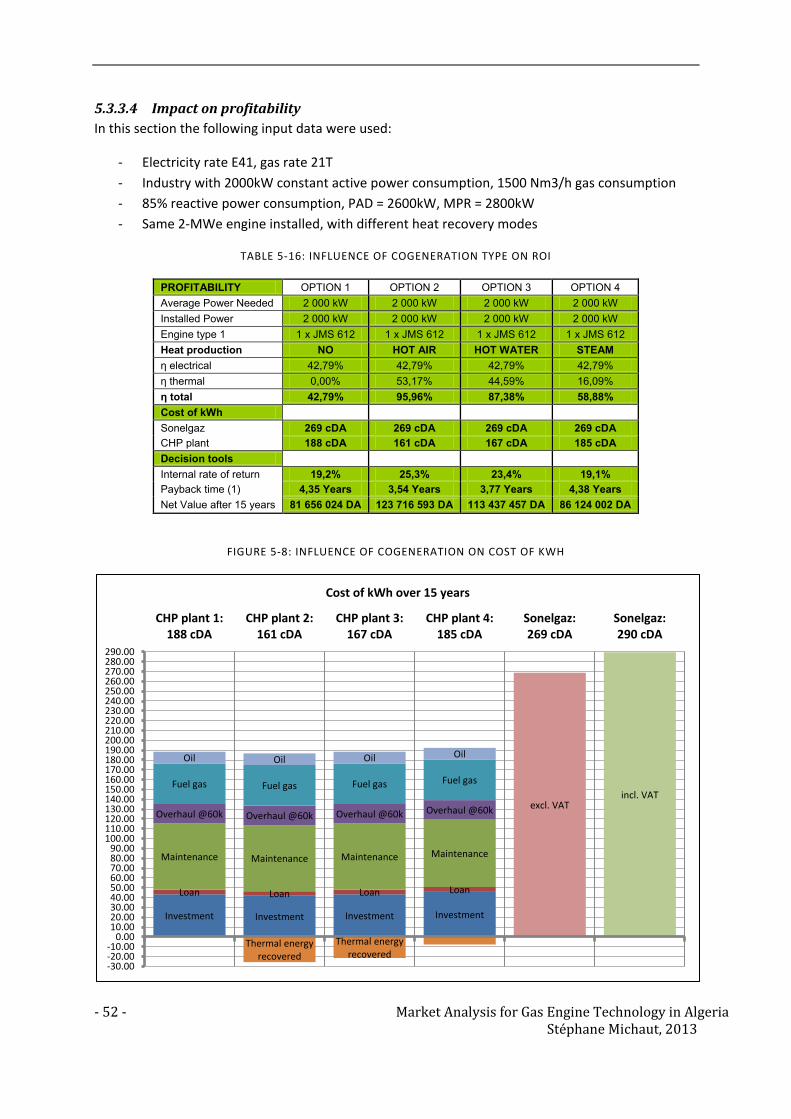
- 52 - Market Analysis for Gas Engine Technology in Algeria Stéphane Michaut, 2013
5.3.3.4 Impact on profitability In this section the following input data were used:
- Electricity rate E41, gas rate 21T - Industry with 2000kW constant active power consumption, 1500 Nm3/h gas consumption - 85% reactive power consumption, PAD = 2600kW, MPR = 2800kW - Same 2-MWe engine installed, with different heat recovery modes
TABLE 5-16: INFLUENCE OF COGENERATION TYPE ON ROI
PROFITABILITY OPTION 1 OPTION 2 OPTION 3 OPTION 4 Average Power Needed 2 000 kW 2 000 kW 2 000 kW 2 000 kW Installed Power 2 000 kW 2 000 kW 2 000 kW 2 000 kW Engine type 1 1 x JMS 612 1 x JMS 612 1 x JMS 612 1 x JMS 612 Heat production NO HOT AIR HOT WATER STEAM η electrical 42,79% 42,79% 42,79% 42,79% η thermal 0,00% 53,17% 44,59% 16,09% η total 42,79% 95,96% 87,38% 58,88% Cost of kWh Sonelgaz 269 cDA 269 cDA 269 cDA 269 cDA CHP plant 188 cDA 161 cDA 167 cDA 185 cDA Decision tools Internal rate of return 19,2% 25,3% 23,4% 19,1% Payback time (1) 4,35 Years 3,54 Years 3,77 Years 4,38 Years Net Value after 15 years 81 656 024 DA 123 716 593 DA 113 437 457 DA 86 124 002 DA
FIGURE 5-8: INFLUENCE OF COGENERATION ON COST OF KWH
Investment Investment Investment Investment
Loan Loan Loan Loan
Maintenance Maintenance Maintenance Maintenance
Overhaul @60k Overhaul @60k Overhaul @60k Overhaul @60k
Fuel gas Fuel gas Fuel gas Fuel gas
Oil Oil Oil Oil
Thermal energy recovered
Thermal energy recovered
excl. VAT incl. VAT
-30.00-20.00-10.00
0.0010.0020.0030.0040.0050.0060.0070.0080.0090.00
100.00110.00120.00130.00140.00150.00160.00170.00180.00190.00200.00210.00220.00230.00240.00250.00260.00270.00280.00290.00
CHP plant 1:188 cDA
CHP plant 2:161 cDA
CHP plant 3:167 cDA
CHP plant 4:185 cDA
Sonelgaz:269 cDA
Sonelgaz:290 cDA
Cost of kWh over 15 years

Market Analysis for Gas Engine Technology in Algeria - 53 - Stéphane Michaut, 2013
The table and graph above clearly show that:
- Best ROI, IRR and NPV are achieved with CHP plant using hot air. The ceramic industry (brick factories, ...) has hence the best potential for gas engine use in Algeria.
- Hot water use also has a good potential - Steam production alone has a very limited potential within current framework. It increases
the initial investment cost of almost 10%, complicates the project (special authorizations needed for pressurized systems) and the operation of the plant for a limited added value: the final amount of steam usually doesn’t match industrial needs, and ROI, IRR and NPV are the same as with a simple power plant with no heat recovery system!
Conclusion: industrial applications using hot air will be first targeted for CHP use. For other applications, generating set will be privileged.
5.3.4 Single vs multiple engine power plant: influence of flexibility and grid reliability on profitability
One of the challenges within the industry is to explain that CHP plants and Sonelgaz are not competing against but rather helping each other: CHP plants will help resolve locally the necessary load shedding during peak periods by adding a decentralized power plant at the consumption point. On the other hand, having access to the grid will considerably lower the capital cost needed for the CHP plant, by being the backup solution when the CHP plant is under maintenance.
Industries in Algeria are all connected to the grid. If the risk of load shedding is 50% without CHP plant, after installing a 95% available CHP plant this risk goes down to 50% * 5% = 2,5% of the time. The question is then:
- what added value does this stabilization represent for the customer in terms of production ? - does this 2,5 % risk justifies the installation of an additional gas engine in order to get up to
100% availability ?
5.3.4.1 Value of grid stabilization In this section the following input data were used:
- Electricity rate E41, gas rate 21T - Industry with 4000kW constant active power consumption, 1500 Nm3/h gas consumption - 85% reactive power consumption, PAD = 5200kW, MPR = 5600kW - Three options as follow : 4 x 1 MW, 2 x 2 MW, 1 x 4 MW

- 54 - Market Analysis for Gas Engine Technology in Algeria Stéphane Michaut, 2013
TABLE 5-17: SINGLE VS MULTIPLE ENGINE CHP PLANT - VALUE OF GRID STABILIZATION
PROFITABILITY OPTION 1 OPTION 2 OPTION 3 Average Power Needed 4 000 kW 4 000 kW 4 000 kW Installed Power 4 252 kW 4 000 kW 4 035 kW Guaranteed power 100% of the time 3 189 kW 2 000 kW 0 kW Engine type 1 4 x JMS 320 2 x JMS 612 1 x JMS 624 % of load covered by CHP 95,1% 90,1% 91,1% Cost of kWh Sonelgaz 268 cDA 268 cDA 268 cDA CHP plant 178 cDA 167 cDA 160 cDA Decision tools Internal rate of return 18,6% 23,5% 25,0% Payback time (1) 4,52 Years 3,76 Years 3,61 Years Net Value after 15 years 193 817 196 DA 229 157 701 DA 252 963 103 DA Value of grid stabilization 26 000 000 DA 12 000 000 DA 10 000 000 DA Payback time (2), with consideration of grid stabilization value 3,06 Years 3,06 Years 3,05 Years
The best economical option is of course installing a single engine 4-MW CHP plant. By accounting an additional gain of 100 000€/year due to grid stabilization, the ROI goes down to 3 years.
With the 4 x 1 MW plant, 3 MW will be available 100% of the time and the added value for the customer of having a 3 MW guaranteed power has to go up to 260 000€/year in order to get a 3-year ROI, which is rarely the case.
The 2 x 2-MW option represents a good intermediate, with a 50 % load guaranteed (2 000 kW) 100% of the time, and an additional added value of 120 000€/year instead of 100 000€/year in order to get a 3-year ROI.
FIGURE 5-9: SINGLE VS MULTI ENGINE CHP PLANT - COST OF KWH
Investment Investment Investment
Loan Loan Loan
Maintenance Maintenance Maintenance
Overhaul @60k Overhaul @60k Overhaul @60k
Fuel gas Fuel gas Fuel gas
Oil Oil Oil
Thermal energy recovered
Thermal energy recovered
Thermal energy recovered
excl. VAT incl. VAT
-30.00-20.00-10.00
0.0010.0020.0030.0040.0050.0060.0070.0080.0090.00
100.00110.00120.00130.00140.00150.00160.00170.00180.00190.00200.00210.00220.00230.00240.00250.00260.00270.00280.00290.00
CHP plant 1:178 cDA
CHP plant 2:167 cDA
CHP plant 3:160 cDA
Sonelgaz:268 cDA
Sonelgaz:288 cDA
Cost of kWh over 15 years
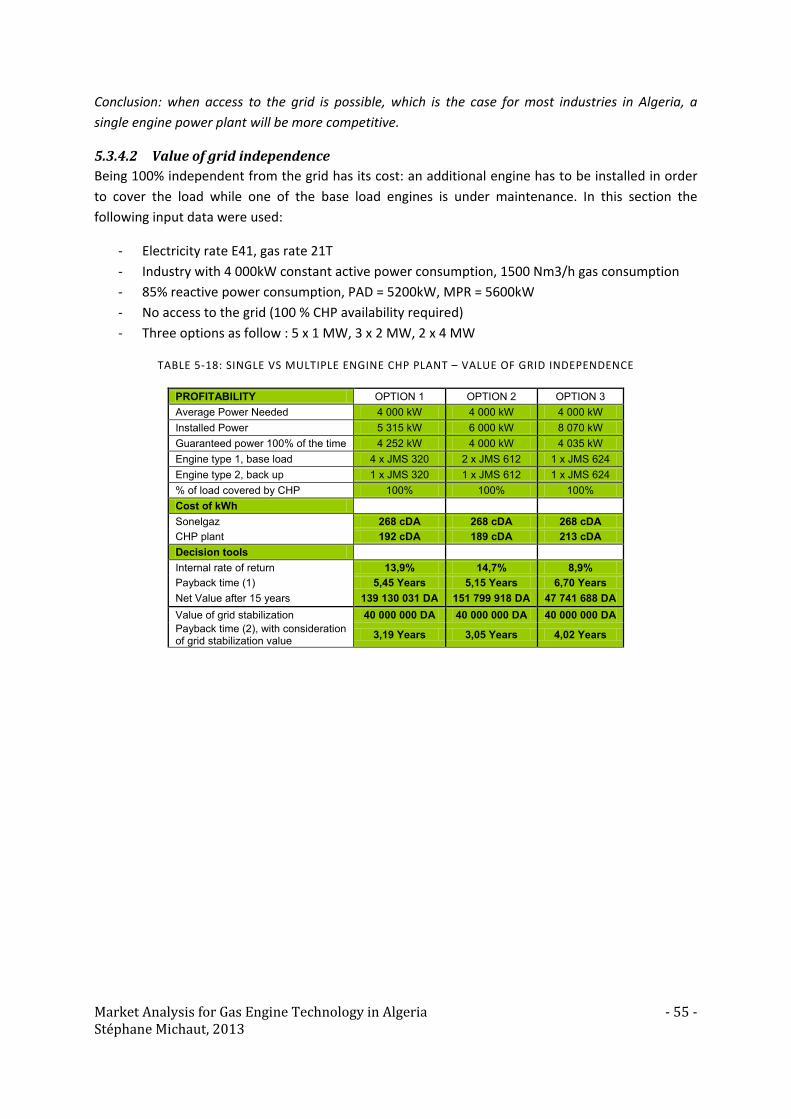
Market Analysis for Gas Engine Technology in Algeria - 55 - Stéphane Michaut, 2013
Conclusion: when access to the grid is possible, which is the case for most industries in Algeria, a single engine power plant will be more competitive.
5.3.4.2 Value of grid independence Being 100% independent from the grid has its cost: an additional engine has to be installed in order to cover the load while one of the base load engines is under maintenance. In this section the following input data were used:
- Electricity rate E41, gas rate 21T - Industry with 4 000kW constant active power consumption, 1500 Nm3/h gas consumption - 85% reactive power consumption, PAD = 5200kW, MPR = 5600kW - No access to the grid (100 % CHP availability required) - Three options as follow : 5 x 1 MW, 3 x 2 MW, 2 x 4 MW
TABLE 5-18: SINGLE VS MULTIPLE ENGINE CHP PLANT – VALUE OF GRID INDEPENDENCE
PROFITABILITY OPTION 1 OPTION 2 OPTION 3 Average Power Needed 4 000 kW 4 000 kW 4 000 kW Installed Power 5 315 kW 6 000 kW 8 070 kW Guaranteed power 100% of the time 4 252 kW 4 000 kW 4 035 kW Engine type 1, base load 4 x JMS 320 2 x JMS 612 1 x JMS 624 Engine type 2, back up 1 x JMS 320 1 x JMS 612 1 x JMS 624 % of load covered by CHP 100% 100% 100% Cost of kWh Sonelgaz 268 cDA 268 cDA 268 cDA CHP plant 192 cDA 189 cDA 213 cDA Decision tools Internal rate of return 13,9% 14,7% 8,9% Payback time (1) 5,45 Years 5,15 Years 6,70 Years Net Value after 15 years 139 130 031 DA 151 799 918 DA 47 741 688 DA Value of grid stabilization 40 000 000 DA 40 000 000 DA 40 000 000 DA Payback time (2), with consideration of grid stabilization value 3,19 Years 3,05 Years 4,02 Years

- 56 - Market Analysis for Gas Engine Technology in Algeria Stéphane Michaut, 2013
FIGURE 5-10: SINGLE VS MULTIPLE CHP PLANT - COST OF KWH FOR 100% AVAILABILITY
The best option when it comes to securing 100% of the electrical needs is OPTION 2 (3 engines, with a unit power capacity equivalent to 50% of the load). The capital cost is lower than OPTION 3 (for a 4-MW plant 100% guaranteed, only 6 MW are installed instead of 8 MW in scenario 3), and the maintenance costs are lower than in OPTION 1 (3 engines instead of 5). The added value of being independent from the grid has to be more than 400 000€/year for the ROI to go down to 3 years.
Conclusion: having a 100% independent power plant impacts the ROI of approx. 1,5 year, going up from 3,76 years to 5,15years (OPTION 2).
5.3.4.3 Last kWh produced The following graph compares the cost of production for a 2 x 2 MW plant without back up, the cost of production of the backup engine, and the total cost of a 3 x 2 MW plant.
Investment Investment Investment
Loan Loan
Loan
Maintenance Maintenance
Maintenance
Overhaul @60k Overhaul @60k
Overhaul @60k Fuel gas Fuel gas
Fuel gas Oil Oil
Oil
Thermal energy recovered
Thermal energy recovered
Thermal energy recovered
excl. VAT incl. VAT
-30.00-20.00-10.00
0.0010.0020.0030.0040.0050.0060.0070.0080.0090.00
100.00110.00120.00130.00140.00150.00160.00170.00180.00190.00200.00210.00220.00230.00240.00250.00260.00270.00280.00290.00
CHP plant 1:192 cDA
CHP plant 2:189 cDA
CHP plant 3:213 cDA
Sonelgaz:268 cDA
Sonelgaz:288 cDA
Cost of kWh over 15 years

Market Analysis for Gas Engine Technology in Algeria - 57 - Stéphane Michaut, 2013
FIGURE 5-11: SINGLE VS MULTIPLE ENGINE CHP PLANT - LAST KWH PRODUCED
Conclusion: the additional cost induced by having a backup engine in order to be 100% independent from the grid strongly impacts the cost of production of these additional kWh. These “last kWh produced” are not competitive anymore, and when possible it is better to get them from the grid.
5.3.5 Influence of electricity and gas rates evolution on profitability
5.3.5.1 Sonelgaz prices increase Sonelgaz electricity and gas rates have remained unchanged since 2005, making annual losses of 550 M€. Early June ’12, the management announced that a 50% electricity rate increase would be needed in order to establish financial breakeven, redevelop the infrastructures as needed in the 8 GW emergency plan to be implemented by 2017, and finally secure the grid. But the government is still reluctant to authorize such an increase given the political and social impact it would have, and prefers balancing these losses with the revenues from oil export.
This situation will not last forever, and it is important to measure the impact of this gas and electricity rate increase on the Algerian gas engine market. In this section the following input data were used:
- Electricity rate E41, gas rate 21T, with potential increase of 50 % each - Industry with 2000kW constant active power consumption, 1500 Nm3/h gas consumption - 85% reactive power consumption, PAD = 2600kW, MPR = 2800kW - three options, each of them with a 2-MW engine installed with varying efficiencies as follow :
Investment
Investment
Investment Loan
Loan
Loan Maintenance
Maintenance
Maintenance Overhaul @60k
Overhaul @60k Fuel gas
Fuel gas
Fuel gas Oil
Oil
Oil
Therm. Energy Therm. Energy Therm. Energy
excl. VAT incl. VAT
-30.00
20.00
70.00
120.00
170.00
220.00
270.00
320.00
370.00
420.00
470.00
520.00
570.00
620.00
670.00
720.00
CHP plantwithout back up:
167 cDA
Back upproduction cost:
742 cDA
Totalaverage cost:
189 cDASonelgaz:268 cDA
Sonelgaz:288 cDA
Cost of kWh over 15 years

- 58 - Market Analysis for Gas Engine Technology in Algeria Stéphane Michaut, 2013
TABLE 5-19: INFLUENCE OF SONELGAZ RATES INCREASE ON ROI
PROFITABILITY OPTION 1 OPTION 2 OPTION 2 OPTION 3 Average Power Needed 2 000 kW 2 000 kW 2 000 kW 2 000 kW Installed Power 2 000 kW 2 000 kW 2 000 kW 2 000 kW Engine type 1 1 x JMS 612 1 x JMS 612 1 x JMS 612 1 x JMS 612 Electrical rate increase + 0% + 0% + 50% + 50% Gas rate increase + 0% + 50% + 0% + 50% Cost of kWh Sonelgaz 269 cDA 269 cDA 403 cDA 403 cDA CHP plant 165 cDA 175 cDA 165 cDA 175 cDA Decision tools Internal rate of return 24,4% 22,1% 47,6% 45,6% Payback time (1) 3,64 Years 3,91 Years 2,05 Years 2,13 Years Net Value after 15 years 116 978 589 DA 100 241 187 DA 302 295 370 DA 285 557 969 DA
FIGURE 5-12: INFLUENCE OF SONELGAZ RATES INCREASE ON COST OF KWH
A gas rate increase has a limited impact on key variables due to its relatively small share in the total cost of production per kWh. A 50% increase would only increase the cost of production with 6%, and the difference on ROI is less than 4 months.
On the opposite, an electricity rate increase would have a very strong impact on the gas engine market in Algeria: a 50% increase would decrease the ROI down to two years, and would triple the NPV after 15 years.
Investment Investment Investment Investment
Loan Loan Loan Loan
Maintenance Maintenance Maintenance Maintenance
Overhaul @60k Overhaul @60k Overhaul @60k Overhaul @60k
Fuel gas Fuel gas
Fuel gas Fuel gas
Oil Oil
Oil Oil
Thermal energy recovered
Thermal energy recovered
Thermal energy recovered
Thermal energy recovered
excl. VAT incl. VAT
-40.00-20.00
0.0020.0040.0060.0080.00
100.00120.00140.00160.00180.00200.00220.00240.00260.00280.00300.00320.00340.00360.00380.00400.00420.00440.00
CHP plant 1:165 cDA
CHP plant 2:175 cDA
CHP plant 2:165 cDA
CHP plant 3:175 cDA
Sonelgaz:403 cDA
Sonelgaz:433 cDA
Cost of kWh over 15 years

Market Analysis for Gas Engine Technology in Algeria - 59 - Stéphane Michaut, 2013
Conclusion: the inevitable increase in Sonelgaz electricity rates will largely impact the gas engine business in Algeria in a positive way, while a gas rate increase won’t really harm its potential.
5.3.5.2 Introduction of feed-in tariffs As explained in Part 5.2.2.1, feed-in tariffs were determined in the law n°02-01 of February 2002 the 5th but are still not enforced. Hence, no legal framework actually allows a small private producer to install its own power plant and export into the grid.
A revision of the application decree is currently under study, and should be enforced by the end of year 2012. It is important to measure the impact of this gas and electricity feed in tariff on the Algerian gas engine market. In this section the following input data were used:
- Electricity rate E41, gas rate 21T, with feed-in tariff at 160% of electrical market price - Industry with 2000kW constant active power consumption, 1500 Nm3/h gas consumption - 85% reactive power consumption, PAD = 2600kW, MPR = 2800kW
TABLE 5-20: INFLUENCE OF FEED-IN TARIFFS ON ROI
ENERGY BALANCE SHEET OPTION 1 OPTION 2 OPTION 3 Average Power Needed 2 000 kW 2 000 kW 2 000 kW Installed Power 2 677 kW 2 000 kW 2 677 kW Engine type 1 1 x JMS 616 1 x JMS 612 1 x JMS 616 Feed in tariff 160% NO NO Cost of kWh Sonelgaz 269 cDA 269 cDA 269 cDA CHP plant 146 cDA 165 cDA 188 cDA Decision tools Internal rate of return 33,3% 24,4% 16,7% Payback time (1) 2,84 Years 3,64 Years 4,79 Years Net Value after 15 years 243 098 160 DA 116 978 589 DA 80 198 577 DA

- 60 - Market Analysis for Gas Engine Technology in Algeria Stéphane Michaut, 2013
FIGURE 5-13: INFLUENCE OF FEED-IN TARIFFS ON ROI
Oversizing the engine is not economically interesting at the moment (better ROI, IRR and NPV for OPTION 2 - 2000kW than for OPTION 3 - 2677kW). It is the reason why CHP plants currently offered are based on the average power consumption and not the maximum peak power observed. Once the feed-in tariffs will be enforced it will become attractive to dimension the plant on the maximum peak power consumed.
Conclusion: the introduction of a feed-in tariff of 160% will not only influence the choice of engine type, but will also leverage the profitability of gas engine based CHP plants by decreasing the ROI with approximately 1 year.
5.3.6 Application to a similar market: Tunisia Due to lower hydrocarbons resources in Tunisia, energy prices are much higher than in Algeria. Though the three targeted markets are somehow similar (CHP for the industry, production for the national grid and Oil&Gas for flare gas application), profitability will widely vary between both countries.
In this section the following input data were used:
- Industry with 2000kW constant active power consumption - 2 MW engine with same CAPEX and OPEX - Comparison between Algerian rates and Tunisian rates
Investment Investment Investment Loan Loan
Loan
Maintenance Maintenance Maintenance
Overhaul @60k Overhaul @60k
Overhaul @60k Fuel gas Fuel gas
Fuel gas Oil
Oil
Oil
Thermal energy recovered
Thermal energy recovered
Thermal energy recovered
excl. VAT incl. VAT
-30.00-20.00-10.00
0.0010.0020.0030.0040.0050.0060.0070.0080.0090.00
100.00110.00120.00130.00140.00150.00160.00170.00180.00190.00200.00210.00220.00230.00240.00250.00260.00270.00280.00290.00
CHP plant 1:146 cDA
CHP plant 2:165 cDA
CHP plant 3:188 cDA
Sonelgaz:269 cDA
Sonelgaz:290 cDA
Cost of kWh over 15 years

Market Analysis for Gas Engine Technology in Algeria - 61 - Stéphane Michaut, 2013
Figures 5-13 and 5-14 show the costs of gas engine generated kWh in both Algeria and Tunisia compared with local electricity providers (Sonelgaz in Algeria and STEG in Tunisia). Figure 5-15 shows the 20-year revenue for an industry investing in the same CHP plant in each of both countries.
FIGURE 5-14: COMPARISON ALGERIA / TUNISIA - COST OF KWH IN ALGERIA
Investement Investement
Maintenance Maintenance
Overhaul @60k Overhaul @60k Fuel gas Fuel gas
Oil Oil
Thermal gains
Sonelgaz Night 85.33
Sonelgaz Day 161.47
Sonelgaz Peak 726.68
-50.00
50.00
150.00
250.00
350.00
450.00
550.00
650.00
750.00OPTION 1 : 174,62 OPTION 2 : 150,13
Cost of kWh over 20 years - Algeria (cDZD)

- 62 - Market Analysis for Gas Engine Technology in Algeria Stéphane Michaut, 2013
FIGURE 5-15: COMPARISON ALGERIA / TUNISIA - COST OF KWH IN TUNISIA
FIGURE 5-16: COMPARISON ALGERIA / TUNISIA - 20 YEAR REVENUES
These graphs clearly show three consequences of having much higher energy prices in Tunisia than in Algeria:
Investement Investement Maintenance Maintenance
Overhaul @60k Overhaul @60k
Fuel gas Fuel gas
Oil Oil
Thermal gains
STEG Night 99.00
STEG Day 140.00
STEG Peak 154.00
-50.00
0.00
50.00
100.00
150.00
OPTION 1 : 91,43 OPTION 2 : 51,53
Cost of kWh over 20 years - Tunisia (mDNT)
-2 000 000 €
0 €
2 000 000 €
4 000 000 €
6 000 000 €
8 000 000 €
10 000 000 €
12 000 000 €
14 000 000 €
0 1 2 3 4 5 6 7 8 9 10 11 12 13 14 15 16 17 18 19 20
20 year revenues
Genset Tunisia CHP Tunisia Genset Algeria CHP Algeria

Market Analysis for Gas Engine Technology in Algeria - 63 - Stéphane Michaut, 2013
1. Gas is 8 times more expensive in Tunisia than in Algeria (cost in Tunisia is 29 mDNT/Th = 145 cDZD/Th, while cost in Algeria is 18 cDZD/Th). Disadvantage is hence a cost of kWh produced in Tunisia more than 3 times higher than in Algeria (91 mDNT = 457 cDZD in Tunisia, compared to 175 cDZD in Algeria) in case power only is used. On the other hand, impact of using heat is extremely significant in Tunisia - it reduces this cost of kWh of almost 45% while it hardly reduces this cost of 15% in Algeria - . Interest for cogeneration applications will be higher in Tunisia
2. Electricity is about 3 times more expensive in Tunisia than in Algeria (average value of STEG kWh excluding fixed costs is 130 mDNT = 650 cDZD, while average Sonelgaz cost is 230 cDZD). But what is important to notice here is the relative gas engine generated cost of kWh compared to the local provider: in Tunisia, gas engine will generate cheaper kWh whatever the pricing period of the day, while in Algeria a gas engine CHP plant will only be competitive during Day and Peak period. During Night time, it is cheaper to buy electricity from the grid as shown in Figure 5-13. Electricity generated by CHP plants will be more competitive in Tunisia than in Algeria
3. ROI and long term revenues are significantly better in Tunisia since electricity generated by gas engine based CHP plants is more competitive. When a 2 MW plant will make a 2,5 M€ benefit after 20 years in Algeria, the same plant will generate 13 M€ in Tunisia. While the mean value for ROI is 4,5 years in Algeria, it goes down to 1,2 year in Tunisia… Investing in a CHP plant in Tunisia will be much more profitable than in Algeria.
Conclusion: as already mentioned in Part 5.3.5, countries with higher electricity prices will be more profitable for CHP plants - even when gas prices are higher as well -. This is why Tunisia is a mature market for CHP plants, with a gas engine installed base of more than 15 machines and an advanced legislative framework, while Algeria is at its very first steps regarding energy efficiency.
5.4 Examples of operational CHP plants
5.4.1 Applications to the brickyard industry: the TAFNA example First GE Jenbacher engine in Algeria was commissioned 2009 in the brick factory Tafna. With a total power output of 2,18 MWe, this engine runs parallel to the grid and ensures stability of power supply to the whole factory, even in case of grid shortages. The thermal output is 2,6 MWth is entirely being sent in the prechamber of the kilns to lower the humidity content of the clay before entering the kiln, for a total efficiency of 91%. After almost 30 000 OPH, average cost of kWh produced is already as low as 2,96 DZD given to the client’s calculation.

- 64 - Market Analysis for Gas Engine Technology in Algeria Stéphane Michaut, 2013
FIGURE 5-17: TAFNA EXAMPLE – LAYOUT AND REALISATION
5.4.2 Application to the food industry: the Nejma oil refinery example First GE Jenbacher engine in the industry in Tunisia was commissioned 2010 in the oil refinery Nejma. With an electrical output of 1,1 MWe, it covers the manufacture’s needs with reliable electricity while feeding the grid with excess production. With a total thermal output of 1062 kW, it provides 700 kg/h of steam at 3 bars to the process as well as 27m3/h of hot water at 90°C, for a total efficiency of 83%.

Market Analysis for Gas Engine Technology in Algeria - 65 - Stéphane Michaut, 2013
FIGURE 5-18: NEJMA EXAMPLE - 3D LAYOUT AND PID
5.5 Projected CHP plants
5.5.1 Application in the tertiary sector: Algiers’ Mosque trigeneration project By 2015 four engines will be commissioned as part of the Grand Mosque project in Algiers. This mosque, the third largest in the world, will include a trigeneration plant composed of 4 gas engines, 1 peak boiler, 3 absorption chillers and 2 compression chillers providing electricity, heat and cooling water for the entire building. Each 1 MWe engine will provide 1200 kW of thermal energy used to heat water until 95°C, which will be further used whether for heating or for cooling the building through the absorption chillers. By delivering a cooling capacity of more than 3000 kWth, the trigeneration plant will not only deliver stable power but also reduce the power demand of the compression chillers by almost 1200 kWe, with a total efficiency of 85,3%.

- 66 - Market Analysis for Gas Engine Technology in Algeria Stéphane Michaut, 2013
FIGURE 5-19: ALGIERS MOSQUE PROJECT
As showed in the graph below, the whole plant should achieve a kWh as low as 1,4 DZD when cooling, and 1,9 DZD while heating. Expected ROI of the plant is 5,5 years due to the massive investment needed.
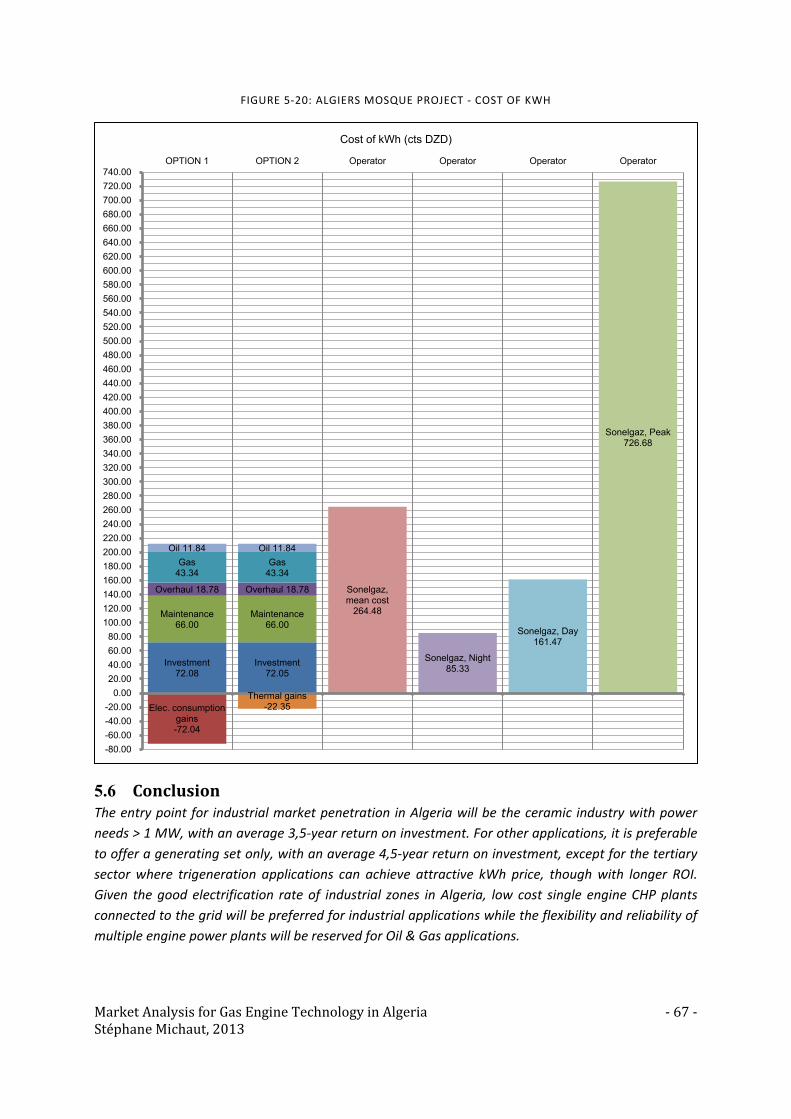
Market Analysis for Gas Engine Technology in Algeria - 67 - Stéphane Michaut, 2013
FIGURE 5-20: ALGIERS MOSQUE PROJECT - COST OF KWH
5.6 Conclusion The entry point for industrial market penetration in Algeria will be the ceramic industry with power needs > 1 MW, with an average 3,5-year return on investment. For other applications, it is preferable to offer a generating set only, with an average 4,5-year return on investment, except for the tertiary sector where trigeneration applications can achieve attractive kWh price, though with longer ROI. Given the good electrification rate of industrial zones in Algeria, low cost single engine CHP plants connected to the grid will be preferred for industrial applications while the flexibility and reliability of multiple engine power plants will be reserved for Oil & Gas applications.
Elec. consumption gains -72.04
Investment 72.08
Investment 72.05
Maintenance 66.00
Maintenance 66.00
Overhaul 18.78 Overhaul 18.78
Gas 43.34
Gas 43.34
Oil 11.84 Oil 11.84
Sonelgaz, mean cost
264.48
Sonelgaz, Night 85.33
Sonelgaz, Day 161.47
Sonelgaz, Peak 726.68
Thermal gains -22.35
-80.00-60.00-40.00-20.00
0.0020.0040.0060.0080.00
100.00120.00140.00160.00180.00200.00220.00240.00260.00280.00300.00320.00340.00360.00380.00400.00420.00440.00460.00480.00500.00520.00540.00560.00580.00600.00620.00640.00660.00680.00700.00720.00740.00
OPTION 1 OPTION 2 Operator Operator Operator Operator
Cost of kWh (cts DZD)

- 68 - Market Analysis for Gas Engine Technology in Algeria Stéphane Michaut, 2013
6. Electricity production as an alternative to gas flaring
6.1 Overview of the sector Around 140.10⁹ cubic meter of gas were flared in 2011 in the world according to the world bank and NOAA satellite data, representing about 30% of EU annual gas consumption and more than 400.10⁶ tons of CO₂ (1,2% of worldwide emissions). Only 10 countries are responsible for 72 % of this flared volume, out of which Algeria is 7th (see table below).
TABLE 6-1: ESTIMATED FLARED VOLUMES FROM SATELLITE DATA 2
Volumes in bcm 2007 2008 2009 2010 2011
Russia 52.3 42.0 46.6 35.6 37.4
Nigeria 16.3 15.5 14.9 15.0 14.6
Iran 10.7 10.8 10.9 11.3 11.4
Iraq 6.7 7.1 8.1 9.0 9.4
USA 2.2 2.4 3.3 4.6 7.1
Algeria 5.6 6.2 4.9 5.3 5.0
Kazakhstan 5.5 5.4 5.0 3.8 4.7
Angola 3.5 3.5 3.4 4.1 4.1
Saudi Arabia 3.9 3.9 3.6 3.6 3.7
Venezuela 2.2 2.7 2.8 2.8 3.5
China 2.6 2.5 2.4 2.5 2.6
Canada 2.0 1.9 1.8 2.5 2.4
Libya 3.8 4.0 3.5 3.8 2.2
Indonesia 2.6 2.5 2.9 2.2 2.2
Mexico 2.7 3.6 3.0 2.8 2.1
Qatar 2.4 2.3 2.2 1.8 1.7
Uzbekistan 2.1 2.7 1.7 1.9 1.7
Malaysia 1.8 1.9 1.9 1.5 1.6
Oman 2.0 2.0 1.9 1.6 1.6
Egypt 1.5 1.6 1.8 1.6 1.6
Total top 20 132 124 127 118 121
Rest of the world 22 22 20 20 19
Global flaring level 154 146 147 138 140
As part of its global flaring reduction policy, Algeria joined the GGFR created in 2006 to reduce global quantities of flared gas within the O&G sector. As such, Algeria invested huge amounts of money and
2 Source : NOAA satellite data

Market Analysis for Gas Engine Technology in Algeria - 69 - Stéphane Michaut, 2013
developed more than 40 projects related to flare gas reduction – mainly reinjection – so that they came down from almost 78,6% of associated gas being flared in 1973 to only 9% in 2011, earning the 2012 world bank prize of “Global Gas Flaring Reduction”.
FIGURE 6-1: FLARE GAS REDUCTION PROJECTS IN ALGERIA
FIGURE 6-2: ASSOCIATED GAS VOLUMES PRODUCED AND FLARED IN ALGERIA

- 70 - Market Analysis for Gas Engine Technology in Algeria Stéphane Michaut, 2013
However even if the percentage of non-recovered associated gases has been drastically reduced, Algeria still flares about 5.10⁹ cubic meters of gas every year around its upstream sites. These remaining flares are mostly remote oil and gas production facilities flaring “small” quantities of gas, making it hard to be transported or injected back into the field because of the high initial cost of the infrastructures. For these sites, power generation with gas engines could be an option to reduce the flare and the CO₂ emissions with high efficiency equipment and thus preserving natural gas resources. If only 10% of Algeria’s current flared volume would be used for generating power, the potential of this sector would be :
5.109�Nm3year�∗10%∗13,5 �kWh
Nm3� ∗40% [ŋ𝑒𝑙]
8760 �ℎ𝑜𝑢𝑟𝑠𝑦𝑒𝑎𝑟 �∗1000 = 308 𝑀𝑊𝑒 ….
FIGURE 6-4: FLARE GAS RECOVERY WITH GAS ENGINE
As O&G application are often more critical in terms of reliability, the model needs to be further improved in order to take into account others inputs such as other heating values than natural gas one, derating due to temperature and response of the plant to load variations. This model will be further detailed in the following Part.
FIGURE 6-3: ALGERIA FLARES

Market Analysis for Gas Engine Technology in Algeria - 71 - Stéphane Michaut, 2013
6.2 Limits of the annual consumption – based model Some assumptions were made in Part 5. in order to develop a simple model for CHP plants in Algeria. This model was developed by considering the average energy consumption over the year instead of considering the instantaneous load of the site. The result is then a CHP plant which is dimensioned on the average power need, not on the maximum power need.
For industries connected to the grid, this approach is reasonable and offers the best ROI. The only requirement for the customer is to define the priority loads of the factory during grid shedding.
When it comes to remote locations or industries that are not connected to the grid, the CHP plant will run in “island mode” and a more precise approach has to be conducted in order to deliver the needed power under all circumstances: altitude and temperature curve over the year shall be considered for calculating the derating at all time, and the load curve and its variations has to be carefully studied in order to determine the number of engines and the eventual use of a bank load.
6.3 Development of an Excel analytic tool based on instantaneous load
6.3.1 Implementation of derating The derating of a gas engine is mainly connected to three factors:
- Composition of fuel gas - Altitude of the site - Temperature of the air entering the combustion chamber
6.3.1.1 Influence of fuel gas composition When it comes to combustion with gas engines, the following criteria must be considered:
- Heating value - Methane number - Laminar flame speed - Ignition limits
While heating values (Lower or Higher) indicate the energy content of a gas, the methane number determines the knocking resistance of a gas. As can be observed in the following graphs, these parameters highly depend on the composition of the input fuel gas, and from these parameters can be determined whether a pre-treatment or a derating of the engine will be necessary. For flare gas in particular, MN widely varies between 30 and 90 depending upon its composition.

- 72 - Market Analysis for Gas Engine Technology in Algeria Stéphane Michaut, 2013
FIGURE 6-5: COMPOSITION, LHV AND MN OF SOME GASES
FIGURE 6-6: NATURAL GAS - COMPOSITION AND KHV OF SOME FIELDS
In this paper, fuel composition is considered as constant over the year. Natural gas and flare gas are the only gases considered, with LHV of 9.5 and 13.5 kWh/Nm3 respectively, and MN of 80 and 50 respectively. The necessary derating with flare gas will be considered to be 30 %. This will be used in Part 6.5.
6.3.1.2 Influence of temperature and altitude In our study, units are not mobile so that site altitude will remain constant over the year. Only temperature variations will be taken into account and implemented in the model. Although exact derating is engine specific, the following graph shows a possible response of the engine to altitude and temperature variations.
0
5
10
15
20
25
30
35
40
0
20
40
60
80
100
120
140
LHV
[kW
h/N
m3]
Com
posi
tion
[%]
and
Met
hane
Num
ber
CO
CO2
N2
H2
C4H10
C3H8
C2H6
CH4
MN
LHV
0
2
4
6
8
10
12
14
0
20
40
60
80
100
120
Groningue(Netherlands)
Urengoï(Russia)
Lacq(France)
Hassi R'Mel(Algeria)
Frigg(North Sea)
LHV
[kW
h/N
m3]
Com
posi
tion
[%]
H2S
CO
CO2
N2
H2
C4H10
C3H8
C2H6
CH4
LHV

Market Analysis for Gas Engine Technology in Algeria - 73 - Stéphane Michaut, 2013
FIGURE 6-7: DERATING AT HIGHER TEMPERATURES AND ALTITUDES - NORMAL VERSION
For hot or tropical countries, replacement of turbocharger can modify the response of the engine and give the following curves.
FIGURE 6-8: DEARTING AT HIGHER TEMPERATURES AND ALTITUDES - HOT COUNTRY VERSION
6.3.1.3 Response to temperature variations The following graphs give the responses of both “normal version” engines and “hot country” engines to temperature variations in 4 cities in Algeria: Alger and Sétif are both in the North of the country, but at different altitudes, and Biskra and In Amenas are in the Southern part of the country.
50
60
70
80
90
100
110
20 25 30 35 40 45Perc
enta
ge o
f Nom
inal
Out
put [
%]
Air Intake Temperature [°C]
0 m 500 m 1000 m 1500 m
50
60
70
80
90
100
110
20 25 30 35 40 45Perc
enta
ge o
f Nom
inal
Out
put [
%]
Air Intake Temperature [°C]
0 m 500 m 1000 m 1500 m
1,5% / °C 2% / °C
2% / °C

- 74 - Market Analysis for Gas Engine Technology in Algeria Stéphane Michaut, 2013
FIGURE 6-9: RESPONSE TO TEMPERATURE VARIATIONS - NORMAL VERSION
FIGURE 6-10: RESPONSE TO TEMPERATURE VARIATIONS - HOT COUNTRY VERSION
As can be seen in these graphs, using a hot country version with modified turbocharger has a very positive impact on engine power output (on average 7,5% less derating) and thus on technical feasibility of the projects. In reality, a better derating than 2%/°C can be achieved, but for the
-10
-5
0
5
10
15
20
25
30
35
40
45
50
2 000
2 200
2 400
2 600
2 800
3 000
3 200
3 400
3 600
3 800
4 000
Tem
pera
ture
[°C
]
Pow
er o
utpu
t [kW
]
JMS 616 - 2,67 MW - July 14th 2011
Alger - 25m Sétif - 1038m Biskra - 87m In Amenas - 562m
Alger - 25m Sétif - 1038m Biskra - 87m In Amenas - 562m
-10
-5
0
5
10
15
20
25
30
35
40
45
50
2 000
2 200
2 400
2 600
2 800
3 000
3 200
3 400
3 600
3 800
4 000
Tem
pera
ture
[°C
]
Pow
er o
utpu
t [kW
]
JMS 616 - 2,67 MW - July 14th 2011
Alger - 25m Sétif - 1038m Biskra - 87m In Amenas - 562m
Alger - 25m Sétif - 1038m Biskra - 87m In Amenas - 562m

Market Analysis for Gas Engine Technology in Algeria - 75 - Stéphane Michaut, 2013
purpose of this paper, the “worse case” scenario will be considered. Derating due to temperature will be taken at 2%/°C above 40°C @ 0m, and from 1000m on above sea level, an additional derating of 1,5%/100m will be considered.
6.3.2 Multiple engine power plant: response to load variations Gas engines are designed to operate without modification of their maintenance schedule between 50% and 100% load. Exceptionally the load can go down to 40%, but lower than this value the engine should be stopped. The plant has hence to be designed to respond to load variations based on the following criteria:
∀ t, i 𝐿𝑡𝑜𝑡(𝑡) > �(𝑚𝑖𝑛 𝑃𝑒𝑙,𝑛𝑜𝑚𝑖 ) ∗ �1 − 𝐷%𝑖 (t)�� /2
∀ t 𝐿𝑡𝑜𝑡(𝑡) < �� 𝑃𝑒𝑙,𝑛𝑜𝑚𝑖 � ∗ �1 − 𝐷%𝑖 (t)�𝑛
𝑖=0
𝐿𝑡𝑜𝑡(𝑡) : Site load at instant t [kW] 𝑃𝑒𝑙,𝑛𝑜𝑚𝑖 : Nominal power output of engine i [kW] 𝐷%𝑖 (t) : Derating of engine i at instant t [%]
The following graphs show the responses of a 3 x 2 MW engine plant in Island mode (no connection to the grid) to load variations between 1 and 5 MW in the winter and in the summer:
FIGURE 6-11: RESPONSE TO THE LOAD - MULTI ENGINE POWER PLANT - WINTER CASE
-10
-5
0
5
10
15
20
25
30
35
40
45
50
0
1 000
2 000
3 000
4 000
5 000
6 000
0:00
0:30
1:00
1:30
2:00
2:30
3:00
3:30
4:00
4:30
5:00
5:30
6:00
6:30
7:00
7:30
8:00
8:30
9:00
9:30
10:0
010
:30
11:0
011
:30
12:0
012
:30
13:0
013
:30
14:0
014
:30
15:0
015
:30
16:0
016
:30
17:0
017
:30
18:0
018
:30
19:0
019
:30
20:0
020
:30
21:0
021
:30
22:0
022
:30
23:0
023
:30
Tem
pera
ture
[°C
]
Pow
er o
utpu
t [kW
]
WINTER
Engine 1 [kW] Engine 2 [kW] Engine 3 [kW] Load [kW] Temperature [°C] Poly. (Temperature [°C])

- 76 - Market Analysis for Gas Engine Technology in Algeria Stéphane Michaut, 2013
FIGURE 6-12: RESPONSE TO THE LOAD - MULTI ENGINE POWER PLANT - SUMMER CASE
With the same load profile, the third engine will have to run ~8h/day during the hottest days of the year while it normally runs ~5,5h/day during tempered days due to derating.
6.3.3 Maintenance hours: role of stand-by engine When a certain load has to be guaranteed 100% of the year, most of the time an additional engine is installed so maintenance work can be done on other engines while keeping the power plant output at its guaranteed level.
This has been previously explained and studied in Part 5.3.4.2.
6.3.4 Annual revenues The very same method as in Part 5 will be used here by considering electrical gains, thermal gains, maintenance costs and oil costs on an annual basis. The only difference with the calculating method described in Part 5.2.4.3 concerns electrical gains: since we have the load profile over the day, a more accurate method can be used by accounting exact amount of kWh generated during each period (Night, Day Peak) over the year:
𝑉𝑒𝑙 = � �𝑃𝑒𝑙,𝑝𝑟𝑜𝑑𝑖 (𝑡).
𝑖𝑡=1𝑎𝑛𝐶𝑒𝑙(𝑡)𝑑𝑡
𝑉𝑒𝑙 : Annual gain on electrical bill [DA] 𝐶𝑒𝑙(𝑡) : Unitary cost of active power if bought from the grid at instant t [DA/kWh] 𝑃𝑒𝑙,𝑝𝑟𝑜𝑑𝑖 (𝑡) : Power output of engine i at instant t [kW]
-10
-5
0
5
10
15
20
25
30
35
40
45
50
0
1 000
2 000
3 000
4 000
5 000
6 0000:
000:
301:
001:
302:
002:
303:
003:
304:
004:
305:
005:
306:
006:
307:
007:
308:
008:
309:
009:
3010
:00
10:3
011
:00
11:3
012
:00
12:3
013
:00
13:3
014
:00
14:3
015
:00
15:3
016
:00
16:3
017
:00
17:3
018
:00
18:3
019
:00
19:3
020
:00
20:3
021
:00
21:3
022
:00
22:3
023
:00
23:3
0
Tem
pera
ture
[°C
]
Pow
er o
utpu
t [kW
]
SUMMER
Engine 1 [kW] Engine 2 [kW] Engine 3 [kW] Load [kW] Temperature [°C] Poly. (Temperature [°C])

Market Analysis for Gas Engine Technology in Algeria - 77 - Stéphane Michaut, 2013
6.4 Results of the analysis for the industry In part 6, a new model has been developed based on instantaneous load. In this section will be analysed the results given by this new model and the impact of the newly implemented factors on profitability. The input data used below are: Electricity rate E41, gas rate 21T, 75% reactive power consumption. Same indicators as above will be used: ROI, IRR, NPV, cost of kWh.
6.4.1 Influence of temperature on profitability The main reason for implementing an instantaneous load based model versus an annual consumption based model was to study the impact of high temperatures in Algeria on engine power output, and its financial consequences.
6.4.1.1 Without power output guaranteed In this section the following input data were used:
- Industry with 1 MW constant active power consumption - Each option with a 1063 kW engine installed in different cities across Algeria - Stable grid connection so that a lower power output of the engine than the rated 1063 kW is
possible
TABLE 6-2: INFLUENCE OF TEMPERATURE VARIATIONS ON PROFITABILITY WITHOUT POWER OUTPUT RESTRICTIONS
input data feasibility results calculated results
OPTION 1 OPTION 2 OPTION 3 OPTION 4 City Alger Setif Biskra In_Amenas Altitude 25 m 1 038 m 87 m 562 m Max temp. 40,6 °C 38,4 °C 48,0 °C 45,7 °C Engine type 1 JMS 320 C05 JMS 320 C05 JMS 320 C05 JMS 320 C05 Electrical output 1 063 kW 1 063 kW 1 063 kW 1 063 kW Thermal output 1 368 kW 1 368 kW 1 368 kW 1 368 kW Max derating 1,6% 13,7% 18,0% 20,2% % Max additional power from grid 0 83 128 152 kW % of elec. needs covered by CHP 95,00% 94,95% 94,94% 94,82% % Cost of buying missing kWh 1 015 625 1 023 224 1 027 061 1 051 532 DZD / year
ROI 5,27 5,27 5,29 5,30 years Cost of kWh 168,12 168,10 168,49 168,65 cts DZD IRR 14,6% 14,6% 14,5% 14,4% DZD Net value after 15 years 29 330 119 29 346 611 29 029 020 28 841 026 DZD
As can be seen in this table, when there is no power output level to be guaranteed and when the CHP plant is only installed for its financial benefits, the impact of having high temperatures is negligible: cost of kWh, ROI, IRR and NPV are almost the same. The maximum derating achieved is 20%, so at this particular moment the industry will have to import 20% of its energy from the grid. But this occurs less than 5% of the time! 20%*5%= less than 1% of the total energy has to be imported…
6.4.1.2 With power output guaranteed In this section the following input data were used:
- Industry with 1 MW constant active power consumption

- 78 - Market Analysis for Gas Engine Technology in Algeria Stéphane Michaut, 2013
- Unstable grid connection so that a lower power output of the engine than the needed 1 MW cannot be accepted
TABLE 6-3: INFLUENCE OF TEMPERATURE VARIATIONS ON PROFITABILITY WITH MINIMUM POWER OUTPUT RESTRICTION
OPTION 1 OPTION 2 OPTION 3 OPTION 4 City Alger Setif Biskra In_Amenas Altitude 25 m 1 038 m 87 m 562 m Max temp. 40,6 °C 38,4 °C 48,0 °C 45,7 °C Engine type 1 JMS 320 C05 JMS 416 B11 JMS 420 B11 JMS 420 B11 Electrical output 1 063 kW 1 130 kW 1 413 kW 1 413 kW Thermal output 1 368 kW 1 382 kW 1 727 kW 1 727 kW Max derating 1,6% 11,0% 18,0% 20,2% % Max additional power from grid 0 0 0 0 kW % of elec. needs covered by CHP 95,00% 95,00% 95,00% 95,00% % Cost of buying missing kWh 1 015 625 1 015 625 1 015 625 1 015 625 DZD / year
ROI 5,27 6,44 7,89 7,89 years Cost of kWh 168,12 191,46 209,38 209,35 cts DZD IRR 14,6% 10,2% 6,5% 6,5% DZD Net value after 15 years 29 330 119 13 160 973 -2 127 583 -2 103 720 DZD
While in the north of the country the CHP plant doesn’t have to be oversized (1,6% derating), the same power output requirement in the south will request a bigger engine. In in Amenas for instance, the derating will go up to 20,2% during the summer and a 1,4 MW engine will be needed in order to cover the 1 MW load. Due to higher installation and maintenance costs but equal revenues, the ROI increases of almost 3,5 years, and IRR and NPV are also strongly affected. In that case and for the project to become economically viable, grid stabilization revenues have to be added as in Part 5.3.4.
FIGURE 6-13: INFLUENCE OF DERATING - 15 YEAR REVENUE
-100 000 000 DZD
-80 000 000 DZD
-60 000 000 DZD
-40 000 000 DZD
-20 000 000 DZD
- DZD
20 000 000 DZD
40 000 000 DZD
60 000 000 DZD
80 000 000 DZD
100 000 000 DZD
0 1 2 3 4 5 6 7 8 9 10 11 12 13 14 15
15 years revenue
OPTION 1
OPTION 2
OPTION 3
OPTION 4

Market Analysis for Gas Engine Technology in Algeria - 79 - Stéphane Michaut, 2013
FIGURE 6-14: INFLUENCE OF DERATING - COST OF KWH
Conclusion: Based solely on energy gains, oversizing the plant in order to compensate engine derating is not economically interested. Value of grid stabilization, that often exceeds energy gains, has to be accounted in the annual balance in order to justify a higher investment.
6.4.2 Influence of load variation and differences between models In this section the following input data were used:
- Industry with 0,7 to 1,3 MW active power consumption, mean value 1 MW (see graph 6-12). - Engine dimensioned wether on the mean load (option 1 and 2) or on the maximum load
(case 3 and 4) - Evaluation of profitability with both methods (model based on mean annual consumption
and model based on instant load)
TABLE 6-4: COMPARISON OF BOTH MODELS
OPTION 1 OPTION 2 OPTION 3 OPTION 4 City Alger Alger Alger Alger Altitude 25 m 25 m 25 m 25 m Max temp. 40,6 °C 40,6 °C 40,6 °C 40,6 °C Engine type 1 JMS 320 JMS 320 JMS 420 JMS 420 Electrical output 1 063 kW 1 063 kW 1 413 kW 1 413 kW Thermal output 1 368 kW 1 368 kW 1 727 kW 1 727 kW Model based on Annual consumption Instant load Annual consumption Instant load Hours at full load 0 3 467 0 0 hours / year
Max derating 1,6% 1,6% 1,6% 1,6% % Max additional power from grid 0 237 0 0 kW % of elec. needs covered by CHP 95,00% 90,37% 95,00% 95,00% % Cost of buying missing kWh 1 015 625 2 201 868 1 015 625 1 050 739 DZD / year
ROI 5,27 5,45 7,87 7,29 years Cost of kWh 168,12 175,24 209,06 208,25 cts DZD IRR 14,6% 13,8% 6,6% 8,1% DZD Net value after 15 years 29 330 119 26 006 588 -1 881 655 4 805 279 DZD
Investment Investment Investment Investment
Maintenance Maintenance
Maintenance Maintenance
Overhaul @60k Overhaul @60k
Overhaul @60k Overhaul @60k Fuel gas
Fuel gas Fuel gas Fuel gas
Oil
Oil Oil Oil
Thermal energy recovered
Thermal energy recovered
Thermal energy recovered
Thermal energy recovered
excl. VAT incl. VAT
-30.00
20.00
70.00
120.00
170.00
220.00
270.00
OPTION 1 :168 cDA
OPTION 2 :191 cDA
OPTION 3 :209 cDA
OPTION 4 :209 cDA
Sonelgaz :268 cDA
Sonelgaz :289 cDA
Cost of kWh over 15 years

- 80 - Market Analysis for Gas Engine Technology in Algeria Stéphane Michaut, 2013
FIGURE 6-15: COMPARISON BETWEEN MODELS - LOAD VARIATIONS
FIGURE 6-16: COMPARISON BETWEEN MODELS - 15 YEAR REVENUE
If load variations are to be covered, this will inevitably lead to overdimensioning the engine compared to an optimal operation, and a longer ROI.
When the engine is dimensioned on mean electrical load (option 1 and 2) the ROI is better. But the real profitability calculated with model 2 will be slightly lower than the one calculated with model 1. The real amount of kWh produced by the CHP will be lower than expected with model 1 since the engine will not cover load above this mean value (see Graph 6-11). In the example above, model 1 will give a 95% coverage of electrical needs for the 1 MW engine while real value will be 90,37%. Annual gains and profitability are hence altered as can be seen in the 15 years revenue graph 6-11 above.
When the engine is dimensioned on the peak power demand (option 3 and 4), the real amount of kWh produced will be the same than calculated in model 1 but the real profitability will depend on their repartition. In the example above, the profitability is better than the one calculated with model
600
700
800
900
1 000
1 100
1 200
1 300
1 400
0:00
0:30
1:00
1:30
2:00
2:30
3:00
3:30
4:00
4:30
5:00
5:30
6:00
6:30
7:00
7:30
8:00
8:30
9:00
9:30
10:0
010
:30
11:0
011
:30
12:0
012
:30
13:0
013
:30
14:0
014
:30
15:0
015
:30
16:0
016
:30
17:0
017
:30
18:0
018
:30
19:0
019
:30
20:0
020
:30
21:0
021
:30
22:0
022
:30
23:0
023
:30
Elec
tric
al lo
ad [k
W]
Option 4 [kW] Option 2 [kW] Mean load [kW] Real load [kW]
-100 000 000 DZD
-80 000 000 DZD
-60 000 000 DZD
-40 000 000 DZD
-20 000 000 DZD
- DZD
20 000 000 DZD
40 000 000 DZD
60 000 000 DZD
80 000 000 DZD
100 000 000 DZD
0 1 2 3 4 5 6 7 8 9 10 11 12 13 14 15
15 years revenue
OPTION 1
OPTION 2
OPTION 3
OPTION 4

Market Analysis for Gas Engine Technology in Algeria - 81 - Stéphane Michaut, 2013
1 since more kWh are produced during high price hours (see load curve between 17:00-21:00 in Figure 6-11) than expected with model 1.
Conclusion: Much simpler, the first model based on annual energy consumption gives a good approximation of ROI and cost of kWh since their variation is lower than 5% compared to the ones given by the model based on instant load. However, the second model will be much more precise to evaluate the response to the load and the real long term benefits of installing a CHP plant.
6.5 Results of the analysis for the O&G sector Many oil extraction sites are totally isolated from any interconnected grid and require in the same time a very secure system of electricity supply in order to guarantee oil production. Value of having a stable power supply is no longer an economical variable but becomes the primary objective.
As previously studied in Part 5.3.4.2, the best option when it comes to securing 100% of the electrical needs is a 3 engine plant, with a unit power capacity equivalent to 50% of the load.
6.5.1 Influence of fuel input: diesel, flare gas and natural gas Most of these isolated sites are currently supplied by diesel generators, leading to high transport costs of input fuel until the platform - in Algeria, oil has to be transported up to the coast in order to be refined, and then reimported down to the oil extraction site -. This also leads to high maintenance costs - overhaul for diesel engines is after 20 000 OPH while it’s after 60 000 OPH for gas engines (see Figure 4 – 1 in Part 4.1.2) - and higher emissions (see Figure below).
FIGURE 6-17: FUEL INPUT - EMISSIONS
Flare gas - waste by-products that cannot be processed – is not only a valuable on-site energy source, but also an important factor of CO2 emissions. In order to reduce both operating costs and CO2 emissions, most of gas engine manufacturers have developed over the past decade generators that are able to operate with this flare gas.

- 82 - Market Analysis for Gas Engine Technology in Algeria Stéphane Michaut, 2013
6.5.1.1 on power output Flare gas composition is a determinant factor for gas engine correct operation. As showed in Part 6.3.1.1, heating value and methane number can strongly vary from one site to another, and some derating is usually needed. Mean value considered here will be 30% of nominal power output.
As studied in Part 6.3.1.2, temperature - most of extraction sites are located in the desert - and altitude will also impact power output of the engine.
6.5.1.2 on power plant profitability By using gas engines directly fed by the waste gases meant to be flared, the operator is rewarded by getting three sources of benefits:
- cost of importing refined diesel is avoided - cost of fuel gas is zero, since most of the time it cannot be sold or used in any other way - CO2 emission penalties are avoided. In Algeria, a law (05-07, Art 52) was voted in 2005
requiring the operator to pay a fee amounting to 8000 DZD = 80 € per 1000m³ of flared gas.
In this section the following input data were used: - Temperature and altitude of Biskra (Algerian desert) - Option 1 : brick factory with 2 MW constant need equipped with 1 x 2 MW CHP plant - Option 2 : O&G facility with 2 MW constant need, equipped with 3 x 1 MW natural gas
gensets, full power output - Option 3 : O&G facility with 2 MW constant need, equipped with 3 x 1,4 MW flare gas
gensets and 30% derating due to use of flare gas
Cost of input fuel gas used in the simulation was : o State subsidized industrial price for option 1 - 0,18DZD/Th - o Market price for option 2 - 4,25$/MMBTu = 1,24 DZD/Th - like in Part 4, price at
which gas could be sold into the market if not consumed o Cost free for option 3, since flare cannot be used in any other way
In the annual gain calculation the following was used : - 30% increase for option 2 & 3 compared to usual price in investment, maintenance, overhaul
and oil cost due to remote location - Value of diesel fuel costs avoided are accounted as follow :
𝑉𝑑𝑖𝑒𝑠𝑒𝑙 =𝐸𝑒𝑙,𝑐𝑜𝑛𝑠 ∗ 3600𝜂𝑒𝑙𝑑 ∗ 𝐿𝐻𝑉𝑑 ∗ 𝐷𝑑
∗ 𝑃𝑑
𝑉𝑑𝑖𝑒𝑠𝑒𝑙 : Value of diesel fuel that will be spared [DZD] 𝐸𝑒𝑙,𝑐𝑜𝑛𝑠 : Energy consumption of the site over the year (=2000kW*8760h) [kWh] 𝜂𝑒𝑙𝑑 : Electrical efficiency of diesel generators (=37%) [%] 𝐿𝐻𝑉𝑑 : Lower heating value of diesel (=42780 kJ/kg) [kJ/kg] 𝐷𝑑 : Density of diesel (0,839 kg/l) [kg/l] 𝑃𝑑 : Price of diesel [DZD/l] In Algeria, diesel price is normally 14 DZD/l (=0,14€/l) but for remote locations it will amount to 50 DZD/l once transported and stored. In that case, the above calculation gives an annual revenue of 237 MDZD = 2,37 M€ each year for option 2 & 3.

Market Analysis for Gas Engine Technology in Algeria - 83 - Stéphane Michaut, 2013
- Value of CO2 emission penalty avoided (only for option 3) are accounted as follow :
𝑉𝐶𝑂2 =𝐸𝑒𝑙,𝑐𝑜𝑛𝑠
𝜂𝑒𝑙𝑔 ∗ 𝐿𝐻𝑉𝑔
∗ 𝑃𝐶𝑂2
𝑉𝐶𝑂2 : Value of CO2 emission that will be avoided [DZD] 𝐸𝑒𝑙,𝑐𝑜𝑛𝑠 : Energy consumption of the site over the year (=2000kW*8760h) [kWh] 𝜂𝑒𝑙𝑔 : Electrical efficiency of gas generators (=39%) [%] 𝐿𝐻𝑉𝑔 : Lower heating value of gas (=9,5 kWh/Nm3) [kWh/Nm3] 𝑃𝐶𝑂2 : Price of CO2 emission penalty (8000 DZD / 1000 Nm3 flared) [DZD/Nm3] By not using the flare, the facility will avoid an annual penalty of 36,5 MDZD = 365 k€ / year.
TABLE 6-5: FUEL INPUT - COMPARED PROFITABILITY
OPTION 1 OPTION 2 OPTION 3 City Biskra Biskra Biskra Altitude 87 m 87 m 87 m Max temp. 48,0 °C 48,0 °C 48,0 °C Application Industry, CHP
(ex. brick factory) O&G facility, nat. gas
(ex. compression station) O&G facility, flare gas
(ex. oil well) Grid connection Yes No No Engine 1 JMS 612 F111 JMS 320 C05 JMS 420 B11 Engine 2 None JMS 320 C05 JMS 420 B11 Engine 3 None JMS 320 C05 JMS 420 B11 Total power installed 2 000 kW 3 189 kW 4 239 kW Derating during normal operation 0,0% 0,0% 30,0% % Max derating during hot days 18,0% 17,7% 48,0% % Max additional power from grid 359 0 0 kW % of elec. needs covered by CHP 94,8% 100,0% 100,0% %
ROI 3,94 1,37 1,15 years Cost of kWh 150,69 508,29 280,54 cts DZD IRR 21,8% 72,6% 86,8% DZD Net value after 15 years 937 605 13 158 028 20 036 586 DZD
The result of the analysis is shown in the table above and the graphs below. While the cost of kWh is very high for option 2 due to high fuel input costs, it goes down to the same price level than Sonelgaz’ tariffs when it comes to using flare gas, even with an overdimensioned plant due to remote location and use of flare gas. Lowest cost of kWh is still reached within the industry thanks to the subsidized gas price.
In terms of profitability, the ROI almost gets down to 1 year for O&G application. Savings due to replacement of diesel supply costs are extremely important and savings on CO2 emissions are substantial. This leads to a 15-year revenue level far from the industrial one: while a 2 MW CHP application in the industry will generate a revenue around 2 M€, a 2 MW flare gas project will generate more than 30 M€ !

- 84 - Market Analysis for Gas Engine Technology in Algeria Stéphane Michaut, 2013
FIGURE 6-18: FUEL INPUT - COST OF KWH
FIGURE 6-19: FUEL INPUT – 15 YEAR REVENUE
6.5.2 Influence of load variations on profitability As seen in Part 6.4.2, load variations normally impact the ROI and the cost of kWh because it changes the design of the plant (necessary overdimensioning compared to a constant power need). For O&G applications, it is easy to see in Figure 6-15 that initial investment has a marginal influence on both ROI and 15 year revenue… The plant must thus be dimensioned in order to cover the load at any time, whatever the price is.
Investment Investment Investment Maintenance
Maintenance
Maintenance
Overhaul @60k
Overhaul @60k
Overhaul @60k
Fuel gas
Fuel gas
Oil
Oil
Oil
Thermal energy recovered
excl. VAT incl. VAT
-50.00
50.00
150.00
250.00
350.00
450.00
550.00
OPTION 1 :151 cDA
OPTION 2 :508 cDA
OPTION 3 :281 cDA
Sonelgaz :266 cDA
Sonelgaz :286 cDA
Cost of kWh
-5 000 000 €
0 €
5 000 000 €
10 000 000 €
15 000 000 €
20 000 000 €
25 000 000 €
30 000 000 €
35 000 000 €
0 1 2 3 4 5 6 7 8 9 10 11 12 13 14
15 year revenue
OPTION 1
OPTION 2
OPTION 3

Market Analysis for Gas Engine Technology in Algeria - 85 - Stéphane Michaut, 2013
6.5.3 Study case: Waha flare gas project, Tunisia Waha is located in a remote area in the southern desert of Tunisia. In 2009, the state owned company ETAP and the US-based company Pioneer jointly developed the first associated petroleum gas (APG) project in this country. They entrusted Clarke Energy to substitute the 5 diesel engines providing electricity for the surrounding facilities by 3 GE Jenbacher gas engines – 2 in operation, 1 on standby – directly fed by the on-site existing flare, without any pre-treatment.
The containerized solution was especially designed to support extreme ambient environmental conditions, resisting to 180km/h sandstorms and temperatures up to 55°C.
The utilization of the gas for power generation, as opposed to flaring, helped the operator to reduce its carbon emissions of 2574 tons/year and increase the economical and environmental value of the project, ensuring meanwhile 100% of total electrical site needs.
Conclusion: Extreme temperatures in North Africa and diversity of fuel gases used for internal combustion are strongly affecting the power output of gas engines. In order to meet the needed site load at each time, a more precise model had to be developed.
In Tunisian and Algerian O&G sector, operators can develop high value projects by replacing the diesel based power supply by, when feasible, flare gas based power plants. In these projects, initial investment is negligible compared to both economical and environmental benefits it will bring.
Flare gas projects will thus play an important role in the development of gas engine market in Algeria. However, the major challenge will not be in identifying these potential projects or in designing the plants, but will rather consist in overcoming Sonatrach bureaucracy and long lasting decision making process…
FIGURE 6-20: WAHA SITE LOCATION
FIGURE 6-21: WAHA SITE DESIGN AND REALISATION

- 86 - Market Analysis for Gas Engine Technology in Algeria Stéphane Michaut, 2013
7. Conclusions 7.1 Drivers and inhibitors
TABLE 7-1: ALGERIAN GAS ENGINE MARKET - DRIVERS AND INHIBITORS
Political Economic
Driv
er
Gas plentiful & cheap - government wants gas based power plants Gas and oil are subsidised by the Algerian Government therefore price is low
Government recognises steam turbines are not sufficient to meet electricity supply needs Development plan $265B investment (2010-14) Monopoly of Sonelgaz on electricity prdn has been removed, Electricity demand growing at 5.2% per year Politicians do not want gas flaring - legally prohibited 2012 will be taxed/penalised
Gas flaring accumulates a charge - reinjection of gas required
Politicians have set goal to increase renewable energy supply by 2020 High economic potential, moderate economic growth
Inhi
bito
r
Currently working towards democracy ROI for gas engine power plants is lower than Tunisia Political leadership succession uncertainty is risk to domestic stability
Cost of electricity is low, therefore customer is capital cost sensitive
Politicians have set goal to increase renewable energy supply by 2020
Import duty significant 24% tax - 5% relief (17-18% tax)
High level corruption and bureaucracy restrict business Value of goods traded in Dinars cannot accumulate profit
Protectionist economic policies Commodity price sensitive Purchasing electriciy produced by independent entities this is not legally enforced.
IPP' only for own use not for export/sale to Songelgaz's grid
Economy vulnerable to boom-bust cycles Algeria underperforming MENA peers
Social Legal
Driv
er Growing demand for domestic electricity
There is now the legal right to export electricity to the grid
Large young workforce pool Anti gas-flaring regulations are in place and enforced via additional taxation
Population growth far exceeds food production
Inhi
b. Chronic socioeconomic problems especially housing, infrastructure
Purchase of IPP-produced electricity by Sonelgaz is not legally enforced
Security concerns Judiciary is not independent from the government Country wealth is not reflected in the general population Domestic electricity and gas underpriced due to subsidy
Technological Environmental
Driv
er
Serious electricity grid supply problems (shortages, power shedding, microshutdowns) Gas flaring prevalent - 10% of total available is flared Well developed natural gas supply network (Sonelgaz) 3GW renewable energy installation goal by 2020 Additional gas availability will come from flare, shale & reinjected gas Domestic gas supply potential meets internal needs to 2020
Inhi
b.
End of easy hydrocarbons No financial subsidies for renewable gas Government currently plans to increase renewables via solar and wind not renewable gas True IPP has stopped completely, Sonelgaz have moved back from IPP 90% of flare gas is currently reinjected into the gas well
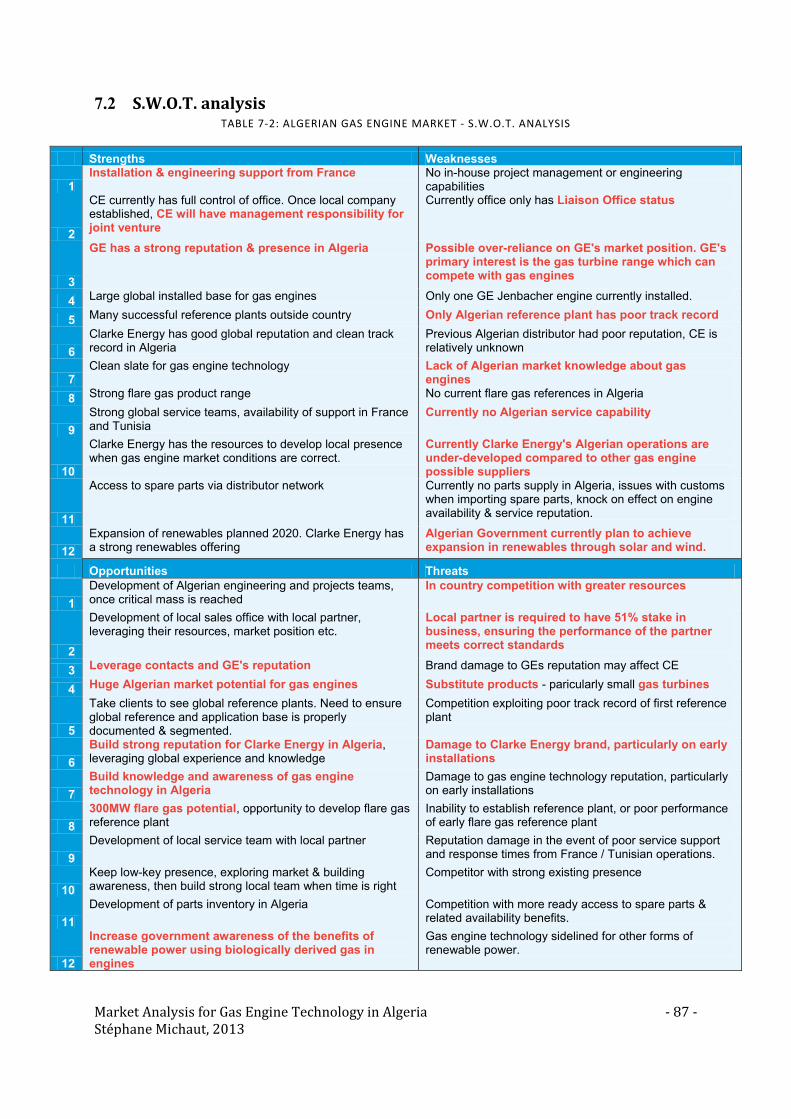
Market Analysis for Gas Engine Technology in Algeria - 87 - Stéphane Michaut, 2013
7.2 S.W.O.T. analysis TABLE 7-2: ALGERIAN GAS ENGINE MARKET - S.W.O.T. ANALYSIS
Strengths Weaknesses
1 Installation & engineering support from France No in-house project management or engineering
capabilities
2
CE currently has full control of office. Once local company established, CE will have management responsibility for joint venture
Currently office only has Liaison Office status
3
GE has a strong reputation & presence in Algeria Possible over-reliance on GE's market position. GE's primary interest is the gas turbine range which can compete with gas engines
4 Large global installed base for gas engines Only one GE Jenbacher engine currently installed.
5 Many successful reference plants outside country Only Algerian reference plant has poor track record
6 Clarke Energy has good global reputation and clean track record in Algeria
Previous Algerian distributor had poor reputation, CE is relatively unknown
7 Clean slate for gas engine technology Lack of Algerian market knowledge about gas
engines 8 Strong flare gas product range No current flare gas references in Algeria
9 Strong global service teams, availability of support in France and Tunisia
Currently no Algerian service capability
10
Clarke Energy has the resources to develop local presence when gas engine market conditions are correct.
Currently Clarke Energy's Algerian operations are under-developed compared to other gas engine possible suppliers
11
Access to spare parts via distributor network Currently no parts supply in Algeria, issues with customs when importing spare parts, knock on effect on engine availability & service reputation.
12 Expansion of renewables planned 2020. Clarke Energy has a strong renewables offering
Algerian Government currently plan to achieve expansion in renewables through solar and wind.
Opportunities Threats
1 Development of Algerian engineering and projects teams, once critical mass is reached
In country competition with greater resources
2
Development of local sales office with local partner, leveraging their resources, market position etc.
Local partner is required to have 51% stake in business, ensuring the performance of the partner meets correct standards
3 Leverage contacts and GE's reputation Brand damage to GEs reputation may affect CE
4 Huge Algerian market potential for gas engines Substitute products - paricularly small gas turbines
5
Take clients to see global reference plants. Need to ensure global reference and application base is properly documented & segmented.
Competition exploiting poor track record of first reference plant
6 Build strong reputation for Clarke Energy in Algeria, leveraging global experience and knowledge
Damage to Clarke Energy brand, particularly on early installations
7 Build knowledge and awareness of gas engine technology in Algeria
Damage to gas engine technology reputation, particularly on early installations
8 300MW flare gas potential, opportunity to develop flare gas reference plant
Inability to establish reference plant, or poor performance of early flare gas reference plant
9 Development of local service team with local partner Reputation damage in the event of poor service support
and response times from France / Tunisian operations.
10 Keep low-key presence, exploring market & building awareness, then build strong local team when time is right
Competitor with strong existing presence
11 Development of parts inventory in Algeria Competition with more ready access to spare parts &
related availability benefits.
12
Increase government awareness of the benefits of renewable power using biologically derived gas in engines
Gas engine technology sidelined for other forms of renewable power.

- 88 - Market Analysis for Gas Engine Technology in Algeria Stéphane Michaut, 2013
7.3 Discussion Algeria is a land of opportunity. In addition to being the most stable country economically and politically in the Northern African region, it also has the greater natural resources and the potential to become a regional power exporter. Driven by a terrible increase in internal demand of electricity, it needs to develop both in the short and medium term all power segment sizes: fossil fueled centralized power plants (8.4 GW combined cycles planned for 2017), small size decentralized power plants (diesel, gas turbines, gas engines) and renewables (solar and wind, 22 GW planned for 2030).
Algeria reached the “oil peak” during the past decade and is starting to face the end of easy hydrocarbons, while the growing demand is kept underpriced. In order to secure economical sustainability and in absence of strong localized manufacturing industries, Algeria – whose economy entirely relies on oil and gas export revenues – thus needs to preserve its resources by adopting more efficient ways of using its gas reserves.
For remote and small size power plants (< 25 MW), gas engines showed to have the potential of meeting this requirement. By being more adapted to high temperature conditions and more flexible, this scalable solution can produce the same power output with a better efficiency and a lower cost. The potential for this market segment represents 300 MW by 2017, but will face important entry barriers as Sonelgaz’ bureaucracy and reluctance to technological change have first to be overcome.
Within the industry, CHP plants ranging from 1 MW to 4 MW also represent great potential for gas engine development, in a shorter term. Lack of knowledge of the product, inexisting and/or unapplied legislative framework coupled with subsidized energy prices partly explain why the market hasn’t taken off yet. But in the ceramic industry where the kWh produced by gas engines is around 35% cheaper than the average cost of the electricity taken from the grid and the ROI is around 3.5 years, the gas engine market will be leveraged by the worsening grid instability and the proactive door to door strategy lead by Clarke Energy. This market segment represents up to 450 MW by 2017 and shall fully take off once adequate feed-in tariffs are applied.
Finally, the O&G sector also showed great potential for gas engine development in a country where 9% of associated petroleum gas is still being flared. For this market segment the potential would be at least 300 MW of efficient power generation preserving natural gas resources and reducing Algerian CO₂ emissions by 1.43x10⁶ tons. For this market to become an opportunity for gas engines development, huge efforts will be needed to raise institutions’ awareness and overcome Sonatrach slow decision making process.
As a conclusion, Algerian potential towards gas engine development is one of the highest among developing countries and certainly the most unexplored yet. Clarke Energy’s decision to invest and investigate the country’s potential is justified by the 1000 MW+ this study identified. Being a precursor in the region, Clarke Energy will have to overcome many barriers before the gas engine market could expand in Algeria. But its focus on a single product and its worldwide experience in developing and delivering turnkey projects across new territories will be key factor to success. Clarke Energy’s ability to deliver best in-class service, coupled with the in-country historical presence of GE and the capacity of its Jenbacher division to remain world leader gas engine manufacturer will together form the three pillars of a successful trio that is used to team up for growth.

Market Analysis for Gas Engine Technology in Algeria - 89 - Stéphane Michaut, 2013
Bibliography General Electric internal data Clarke Energy internal data Algerian Law n°02-01 of February 2002, the 5th related to electricity and gas distribution Algerian Law n°04-92 of March 2004, the 25th Executive decree n°36 of April 2007 on declaration/authorization procedures regarding power plants Executive decree n°24 of April 2006, the 16th Executive decree n°06-429 of November 2006, the 26th Sonelgaz newsletter n°17, 18 and 19 Sonelgaz Yearly Report 2011 Sonatrach Yearly Report 2011 Ministry of Energy and Mines, Renewable Energy and Energy Efficiency Program Ministry of Energy and Mines, Bilan Energetique National 2010 AWO Branchenreport 2008, Energy Sector in Algeria CREG, Programme indicative des besoins en moyens de production d’électricité 2010 2019 APRUE, Consommation énergétique finale 2007 APRUE, Programme Top Industries BP Statistical review of World Energy, June 2012 OPEC Annual Statistical, Bulletin 2012 Federal Energy Regulatory Commission, 2012 report CIA World Factbook , Index Munndi, 01 janvier 2011 Les fonds souverains, 22 juin 2011 GGFR Program, World Bank, October 2011 Brochure International Energy Agency statistics US Energy Information Administration statistics Ernst & Young 2012 statistics