Embed Size (px)
Citation preview
BARNETT HOUSE
DEPARTMENT OF SOCIAL POLICY AND SOCIAL WORK
BA
RN
ETT
PAPE
RS
IN
SOC
IAL
RES
EAR
CH
Mark Tomlinson Robert Walker Glenn Williams Measuring Poverty in Britain as a Multi-Dimensional Concept, 1991 to 2003 2007/6

Editor:
Dr Martin Seeleib-Kaiser Department of Social Policy and Social Work University of Oxford Barnett House 32 Wellington Square Oxford OX1 2ER [email protected]
Abstract: While poverty is widely accepted to be an inherently multi-dimensional concept, it has proved very difficult to develop measures that both capture this multi-dimensionality and facilitate comparison of trends over time. Structural Equation Modelling appears to offer a solution to this conundrum and is used to exploit the British Household Panel Study to create a multidimensional measure of poverty. The analysis reveals that the decline in poverty in Britain between 1991 and 2003 was driven by falls in material deprivation, but more especially by reduced financial stress particularly during the early 1990s. The limitations and potential of the new approach are critically discussed.
M. Tomlinson, R. Walker and G. Williams, Measuring Poverty in Britain as a Multi-Dimensional Concept
1
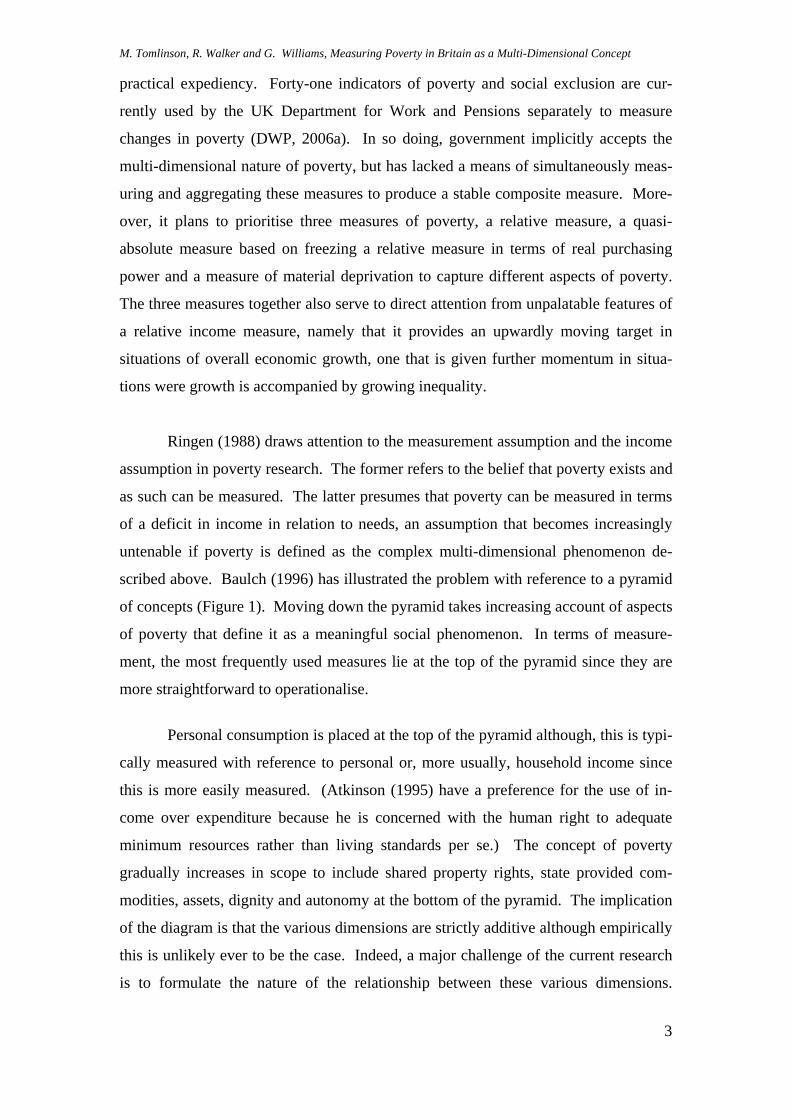
1. Poverty as a multidimensional concept
Poverty is a complex and multi-dimensional phenomenon that, in Europe at
least, is normally defined relative to the living standards of the society in which it is
found. Following Henry Mayhew (1851) and Charles Booth (1892), Seebohm Rown-
tree (1901) grappled with the complexity, distinguishing between different categories
of poverty and noting the need to take account of social conditions, diet and health as
well is income in assessing living standards. Much later Peter Townsend (1979) ar-
gued that poverty was not the lack of income necessary to purchase a basket of goods
but rather the lack of resources to participate fully in society that resulted, through a
process he termed ‘structuration’, from a variety of resource allocation systems oper-
ating in society. The measures created by Townsend have since been critically as-
sessed, developed and refined by scholars such as Piachaud (1981), Mack and Lansley
(1985), and Gordon et al. (2000). Increasingly priority is being given to material dep-
rivation and to environmental aspects of people’s lives over shortfalls in income (Cal-
lan et al. 1993, Nolan and Whelan 1996, Layte et al 2001). For Ringen (1988), in-
come is merely an indirect measure of poverty that is truly experienced as the un-
avoidable low consumption that denies people access to a normal way of life.
Townsend’s (1979, p.88) conception of poverty was inherently relative in that
participation refers to engagement in ‘the activities, customs and diets commonly ap-
proved by society’. While Townsend (with Brian Abel-Smith, 1965) had earlier
popularized the notion of relative, as opposed to absolute, poverty, he was not the first
to make this distinction. Adam Smith noted, for example, that:
A linen shirt […] is, strictly speaking, not a necessary of life. The Greeks and Romans lived, I suppose, very comfortably, though they had no linen. But in the present times, through the greater part of Europe, a creditable day-labourer would be ashamed to appear in public without a linen shirt, the want of which would be supposed to denote that disgraceful degree of poverty which, it is presumed, nobody can well fall into, without extreme bad conduct. (Smith, 1776, Book 5, Chapter 2)
It is also apparent, from this quotation, that Smith saw shame and stigma as being in-
herent components of poverty, aspects that still loom large in the experience of poor
people in Britain today (Lister, 2004; WBG, 2005). Indeed, Sen (1999) argues that
the shame that results from poor people being unable to realise basic capabilities con-
M. Tomlinson, R. Walker and G. Williams, Measuring Poverty in Britain as a Multi-Dimensional Concept
2
sistent with the society in which they live is universal and absolute, manifest in all
societies irrespective of the level of economic development.
The increasing availability of data, and most notably the creation of extensive
longitudinal datasets, has focussed attention on poverty dynamics and the analysis of
the length and frequency of spells and added to an understanding of the complexity of
the phenomenon (Walker with Ashworth, 1994; Jenkins and Rigg, 2001; Rigg and
Sefton, 2006; Maggio, 2004; Fouarge and Layte, 2005; Layte and Whelan, 2003;
Whelan et al., 2002). Dynamic analyses have demonstrated that poverty is much
more widespread than indicated by cross-sectional statistics, that transient, recurrent
and permanent poverty may differ in kind and in their effects and that the risk events
associated with poverty are more prevalent than spells of actual poverty. This sug-
gests that social structures and individual agency may protect some people against the
onset of poverty. Hobfoll (1998) has argued, drawing on the Conservation of Re-
sources (COR) theory of psycho-social stress, that people with greater resources (de-
fined in terms of social support, financial means, material goods, psychological resil-
ience) will be less vulnerable when such resources are threatened or lost while, con-
versely, others with few resources may get caught in cumulative spirals of resource
loss, a phenomenon already documented in qualitative research (Walker and Collins,
2003; Kempson, 1996).
Certain social and psychological supports that protect people against poverty
can be eroded should poverty occur, adding further momentum to downward spirals
of insecurity. Good physical and mental health, social capital and competence and
civic engagement are all casualties of poverty and may, in certain circumstances, be
compounded when mediated by the negative characteristics of poor places such as
dilapidated infrastructure, isolation, crime and red-lining.
Poverty, of course, has a political dimension. Indeed, Piachaud (1987) among
others argues that poverty is inherently political since it carries the imperative to re-
spond to eradicate it. After a long period of neglect in Britain, poverty has moved to
the political centre-stage since New Labour took office in 1997. Most notable was the
1999 commitment to eradicate child poverty (Blair, 1999), a political objective that
has now been accepted by the Conservative opposition (Callan et al., 2006). Political
definitions of poverty, while influenced by academic research, are also affected by
M. Tomlinson, R. Walker and G. Williams, Measuring Poverty in Britain as a Multi-Dimensional Concept
3
practical expediency. Forty-one indicators of poverty and social exclusion are cur-
rently used by the UK Department for Work and Pensions separately to measure
changes in poverty (DWP, 2006a). In so doing, government implicitly accepts the
multi-dimensional nature of poverty, but has lacked a means of simultaneously meas-
uring and aggregating these measures to produce a stable composite measure. More-
over, it plans to prioritise three measures of poverty, a relative measure, a quasi-
absolute measure based on freezing a relative measure in terms of real purchasing
power and a measure of material deprivation to capture different aspects of poverty.
The three measures together also serve to direct attention from unpalatable features of
a relative income measure, namely that it provides an upwardly moving target in
situations of overall economic growth, one that is given further momentum in situa-
tions were growth is accompanied by growing inequality.
Ringen (1988) draws attention to the measurement assumption and the income
assumption in poverty research. The former refers to the belief that poverty exists and
as such can be measured. The latter presumes that poverty can be measured in terms
of a deficit in income in relation to needs, an assumption that becomes increasingly
untenable if poverty is defined as the complex multi-dimensional phenomenon de-
scribed above. Baulch (1996) has illustrated the problem with reference to a pyramid
of concepts (Figure 1). Moving down the pyramid takes increasing account of aspects
of poverty that define it as a meaningful social phenomenon. In terms of measure-
ment, the most frequently used measures lie at the top of the pyramid since they are
more straightforward to operationalise.
Personal consumption is placed at the top of the pyramid although, this is typi-
cally measured with reference to personal or, more usually, household income since
this is more easily measured. (Atkinson (1995) have a preference for the use of in-
come over expenditure because he is concerned with the human right to adequate
minimum resources rather than living standards per se.) The concept of poverty
gradually increases in scope to include shared property rights, state provided com-
modities, assets, dignity and autonomy at the bottom of the pyramid. The implication
of the diagram is that the various dimensions are strictly additive although empirically
this is unlikely ever to be the case. Indeed, a major challenge of the current research
is to formulate the nature of the relationship between these various dimensions.

M. Tomlinson, R. Walker and G. Williams, Measuring Poverty in Britain as a Multi-Dimensional Concept
4
Moreover, it is probable that the dimensions lie in a causative sequence which will
require specification.
PC
PC + SPR
PC + SPR + SPC
PC + SPR + SPC + Assets
PC + SPR + SPC + Assets + Dignity
PC+SPR+SPC+Assets+Dignity+Autonomy
Personal Consump-
Shared Property Rights (Resources)State P
C
tion
rovided ommodities
Source: Baulch (1996)
Figure 1. Baulch’s Pyramid
In summary, while it is widely appreciated that poverty is an inherently multi-
dimensional concept, this multi-dimensionality has been lost, weakened or distorted
when poverty is measured. This has not just been the result of political expediency
but the absence of any method by which the holistic nature of poverty can be captured
in a way that facilitates measurement over time. The partial measures used to date
necessarily fail adequately to do justice to the experience of poor people and, to the
extent that they distort through omission, may result in implementation of inappropri-
ate policies. What is required is the use of statistical techniques that represent the di-
mensionality of the concept in a stable fashion, an approach that will ultimately re-
quire access to comprehensive datasets with reliable measures. Below we outline an
initial attempt to create a comprehensive poverty index for Great Britain using a novel
statistical technique that has rarely been used in poverty studies. Some exceptions
that we know of are Layte et al. (2000), Kuklys (2004), Haase and Pratschke (2005)
and MSD (2002). Also other related techniques have been used: for example, latent

M. Tomlinson, R. Walker and G. Williams, Measuring Poverty in Britain as a Multi-Dimensional Concept
5
class analysis - Whelan and Maitre (2005, 2007a, 2007b), and Dewilde (2004); and
item response theory - Jenkins and Cappellari (2007).
2. A new approach to measurement
In much previous quantitative research on poverty the data reduction tech-
nique of factor analysis has been used (see, for example, Calandrino, 2003, and the
review by Haase and Pratschke, 2005). Simply put, this technique usually takes as
input a large number of indicator variables and creates a smaller number of dimen-
sions or ‘factors’ by examining the correlations between variables. These factors rep-
resent a simpler description of the data and usually can be readily interpreted by ob-
serving which variables cluster together to form the dimensions. So, for example, in
poverty research material deprivation scales have been created by using factor analy-
sis on sets of items that households possess and indices developed by examining
which types of item cluster together on which particular factor (for example, Calan-
drino, 2003). These dimensions are usually forced to be orthogonal (independent)
although this does not have to be the case.
There are some problems with this methodology. We deal with three here.
First, composite indicators created using factor analysis – which are essentially
weighted summations of individual variables – are sensitive to errors in measurement
of the original variables. This gets amplified when the original variables are used to
create the factor scores and is further compounded when the factor solutions are used
across several years (see Loehlin, 1992). Such measures cannot be meaningfully
compared over time with the result that trends in the various dimensions of poverty
cannot be securely established.
Secondly, the factors often have to be rotated to allow a useful interpretation.
That is, the original solution has to be operated on in such a way as to ease elucidation
of the results or to fit with some theoretical framework. As a result of these rotations,
factors are not necessarily comparable over time or space (Haase and Pratschke,
2005).
M. Tomlinson, R. Walker and G. Williams, Measuring Poverty in Britain as a Multi-Dimensional Concept
6
Thirdly, factor analysis is essentially an exploratory technique. No strong
theoretical justification is required in deciding which variables to include or exclude
from the analysis and the researcher has little control over how the variables form the
resulting factors.
A structural equation model (SEM) has the potential to overcome some of
these problems. Like factor analysis, a SEM reduces a large number of variables to a
smaller number of factors. However, the variables are conceptualised as observed
manifestations of underlying or latent concepts. Each observed variable in a SEM
also has an error term associated with it, allowing measurement error to be isolated
and controlled for in a way that is impossible with factor analysis. But, most impor-
tantly, a SEM requires a strong theoretical justification before the model is specified.
Thus the researcher decides which observed variables are to be associated with which
latent unobserved factors in advance. This avoids the problems of instability and ro-
tated solutions prevalent in factor analysis. Not many poverty studies have used these
techniques.
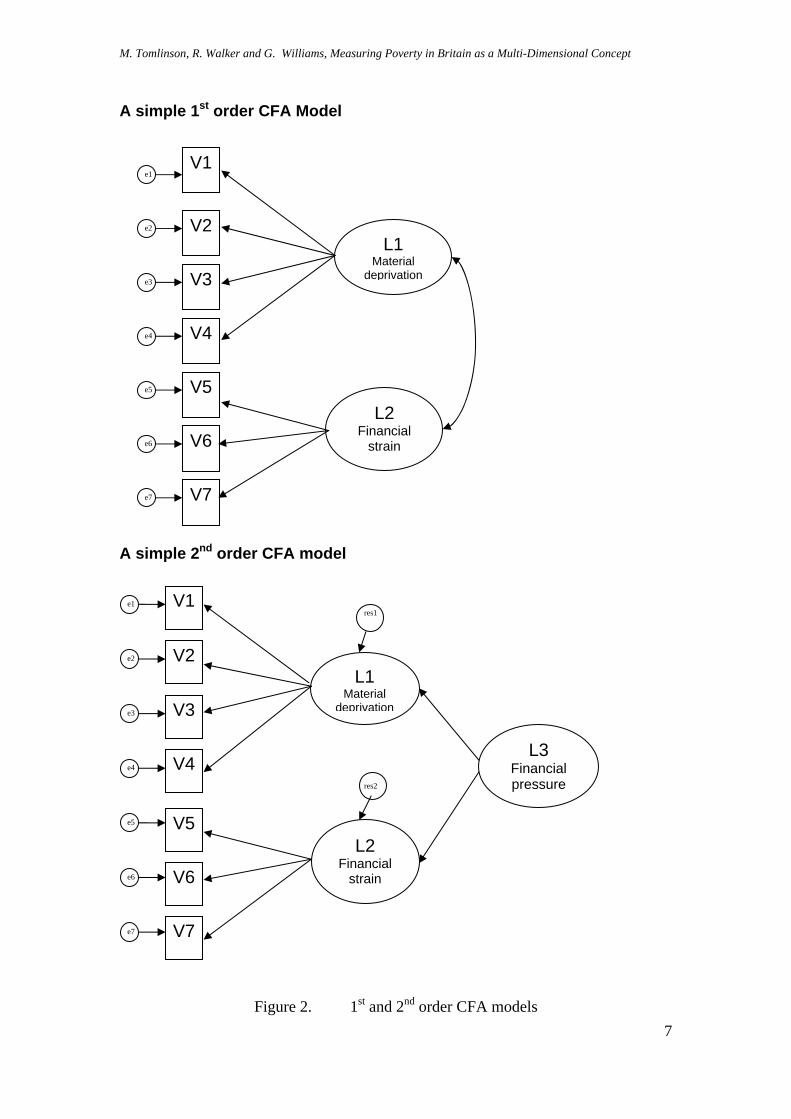
There are two fundamental types of SEM used to measure or test the validity
of latent concepts – first and second order confirmatory factor analysis models
(CFAs)1. A first order CFA simply attempts to measure underlying latent concepts.
The left side of figure 2 shows a simple CFA which has two latent unobserved vari-
ables: L1, material deprivation; and L2, financial strain. L1 is measured by the ob-
served variables V1 to V4 and L2 is measured by variables V5 to V7. The single
headed arrows represent coefficients or loadings in the model and are usually shown
in standardised form much like beta coefficients in regression analysis2. The covari-
ance between material deprivation (L1) and financial strain (L2) is represented by the
double headed arrow. The associated error terms are shown as the circles labelled e1
to e7. Using statistical techniques such as maximum likelihood and making assump-
tions about the distributions of the variables and error terms in the model, the coeffi-
cients and covariances can be estimated. In all SEMs a variety of fit statistics is avail-
able to assess the validity of the models constructed (see Klein, 2005, Byrne, 2001).
Usually it is assumed that the observed variables in the model are continuous and that
1 Although there are several further extensions to these, we will not go into them here. 2 The arrows in this instance should not be interpreted as implying any kind of causality. Extensions of these models (known as full structural models) can be used to test causal linkages between variables and concepts.
M. Tomlinson, R. Walker and G. Williams, Measuring Poverty in Britain as a Multi-Dimensional Concept
7
A simple 1st order CFA Model
V1
V2
V3
V4
L1 Material
deprivation
V5
V6
V7
L2 Financial
strain
e1
e2
e6
e3
e5
e4
e7
A simple 2nd order CFA model
V1
V2
V3
V4
L1 Material
deprivation
V5
V6
V7
L2 Financial
strain
L3 Financial pressure
e1
e2
e6
e3
e5
e4
e7
res2
res1
Figure 2. 1st and 2nd order CFA models
M. Tomlinson, R. Walker and G. Williams, Measuring Poverty in Britain as a Multi-Dimensional Concept
8
the distribution of the variables is multivariate normal. However, many studies treat
categorical variables as continuous in SEM analyses (see Byrne, 2001: 70-72, for a
discussion of these issues). More recently available software is beginning to allow the
explicit modelling of categorical, binary and censored variables (such as MPlus).
This basic model can be taken a stage further – a second order CFA, as shown
on the right of Figure 2 where another latent variable L3 is used to capture a latent
concept, financial pressure, theorised to relate simultaneously to both L1 and L2. It
will be noted that L1 and L2 now have residuals associated with them (res1 and res2).
Models of this kind can be made as complex as necessary to describe real-world situa-
tions and employ many latent variables and various interactions between them. Fur-
thermore, in both types of model, scores can be generated for the unobserved latent
variables. These scores are analogous to the factor scores obtained using factor analy-
sis, but without the limitations previously discussed. It is this higher order CFA ap-
proach that we attempt below3.
To summarise the advantages of this approach:
• Unlike standard factor analysis the researcher determines the underlying fac-
tors or latent constructs and their observed manifestations
• It allows modelling along strong theoretically based lines
• Complex relationships can be specified between these theoretical constructs
• It allows estimates of the unobserved variables to be calculated
3. Defining the measurement models
The analysis utilizes data from the British Household Panel Study (BHPS).
The BHPS commenced in 1991 with an initial sample of around 10,000 individuals
resident in some 5,000 households. These individuals have subsequently been re-
interviewed each year and the sample has also been extended to include more house-
holds from Scotland and Wales and to embrace Northern Ireland. While the data can
3 The SEM here is termed a measurement model. Extensions of these models (known as full structural models) can be used to test causal linkages between variables and concepts.
M. Tomlinson, R. Walker and G. Williams, Measuring Poverty in Britain as a Multi-Dimensional Concept
9
be weighted to provide an accurate picture of life in Great Britain or the United King-
dom at different points in time, this analysis is restricted to Great Britain to facilitate
measurement of trends. The analysis covers the period 1991 to 2003 (i.e. BHPS
waves 1 to 13) and draws on information concerning the following topics: income,
finances and benefits; stress; material deprivation; general housing and neighbour-
hood characteristics and social exclusion and civic participation. Individuals under 18
years of age are excluded from the sample analysed (although the relationship be-
tween adult and child poverty is explored in Tomlinson et al. [2007]).
While the BHPS is widely used in poverty research (for example, Jenkins and
Rigg, 2001, Ermisch et al., 2001, Jenkins and Cappallari, 2007), there are number of
shortcomings the most important of which is that the data are not always consistent or
collected for all waves. For example, the civic participation and social isolation vari-
ables are only available for alternative waves, while the housing and neighbourhood
variables used are only included from wave 6 onwards. Similarly, the material depri-
vation variables, which were limited at the beginning of the survey, were significantly
augmented from wave 6. Thus we are forced to limit our analysis to odd years 1991,
1993, 1995 etc. and to divide our analysis into two parts. The first employs a rela-
tively simple model to exploit data for the full period 1991 to 2003, while the second
uses a more comprehensive model that takes advantage of the better data available
from wave 6 onwards. The latter model conveniently coincides with the first eight
years of the Blair government (1997, 1999, 2001 and 2003).
Finally, as with any secondary analysis, the analyst is constrained by the vari-
ables included in the dataset. Almost inevitably key variables are omitted while the
variables available constitute only imprecise indices of the concepts of interest.
Model 1 covering the period 1991 to 2003
As noted above, the creation of a structural equation model usually relies on
some strong theoretical orientation that is specified in advance. Unlike factor analysis
we cannot just enter all the variables and see what will happen. We have to decide in
advance on the latent concepts (factors) that characterise poverty, and specify which
of the variables we observe are associated with which factors. In our case, rather than
a strong theory, we have a pyramid-like framework of concepts (Figure 1) that the lit-
erature suggests may be manifestations or inherent outcomes of the experience of be-
M. Tomlinson, R. Walker and G. Williams, Measuring Poverty in Britain as a Multi-Dimensional Concept
10
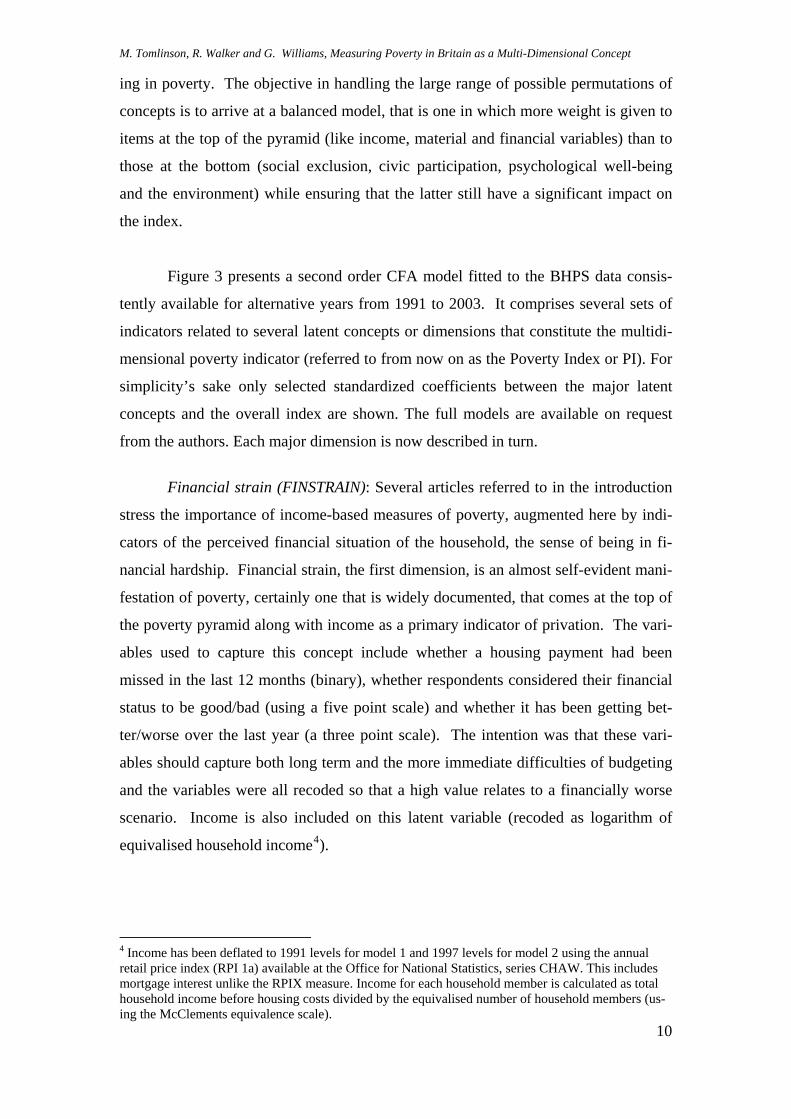
ing in poverty. The objective in handling the large range of possible permutations of
concepts is to arrive at a balanced model, that is one in which more weight is given to
items at the top of the pyramid (like income, material and financial variables) than to
those at the bottom (social exclusion, civic participation, psychological well-being
and the environment) while ensuring that the latter still have a significant impact on
the index.
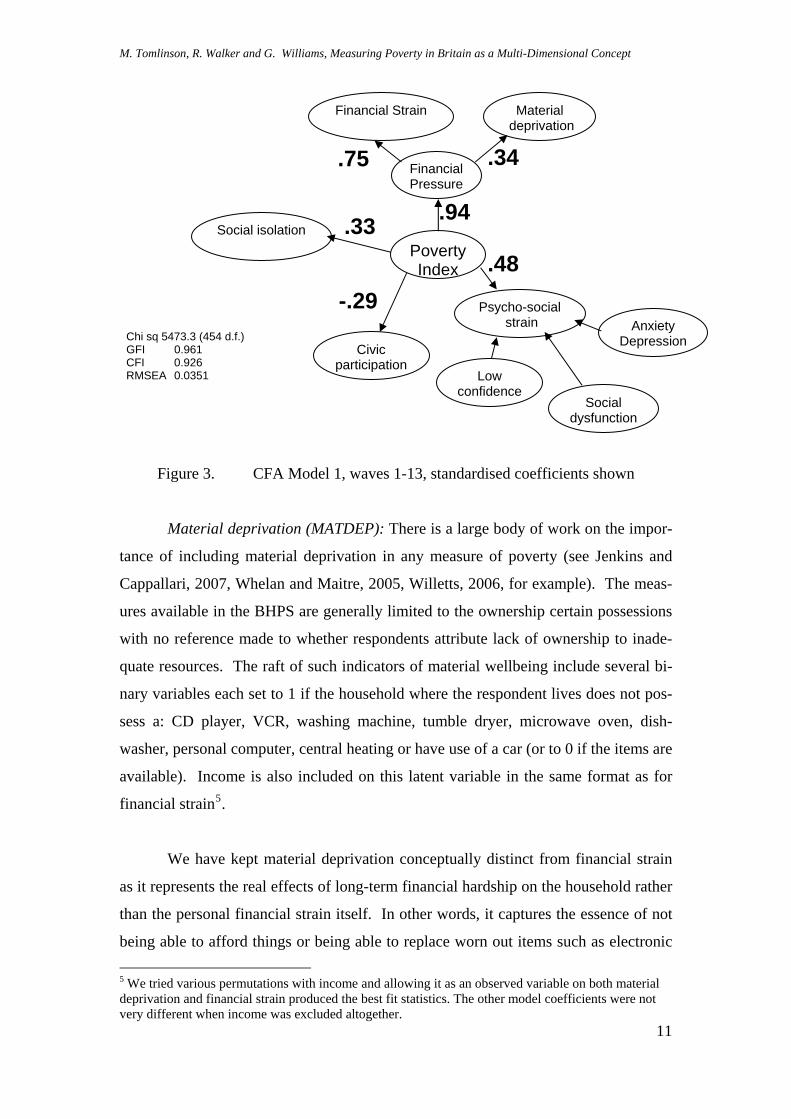
Figure 3 presents a second order CFA model fitted to the BHPS data consis-
tently available for alternative years from 1991 to 2003. It comprises several sets of
indicators related to several latent concepts or dimensions that constitute the multidi-
mensional poverty indicator (referred to from now on as the Poverty Index or PI). For
simplicity’s sake only selected standardized coefficients between the major latent
concepts and the overall index are shown. The full models are available on request
from the authors. Each major dimension is now described in turn.
Financial strain (FINSTRAIN): Several articles referred to in the introduction
stress the importance of income-based measures of poverty, augmented here by indi-
cators of the perceived financial situation of the household, the sense of being in fi-
nancial hardship. Financial strain, the first dimension, is an almost self-evident mani-
festation of poverty, certainly one that is widely documented, that comes at the top of
the poverty pyramid along with income as a primary indicator of privation. The vari-
ables used to capture this concept include whether a housing payment had been
missed in the last 12 months (binary), whether respondents considered their financial
status to be good/bad (using a five point scale) and whether it has been getting bet-
ter/worse over the last year (a three point scale). The intention was that these vari-
ables should capture both long term and the more immediate difficulties of budgeting
and the variables were all recoded so that a high value relates to a financially worse
scenario. Income is also included on this latent variable (recoded as logarithm of
equivalised household income4).
4 Income has been deflated to 1991 levels for model 1 and 1997 levels for model 2 using the annual retail price index (RPI 1a) available at the Office for National Statistics, series CHAW. This includes mortgage interest unlike the RPIX measure. Income for each household member is calculated as total household income before housing costs divided by the equivalised number of household members (us-ing the McClements equivalence scale).
M. Tomlinson, R. Walker and G. Williams, Measuring Poverty in Britain as a Multi-Dimensional Concept
11
PovertyIndex
Social isolation
Financial Strain Material deprivation
Psycho-social strain
Civic participation
Financial Pressure
Anxiety Depression
Social dysfunction
Low confidence
.94
.48-.29
.33
.75 .34
Chi sq 5473.3 (454 d.f.) GFI 0.961 CFI 0.926 RMSEA 0.0351
Figure 3. CFA Model 1, waves 1-13, standardised coefficients shown
Material deprivation (MATDEP): There is a large body of work on the impor-
tance of including material deprivation in any measure of poverty (see Jenkins and
Cappallari, 2007, Whelan and Maitre, 2005, Willetts, 2006, for example). The meas-
ures available in the BHPS are generally limited to the ownership certain possessions
with no reference made to whether respondents attribute lack of ownership to inade-
quate resources. The raft of such indicators of material wellbeing include several bi-
nary variables each set to 1 if the household where the respondent lives does not pos-
sess a: CD player, VCR, washing machine, tumble dryer, microwave oven, dish-
washer, personal computer, central heating or have use of a car (or to 0 if the items are
available). Income is also included on this latent variable in the same format as for
financial strain5.
We have kept material deprivation conceptually distinct from financial strain
as it represents the real effects of long-term financial hardship on the household rather
than the personal financial strain itself. In other words, it captures the essence of not
being able to afford things or being able to replace worn out items such as electronic
5 We tried various permutations with income and allowing it as an observed variable on both material deprivation and financial strain produced the best fit statistics. The other model coefficients were not very different when income was excluded altogether.

M. Tomlinson, R. Walker and G. Williams, Measuring Poverty in Britain as a Multi-Dimensional Concept
12
goods or kitchen appliances. Financial strain reflects monetary strain which may be
somewhat different and apply in different circumstances. For example a household
may be under financial strain because of high mortgage payments, but may have a
well equipped house6. Material and financial deprivation were also linked to the PI
by another latent variable representing overall financial and material deprivation7.
This represents the combined effects of long term and short term ‘financial pressure’.
Social isolation (SOCISOL): The third dimension is that of social isolation or
social exclusion, a trait seen both as a manifestation or consequence of poverty and as
a risk factor linked with downward spirals into poverty and marginalisation (for ex-
ample, Gallie et al. 2003). Once a person is marginalised the effect becomes self-
reinforcing and it is difficult to escape either in terms of labour market security or
poverty. Cattell (2001) also investigates the linkages between social networks, pov-
erty and health and has found complex relationships between the three. The BHPS
includes variables indicating whether the respondent has someone who will listen to
them, help them in a crisis, relax with, who appreciates them and who comforts them.
In this analysis these variables were coded so that the most isolated score the highest
(1 indicates they have no-one, 0 otherwise).
Civic participation (CIVIC): Related to social isolation, we also include the
converse concept of civic participation since the literature suggests that people in
poverty will be excluded from civic participation and have weak social networks and
social capital (Cattell, ibid, Gordon et al., 2000, Pantazis et al., 2006). Civic partici-
pation is captured in the BHPS by two variables that count the number of organiza-
tions that the respondent is a member of and the number of these organizations that he
or she is active in from a list. The list of 13 organizations is as follows: political
party, trade union, environmental group, parents association, tenants or residents
group, religious group, voluntary service, community group, social group, sports club,
women’s institute, women’s group, other organisation. High scores indicate higher
civic participation.
6 Factor analysis of the material deprivation and financial strain variables also separates out the two types of indicator leaving the financial strain variables as a distinct isolated factor. 7 If this was not done financial strain almost completely dominated the model. In order to maintain the balance required by our pyramid of concepts this intermediate latent variable was required.
M. Tomlinson, R. Walker and G. Williams, Measuring Poverty in Britain as a Multi-Dimensional Concept
13
Psychological strain (PSYSTRAIN): psychological well-being could be seen as
a cause or a consequence of poverty (Payne, 2006). There have been a number of
studies that have found an association between mental ill-health and poverty (for in-
stance, Weich and Lewis 1998, Whitley et al. 1999). Many of the medical and psy-
chological studies treat mental ill-health as the dependent variable including several
that explore the effects of poverty on children’s psychological health (see, for exam-
ple, Aber et al. 1997, Evans, 2004) while much social policy research focuses on the
negative effects of mental illness on incomes. We assume here that psychological
strain is a component towards the bottom of our pyramid of concepts and that it can
be entered into a comprehensive poverty index.
Psychological strain is measured using the General Health Questionnaire set of
12 items (GHQ12) with the 4 point scales being recoded to a binary with 1 suggesting
ill-health and 0 otherwise8. Following Shevlin and Adamson (2005) we modelled
psycho-social strain as a three-part model combining anxiety/depression (items 2, 5,
6, 9), social dysfunction (1, 3, 4, 7, 8) and loss of confidence (10 and 11). This pro-
duces a much better fit than using all 12 items loading on just one latent variable.
As indicated by the relative size of the coefficients in the model (Figure 3),
most weight in the PI is assigned to financial pressure, itself more closely allied to
financial strain than to material deprivation. The coefficients themselves are deter-
mined through the modelling process that identifies the model that best fits the data.
The PI more closely reflects the measures of psychological strain than it does social
isolation, while civic participation is similar in importance to social isolation but, as
anticipated, has the reverse effect on the PI (with high values lowering the PI score).
Model 2 covering the period 1997 to 2003
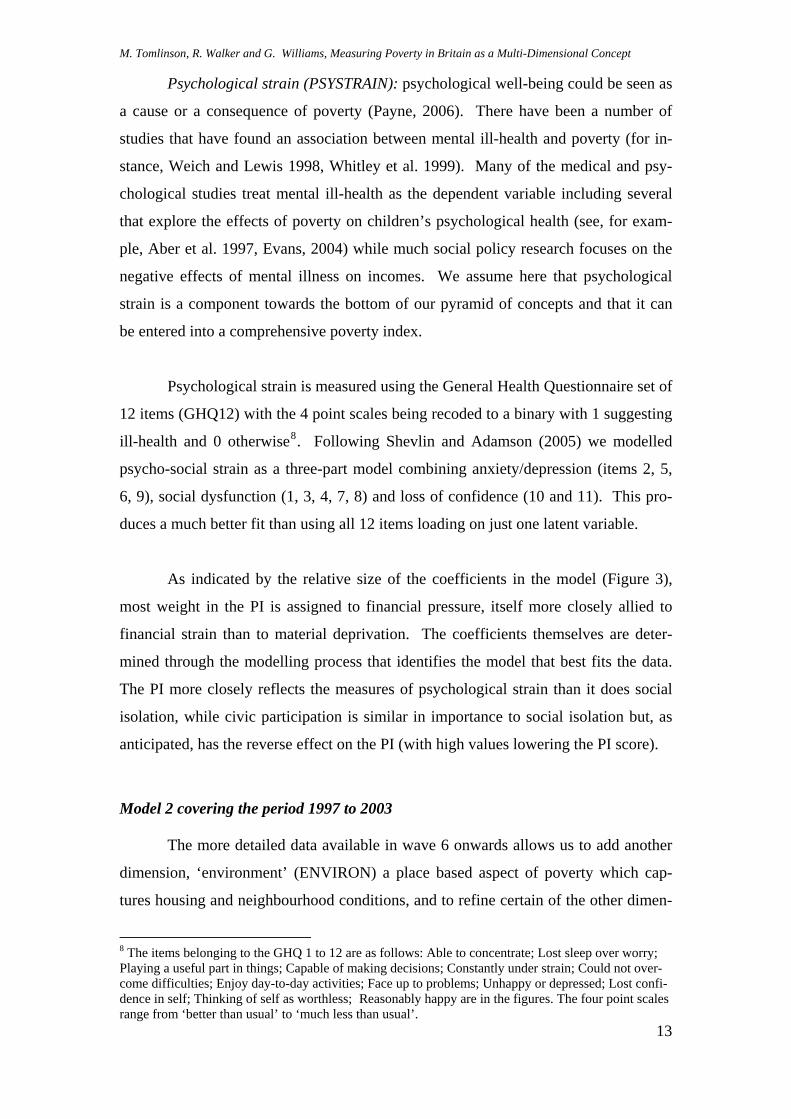
The more detailed data available in wave 6 onwards allows us to add another
dimension, ‘environment’ (ENVIRON) a place based aspect of poverty which cap-
tures housing and neighbourhood conditions, and to refine certain of the other dimen-
8 The items belonging to the GHQ 1 to 12 are as follows: Able to concentrate; Lost sleep over worry; Playing a useful part in things; Capable of making decisions; Constantly under strain; Could not over-come difficulties; Enjoy day-to-day activities; Face up to problems; Unhappy or depressed; Lost confi-dence in self; Thinking of self as worthless; Reasonably happy are in the figures. The four point scales range from ‘better than usual’ to ‘much less than usual’.
M. Tomlinson, R. Walker and G. Williams, Measuring Poverty in Britain as a Multi-Dimensional Concept
14
sions (Figure 4). The binary housing variables included in the environment dimension
are: whether the house in which a respondent resided suffered from bad light, bad
heating, leaks, rotting wood, and/or damp. Neighbourhood variables included more
objective measures appertaining to noise from neighbours, noise from the street, crime
levels and lack of space and more subjective ones recording whether the respondent
liked the area or not and whether they would like to move away. Both sets of meas-
ures are coded to 1 for the most negative option and 0 otherwise to construct the envi-
ronment dimension which supplants psychological strain as the second most impor-
tant component in the PI index.
PovertyIndex
Social isolation
Financial StrainMaterial
deprivation
Civic participation
Environment
FinancialPressure
Psycho-social strain
Anxiety Depression
Social dysfunction
Low confidence
.47.99
.38.21
-.25
.72.44
Chi square 9477.6 (1151 d.f.) GFI 0.949 CFI 0.906 RMSEA 0.0308
Figure 4. CFA Model 2, wave 7-13, standardised coefficients shown
The new material deprivation component additionally includes lack of access
to cable/satellite TV together with whether respondents’ assessment of whether their
household could afford a holiday of 1 week once a year, to buy new clothes, to re-
place furniture or to feed visitors once a month, each coded as a binary variable (1 in-
dicating lack of resources, 0 otherwise). Three binary variables are added to the so-
cial isolation dimension, with 1 indicating that the respondent could not go to some-
one outside the household to borrow money, find a job and to find help with depres-
M. Tomlinson, R. Walker and G. Williams, Measuring Poverty in Britain as a Multi-Dimensional Concept
15
sion (measured on a three point scale, yes/not sure/no). Financial strain, civic partici-
pation and psychological strain remain as in model 1.
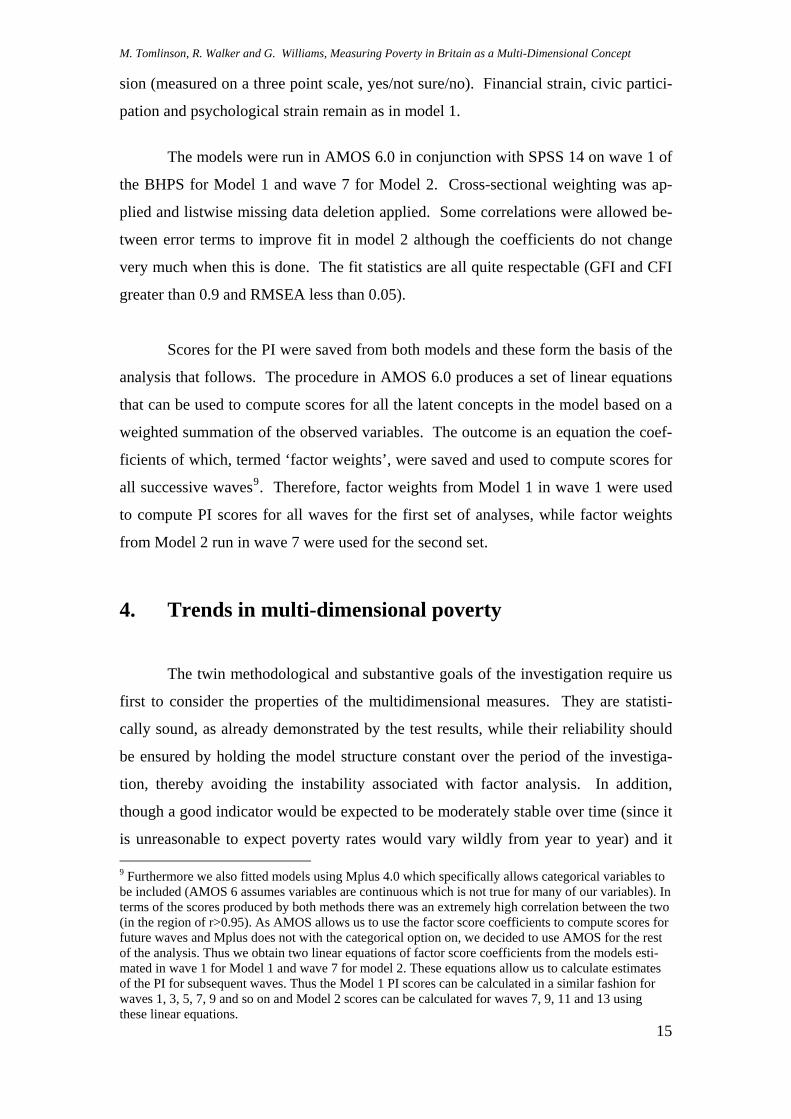
The models were run in AMOS 6.0 in conjunction with SPSS 14 on wave 1 of
the BHPS for Model 1 and wave 7 for Model 2. Cross-sectional weighting was ap-
plied and listwise missing data deletion applied. Some correlations were allowed be-
tween error terms to improve fit in model 2 although the coefficients do not change
very much when this is done. The fit statistics are all quite respectable (GFI and CFI
greater than 0.9 and RMSEA less than 0.05).
Scores for the PI were saved from both models and these form the basis of the
analysis that follows. The procedure in AMOS 6.0 produces a set of linear equations
that can be used to compute scores for all the latent concepts in the model based on a
weighted summation of the observed variables. The outcome is an equation the coef-
ficients of which, termed ‘factor weights’, were saved and used to compute scores for
all successive waves9. Therefore, factor weights from Model 1 in wave 1 were used
to compute PI scores for all waves for the first set of analyses, while factor weights
from Model 2 run in wave 7 were used for the second set.
4. Trends in multi-dimensional poverty
The twin methodological and substantive goals of the investigation require us
first to consider the properties of the multidimensional measures. They are statisti-
cally sound, as already demonstrated by the test results, while their reliability should
be ensured by holding the model structure constant over the period of the investiga-
tion, thereby avoiding the instability associated with factor analysis. In addition,
though a good indicator would be expected to be moderately stable over time (since it
is unreasonable to expect poverty rates would vary wildly from year to year) and it
9 Furthermore we also fitted models using Mplus 4.0 which specifically allows categorical variables to be included (AMOS 6 assumes variables are continuous which is not true for many of our variables). In terms of the scores produced by both methods there was an extremely high correlation between the two (in the region of r>0.95). As AMOS allows us to use the factor score coefficients to compute scores for future waves and Mplus does not with the categorical option on, we decided to use AMOS for the rest of the analysis. Thus we obtain two linear equations of factor score coefficients from the models esti-mated in wave 1 for Model 1 and wave 7 for model 2. These equations allow us to calculate estimates of the PI for subsequent waves. Thus the Model 1 PI scores can be calculated in a similar fashion for waves 1, 3, 5, 7, 9 and so on and Model 2 scores can be calculated for waves 7, 9, 11 and 13 using these linear equations.
M. Tomlinson, R. Walker and G. Williams, Measuring Poverty in Britain as a Multi-Dimensional Concept
16
should exhibit face validity in bearing some correlation with other accepted, if partial,
indicators of poverty such as income.
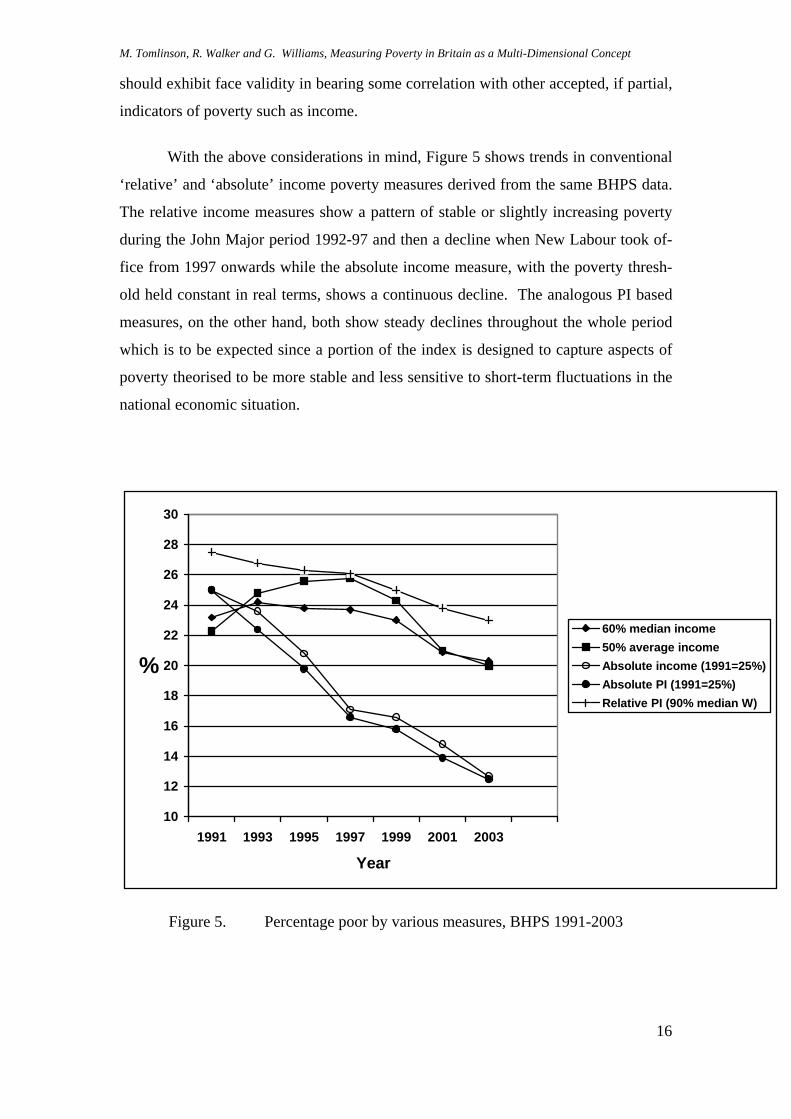
With the above considerations in mind, Figure 5 shows trends in conventional
‘relative’ and ‘absolute’ income poverty measures derived from the same BHPS data.
The relative income measures show a pattern of stable or slightly increasing poverty
during the John Major period 1992-97 and then a decline when New Labour took of-
fice from 1997 onwards while the absolute income measure, with the poverty thresh-
old held constant in real terms, shows a continuous decline. The analogous PI based
measures, on the other hand, both show steady declines throughout the whole period
which is to be expected since a portion of the index is designed to capture aspects of
poverty theorised to be more stable and less sensitive to short-term fluctuations in the
national economic situation.
10
12
14
16
18
20
22
24
26
28
30
1991 1993 1995 1997 1999 2001 2003
Year
%
60% median income50% average incomeAbsolute income (1991=25%)Absolute PI (1991=25%)Relative PI (90% median W)
Figure 5. Percentage poor by various measures, BHPS 1991-2003
M. Tomlinson, R. Walker and G. Williams, Measuring Poverty in Britain as a Multi-Dimensional Concept
17
Model 1
0
0.1
0.2
0.3
0.4
0.5
1991 1993 1995 1997 1999 2001 2003
Year
PI s
core Mean
Median
Model 2
0
0.1
0.2
0.3
0.4
0.5
0.6
0.7
0.8
1997 1999 2001 2003
Year
PI s
core Mean
Median
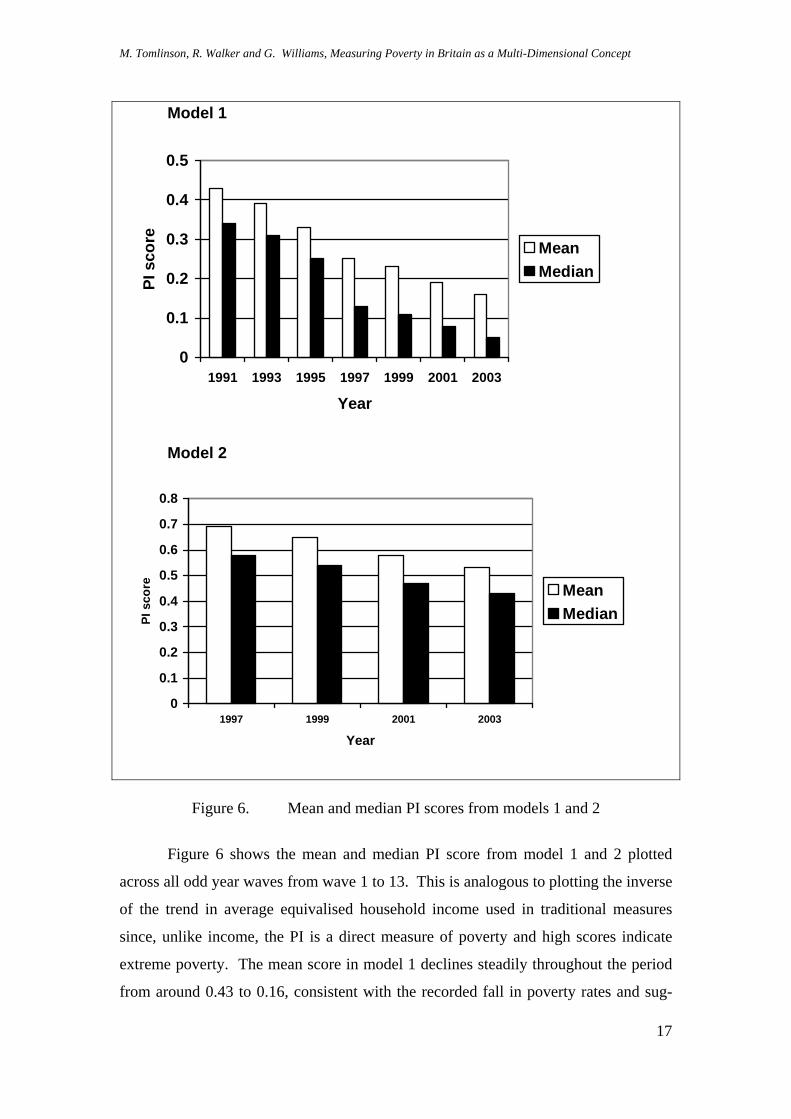
Figure 6. Mean and median PI scores from models 1 and 2
Figure 6 shows the mean and median PI score from model 1 and 2 plotted
across all odd year waves from wave 1 to 13. This is analogous to plotting the inverse
of the trend in average equivalised household income used in traditional measures
since, unlike income, the PI is a direct measure of poverty and high scores indicate
extreme poverty. The mean score in model 1 declines steadily throughout the period
from around 0.43 to 0.16, consistent with the recorded fall in poverty rates and sug-
M. Tomlinson, R. Walker and G. Williams, Measuring Poverty in Britain as a Multi-Dimensional Concept
18
gesting a general rise in social well-being, while the differences in the mean and me-
dian show that the distribution of the PI is slightly skewed, but less so than income
alone. While it is clear that average PI fell significantly in absolute terms between
1991 and 2003 and that inequalities widened, perhaps especially during the last years
of the Major government, it is not possible straightforwardly to assess the strength of
this fall because the scores are not standardised in any way. Moreover, since a nega-
tive score is possible, meaning that a score of zero does not indicate an absence of
poverty, it cannot be presumed that that the average PI more than halved.
As with income based measures, it is necessary to select a more or less arbi-
trary poverty threshold on the PI distribution to provide headcounts of poverty. Fix-
ing the poverty rate at 25% in 1991, in approximate accord with poverty rates accord-
ing to traditional income based measures at the time, and using the associated PI score
as a poverty threshold, the proportion of adults defined to be in poverty falls gradually
over the whole period from the initial 25% down to 12.9% in 2003 (Table 1, column 1
and Figure 5). Moreover, it is possible to disaggregate the contribution made to this
trend by the individual components. The subsets of the coefficients used to calculate
the overall score from the model were used to calculate scores for each component
(Table 1 shows selected components). The material deprivation (MATDEP) and fi-
nancial stain (FINSTR) components were calculated without income included (which
was calculated as a separate effect, INC) while, financial pressure (FINPRES) com-
bined the coefficients for income, material deprivation and financial strain).
The results of this analysis reveal that poverty rates based on the financial
strain and material deprivation components of the index both fell much faster than in-
come, declining by three quarters as opposed to half from 25% in 1991 to seven or
eight percent in 2003. Poverty defined in terms of financial strain decreased more
quickly in the early part of the period subsequently slowing as, to a less marked de-
gree, did material deprivation, whereas the marked fall in poverty experienced as fi-
nancial pressure, a product of the effects of income, financial strain and material dep-
rivation, occurred slightly later during the last years of the Major era. The other com-
ponents, psychological strain (PSYSTRAIN), civic participation (CIVIC) and social
isolation (SOCISOL) all remained fairly constant throughout the period and were, ad-
ditionally, less closely associated in the model with the composite poverty index. The
M. Tomlinson, R. Walker and G. Williams, Measuring Poverty in Britain as a Multi-Dimensional Concept
19
major falls in the index were therefore largely due to improvements in people’s mate-
rial well being and easing of financial strain.
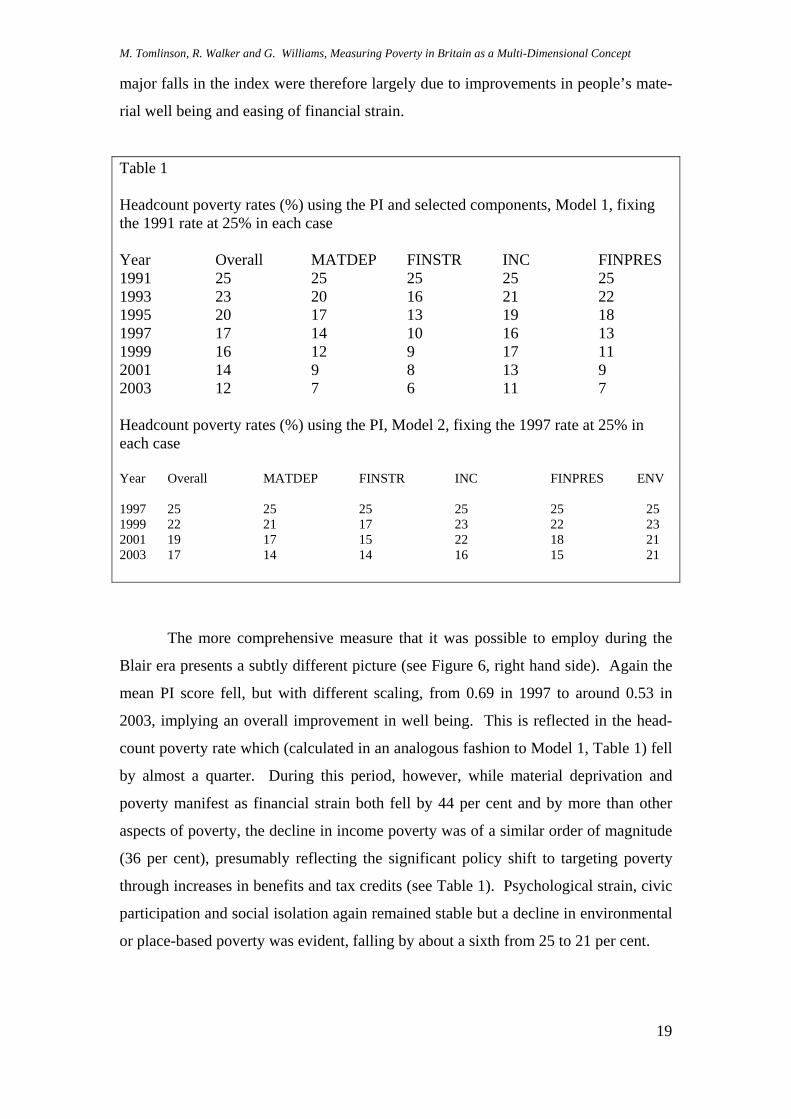
Table 1 Headcount poverty rates (%) using the PI and selected components, Model 1, fixing the 1991 rate at 25% in each case Year Overall MATDEP FINSTR INC FINPRES 1991 25 25 25 25 25 1993 23 20 16 21 22 1995 20 17 13 19 18 1997 17 14 10 16 13 1999 16 12 9 17 11 2001 14 9 8 13 9 2003 12 7 6 11 7 Headcount poverty rates (%) using the PI, Model 2, fixing the 1997 rate at 25% in each case Year Overall MATDEP FINSTR INC FINPRES ENV 1997 25 25 25 25 25 25 1999 22 21 17 23 22 23 2001 19 17 15 22 18 21 2003 17 14 14 16 15 21
The more comprehensive measure that it was possible to employ during the
Blair era presents a subtly different picture (see Figure 6, right hand side). Again the
mean PI score fell, but with different scaling, from 0.69 in 1997 to around 0.53 in
2003, implying an overall improvement in well being. This is reflected in the head-
count poverty rate which (calculated in an analogous fashion to Model 1, Table 1) fell
by almost a quarter. During this period, however, while material deprivation and
poverty manifest as financial strain both fell by 44 per cent and by more than other
aspects of poverty, the decline in income poverty was of a similar order of magnitude
(36 per cent), presumably reflecting the significant policy shift to targeting poverty
through increases in benefits and tax credits (see Table 1). Psychological strain, civic
participation and social isolation again remained stable but a decline in environmental
or place-based poverty was evident, falling by about a sixth from 25 to 21 per cent.
M. Tomlinson, R. Walker and G. Williams, Measuring Poverty in Britain as a Multi-Dimensional Concept
20
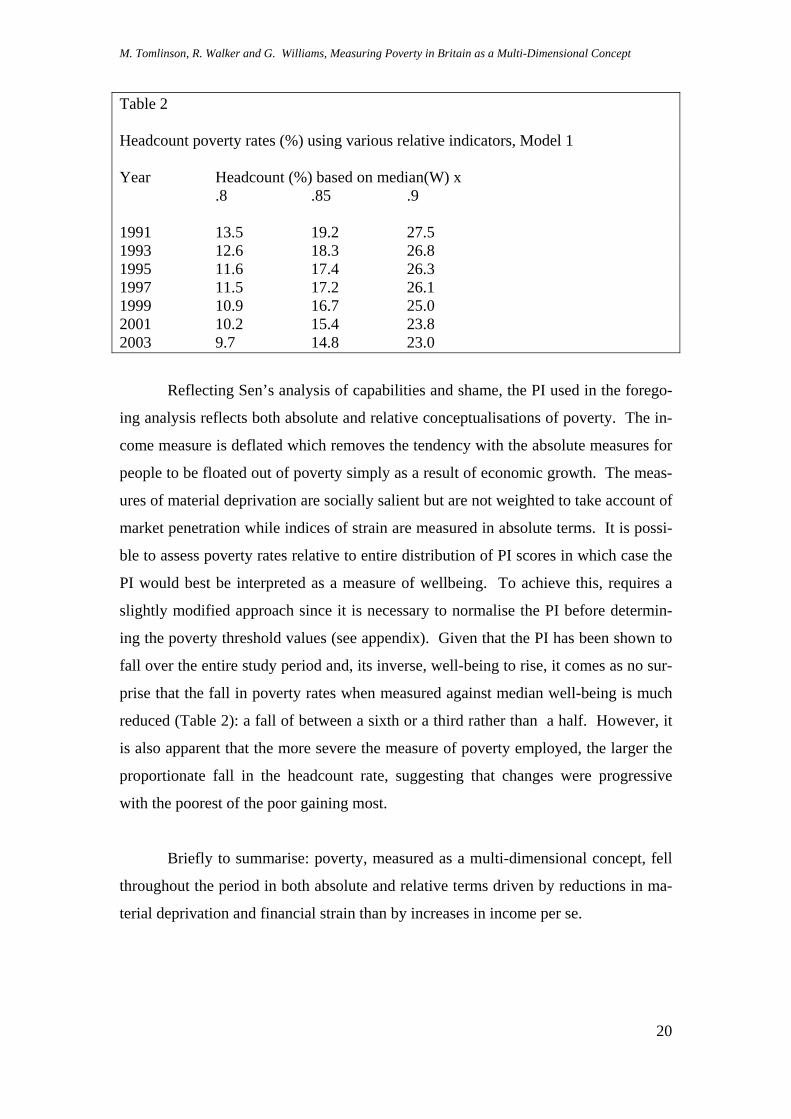
Table 2 Headcount poverty rates (%) using various relative indicators, Model 1 Year Headcount (%) based on median(W) x .8 .85 .9 1991 13.5 19.2 27.5 1993 12.6 18.3 26.8 1995 11.6 17.4 26.3 1997 11.5 17.2 26.1 1999 10.9 16.7 25.0 2001 10.2 15.4 23.8 2003 9.7 14.8 23.0
Reflecting Sen’s analysis of capabilities and shame, the PI used in the forego-
ing analysis reflects both absolute and relative conceptualisations of poverty. The in-
come measure is deflated which removes the tendency with the absolute measures for
people to be floated out of poverty simply as a result of economic growth. The meas-
ures of material deprivation are socially salient but are not weighted to take account of
market penetration while indices of strain are measured in absolute terms. It is possi-
ble to assess poverty rates relative to entire distribution of PI scores in which case the
PI would best be interpreted as a measure of wellbeing. To achieve this, requires a
slightly modified approach since it is necessary to normalise the PI before determin-
ing the poverty threshold values (see appendix). Given that the PI has been shown to
fall over the entire study period and, its inverse, well-being to rise, it comes as no sur-
prise that the fall in poverty rates when measured against median well-being is much
reduced (Table 2): a fall of between a sixth or a third rather than a half. However, it
is also apparent that the more severe the measure of poverty employed, the larger the
proportionate fall in the headcount rate, suggesting that changes were progressive
with the poorest of the poor gaining most.
Briefly to summarise: poverty, measured as a multi-dimensional concept, fell
throughout the period in both absolute and relative terms driven by reductions in ma-
terial deprivation and financial strain than by increases in income per se.
M. Tomlinson, R. Walker and G. Williams, Measuring Poverty in Britain as a Multi-Dimensional Concept
21
5. The distribution of poverty
Having established trends in multi-dimensional poverty, it is appropriate for
both substantive and methodological reasons to consider its distribution and corre-
lates. Suffice, here, to focus on the association with income and its distribution by
demographic group.
It will already be apparent from the structure of the measurement models and
the fact that income poverty fell less markedly than other kinds of poverty, that the PI
is only moderately associated with income. Typically, in any one year, the correlation
between the PI and the logarithm of household equivalised income is about 0.46 with
income explaining no more than around 23% of the variance of the PI. This is, of
course, consistent with Ringen’s (1988) assertion above that income is an indirect and
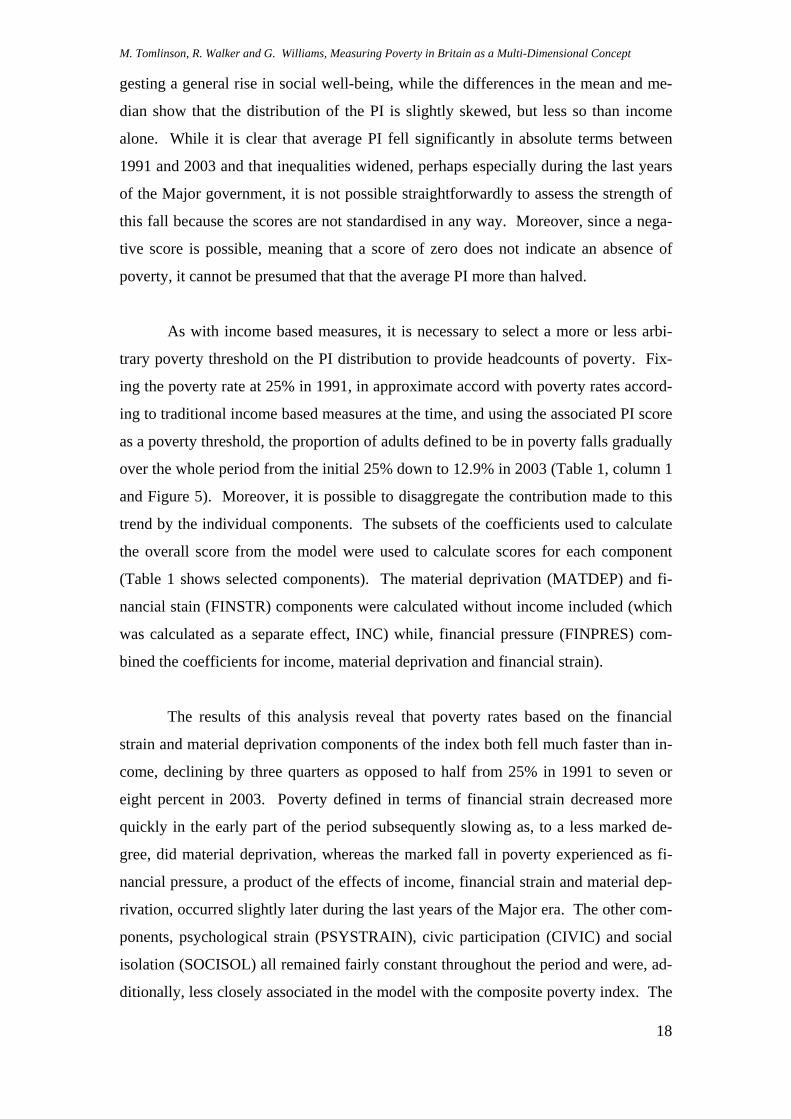
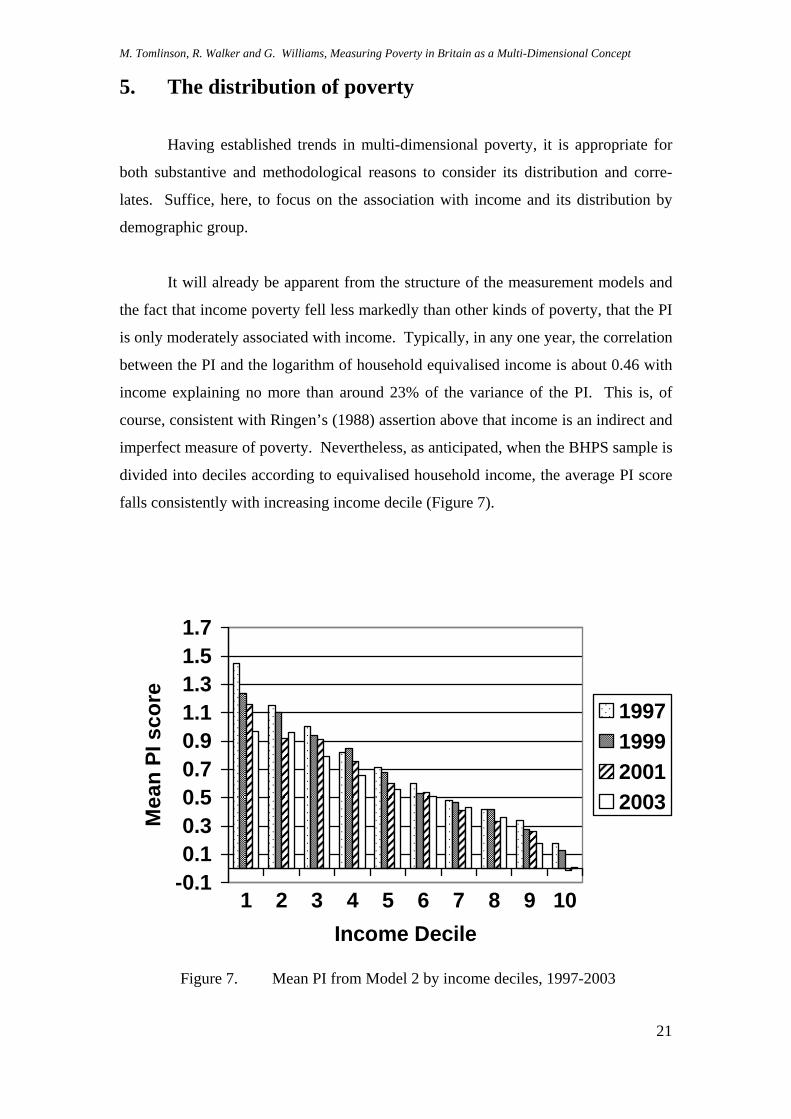
imperfect measure of poverty. Nevertheless, as anticipated, when the BHPS sample is
divided into deciles according to equivalised household income, the average PI score
falls consistently with increasing income decile (Figure 7).
-0.10.10.30.50.70.91.11.31.51.7
1 2 3 4 5 6 7 8 9 10Income Decile
Mea
n PI
sco
re
1997199920012003
Figure 7. Mean PI from Model 2 by income deciles, 1997-2003
M. Tomlinson, R. Walker and G. Williams, Measuring Poverty in Britain as a Multi-Dimensional Concept
22
Figure 7 also reveals that the average PI score declined across the income dis-
tribution between 1997 and 2003. The biggest absolute falls were observed among
the lowest income groups and especially within the lowest decile which, by 2003, had
an average PI that did not differ statistically from that for the second decile10. Never-
theless, the proportion of people in the lowest income decile that were poor according
to the poverty index fell only marginally from 1991 to 2003, suggesting that most of
the fall in the index translated into a reduction in the severity of poverty as indicated
by the poverty gap, the amount by which people recorded as poor in the lowest in-
come decile fell short of the multi-dimensional poverty threshold.
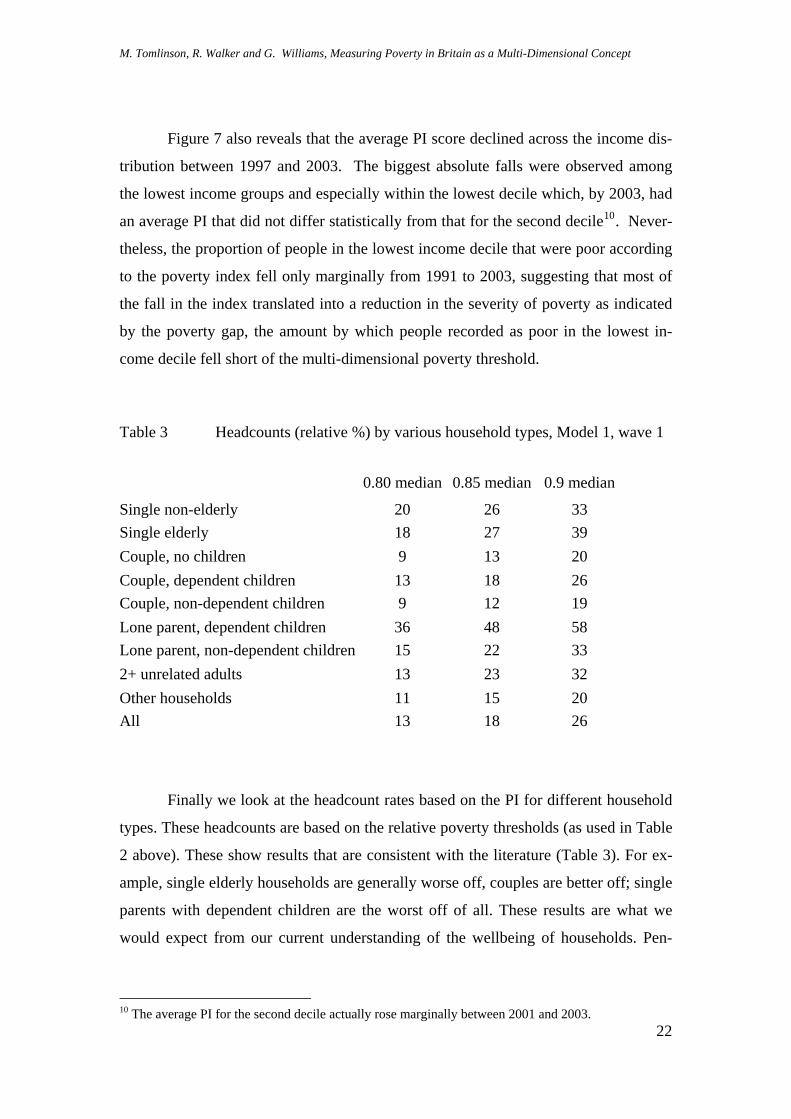
Table 3 Headcounts (relative %) by various household types, Model 1, wave 1
0.80 median 0.85 median 0.9 median
Single non-elderly 20 26 33 Single elderly 18 27 39 Couple, no children 9 13 20 Couple, dependent children 13 18 26 Couple, non-dependent children 9 12 19 Lone parent, dependent children 36 48 58 Lone parent, non-dependent children 15 22 33 2+ unrelated adults 13 23 32 Other households 11 15 20 All 13 18 26
Finally we look at the headcount rates based on the PI for different household
types. These headcounts are based on the relative poverty thresholds (as used in Table
2 above). These show results that are consistent with the literature (Table 3). For ex-
ample, single elderly households are generally worse off, couples are better off; single
parents with dependent children are the worst off of all. These results are what we
would expect from our current understanding of the wellbeing of households. Pen-
10 The average PI for the second decile actually rose marginally between 2001 and 2003.
M. Tomlinson, R. Walker and G. Williams, Measuring Poverty in Britain as a Multi-Dimensional Concept
23
sioners and lone parents have the lowest standards of living in the UK and tend to live
in the worst conditions. Couples with no children are the best off.
6. Conclusions
It is argued that poverty is an inherently multidimensional concept and that re-
liance on one-dimensional measures can be misleading. However, it has hitherto
proved impossible to devise multidimensional measures that are stable over time and
which thereby facilitate the accurate measurement of trends in the poverty rate, a nec-
essary requirement if the effects of anti-poverty programmes are to be assessed. Now,
through the application of structural equation modelling, it has proved possible to cre-
ate multi-dimensional indicators without the usual drawbacks of factor analytic ap-
proaches11, drawing on data from the British Household Panel Study for the period
1991 to 2003. It was also possible to disaggregate the contribution of the individual
components to the overall trend in a way reminiscent of regression, namely to isolate
the effect of a single dimension holding other components constant. This represents a
major advance on combinatorial methods used in Ireland and proposed for the UK
which cannot adequate cope with the phenomenon that a person might appear poor on
one index and not on another. Data limitations necessitated two separate measures:
one covering the full period; the other more sophisticated measure, restricted to the
period from 1997 onwards.
The analytic method guaranteed that the multi-dimensional poverty indices
were conceptually identical over time while empirical analysis demonstrated their
face validity: the indices did not suffer wide fluctuations from one wave of data to the
next but mirrored falls in absolute and relative poverty found by others, notably the
Households Below Average Income data series. Moreover, many more models were
tried than have been described here and the slightly different specifications generated
11 Factor analysis also produced reasonably stable results and produced factors which on the whole were comparable with the latent variables in our SEMs. However, there were some fluctuations over time and moreover, no comprehensive overall index can be straightforwardly calculated using factor analysis.
M. Tomlinson, R. Walker and G. Williams, Measuring Poverty in Britain as a Multi-Dimensional Concept
24
consistent results emphasising the robustness of the technique;12 indeed, all the mod-
els were highly correlated with one another (in the order of r=0.85 or more).
The substantive findings, despite limitations further discussed below, are also of im-
portance. They demonstrate that poverty, measured as a multi-dimensional concept,
fell throughout the period without a marked turning point associated with the election
of the Blair government. This was true of both absolute and relative measures. The
decline was driven by falls in material deprivation but more especially by reduced fi-
nancial stress particularly during the early 1990s, a time when unemployment, infla-
tion and interest rates were all falling. Interpretation of the decline in material depri-
vation is complex because the commodities included in the index were fixed in 1991
(or 1997 with the inclusion of cable and satellite TV). Many of these items have be-
come much cheaper and more widely diffused now than they would have been in
1991 with the result that one would expect the material deprivation based on these
items to fall naturally during the subsequent 13 years. The implication is that in abso-
lute terms the poor are better off in terms of possession of the indicator items but, in
relative terms, may be suffering from not having access to items that have since be-
come socially essential, such as a mobile phone.
The coefficients attached to the measurement models are also of interest in
their own right, revealing the contribution of each dimension to the overall poverty
score. The theoretical understanding that the effect of low income on financial pres-
sure was mediated through short term financial stress and longer term material depri-
vation was confirmed by the model. Moreover, it was further refined by the observa-
tion that short-term considerations were twice as important as longer term ones in de-
termining the level of financial pressure. Likewise, the modelling revealed the domi-
nating importance of financial pressure although the poverty index was also particu-
larly sensitive to manifestations of psychological stress (although these changed little
over the 13 years) and to environmental factors (when these could be measured).
Finally, the analysis confirmed the now quite widely observed finding that in-
come is only weakly associated with the other generally accepted manifestations of
poverty (see, for example, Whelan et al. 2004). This reinforces Ringen’s (1988) theo-
12 We also ran models backwards (that is we estimated models in wave 13 and calculated scores based on these for all waves). We got essentially the same results. Scores were extremely highly correlated.
M. Tomlinson, R. Walker and G. Williams, Measuring Poverty in Britain as a Multi-Dimensional Concept
25
retical arguments and underlines the need to take a multidimensional approach seri-
ously and develop the tools necessary for the accurate measurement of poverty and
related phenomena. The Baulch pyramid is a useful starting point along this road
when coupled with the advanced statistical techniques becoming available.
The models and technique used here is not completely devoid of problems, nor is it
devoid of further opportunities. The latent variables in the models are slightly corre-
lated with each other indicating that there is sometimes overlap between the concepts
in the model. This is not a problem per se, but does cause problems when factor
weights are used to construct the PI in a simply additive fashion. As noted in the in-
troduction, there is no clear cut way to separate the elements of the pyramid into pure
forms and any attempt to measure these multidimensional concepts (especially involv-
ing those concepts towards the bottom of the pyramid) will inevitably encounter these
issues. This is mediated in our approach by creating models that assign less weight to
those items at the bottom of the pyramid than those at the top.
Turning to future potential, this is considerable. First, better measures are al-
ready available in new datasets such as FACS although their innovation makes them
less suitable more measuring long term trends. Secondly, there are newly emerging
techniques such as such as MIMIC (multiple indicators, multiple causes models)
which allow for ordinal and censored variables, and permit more controls and interac-
tions to be applied within the SEM. Perhaps most importantly, full structural models
can be used to test causal linkages between the dimensions of poverty specified above
and hence to begin to model trajectories through the various varieties and manifesta-
tions of poverty as, for example, seen by Walker and Park (1998). Latent growth
curve models allow the dynamic aspects of poverty to be investigated further and mul-
tilevel models could help disentangle individual from household processes. These
modelling techniques will form the basis of the next stage in the research.
M. Tomlinson, R. Walker and G. Williams, Measuring Poverty in Britain as a Multi-Dimensional Concept
26
References Aber, L., Bennett, N. G., Conley, D. C. and Li, J. (1997), ‘The effects of poverty on
child health and development’, Annual Review of Public Health, 18: 463-83. Atkinson, A. B. (1995), Incomes and the Welfare State: Essays on Britain and Europe,
Cambridge: Cambridge University Press Baulch, B. (1996), ‘The new poverty agenda: a disputed consensus’, IDS Bulletin, 27:
1-10. Booth, C. (1892) Life and Labour of the People in London (1889–1903), London:
Macmillan. Blair, T. (1999) ‘Beveridge Revisited: a welfare state for the 21st century’, Pp.7-18 in
R. Walker (ed.), Ending Child Poverty: Popular welfare for the 21st Century? Bristol: Policy Press.
Byrne, B. (2001), Structural Equation Modelling with AMOS, Mahwah: Lawrence Erlbaum Associates.
Calandrino, M. (2003), Low-Income and Deprivation in British Families, London De-partment for Work and Pensions: Working Paper 10.
Callan, S. et al. (2006), The state of the nation report: Fractured families, Social Pol-icy Justice Group, December.
Callan T., Nolan, B. and Whelan, C. (1993), ‘Resources, deprivation and the meas-urement of poverty’, Journal of Social Policy, 22(2): 141-172
Cattell, V. (2001), ‘Poor people, poor places, and poor health: the mediating role of social networks and social capital’, Social Science and Medicine, 52: 1501-1516.
Dewilde, C. (2004), ‘The Multidimensional Measurement of Poverty in Belgium and Britain: A Categorical Approach’, Social Indicators Research, 68(3): 331-369.
DWP (2003), Measuring Child Poverty, London, DWP. DWP (2006a), Opportunity for all Eighth Annual Report 2006, Indicators document.
Presented to Parliament by the Secretary of State for Work and Pensions by Command of Her Majesty October 2006, Norwich: Stationary Office Cm 6915-ii.
DWP (2006b), Households below Average Income 2004/05, London: DWP. Ermisch, J., Francesconi, M. and Pevalin, D.J. (2001), Outcomes for Children of Pov-
erty, DWP Research Report No. 158, Department of Work and Pensions. Leeds: CDS.
Evans, D. W. (2004), ‘The environment of childhood poverty’, American Psycholo-gist, 59(2): 77-92.
Fitzpatrick, S. (2004), ‘Poverty of Place’, keynote address given to JRF Centenary Conference, York, 14th December.
Fouarge, D. and Layte, R. (2005), ‘Welfare regimes and poverty dynamics: The dura-tion and recurrence of poverty spells in Europe’, Journal of Social Policy, 34(3): 407-426
Gallie, D., Paugam, S. and Jacobs, S. (2003), ‘Unemployment, poverty and social iso-lation: Is there a vicious circle of social exclusion?’ European Societies, 5(1): 1-32.
Gordon, D. and Pantazis, C. (1997), Breadline Britain in the 1990s, Aldershot: Ash-gate.
Gordon, D. et al. (2000), Poverty and Social Exclusion in Britain, York: Joseph Rowntree Foundation.
M. Tomlinson, R. Walker and G. Williams, Measuring Poverty in Britain as a Multi-Dimensional Concept
27
Haase, T. and Pratschke. J. (2005), Deprivation and its Spatial Articulation in the Re-public of Ireland, Dublin: NDP.
Hobfoll, S. (1998), Stress, Culture, and Community: The Psychology and Philosophy of Stress, London: Plenum Press.
Jenkins, S.P. and Cappellari, L. (2007), ‘Summarising multiple deprivation indica-tors', Chapter 8, pp. 166-184, in Inequality and Poverty Re-examined, S.P. Jen-kins and J. Micklewright (eds), Oxford University Press, Oxford, 2007, forthcoming.
Jenkins, S.P. and Rigg, J. (2001), The Dynamics of Poverty in Britain, DWP Research Report No. 157, Department of Work and Pensions. Leeds: CDS.
Kempson, E, (1996), Life on a Low Income, York: York Publishing Service Klein, R. (2005), Principles and Practice of Structural Equation Modeling, 2nd ed.,
New York: Guilford Press. Kuklys, W. (2004), ‘Measuring standards of living in the UK – an application of
Sen’s functioning approach using structural equation models’, Working Paper on Strategic Interaction 11-2004, Max Planck Institute, Jena.
Layte, R., Nolan, B. and Whelan, C. (2000), ‘Targeting Poverty: Lessons from Moni-toring Ireland’s National Anti-Poverty Strategy’, Journal of Social Policy, 29(4): 553–575.
Layte, R., Nolan, B. and Whelan, C. (2001), Reassessing Income and Deprivation: Approaches to the Measurement of Poverty, Dublin: ESRI.
Layte, R. and Whelan, C. (2003), ‘Moving in and out of poverty: the impact of wel-fare regimes on poverty dynamics in the EU’, European Societies, 5(2): 167-191.
Lister, R. (2004), Poverty, Cambridge: Polity Press. Loehlin, J. (1992), Latent Variable Models: An introduction to Factor, Path and Struc-
tural Analysis. Hillsdale: Erlbaum. Mack, J. and Lansley, S. (1985), Poor Britain, London: Allen and Unwin. Maggio, G. (2004), ‘Multidimensional Analysis Of Poverty Dynamics In Great Brit-
ain’, Working Papers of the Institute for Social and Economic Research, Paper 2004-10. Colchester: University of Essex.
Mayhew, H. (1851), London Labour and London Poor, London: Griffin, Bohn, and Company.
MSD (2002), Direct Measurement of Living Standards: The New Zealand ELSI Scale, Wellington: New Zealand Ministry of Social Development.
Nolan, B. and Whelan, C. (1996), Resources, Deprivation and Poverty, Oxford: Clar-endon Press.
Pantazis, C., Gordon, D. and Levitas, R. (eds.) (2006), Poverty and Social Exclusion in Britain: The Millennium Survey, Bristol: The Policy Press.
Payne, S. (2006), ‘Mental health, poverty and social exclusion’, in Pantazis, C., Gordon, D. and Levitas R (eds.), Poverty and Social Exclusion in Britain: The Millennium Survey, Bristol: The Policy Press.
Piachaud, D. (1981), ‘Peter Townsend and the holy grail’, New Society, 57: 419-22. Piachaud, D. (1987), ‘Problems in the definition and measurement of poverty’, Jour-
nal of Social Policy, 16: 147-64 Rigg, J. and Sefton, T. (2006), ‘Income dynamics and the life cycle’, Journal of Social
Policy, 35(3): 411-435. Ringen, S. (1988), ‘Direct and indirect measures of poverty’, Journal of Social Policy,
17(3): 351-365. Rowntree, S. (1901), Poverty: A Study of Town Life, London: Macmillan. Sen, A. (1999) Commodities and Capabilities, Delhi: Oxford University Press
M. Tomlinson, R. Walker and G. Williams, Measuring Poverty in Britain as a Multi-Dimensional Concept
28
Shevlin, M. and Adamson, G. (2005), ‘Alternative factor models and factorial invari-
ance of the GHQ-12: A large sample analysis using confirmatory factor analy-sis’, Psychological Assessment, 17(2): 231-236.
Smith, A. (1776), An Inquiry into the Nature and Causes of the Wealth of Nations, Online edition © 1995-2005 Adam Smith Institute: http://www.adamsmith.org/smith/won/won-b5-c2-article-4-ss2.html
Tomlinson, M., Walker, R. and Williams, G. (2007), ‘The relationship between pov-erty and child well-being: A structural equation modelling approach’, Mimeo, Department of Social Policy and Social Work, University of Oxford.
Townsend, P. (1979), Poverty in the United Kingdom, Harmondsworth: Allen Lane. Townsend, P. and Abel-Smith, B. (1965), The Poor and the Poorest, London: Bell. Walker, R. with Ashworth, K. (1994) Poverty Dynamics: Issues and Examples, Al-
dershot: Avebury. Walker, R. and Collins, C. (2003), ‘Families of the poor’ in Scott, J., Treas, J. and
Richards, M. (eds.) Blackwell Companion on the Sociology of the Family, Mal-den: Blackwell Publishers Inc.
Walker, R. and Park, J. (1998), ‘Unpicking poverty’, pp. 29-52 in C. Oppenheim (ed.) An Inclusive Society, London: IPPR.
WBG (2005), Women’s and Children’s Poverty: Making the links, London: Women’s Budget Group.
Weich, S. and Lewis, G. (1998), ‘Poverty, unemployment and common mental disor-ders: Population based cohort study’, British Medical Journal, 317: 115-119.
Whelan, C., Layte, R. and Maitre, B. (2002), ‘Multiple deprivation and persistent poverty in the European Union’, Journal of European Social Policy, 12(2): 91-105.
Whelan, C., Layte, R. and Maitre, B. (2004), ‘Understanding the mismatch between income poverty and deprivation: A dynamic comparative analysis’, European Sociological Review, 20(4): 287-302.
Whelan, C. and Maitre, B. (2005), ‘Vulnerability and multiple deprivation perspec-tives on economic exclusion in Europe: A latent class analysis’, European Socie-ties, 7(3): 423-450.
Whelan, C. and Maitre, B. (2007a), ‘Measuring material deprivation with EU-SILC: Lessons from the Irish survey’, European Societies, 9(2): 147-173.
Whelan, C. and Maitre, B. (2007b), ‘Levels and patterns of material deprivation in Ireland: After the Celtic Tiger’, European Sociological Review, 23(2): 139-154.
Whitley, E., Gunnell, D., Dorling, D. and Smith, G. D. (1999), ‘Ecological study of social fragmentation, poverty and suicide’, British Medical Journal, 319: 1034-1037.
Willetts, M. (2006), ‘Measuring child poverty using material deprivation: possible approaches’, Working paper No. 28, Department for Work and Pensions, HMSO, ISBN 1841239763.
M. Tomlinson, R. Walker and G. Williams, Measuring Poverty in Britain as a Multi-Dimensional Concept
29
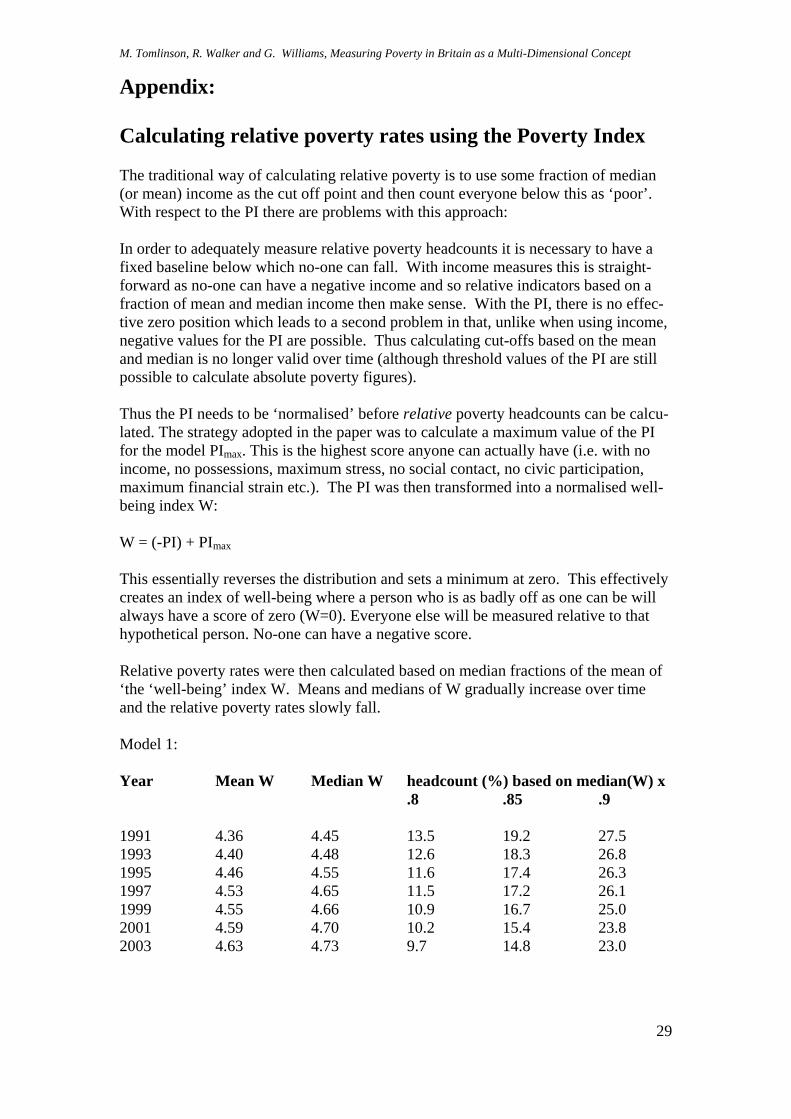
Appendix: Calculating relative poverty rates using the Poverty Index The traditional way of calculating relative poverty is to use some fraction of median (or mean) income as the cut off point and then count everyone below this as ‘poor’. With respect to the PI there are problems with this approach: In order to adequately measure relative poverty headcounts it is necessary to have a fixed baseline below which no-one can fall. With income measures this is straight-forward as no-one can have a negative income and so relative indicators based on a fraction of mean and median income then make sense. With the PI, there is no effec-tive zero position which leads to a second problem in that, unlike when using income, negative values for the PI are possible. Thus calculating cut-offs based on the mean and median is no longer valid over time (although threshold values of the PI are still possible to calculate absolute poverty figures). Thus the PI needs to be ‘normalised’ before relative poverty headcounts can be calcu-lated. The strategy adopted in the paper was to calculate a maximum value of the PI for the model PImax. This is the highest score anyone can actually have (i.e. with no income, no possessions, maximum stress, no social contact, no civic participation, maximum financial strain etc.). The PI was then transformed into a normalised well-being index W: W = (-PI) + PImax This essentially reverses the distribution and sets a minimum at zero. This effectively creates an index of well-being where a person who is as badly off as one can be will always have a score of zero (W=0). Everyone else will be measured relative to that hypothetical person. No-one can have a negative score. Relative poverty rates were then calculated based on median fractions of the mean of ‘the ‘well-being’ index W. Means and medians of W gradually increase over time and the relative poverty rates slowly fall. Model 1: Year Mean W Median W headcount (%) based on median(W) x .8 .85 .9 1991 4.36 4.45 13.5 19.2 27.5 1993 4.40 4.48 12.6 18.3 26.8 1995 4.46 4.55 11.6 17.4 26.3 1997 4.53 4.65 11.5 17.2 26.1 1999 4.55 4.66 10.9 16.7 25.0 2001 4.59 4.70 10.2 15.4 23.8 2003 4.63 4.73 9.7 14.8 23.0