Embed Size (px)
Citation preview

Mark Koetse
Department of Spatial EconomicsVrije Universiteit Amsterdam
Project A8
Consequences of climate change and weather conditions for the transport sector

2
Researchers
• Olaf Jonkeren ([email protected])• Muhammad Sabir ([email protected])• Mark Koetse ([email protected])• Jos van Ommeren ([email protected])• Piet Rietveld ([email protected])
3
Project A8: Three main lines of research
A. Literature survey climate change and transport
B. Climate change and road transport• Modal choice and speed• Traffic flow, congestion and traffic accidents
C1. Climate change and inland navigation• Economic loss due to changing water levels
C2. Climate change and inland navigation• Competitive position of the sector

4
General research strategy
1. Analyse impact of weather on transport sector
2. KNMI scenarios show impact of climate change on weather conditions
3. Assess impact of climate change on transport sector
5
A. Literature survey

6
General areas of research
• Weather and road accidents
• Weather and bicycle use
• Weather, traffic flow, and traffic speed
• Water level fluctuation and inland navigation
• Extreme events: Storms and flooding
• Air transport delays and accidents
7
Consequences for the transport sector
Road transport: Safety
• Decrease in number of wet days decreases accident frequency, increase in rainfall at wet days and extreme rainfall increases accident frequency
• Ambiguity with respect to accident severity as well
• Increase in frequency and duration of dry spells decreases road safety when it starts raining
8
Consequences for the transport sector
Road transport: Congestion
• Increase in number of wet days and rainfall at wet days in winter increases congestion
• Decrease in number of wet days in summer decreases congestion
• Increase in rainfall at wet days in summer increases congestion

9
Consequences for the transport sector
Rail transport
• Higher temperatures reduce failures due to icing but increase failures due to high temperatures
• Changes in maximum wind speed are small
Inland shipping
• Increase in frequency and duration of dry spells, implying higher prices and welfare losses
• Higher costs due to larger variation in water levels (increase in uncertainty)

10
Consequences for the transport sector
Air transport
• Relatively small impact as far as increases in maximum wind speed appear to be generally small
• Highly uncertain because it also depends on issues not in KNMI scenarios (e.g., visibility)
• Appears to depend to a great extent on changes in wind direction, which are uncertain and region specific
11
B. Climate change and road transport
12
Data sources
Central question: How does weather influence the mode choicedecisions of individuals?
Data: OVG 1996 (AVV)• More than 500,000 useable observations• Contain 77 variables on personal characteristics and trip
characteristics• Survey covers the entire Netherlands
Data: Weather Report 1996 (KNMI)• Hourly weather data for every day in 1996• Recorded by 39 stations, covering all 458 municipalities of the
Netherlands• Contains information on temperature, wind, precipitation and
sunlight

13
Model specification
Transport modes• Walking (reference category)• Bicycle• Car• Public transport (bus, tram, subways, train)• Other (moped, motor, scooter, taxi, truck)
Estimation methodMultinomial logit model

14
Main results
• Switch from bicycle to car under cold and extremely cold circumstances (4% to 8%)
• Switch from car to bicycle as temperatures increase above 10 °C (2% to 5%)
• For very high temperatures people switch back to car and public transport
• The effects of wind are small; the use of the bicycle decreases sharply at wind speeds higher than 6 Bft (around 4%)
• As precipitation increases, people reduce bicycle use and increase use of car and public transportation (around 3%)

15
Current and future research
• Weather and morning commute: Speed, trip delays and substitution among different modes
• Weather, congestion and road safety
Weather conditions
Congestion
Accident frequency and severity

16
C1. Climate change and inland navigation
17
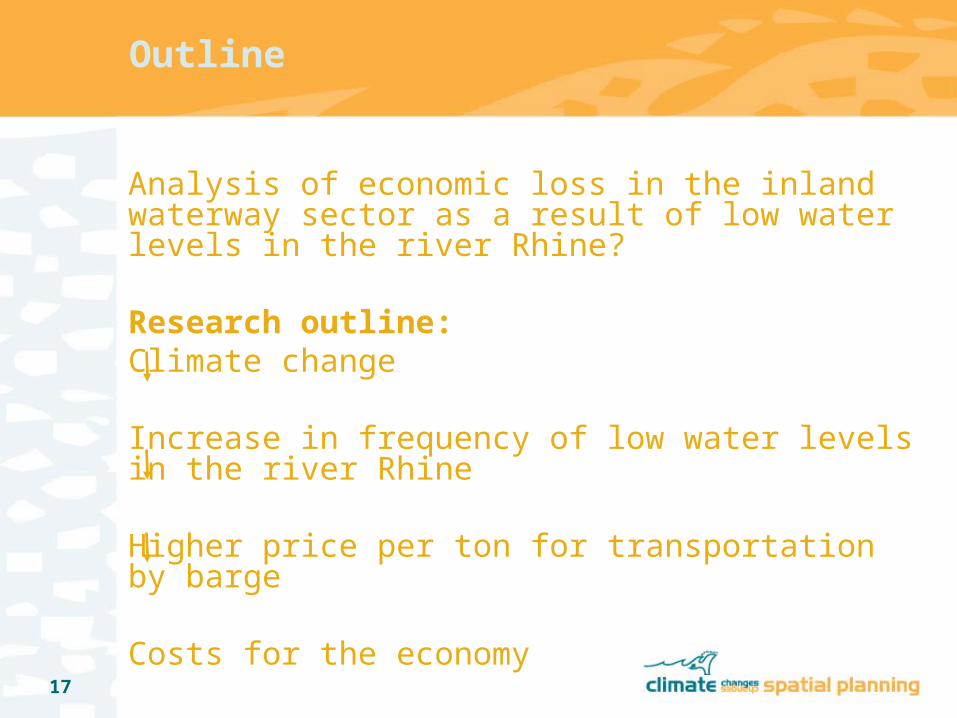
Outline
Analysis of economic loss in the inland waterway sector as a result of low water levels in the river Rhine?
Research outline:Climate change
Increase in frequency of low water levels in the river Rhine
Higher price per ton for transportation by barge
Costs for the economy

18
Model specification
RegressionDependent variables: price per ton, load factor, priceper trip (all in logarithm)
Explanatory variables• Time trend• Trip distance in logarithm• Ship size• Cargo type• Navigation direction & backhaul• Monthly dummies• Water level (Kaub)
19
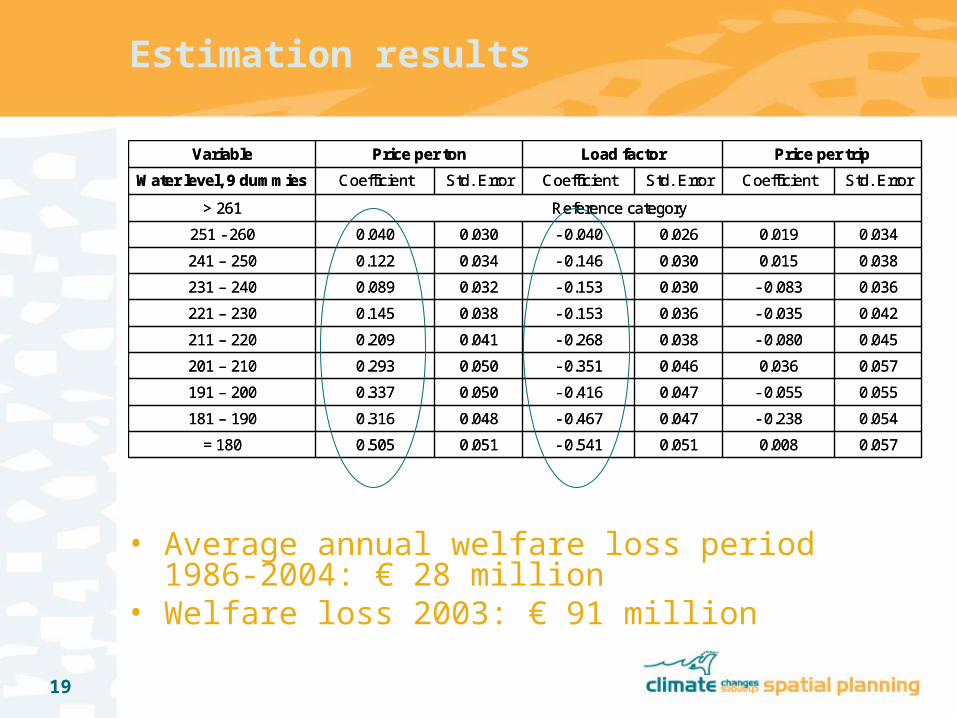
Estimation results
0.0570.0080.051- 0.5410.0510.505= 180
0.054- 0.2380.047- 0.4670.0480.316181 – 190
0.055- 0.0550.047- 0.4160.0500.337191 – 200
0.0570.0360.046- 0.3510.0500.293201 – 210
0.045- 0.0800.038- 0.2680.0410.209211 – 220
0.042- 0.0350.036- 0.1530.0380.145221 – 230
0.036- 0.0830.030- 0.1530.0320.089231 – 240
0.0380.0150.030- 0.1460.0340.122241 – 250
0.0340.0190.026- 0.0400.0300.040251 - 260
Reference category> 261
Std. ErrorCoefficientStd. ErrorCoefficientStd. ErrorCoefficientWater level, 9 dummies
Price per tripLoad factorPrice per tonVariable
• Average annual welfare loss period 1986-2004: € 28 million
• Welfare loss 2003: € 91 million

20
C2. Climate change and inland navigation

21
Model simulations
To what extend will the competitive position (in terms of tons) of inlandwaterway transport in the Kaub related Rhine market deteriorate as a result of climate change?
Model• NODUS: A GIS based software model which provides a tool for
detailed analysis of freight transportation over extensive multimodal networks
Inputs for NODUS• The infrastructure network (road, railroad, waterways) of Europe
(supply)• The transport flows between NUTS II regions in North West Europe
(demand) • Cost functions
Output NODUS• Estimates of the quantities that will be transported by each mode
annually

22
Climate scenarios
Reference situation is a year that has no restrictions due to low water levels
Base scenario: Normal water levels (average daily water levels 1986 – 1995)
Alternative scenarios: Climate scenarios from KNMI
Climate scenario Global temperatures Change atmospheric circulation
M +1 °C Weak
M+ +1 °C Strong
W +2 °C Weak
W+ +2 °C Strong
Table. KNMI climate scenarios

23
Simulation results
• W+ scenario as an example; Difference base scenario and W+ scenario:
• 103 days cost increase of 23.4% - 17.8% = 5.6%• 73 days cost increase of 23.4%• Weighted average of 13.1% cost increase over 176 days• No cost increases other transport modes
Climate scenario Base M M+ W W+
Average # of days with low water
103 100 139 99 176
Average % cost increase
17.8% 17.9% 19.9% 17.6% 23.4%
Table. Number of low water days and change in transport costs per ton for KNMI scenarios
24
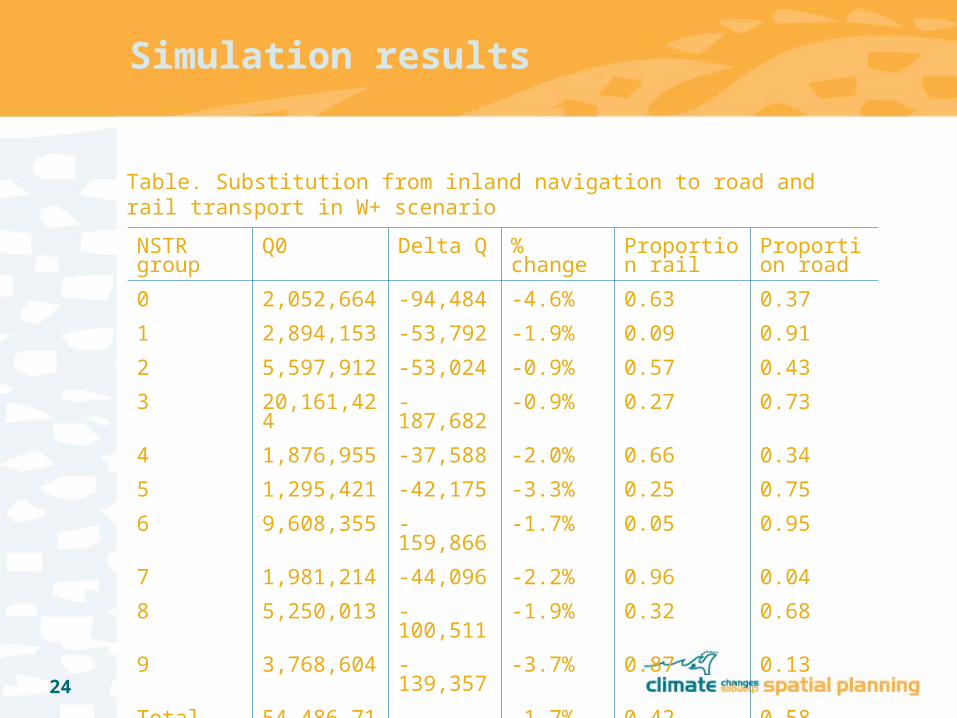
Simulation results
NSTR group
Q0 Delta Q % change
Proportion rail
Proportion road
0 2,052,664 -94,484 -4.6% 0.63 0.37
1 2,894,153 -53,792 -1.9% 0.09 0.91
2 5,597,912 -53,024 -0.9% 0.57 0.43
3 20,161,424 -187,682 -0.9% 0.27 0.73
4 1,876,955 -37,588 -2.0% 0.66 0.34
5 1,295,421 -42,175 -3.3% 0.25 0.75
6 9,608,355 -159,866 -1.7% 0.05 0.95
7 1,981,214 -44,096 -2.2% 0.96 0.04
8 5,250,013 -100,511 -1.9% 0.32 0.68
9 3,768,604 -139,357 -3.7% 0.87 0.13
Total (0-9) 54,486,716 -912,576 -1.7% 0.42 0.58
Table. Substitution from inland navigation to road and rail transport in W+ scenario

25
Conclusions
Literature survey• Empirical findings often difficult to compare in a quantitative way• Effects of weather (and climate change) are often ambiguous in
sign• Blind spots in knowledge, existing knowledge lacks robustness
Mode Choice• Most important pattern is substitution between car and bicycle
due to changes in temperature, rain and wind• Order of magnitude is between 2% and 10%, depending on the
magnitude of the change in weather
26
Conclusions
Inland waterway transport• Average annual economic loss due to low water levels in
1986-2004 period of € 21 million• Substitution of freight of around 2% from inland waterways to
road (share = 0.60) and rail (share = 0.40) transport

27
Research output
Koetse, Rietveld, 2007, Climate Change, Adverse Weather Conditions, and Transport: A Literature Survey, Department of Spatial Economics, Vrije Universiteit, Amsterdam.
Sabir, Koetse, Rietveld, 2007, The Impact of Weather Conditions on Mode Choice Decisions: Empirical Evidence for the Netherlands, Department of Spatial Economics, Vrije Universiteit, Amsterdam.
Jonkeren, Rietveld, Van Ommeren, 2006, Climate change and inland waterway transport: Welfare effects of low water levels on the river Rhine, Department of Spatial Economics, Vrije Universiteit, Amsterdam.
Jonkeren, Jourquin, Rietveld, 2006, Modal split effects of climate change: a study to the effect of low water levels on the competitive position of inland waterway transport, Department of Spatial Economics, Vrije Universiteit, Amsterdam.


![A8 A8 L A8 L W12 S8 - Freeelzouavo.gps.free.fr/Audi/A3_D3/Audi_A8_2009_usa_catalogue.pdf · Sport Package [A8, A8 L] 2. Audi adaptive air suspension-sport | As compared to the standard](https://img.pdfslide.us/doc/110x75/5b15d3e47f8b9a472e8b7d61/a8-a8-l-a8-l-w12-s8-sport-package-a8-a8-l-2-audi-adaptive-air-suspension-sport.jpg)