Embed Size (px)
Citation preview

Consumer- Retail October 25, 2011
Please see important disclosures on pages 14 to 16.
Rev(mil) 2011A 2012E 2013E Jun $63A $75A $79E Sep $176A $198E $210E Dec $152A $175E $183E Mar $73A $79E $83E
FY $465A $527E $555E P/Sales 0.65x 0.57x 0.54x
EPS 2011A 2012E 2013E Jun ($0.25)A ($0.13)A ($0.13)E Sep $0.97A $1.06E $1.18E Dec $0.50A $0.55E $0.61E Mar ($0.52)A ($0.49)E ($0.41)E
FY $0.70A $1.01E $1.26E P/E 23.8x 16.5x 13.2x
Price: $16.63 52-Week Range: $17.97-11.55 Target: $21.00 Rating: BUY
Shares Outstanding: 18.2 mil Mkt. Capitalization: $302 mil Ave. Volume: 107,000 Instit. Ownership: 77% BV / Share: $9.93 Debt / Tot. Cap.: 0% Est. LT EPS Growth: 22%
Feltl and Company Research Department 2100 LaSalle Plaza
800 LaSalle Avenue Minneapolis, MN 55402
1.866.655.3431 Mark E. Smith
[email protected] | 612.492.8806
Company Description: Arctic Cat Inc. designs, engineers, manufactures and markets snowmobiles and off-road vehicles including ATV’s and side-by-sides. In addition to power sports vehicles, the company also sells parts, garments and accessories. The company was founded in 1961 and is headquartered in Thief River Falls, MN
Arctic Cat Inc.
Initiating coverage with a BUY rating and $21 price target (ACAT - $16.63) BUY
Key Points
Financial Summary
Arctic Cat (ACAT) is expanding its Off-Road Vehicle (ORV) lineup and taking market share. An emphasis on gaining ORV market share in F2012 has potential to boost results. ACAT launched its ORV business in 1995 with ATV’s (four wheelers), and expanded into the Side x Side (SxS) market in 2006 with the launch of its Prowler product. We think SxS’s are becoming a more significant piece of ACAT’s earnings and are certainly the focus for growth given the dismal results in the ATV industry. The newest product launch, the Wildcat 1000, is ACAT’s first foray into the recreational SxS market. We think this market is attractive as consumers migrate from recreational ATV’s into SxS’s. Recreational users are the largest users of both ATV’s and SxS’s compared to farming/ranching, hunting/fishing and other users.
New snowmobile line-up boosts near-term growth opportunities. ACAT’s 2012 snowmobile lineup is made up of 75% new products. ACAT is currently third in snowmobile market share (just barely behind Polaris) and we think they can compete for the leading position. ACAT’s customers are fiercely loyal and “bleed green”. With new products and a very diverse assortment, we think ACAT has a strong market share position and can take market share if customers move more towards four stroke engines (four strokes comprise approximately 50% of ACAT’s snowmobile lineup, but are only about 25% of industry sales).
International growth is an opportunity for ACAT. International sales (non-North America) are currently about 17% of ACAT’s revenue, and we think that number can grow. Most of the international sales come from snowmobiles in Russia and Scandinavian countries, but we think sales will grow as the company spreads geographically and begins to showcase more ORV products oversees. We think that most ACAT ORV customers were snowmobile fans first and leveraging the brand strength in international markets will boost sales.
Top-line growth with a watchful eye on margins will lead to strong earnings growth. The power sports industry has been extremely difficult with total sales declining 34% since 2008. ACAT saw sales decline over 27% from F2008-F2010, but increased 3.1% last year and we expect 13.5% growth this year. The decline of the ATV business impacted ACAT significantly, as ATV’s were approximately 56% of sales in F2008 and were 39% of sales last year. As ACAT offers a strong line-up of new products in all categories, we expect sustainable growth throughout the company. Additionally, ACAT is focused on controlling costs and has managed inventories more successfully while boosting gross profit margin and increasing earnings. We think following the “blocking and tackling” of being a power sports company will lead to strong earnings growth in F2012 and F2013
INVESTMENT THESIS We are initiating coverage with a BUY rating and $21 price target. We are encouraged by the strong recent results and think ACAT is poised to begin a strong double-digit earnings growth trend. With a clean balance sheet and improving cash flow, ACAT has ample “dry powder” to invest in future growth and to protect itself if the environment turns unfavorable again. We derive our $21 price target by applying a 17x multiple to our F2013 EPS estimate of $1.26. Our multiple is inline with the historical multiple and a discount to our earnings growth rate of 22%. Our target implies an approximate 5.5x EV/EBITDA multiple. We are initiating coverage with a BUY rating.

October 25, 2011
Feltl and Company Research Department Arctic Cat Inc. (ACAT) Page 2
Company Overview Arctic Cat is a Minnesota corporation based in Thief River Falls, MN. Arctic Cat specializes in the design, engineering, manufacturing and marketing of snowmobiles and off-road vehicles (ORV) as well as related parts, garments, and accessories. The brand is sold using independent dealers all over the United States, Canada and Europe as well as using distributors representing dealers in Europe, South America, the Middle East, Asia and other international markets. Started in 1961, Arctic Cat has been a notable name in the snowmobile and ATV industry. Over the five years prior to 2011, company revenue has declined at an average annual rate of 8.5%. This is mainly due to three consecutive years of declines caused by challenging retail market conditions during the recession. During the three years through F2011, the company has focused on reducing dealer inventories and gaining market share. As a result the company was able to improve operating results in F2011 and return to profitability despite still weakening market conditions. By the beginning of F2012 the company had reduced dealer snowmobile inventories by 54% and ATV inventories by 24%, a factor which is greatly expected to help company-wide sales throughout the year.
F2011 Revenue By Business Unit
PG&A 22.0%
Snowmobiles 39.0%
ATVs/SxSs 39.0%
Source: Company Reports
Products Snowmobiles
Arctic Cat produces a line of snowmobiles that consists of 31 different models. Started by snowmobile pioneer Edgar Hetteen, Arctic Cat quickly became an innovative leader in the snowmobile industry. They were the first to utilize the four stroke engine which reduces emissions as well as being responsible for creating the most powerful production snowmobile engine ever. For model year 2012 there are 23 all new models or 75% of the 2012 model line-up with an exclusive new chassis, suspension, drive and braking technologies. In addition, the company has also focused more on developing its 4-stroke engines for model year 2012. For 2012 there is a 50/50 mix of 2-stroke and 4-stroke engines. The Company's snowmobile models are categorized as Performance, Mountain, Crossover, Touring, Family Trail/Youth and Utility. They are priced competitively with a range of $6,999 to $14,999 for the 2012 models, excluding the youth model which is priced at $2,649. With sales occurring in the United States, Canada, Scandinavia, and Russia, snowmobiles make up roughly 39% of Arctic Cat’s total sales.
October 25, 2011
Feltl and Company Research Department Arctic Cat Inc. (ACAT) Page 3
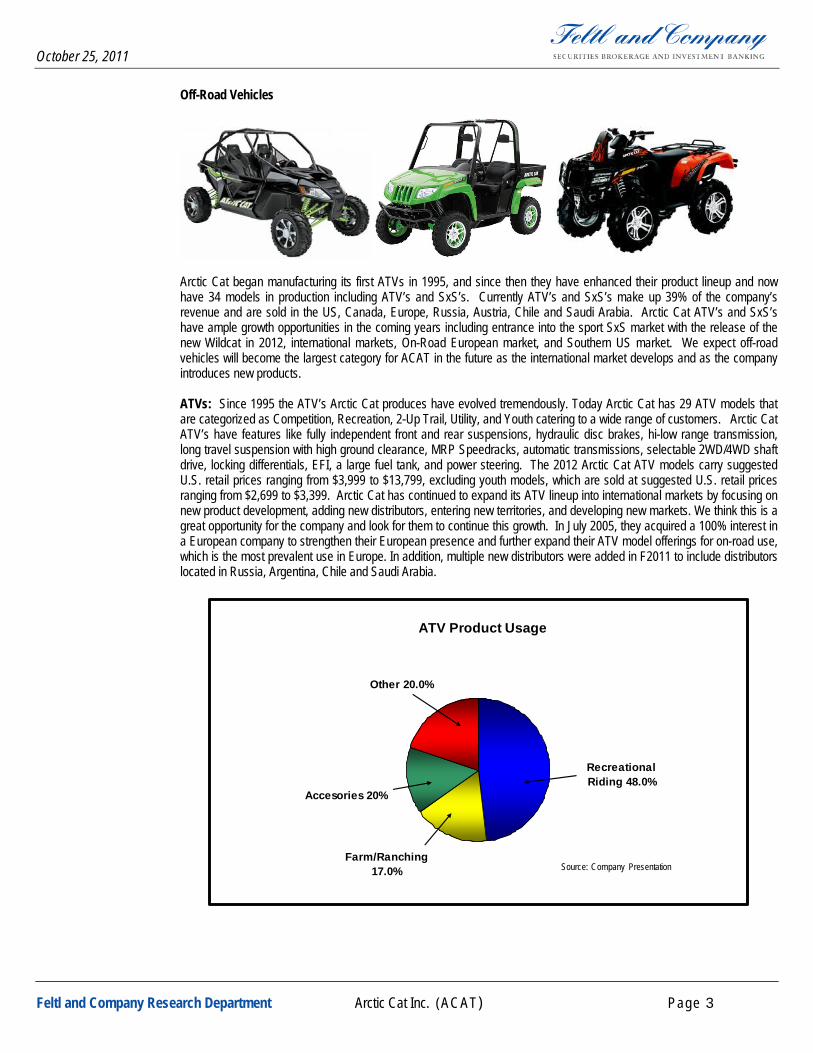
Off-Road Vehicles
Arctic Cat began manufacturing its first ATVs in 1995, and since then they have enhanced their product lineup and now have 34 models in production including ATV’s and SxS’s. Currently ATV’s and SxS’s make up 39% of the company’s revenue and are sold in the US, Canada, Europe, Russia, Austria, Chile and Saudi Arabia. Arctic Cat ATV’s and SxS’s have ample growth opportunities in the coming years including entrance into the sport SxS market with the release of the new Wildcat in 2012, international markets, On-Road European market, and Southern US market. We expect off-road vehicles will become the largest category for ACAT in the future as the international market develops and as the company introduces new products. ATVs: Since 1995 the ATV’s Arctic Cat produces have evolved tremendously. Today Arctic Cat has 29 ATV models that are categorized as Competition, Recreation, 2-Up Trail, Utility, and Youth catering to a wide range of customers. Arctic Cat ATV’s have features like fully independent front and rear suspensions, hydraulic disc brakes, hi-low range transmission, long travel suspension with high ground clearance, MRP Speedracks, automatic transmissions, selectable 2WD/4WD shaft drive, locking differentials, EFI, a large fuel tank, and power steering. The 2012 Arctic Cat ATV models carry suggested U.S. retail prices ranging from $3,999 to $13,799, excluding youth models, which are sold at suggested U.S. retail prices ranging from $2,699 to $3,399. Arctic Cat has continued to expand its ATV lineup into international markets by focusing on new product development, adding new distributors, entering new territories, and developing new markets. We think this is a great opportunity for the company and look for them to continue this growth. In July 2005, they acquired a 100% interest in a European company to strengthen their European presence and further expand their ATV model offerings for on-road use, which is the most prevalent use in Europe. In addition, multiple new distributors were added in F2011 to include distributors located in Russia, Argentina, Chile and Saudi Arabia.
ATV Product Usage
Recreational Riding 48.0%
Farm/Ranching 17.0%
Accesories 20%
Other 20.0%
Source: Company Presentation

October 25, 2011
Feltl and Company Research Department Arctic Cat Inc. (ACAT) Page 4
Side x Side Vehicles: Arctic Cat introduced their first SxS vehicle into the utility segment in 2006 with the Prowler. Today the Prowler is configured into four different models with engines that range in size from 550cc to 1000cc. The Prowler is a true multipurpose recreational vehicle that appeals to many different customers including farmers, ranchers, hunters, fishermen, and trail riders. Features include a rear cargo box, dual bucket seats as well as long travel suspension and smooth ride characteristics. In 2011 Arctic Cat launched its first heavy-duty utility SxS vehicle, the Prowler HDX, with an extended chassis, extra large cargo box, bench seating and power steering standard. In F2011 the SxS line-up had retail prices of $10,999 to $15,599. Arctic Cat brings more excitement in 2012 with the release of their new Wildcat sport SxS. The 2012 Arctic Cat Wildcat 1000i H.O. has largest engine displacement and suspension travel yet seen on a production sport SxS. The much anticipated Wildcat hopes to launch Arctic Cat into the rapidly growing sport SxS market. Production and shipping is expected November or December of 2011. We expect the SxS product usage will start to reflect ATV product usage and recreational riders will become a larger segment of the riding population and the Wildcat will help Arctic Cat gain some of that business.
SxS Product Usage
Recreational Riding 31.0%
Farm/Ranching 26.0%
Accesories 20%
Other 25.0%
Source: Company Presentation
Parts, Garments and Accessories
Arctic Cat is a provider of Arctic Cat Snowmobile, ATV and SxS parts, garments and accessories. Provided accessories include bumpers, cabs, luggage racks, lights, snow plows, backrests, windshields, wheels, track systems, and winch kits. These products are marketed toward the consumer whom either wants to increase their comfort factor, shorten their task or personalize their ATV or snowmobile. Arctic Cat also provides replacement parts for all of their current and noncurrent models of Snowmobiles, ATV’s and SxS’s as well as oil and fuel additives. Another division of this sector is garments. Arctic Cat sells under three labels, Arcticwear, Drift Racing, and Arcticwear ATV Gear. Both Arcticwear and Drift Racing are garment labels specializing in snowmobile gear. They include insulated outerwear, hats, mittens, helmets, boots, sweatshirts, T-shirts, casual wear, insulated jackets, and down filled parkas. Arcticwear ATV Gear includes suits, jackets, gloves, helmets, gear bags, sweatshirts, T-shirts, and caps. Overall the Parts, Garments and Accessories sector makes up 22% of company revenue. We think that SxS’s will become a larger piece of Arctic Cat’s revenue and this will drive more accessory sales which are high margin products.

October 25, 2011
Feltl and Company Research Department Arctic Cat Inc. (ACAT) Page 5
PG&A Sales Mix
Garments 11.0%
Accesories 20%
Oil 8.0% Parts 61.0%
Source: Company Presentation
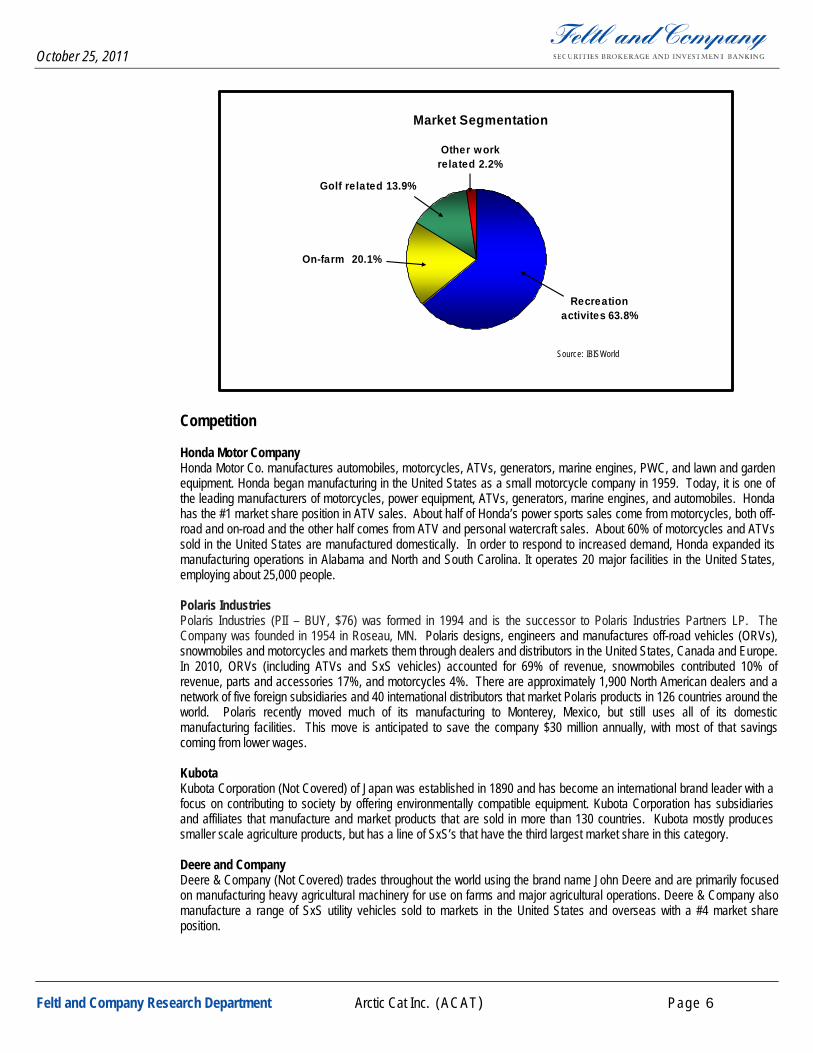
Industry Background Arctic Cat operates in the outdoor power sports industry. According to IBISWorld the industry has revenues of over $8 billion when including ATV’s, snowmobiles, jet ski’s, and golf carts. The industry is highly influenced by the consumer environment and also weather conditions. Other factors that affect the industry are leisure time and farm incomes. Over the past few years due to the economic environment the industry has been working against some headwinds, but has allowed companies with product innovation and strong financial strength to gain market share from competitors. An area for strong growth in the industry is in SxS ORV products. These vehicles allow for two or more riders and provide greater functionality in everyday use. The SxS market also appeals to the military market for short range transportation due to the low costs and maneuverability. The competition in the SxS market is quickly accelerating due to the high demand from customers for vehicles for both work and play. According to IBISWorld industry revenue is expected to increase yearly by an average of 2.9% from 2011-2015 due to a turn during that time in the overall economy.
Industry Category Revenue
Golf Carts 9.5%
Snowmobiles 10.5%
Motorcyles 31.2%
Off-Road Vehicles 42.7%
Personal Watercrafts 4.1% Other 2.0%
Source: IBISWorld
October 25, 2011
Feltl and Company Research Department Arctic Cat Inc. (ACAT) Page 6
Market Segmentation
Recreation activites 63.8%
On-farm 20.1%
Golf related 13.9%
Other work related 2.2%
Source: IBISWorld
Competition Honda Motor Company Honda Motor Co. manufactures automobiles, motorcycles, ATVs, generators, marine engines, PWC, and lawn and garden equipment. Honda began manufacturing in the United States as a small motorcycle company in 1959. Today, it is one of the leading manufacturers of motorcycles, power equipment, ATVs, generators, marine engines, and automobiles. Honda has the #1 market share position in ATV sales. About half of Honda’s power sports sales come from motorcycles, both off-road and on-road and the other half comes from ATV and personal watercraft sales. About 60% of motorcycles and ATVs sold in the United States are manufactured domestically. In order to respond to increased demand, Honda expanded its manufacturing operations in Alabama and North and South Carolina. It operates 20 major facilities in the United States, employing about 25,000 people. Polaris Industries Polaris Industries (PII – BUY, $76) was formed in 1994 and is the successor to Polaris Industries Partners LP. The Company was founded in 1954 in Roseau, MN. Polaris designs, engineers and manufactures off-road vehicles (ORVs), snowmobiles and motorcycles and markets them through dealers and distributors in the United States, Canada and Europe. In 2010, ORVs (including ATVs and SxS vehicles) accounted for 69% of revenue, snowmobiles contributed 10% of revenue, parts and accessories 17%, and motorcycles 4%. There are approximately 1,900 North American dealers and a network of five foreign subsidiaries and 40 international distributors that market Polaris products in 126 countries around the world. Polaris recently moved much of its manufacturing to Monterey, Mexico, but still uses all of its domestic manufacturing facilities. This move is anticipated to save the company $30 million annually, with most of that savings coming from lower wages.
Kubota Kubota Corporation (Not Covered) of Japan was established in 1890 and has become an international brand leader with a focus on contributing to society by offering environmentally compatible equipment. Kubota Corporation has subsidiaries and affiliates that manufacture and market products that are sold in more than 130 countries. Kubota mostly produces smaller scale agriculture products, but has a line of SxS’s that have the third largest market share in this category. Deere and Company Deere & Company (Not Covered) trades throughout the world using the brand name John Deere and are primarily focused on manufacturing heavy agricultural machinery for use on farms and major agricultural operations. Deere & Company also manufacture a range of SxS utility vehicles sold to markets in the United States and overseas with a #4 market share position.
October 25, 2011
Feltl and Company Research Department Arctic Cat Inc. (ACAT) Page 7
Kawasaki Kawasaki (Not Covered) produces motorcycles, jet skis, ATV’s and cars. Kawasaki’s motorcycles include the Ninja sport bikes, and cruisers, dual-purpose and motocross motorcycles, as well as utility vehicles, ATV’s and general-purpose gasoline engines. Kawasaki’s worldwide annual revenue tops $1.6 billion. There are approximately 1,500 dealers. Kawasaki has a manufacturing facility in Lincoln, Nebraska and a small engine manufacturing plant in Maryville, Missouri. Yamaha Yamaha (Not Covered) produces snowmobiles, golf carts, jet skis and ATV’s, and motorcycle products. The company was established in 1955, it is a multinational company with a presence in 35 countries with 60 manufacturing facilities worldwide. Yamaha also offers a line of apparel and gift merchandise. BRP Inc. BRP Inc. (Not Covered) is a Canada-based company that produces power sports equipment such as, ATVs, SxS’s, the Ski-Doo/Lynx snowmobiles, Sea-Doo PWC and boats, Can-Am Spyder motorcycle and a range of engines and motors with a variety of uses. The company is a prominent operator in the ATV and other transport equipment industry, and it has no direct manufacturing facilities in the United States. Suzuki Motors Suzuki Motor Corporation (Not Covered) is a Japanese multinational corporation headquartered in Hamamatsu, Japan that specializes in manufacturing compact automobiles and 4x4 vehicles, a full range of motorcycles, ATV’s, outboard marine engines, wheelchairs and a variety of other small internal combustion engines. Suzuki employs over 45,000 people, has 35 main production facilities in 23 countries and 133 distributors in 192 countries. Suzuki also produces the snowmobile engines for Arctic Cat.
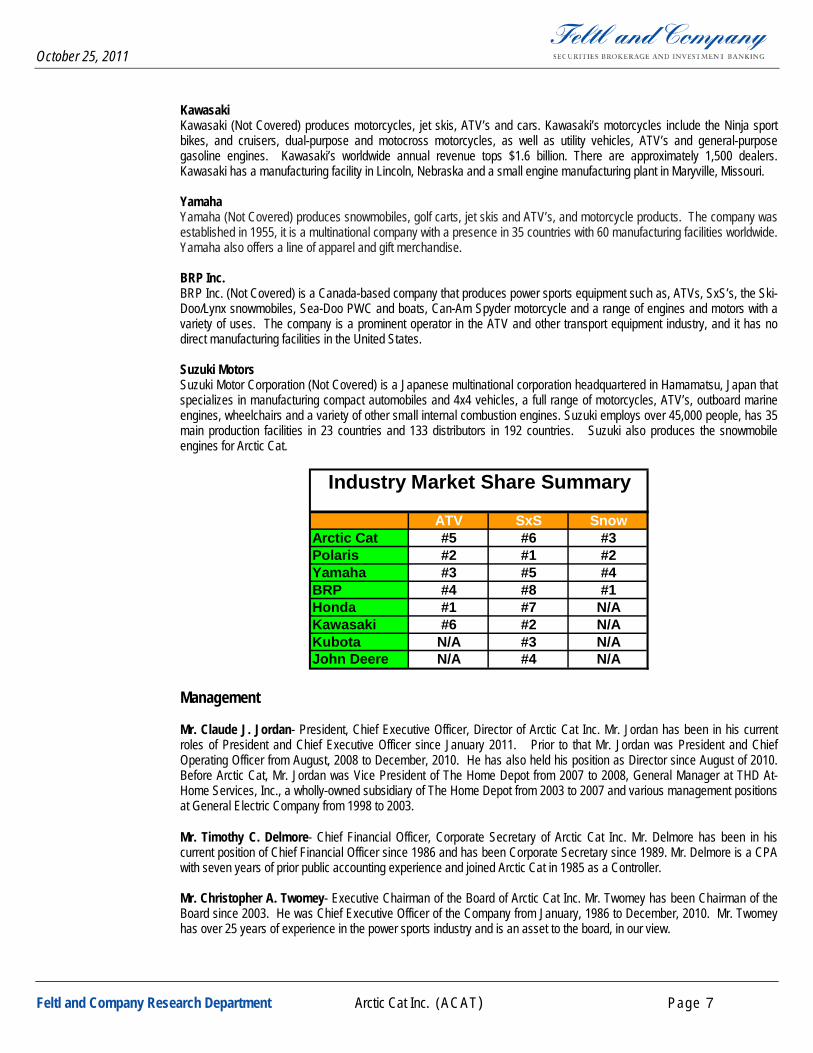
ATV SxS SnowArctic Cat #5 #6 #3Polaris #2 #1 #2Yamaha #3 #5 #4BRP #4 #8 #1Honda #1 #7 N/AKawasaki #6 #2 N/AKubota N/A #3 N/AJohn Deere N/A #4 N/A
Industry Market Share Summary
Management Mr. Claude J. Jordan- President, Chief Executive Officer, Director of Arctic Cat Inc. Mr. Jordan has been in his current roles of President and Chief Executive Officer since January 2011. Prior to that Mr. Jordan was President and Chief Operating Officer from August, 2008 to December, 2010. He has also held his position as Director since August of 2010. Before Arctic Cat, Mr. Jordan was Vice President of The Home Depot from 2007 to 2008, General Manager at THD At-Home Services, Inc., a wholly-owned subsidiary of The Home Depot from 2003 to 2007 and various management positions at General Electric Company from 1998 to 2003. Mr. Timothy C. Delmore- Chief Financial Officer, Corporate Secretary of Arctic Cat Inc. Mr. Delmore has been in his current position of Chief Financial Officer since 1986 and has been Corporate Secretary since 1989. Mr. Delmore is a CPA with seven years of prior public accounting experience and joined Arctic Cat in 1985 as a Controller. Mr. Christopher A. Twomey- Executive Chairman of the Board of Arctic Cat Inc. Mr. Twomey has been Chairman of the Board since 2003. He was Chief Executive Officer of the Company from January, 1986 to December, 2010. Mr. Twomey has over 25 years of experience in the power sports industry and is an asset to the board, in our view.

October 25, 2011
Feltl and Company Research Department Arctic Cat Inc. (ACAT) Page 8
Growth Strategy New Products Arctic Cat has focused on releasing new, innovative products to meet and drive consumer demand. New models in snowmobiles make up 75% of this years lineup and we expect continued innovation in snowmobiles. Approximately 50% of Arctic Cat’s snowmobiles are four strokes which we think will become a larger percent of the industry (it is currently about 25% of new snowmobiles sold in North America). We think as environmental regulations become more stringent that many consumers will be forced to ride four stroke engines and like that Arctic Cat is proactively managing its product offerings for future demands. After riding some of the four stroke snowmobiles, we are impressed with how far the technology has come in reducing weight and improving power. We think the exciting growth story at Arctic Cat is its new product launches in ORV and primarily SxS’s. Arctic Cat entered the SxS market in 2006 with the Prowler, a utility focused SxS. Arctic Cat has expanded the Prowler line to three distinct offerings including a three passenger vehicle. We think multi passenger vehicles are in high demand and expect more product offerings from Arctic Cat in the future. Arctic Cat is in the midst of the launch of the Wildcat, the company’s first recreational focused SxS. Announced in April of this year, the Wildcat is a 1000cc, high performance machine that is geared towards high performance recreational riders. Priced at +$16,000 this is a high-end SxS that competes with the Polaris RZR 900 XP and the Can-Am Commander 1000. All of these SxS’s have premium pricing, typically $15,000+, and ample power, suspension, and other bells and whistles for sport riding enthusiasts. We think the Wildcat can take market share in the recreational market without cannibalizing the “work/utility” sales. We think the Wildcat will increase Arctic Cat’s geographic presence as customers in the Southern states purchase these machines and Arctic Cat gains more brand awareness; Arctic Cat has strong brand Awareness in Northern states and Rocky Mountain states due to its snowmobile business but consumers in other states are not as familiar with the brand. We think the recreational product line will expand at Arctic Cat as the Wildcat gains share and expect the recreational SxS market to replace sales lost in the weak ATV market. We envision recreational side by sides making up half of Arctic Cat’s SxS sales in the future. Although the ATV industry is declining, Arctic Cat proactively launched value priced products this year to court customers on a budget. The 350 and 425 models are attractively priced and could take share at the lower end of the market. Despite the declining industry trends, Arctic Cat took market share in F2011 in ATV’s and expects to gain more share in F2012. We think innovative and diverse products have helped boost market share. Additionally, we think the European on-road ATV business (a billion dollar market) is an opportunity for Arctic Cat and they will introduce more products to address this market. PG&A is another opportunity for Arctic Cat to introduce more products and increase sales. Parts is the biggest piece of the PG&A pie at 61% and we think as new models are introduced that this business can grow in dollars, but we expect will shrink as a percent of total PG&A sales. Garments and Accessories, 11% and 20% of PG&A sales, respectively, are the best opportunities for sales growth through new product introduction. In Garments, Arctic Cat launched its Drift Racing garment line in 2011 and offers an expanded line of Arcticwear garments in 2012. We think the Accessories business will grow with the growing side by side business. With both utility and recreational SxS’s we think there is a great opportunity to drive add-on sales of accessories such as cabs, windshields, winches, gun racks, etc. This high margin business is attractive and we expect it will make up a larger percentage of Arctic Cat’s PG&A sales going forward. Manage Factory and Dealer Inventories Arctic Cat has made a concerted effort to reduce factory and dealer inventories to reduce costs and improve efficiencies. Factory inventories declined $20mm last year, over 24%, and have been cut in half since F2008. Although much of this reduction is due to declining sales and production in ATV’s, we are encouraged by Arctic Cat running leaner production. The company has worked closely with its dealers to streamline the ordering process and reduce inventories and future discounting. We think dealers have welcomed these changes and dealer inventories in ATV’s declined 21% in F2011 and declined 53% since F2008. We think there is still some more work to do in streamlining the process and keeping dealers healthy and happy, but we are encouraged with the current results. Improving Gross and Operating Margins Through the recession Arctic Cat focused on reducing costs of its machines, running more efficient manufacturing facilities, and managing prices of its machines. The focus on reducing costs helped boost gross margin to 21.8% in F2011 from 14.8% in F2009 despite pressure from currencies, primarily the Yen, and higher commodity costs. We think commodity costs will continue to be an issue for Arctic Cat, but have been impressed with the company’s ability to hedge costs. We

October 25, 2011
Feltl and Company Research Department Arctic Cat Inc. (ACAT) Page 9
think the company has an opportunity to raise prices on its higher-end products without alienating customers. With the launch of the Wildcat and other high-performance products, we think Arctic Cat can gain more share in the high end of the market and price its products accordingly. Management has focused on operating expenses as well and has lowered operating expenses. Operating expenses improved over 20 bps in F2011. We think Arctic Cat has an opportunity to expand margins further beginning in F2014 as it moves snowmobile engine production in-house. Snowmobile engines are currently manufactured by Suzuki and are shipped from Japan. Arctic Cat currently manufactures its ATV and SxS engines in its new facility in St. Cloud, MN and will use the same facility in F2014 for snowmobile engines. We view this as a great opportunity as the company will control its own destiny with regards to manufacturing and quality control and will be able to reduce costs. There is ample capacity at the current facility for this transition. International Sales We view expanding sales in international markets as the best opportunity for Arctic Cat to improve long term sales growth. International sales (those not in North America) are currently 17% of total revenue. Most of the international sales come from snowmobile sales in Scandinavian countries and Russia. We think Arctic Cat has potential to increase snowmobile sales in the countries it currently has strength in and to expand geographically, especially in Europe. The company’s strong line-up of four stroke engines may help its international growth. SxS and ATV markets have ample growth opportunities in international markets. We think that European and other international markets are beginning to transition from ATV’s to SxS’s, similar to the transition that has taken place domestically. With an expanding assortment of side by sides and a new recreational product, we think Arctic Cat is well positioned to take advantage of this trend. Developing nations are a distinct opportunity and we think more can be done to increase sales in China, India, Brazil and other nations. Lastly, we think the on-road ATV market in Europe is an opportunity to increase sales. This is a billion dollar market that Arctic Cat does not have significant share in. We think product development and utilizing the company’s strong European dealer network will help Arctic Cat boost sales in this market. Balance Sheet and Cash Flow Arctic Cat’s improving sales, the focus on improving inventory levels and effective use of cash have helped boost the balance sheet. ACAT has no debt and has increased its cash plus short term investments position to $99mm from $11mm at the end of F2009. The clean balance sheet gives ACAT the opportunity to invest in new technologies, strategic alliances, new facilities and machinery or perhaps acquisitions, when the opportunities arise. We think ACAT is well positioned to invest in growth and has more relative safety if consumer demand declines. Cash flow has improved with the improving sales and earnings. Cash flow from operations in 1Q:F12 was the highest in six quarters and the lower inventory levels have helped boost cash flow from operations. In difficult times ACAT reduced capital expenditures to an average of approximately $11mm over the last three years, but we expect an increase this year to about $17.5mm. Management has begun to use some of the cash flow to repurchase company shares, $2.4mm in F2011 and $1.9mm in 1Q:12. We think share repurchases could be a larger use of funds going forward. Recent Results ACAT reported strong F2011 sales and earnings growth, 3.1% sales growth following three consecutive years of declines and EPS increased to $0.70 from $0.10 in F2010. ACAT faced a tough economic environment with high unemployment and low consumer confidence and spending over the last four years. We are encouraged by the improving results despite a still difficult environment and think ACAT is poised for more improvements even if the environment doesn’t improve substantially. In 1Q:12 ACAT reported sales growth of 18.2% with all categories producing sales growth, but most of the growth came from Off-road which grew sales 36.2%. ACAT leveraged the higher sales with gross margins improving 210 bps year over year and loss per share being cut to ($0.13), from ($0.25) the prior year (1Q is a seasonally weaker quarter). ACAT shares have gained significantly from their lows in early 2009 of less than $3.00 to over $16.00 today. 2Q:12 Earnings Preview ACAT reports 2Q:12 results on October 27th before the market open and management will host a conference call to discuss results the same day at 10:30 a.m. Central. We project revenue of $198mm, gross margin of 28.4% and EPS of $1.06. Our revenue estimates are slightly higher than the consensus average as we think the snowmobile sales are strong, but we think the high number of new models may have pushed some of the new models being shipped, and therefore revenue recognition, into 3Q:12. Our margin assumptions are lower than prior-year results due to high commodity costs,
October 25, 2011
Feltl and Company Research Department Arctic Cat Inc. (ACAT) Page 10
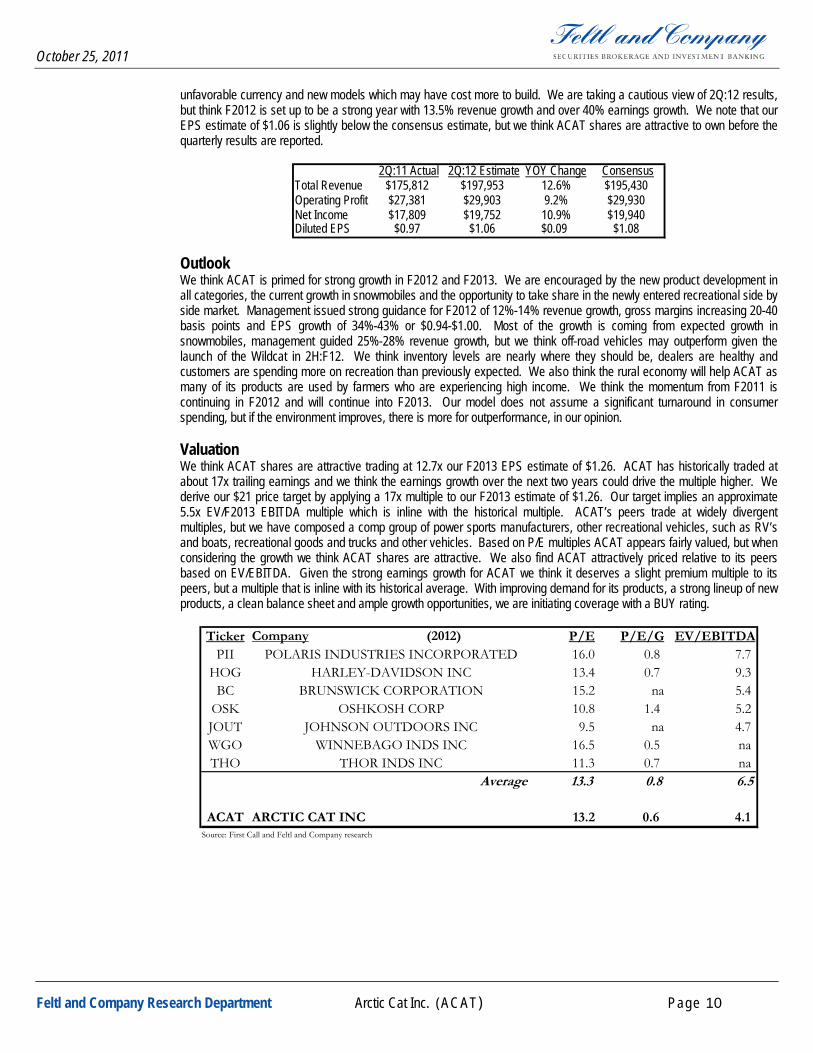
unfavorable currency and new models which may have cost more to build. We are taking a cautious view of 2Q:12 results, but think F2012 is set up to be a strong year with 13.5% revenue growth and over 40% earnings growth. We note that our EPS estimate of $1.06 is slightly below the consensus estimate, but we think ACAT shares are attractive to own before the quarterly results are reported.
2Q:11 Actual 2Q:12 Estimate YOY Change ConsensusTotal Revenue $175,812 $197,953 12.6% $195,430Operating Profit $27,381 $29,903 9.2% $29,930Net Income $17,809 $19,752 10.9% $19,940Diluted EPS $0.97 $1.06 $0.09 $1.08
Outlook We think ACAT is primed for strong growth in F2012 and F2013. We are encouraged by the new product development in all categories, the current growth in snowmobiles and the opportunity to take share in the newly entered recreational side by side market. Management issued strong guidance for F2012 of 12%-14% revenue growth, gross margins increasing 20-40 basis points and EPS growth of 34%-43% or $0.94-$1.00. Most of the growth is coming from expected growth in snowmobiles, management guided 25%-28% revenue growth, but we think off-road vehicles may outperform given the launch of the Wildcat in 2H:F12. We think inventory levels are nearly where they should be, dealers are healthy and customers are spending more on recreation than previously expected. We also think the rural economy will help ACAT as many of its products are used by farmers who are experiencing high income. We think the momentum from F2011 is continuing in F2012 and will continue into F2013. Our model does not assume a significant turnaround in consumer spending, but if the environment improves, there is more for outperformance, in our opinion. Valuation We think ACAT shares are attractive trading at 12.7x our F2013 EPS estimate of $1.26. ACAT has historically traded at about 17x trailing earnings and we think the earnings growth over the next two years could drive the multiple higher. We derive our $21 price target by applying a 17x multiple to our F2013 estimate of $1.26. Our target implies an approximate 5.5x EV/F2013 EBITDA multiple which is inline with the historical multiple. ACAT’s peers trade at widely divergent multiples, but we have composed a comp group of power sports manufacturers, other recreational vehicles, such as RV’s and boats, recreational goods and trucks and other vehicles. Based on P/E multiples ACAT appears fairly valued, but when considering the growth we think ACAT shares are attractive. We also find ACAT attractively priced relative to its peers based on EV/EBITDA. Given the strong earnings growth for ACAT we think it deserves a slight premium multiple to its peers, but a multiple that is inline with its historical average. With improving demand for its products, a strong lineup of new products, a clean balance sheet and ample growth opportunities, we are initiating coverage with a BUY rating.
Ticker Company (2012) P/E P/E/G EV/EBITDAPII POLARIS INDUSTRIES INCORPORATED 16.0 0.8 7.7
HOG HARLEY-DAVIDSON INC 13.4 0.7 9.3 BC BRUNSWICK CORPORATION 15.2 na 5.4
OSK OSHKOSH CORP 10.8 1.4 5.2 JOUT JOHNSON OUTDOORS INC 9.5 na 4.7 WGO WINNEBAGO INDS INC 16.5 0.5 naTHO THOR INDS INC 11.3 0.7 na
Average 13.3 0.8 6.5
ACAT ARCTIC CAT INC 13.2 0.6 4.1 Source: First Call and Feltl and Company research

October 25, 2011
Feltl and Company Research Department Arctic Cat Inc. (ACAT) Page 11
Arctic Cat Income StatementFiscal Year Jun-10 Sep-10 Dec-10 Mar-11 Fiscal Year Jun-11 Sep-11 Dec-11 Mar-12 Fiscal Year Jun-12 Sep-12 Dec-12 Mar-13 Fiscal Year
$ in thousands except per share amounts 2010A Q1 A Q2 A Q3 A Q4 A 2011A Q1 A Q2 E Q3 E Q4 E 2012E Q1 E Q2 E Q3 E Q4 E 2013E
ATV sales 187,953 27,833 56,641 48,559 48,017 181,050 37,899 52,110 50,356 49,986 190,350 39,225 57,581 53,629 51,885 202,321
Snowmobile sales 162,918 17,105 91,525 77,822 (4,487) 181,965 17,361 116,511 97,433 (1,885) 229,421 19,410 121,521 100,746 (1,922) 239,755
PG&A sales 99,857 18,468 27,646 25,595 29,927 101,636 19,670 29,332 27,361 31,124 107,488 20,457 30,418 28,729 33,365 112,969
Revenue 450,728 63,406 175,812 151,976 73,457 464,651 74,930 197,953 175,150 79,225 527,259 79,092 209,520 183,104 83,328 555,044
Cost of Sales
Snowmobile and ATV 309,217 42,249 107,280 104,723 48,531 302,783 49,129 123,431 120,300 52,190 345,049 51,951 130,028 125,043 52,761 359,783
PG&A 58,275 10,398 17,274 14,521 18,166 60,359 11,526 18,391 15,815 19,235 64,967 12,008 19,072 16,462 20,386 67,928
Cost of Sales 367,492 52,647 124,554 119,244 66,697 363,142 60,655 141,822 136,115 71,424 410,016 63,959 149,100 141,505 73,147 427,711
Gross Profit 83,236 10,759 51,258 32,732 6,760 101,509 14,275 56,131 39,035 7,801 117,242 15,133 60,420 41,599 10,181 127,333
Gross Profit Margin 18.5% 17.0% 29.2% 21.5% 9.2% 21.8% 19.1% 28.4% 22.3% 9.8% 22.2% 19.1% 28.8% 22.7% 12.2% 22.9%
Selling and Marketing 33,929 6,287 10,405 8,502 8,567 33,540 6,085 11,501 9,843 9,254 36,683 6,406 11,733 10,071 9,399 37,610
Research and Development 12,926 3,225 3,185 3,418 5,201 15,029 4,002 3,642 3,871 4,397 15,912 4,192 3,981 3,937 4,250 16,359
General & Administrative 35,045 8,152 10,287 8,595 7,550 34,805 7,784 11,085 9,633 7,804 36,306 8,146 11,314 10,071 7,999 37,531
Total Operating Expenses 81,900 17,664 23,877 20,515 21,318 83,374 17,871 26,229 23,347 21,454 88,902 18,745 27,028 24,078 21,649 91,500
Operating Income 1,336 (6,905) 27,381 12,217 (14,558) 18,135 (3,596) 29,903 15,688 (13,653) 28,341 (3,612) 33,392 17,520 (11,468) 35,833
Operating Margin 0.3% -10.9% 15.6% 8.0% -19.8% 3.9% -4.8% 15.1% 9.0% -17.2% 5.4% -4.6% 15.9% 9.6% -13.8% 6.5%
Interest Income 12 18 26 28 35 107 25 27 31 37 120 29 30 34 39 132
Interest Expense (250) (3) (7) (1) 0 (11) (2) (2) (1) (1) (6) (2) (1) (1) (2) (6)
Pretax Income 1,098 (6,890) 27,400 12,244 (14,523) 18,231 (3,573) 29,928 15,718 (13,617) 28,455 (3,585) 33,421 17,553 (11,431) 35,959
Income Tax (777) (2,412) 9,591 2,982 (4,937) 5,224 (1,251) 10,175 5,344 (4,630) 9,638 (1,219) 11,363 5,968 (3,886) 12,226
Tax Rate -70.8% 35.0% 35.0% 24.4% 34.0% 28.7% 35.0% 34.0% 34.0% 34.0% 33.9% 34.0% 34.0% 34.0% 34.0% 34.0%
Loss from discontinued operations 0 0 0 0 0 0 0 0 0 0 0 0 0 0 0 0
Net Income, Common 1,875 (4,478) 17,809 9,262 (9,586) 13,007 (2,322) 19,752 10,374 (8,987) 18,816 (2,366) 22,058 11,585 (7,544) 23,733
Fully Diluted Common EPS 0.10 (0.25) 0.97 0.50 (0.52) 0.70 (0.13) 1.06 0.55 (0.49) 1.01 (0.13) 1.18 0.61 (0.41) 1.26
EPS Growth Rate -119.5% -24.7% 20.0% 249.3% -0.1% 584.4% -48.2% 8.9% 11.4% -7.3% 43.4% 0.3% 11.4% 11.1% -16.3% 25.5%
Diluted Shares Outstanding 18,291 18,191 18,320 18,644 18,289 18,539 18,220 18,650 18,750 18,500 18,700 18,500 18,700 18,850 18,550 18,800
EBITDA 24,115 (4,286) 33,006 17,010 (11,779) 33,951 (1,208) 33,403 19,188 (10,153) 41,229 (62) 36,942 21,070 (7,918) 50,033

October 25, 2011
Feltl and Company Research Department Arctic Cat Inc. (ACAT) Page 12
Arctic Cat Balance SheetFiscal Year Fiscal Year Jun-09 Sep-09 Dec-09 Fiscal Year Jun-10 Sep-10 Dec-10 Fiscal Year Jun-11 Fiscal Year Fiscal Year
2008A 2009A Q1A Q2A Q3A 2010A Q1A Q2A Q3A 2011A Q1A 2012E 2013E
Current assets:
Cash and cash equivalents 10,057 11,244 7,833 11,122 50,356 31,811 23,647 40,262 27,541 14,700 35,004 32,512 39,645
Short term investments 25,006 169 38 38 0 39,251 34,964 40,605 79,529 110,413 64,290 85,000 90,000
Receivables 39,666 38,231 42,626 68,286 43,008 29,227 34,706 70,502 50,196 23,732 32,593 33,000 35,000
Inventories 126,981 120,804 127,092 133,605 106,264 81,361 88,069 95,894 77,150 61,478 86,521 89,000 95,000
Prepaid expenses 3,196 4,572 6,291 5,158 3,503 4,384 4,436 2,616 2,573 4,048 4,019 4,100 3,900
Income taxes receivable 9,546 352 0 0 0 0 0 0 0 0 193 193 0
Deferred income taxes 12,690 14,244 17,404 16,378 17,691 14,981 13,974 16,746 19,460 17,669 18,073 18,500 19,000
Total current assets 227,142 189,616 201,284 234,587 220,822 201,015 199,796 266,625 256,449 232,040 240,693 262,305 282,545
Long-term assets:
Machinery, equipment, and tooling 182,936 180,304 181,475 182,598 183,957 185,023 185,450 187,491 192,065 195,189 198,720 209,200 225,000
Land, buildings and improvements 27,857 28,877 28,894 28,898 28,899 28,937 28,937 28,937 28,937 28,924 29,030 29,000 29,500
Less accumulated depreciation (136,310) (149,684) (153,745) (161,057) (168,719) (170,644) (173,046) (178,091) (182,799) (184,883) (187,269) (197,763) (210,827)
Intangibles and other assets 4,273 2,072 2,075 2,073 2,118 1,753 1,692 1,724 1,748 1,636 1,676 1,650 1,700
Total assets 305,898 251,185 259,983 287,099 267,077 246,084 242,829 306,686 296,400 272,906 282,850 304,392 327,918
Current liabilities:
Accounts payable 74,576 44,451 58,692 60,481 36,679 37,303 43,208 65,894 38,098 41,666 61,697 55,000 60,000
Accrued expenses 39,292 35,621 33,858 37,082 39,469 35,042 32,606 44,215 51,941 44,398 38,613 45,000 43,000
Income taxes payable 0 0 775 6,436 6,640 2,975 753 11,661 12,840 1,380 0 2,000 2,000
Total current liabilities 113,868 80,072 93,325 103,999 82,788 75,320 76,567 121,770 102,879 87,444 100,310 102,000 105,000
Long-term liabilities:
Deferred Income taxes 11,168 6,245 5,864 5,674 4,579 3,425 3,045 2,855 2,568 2,426 2,046 2,000 1,800
Total liabilities 125,036 86,317 99,189 109,673 87,367 78,745 79,612 124,625 105,447 89,870 102,356 104,000 106,800
Stockholders' equity:
Common stock 179 181 182 182 182 182 182 182 183 183 182 180 178
Additional paid-in capital 0 2,568 2,985 4,328 4,698 5,053 5,205 5,903 6,733 7,280 6,911 5,603 2,498
Accumulated other comprehensive income 4,768 (512) 963 1,472 784 (2,382) (2,178) (1,841) (3,042) (1,920) (1,770) (1,700) (1,600)
Retained earnings 175,915 162,611 156,664 171,444 174,046 164,486 160,008 177,817 187,079 177,493 175,171 196,309 220,042
Total stockholders' equity 180,862 164,848 160,794 177,426 179,710 167,339 163,217 182,061 190,953 183,036 180,494 200,392 221,118
Total liabilities and stockholders' equity 305,898 251,165 259,983 287,099 267,077 246,084 242,829 306,686 296,400 272,906 282,850 304,392 327,918

October 25, 2011
Feltl and Company Research Department Arctic Cat Inc. (ACAT) Page 13
Arctic Cat Cash Flow StatementFiscal Year Fiscal Year Jun-09 Sep-09 Dec-09 Mar-10 Fiscal Year Jun-10 Sep-10 Dec-10 Mar-11 Fiscal Year Jun-11 Fiscal Year Fiscal Year
2008A 2009A Q1 Q2 Q3 Q4 2010A Q1 Q2 Q3 Q4E 2011A Q1 2012E 2013E
Cash flow from operations:
Net income (3,259) (9,508) (5,947) 14,780 2,602 (9,560) 1,875 (4,478) 17,809 9,262 (9,586) 13,007 (2,322) 18,816 23,733
Adjustments to net income:
Depreciation and amortization 29,737 28,981 4,000 7,286 7,715 3,778 22,779 2,619 5,625 4,793 2,779 15,816 2,388 14,000 14,200
Loss on disposal of fixed assets 49 252 0 0 0 144 144 0 0 0 105 105 0 0 0
Goodwill impairment 0 1,750 0 0 0 0 0 0 0 0 0 0 0 0 0
Deferred income taxes 1,809 (6,379) (4,012) 1,286 (2,304) 1,453 (3,577) (1,130) (1,420) (2,662) 2,018 (3,194) (467) (831) (500)
Stock based compensation expense 2,063 2,570 417 1,343 371 355 2,486 1,837 698 334 305 3,174 943 3,300 3,500
Change in operating assets and liabilities:
Trading securities 13,701 24,837 131 0 38 (39,251) (39,082) 4,287 (5,641) (38,924) (30,884) (71,162) 46,123 25,413 (5,000)
Receivables 1,663 (437) (2,723) (26,545) 25,297 13,371 9,400 (1,762) (39,365) 19,650 27,020 5,543 (8,671) (9,268) (2,000)
Inventories (25,770) 2,798 (5,179) (5,785) 27,310 23,657 40,003 (8,168) (6,337) 19,462 15,630 20,587 (24,625) (27,522) (6,000)
Prepaid expenses 8,461 (29,615) (1,700) 1,152 1,650 (897) 205 (69) 1,834 43 (1,463) 345 30 (52) 200
Accounts payable (14,474) (3,392) 12,111 3,071 (23,311) 461 (7,668) 6,053 22,879 (29,627) 3,574 2,879 19,119 13,334 5,000
Accrued expenses (17,791) 8,980 (1,859) 3,162 2,416 (4,304) (585) (2,281) 11,461 7,744 (7,686) 9,238 (5,838) 602 (2,000)
Income taxes payable 343 (1,246) (1,194) 8,067 99 (3,637) 3,335 (2,204) 10,957 1,193 (11,407) (1,461) (1,693) 620 0
Net cash flow from operations (3,468) 19,591 (5,955) 7,817 41,883 (14,430) 29,315 (5,296) 18,500 (8,732) (9,595) (5,123) 24,987 38,412 31,133
Cash flow from investing:
Purchase of property and equipment (14,343) (14,226) (1,040) (2,082) (3,563) (6,540) (6,540) (676) (3,234) (7,931) (11,674) (11,674) (3,656) (17,500) (18,000)
Net cash flow from investments (14,343) (14,226) (1,040) (1,042) (1,481) (2,977) (6,540) (676) (2,558) (4,697) (3,743) (11,674) (3,656) (17,500) (18,000)
Cash flow from financing:
Checks written in excess of bank balance 5,347 0 2,009 (1,419) (590) 221 221 0 0 574 (574) 0 0 0 0
Proceeds from short-term borrowings 201,875 227,230 19,449 53,980 0 0 73,429 0 0 1,012 0 1,012 7,544 8,000 9,500
Payments on short-term borrowings (201,875) (227,230) (19,449) (53,980) 0 0 (73,429) 0 0 (1,012) 0 (1,012) (7,544) (8,000) (9,500)
Proceeds from common stock (5,063) 0 0 0 0 0 0 207 0 416 105 728 0 0 0
Tax benefit from stock option exercises 475 0 0 0 0 0 0 526 0 82 137 745 597 1,000 1,000
Repurchase of common stock (10,763) 0 0 0 0 0 0 (2,419) 0 0 0 (2,419) (1,909) (4,000) (7,000)
Dividends paid (5,063) (3,796) 0 0 0 0 0 0 0 0 0 0 0 0 0
Net cash flow from financing (7,467) (3,796) 2,009 (1,419) (590) 221 221 (1,686) 0 1,072 (332) (946) (1,312) (3,000) (6,000)
Exchange rate changes on cash (882) (382) (813) 321 (578) (1,359) (2,429) (506) 167 (197) 632 632 285 -100 0
Beginning cash 36,217 10,057 11,244 5,445 11,122 50,356 11,244 31,811 23,647 39,756 27,202 31,811 14,700 14,700 32,512
Change in cash (26,160) 1,187 (5,799) 5,677 39,234 (18,545) 20,567 (8,164) 16,109 (12,554) (13,038) (17,111) 20,304 17,812 7,133
Ending cash 10,057 11,244 5,445 11,122 50,356 31,811 31,811 23,647 39,756 27,202 14,164 14,700 35,004 32,512 39,645
Free cash flow (17,811) 5,365 (6,995) 5,735 38,320 (20,970) 22,775 (5,972) 15,266 (16,663) (21,269) (16,797) 21,331 20,912 13,133
FCF/Share (0.49) 0.30 (0.38) 0.31 2.09 (1.15) 1.25 (0.33) 0.83 (0.89) (1.16) (0.91) 1.17 1.12 0.70

October 25, 2011
Feltl and Company Research Department Arctic Cat Inc. (ACAT) Page 14
Analyst Certification I, Mark E. Smith, certify that the views expressed in this research report accurately reflect my personal views about the subject company and its securities. I also certify that I have not been, am not, and will not be receiving direct or indirect compensation related to the specific recommendations expressed in this report. Important Disclosures: The analyst or a member of his/her household does not hold a long or short position, options, warrants, rights or futures of this security in their personal account(s). As of the end of the month preceding the date of publication of this report, Feltl and Company did not beneficially own 1% or more of any class of common equity securities of the subject company. There is not any actual material conflict of interest that either the analyst or Feltl and Company is aware of. The analyst has not received any compensation for any investment banking business with this company in the past twelve months and does not expect to receive any in the next three months. Feltl and Company has not been engaged for investment banking services with the subject company during the past twelve months and does not anticipate receiving compensation for such services in the next three months. Feltl and Company has not served as a broker, either as agent or principal, buying back stock for the subject company’s account as part of the company’s authorized stock buy-back program in the last twelve months. No director, officer or employee of Feltl and Company serves as a director, officer or advisory board member to the subject company. Feltl and Company Rating System: Feltl and Company utilizes a four tier rating system for potential total returns over the next 12 months.
Strong Buy: The stock is expected to have total return potential of at least 30%. Catalysts exist to generate higher valuations, and positions should be initiated at current levels. Buy: The stock is expected to have total return potential of at least 15%. Near term catalysts may not exist and the common stock needs further time to develop. Investors requiring time to build positions may consider current levels attractive. Hold: The stock is expected to have total return potential of less than 15%. Fundamental events are not present to make it either a Buy or a Sell. The stock is an acceptable longer-term holding. Sell: Expect a negative total return. Current positions may be used as a source of funds.

October 25, 2011
Feltl and Company Research Department Arctic Cat Inc. (ACAT) Page 15
10/25/2011Ratings Distribution for Feltl and Company
------ Investment Banking ------ Number of Percent Number of Percent of
Rating Stocks of Total Stocks Rating categorySB/Buy 44 71% 3 7%Hold 17 27% 0 0%Sell 1 2% 0 0%
62 100% 3 5%
The above represents our ratings distribution on the stocks in the Feltl and Company research universe, together with the number in (and percentage of) each category for which Feltl and Company provided investment-banking services in the previous twelve months.
Date Nature of Report Rating Price Target
10/25/11 Initiation @ $16.63 Buy $21
Feltl and Company does make a market in the subject security at the date of publication of this report. As a market maker, Feltl and Company could act as principal or agent with respect to the purchase or sale of those securities.
10/25/11 Buy Target: $21
October 25, 2011
Feltl and Company Research Department Arctic Cat Inc. (ACAT) Page 16
Valuation and Price Target Methodology: We derive our $21.00 price target by applying a 17x multiple to our 2013 EPS estimate of $1.26. Risks to Achievement of Estimates and Price Target:
• Arctic Cat’s business may be impacted by consumers’ discretionary spending and confidence. Macroeconomic factors such as increasing gasoline prices, unemployment and generally tough economic times may negatively impact consumers’ retail spending. Changing consumer outdoor trends could also have a negative impact on sales.
• Changing weather may slow sales for ACAT as this could have a negative impact on demand and sales. • Higher commodity prices may affect earnings. Aluminum, steel and plastic are large components of the products ACAT produces. Higher
transportation and energy related costs can also have negative impacts on ACAT’s earnings. • The retail business is extremely competitive and competition for customers through lower prices may negatively impact ACAT’s returns.
Discounted prices at ACAT’s largest competitors may cause the company to lower prices to maintain its market share and increase margin pressure.
• Unfavorable exchange rates could have a negative effect on sales and net earnings. • Retail credit market deterioration and volatility may restrict the ability of Arctic Cat’s retail customers to finance the purchase of Arctic Cat
products. • The company is dependant on its dealers, suppliers and financial sources. Any disruption that could affect their businesses could have an
adverse affect on their relationship with Arctic Cat. • Governmental regulation due to safety and environmental issues could require Arctic Cat to incur expenses or modify products to comply with
the new regulations. • Readers should recognize that the risks noted here do not represent a comprehensive list of all risk factors or potential issues, nor all factors
that may preclude achievement of our forecast or price target. Additional risk factors exist and are outlined in the Company’s SEC filings Other Disclosures: The information contained in this report is based on sources considered to be reliable, but not guaranteed, to be accurate or complete. Any opinions or estimates expressed herein reflect a judgment made as of this date, and are subject to change without notice. This report has been prepared solely for informative purposes and is not a solicitation or an offer to buy or sell any security. The securities described may not be qualified for purchase in all jurisdictions. Because of individual requirements, advice regarding securities mentioned in this report should not be construed as suitable for all accounts. This report does not take into account the investment objectives, financial situation and needs of any particular client of Feltl and Company. Some securities mentioned herein relate to small speculative companies that may not be suitable for some accounts. Feltl and Company suggests that prior to acting on any of the recommendations herein, the recipient should consider whether such a recommendation is appropriate given their investment objectives and current financial circumstances. Past performance does not guarantee future results. Additional information is available upon request.
2100 LASALLE PLAZA, 800 LASALLE AVENUE • MINNEAPOLIS, MINNESOTA 55402
(612) 492 8800 • (866) 655 – 3431 MEMBER SIPC & FINRA
INSTITUTIONAL SALES: (866) 338-3522
Mark A. Hagen (612) 492-8846
Ryan M. Quade (612) 492-8807
Brandt B. Wendland (612) 492-8855
Jeff R. Sonnek (612) 492-8825
Matt J. Rasmussen (612) 492-8860
Mike T. Larson (612) 492-8856
EQUITY CAPITAL MARKETS DIRECTORY
RESEARCH DEPARTMENT
Brent R. Rystrom Director of Equity Research
(612) 492-8810 [email protected]
Ernest W. Andberg, CFA
(612) 492-8836 [email protected]
Mark E. Smith (612) 492-8806
Scott R. Berg (612) 492-8857
Ty M. Lilja (612) 492-8815
Ben C. Haynor, CFA (612) 492-8872
Matt J. Weight (612) 492-8812
Shawn P. Bitzan (612) 492-8816
TRADING: (866) 777-9862
Thomas J. Walters Equity Trading (612) 492-8829
Christopher S. Modene Equity Trading (612) 492-8830
Elliott M. Randolph Institutional Sales Trading
(612) 492-8867 [email protected]
Cory N. Carlson
Institutional Sales Trading (612) 492-8858
Luke J. Weimerskirch (612) 492-8832