Embed Size (px)
Citation preview
2nd China-ASEAN Advanced Course on Ocean Law and Governance
Maritime Transportation
Prof. Renping ZHANG Director, Centre for International Maritime Convention Studies
Dalian Maritime University,China
NISCSS, Haikou, China, 8 November 2016
World Maritime Day
2017 World Maritime Day Theme
• Connecting Ships, Ports, People
2016 World Maritime Day Theme
• Shipping, Indispensable to the World
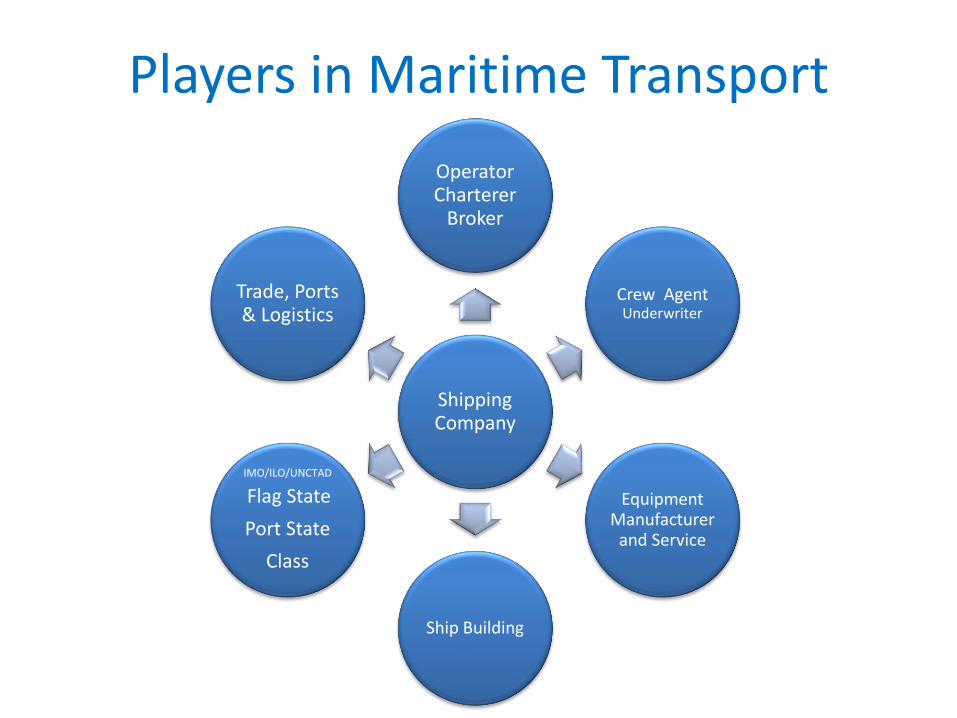
Players in Maritime Transport
Shipping Company
Operator Charterer
Broker
Crew Agent Underwriter
Equipment Manufacturer
and Service
Ship Building
IMO/ILO/UNCTAD
Flag State
Port State
Class
Trade, Ports & Logistics
Maritime Transportation
1. Overview
2. Maritime Transport
3. World Fleet and Operations
4. International Ports and Sustainability
5. Regulatory Development and Issues

1. Overview
1. Overview
• Seaborne trade
• Global fleet and new regulations
• Ports
• Legal and regulatory framework
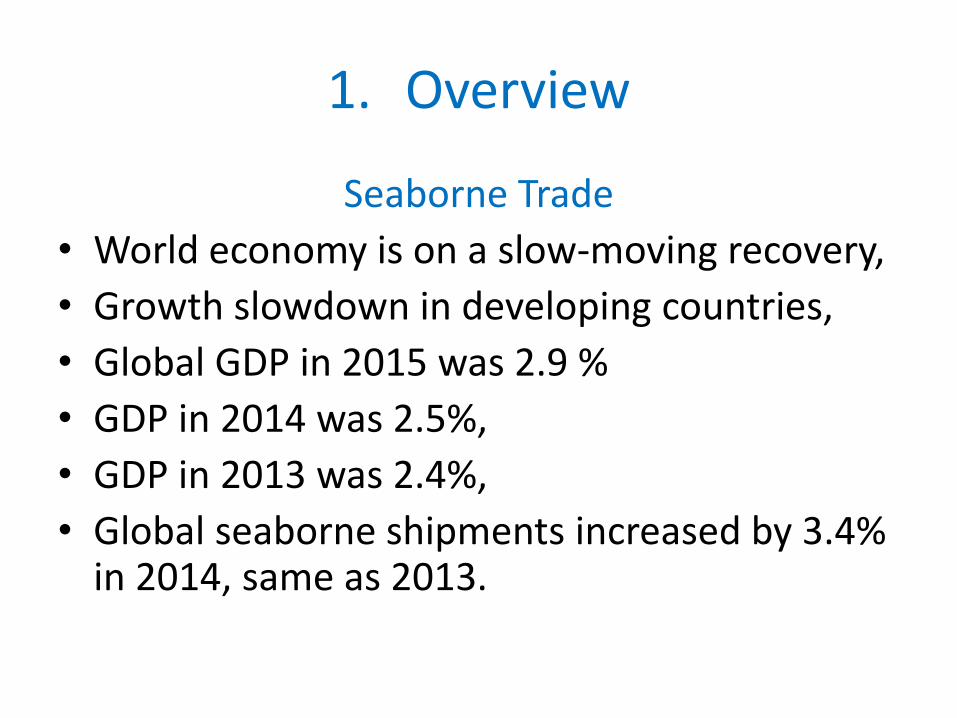
1. Overview
Seaborne Trade
• World economy is on a slow-moving recovery,
• Growth slowdown in developing countries,
• Global GDP in 2015 was 2.9 %
• GDP in 2014 was 2.5%,
• GDP in 2013 was 2.4%,
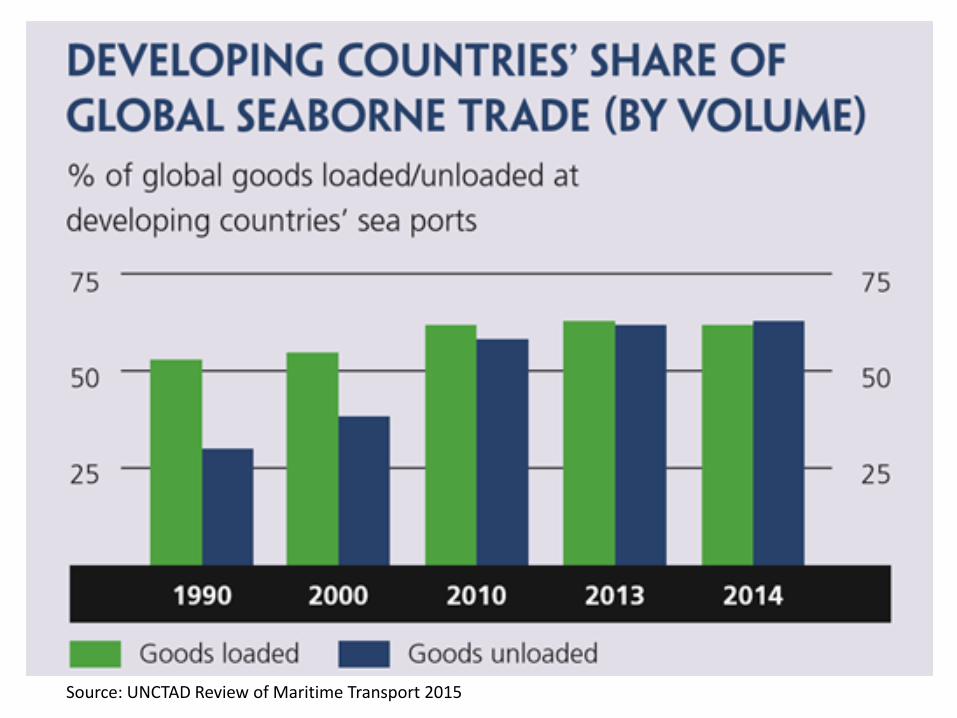
• Global seaborne shipments increased by 3.4% in 2014, same as 2013.
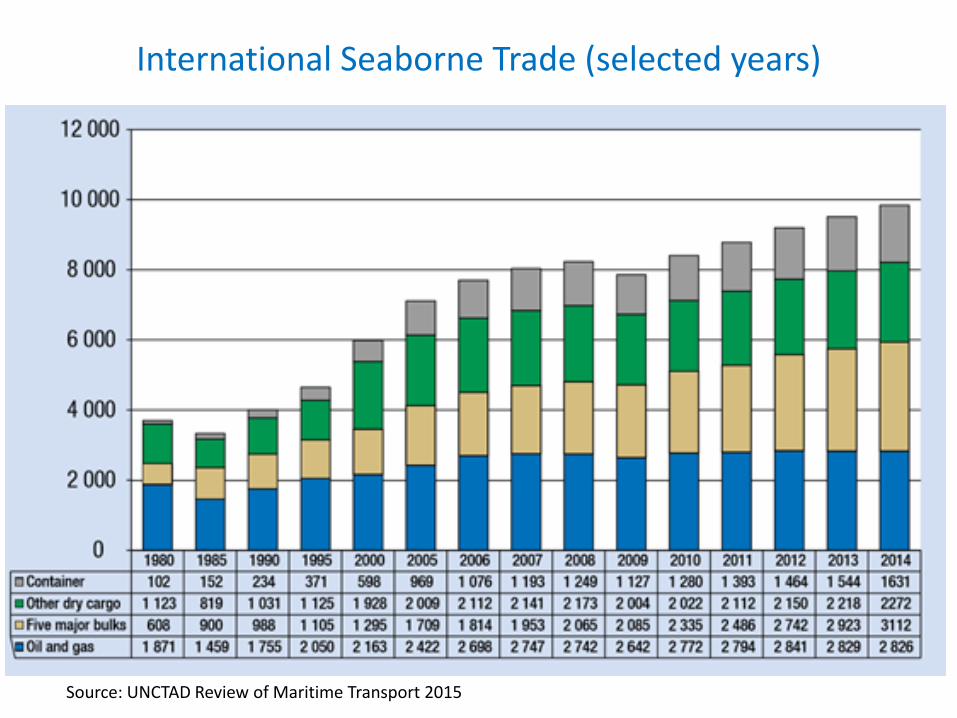
International Seaborne Trade (selected years)
Source: UNCTAD Review of Maritime Transport 2015
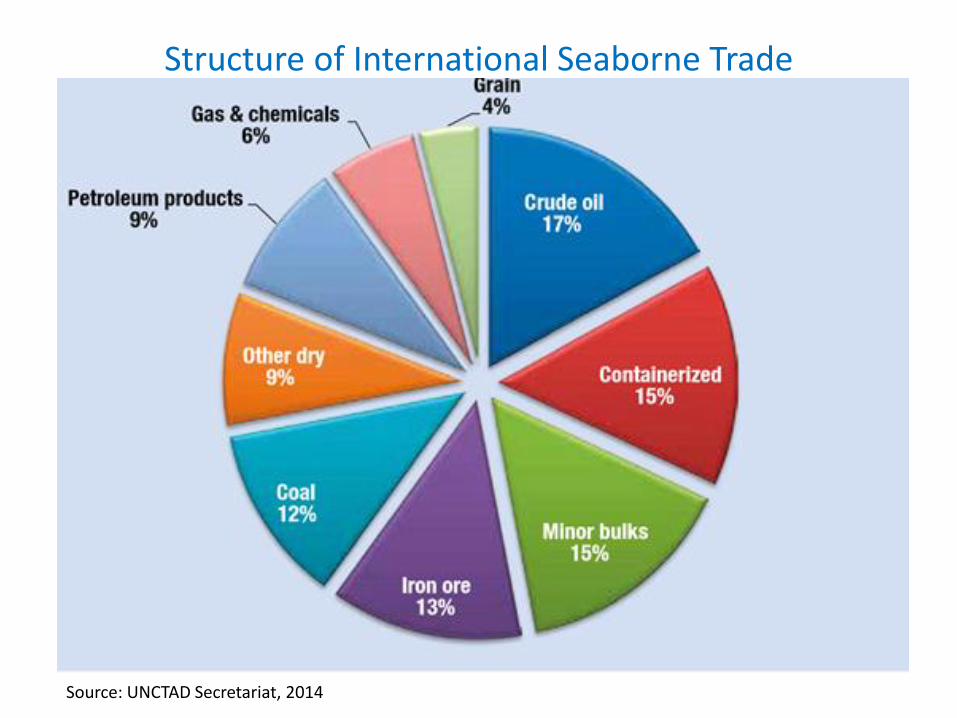
Structure of International Seaborne Trade
Source: UNCTAD Secretariat, 2014
Overview
Fleet and new regulations
• World fleet grew by 3.5% in 2014, the lowest annual growth rate in over a decade.
• World’s commercial fleet consisted of 89,464 vessels, by 2015
• Total tonnage is 1.75 billion dwt
Source: UNCTAD Review of Maritime Transport 2015
Overview
• Greece continues to be the largest ship-owning country, followed by Japan, China, Germany and Singapore.
• Top five ship-owning countries control more than half of the world tonnage,
• Five of top 10 ship-owning countries are from Asia, four are European, one is from the Americas.
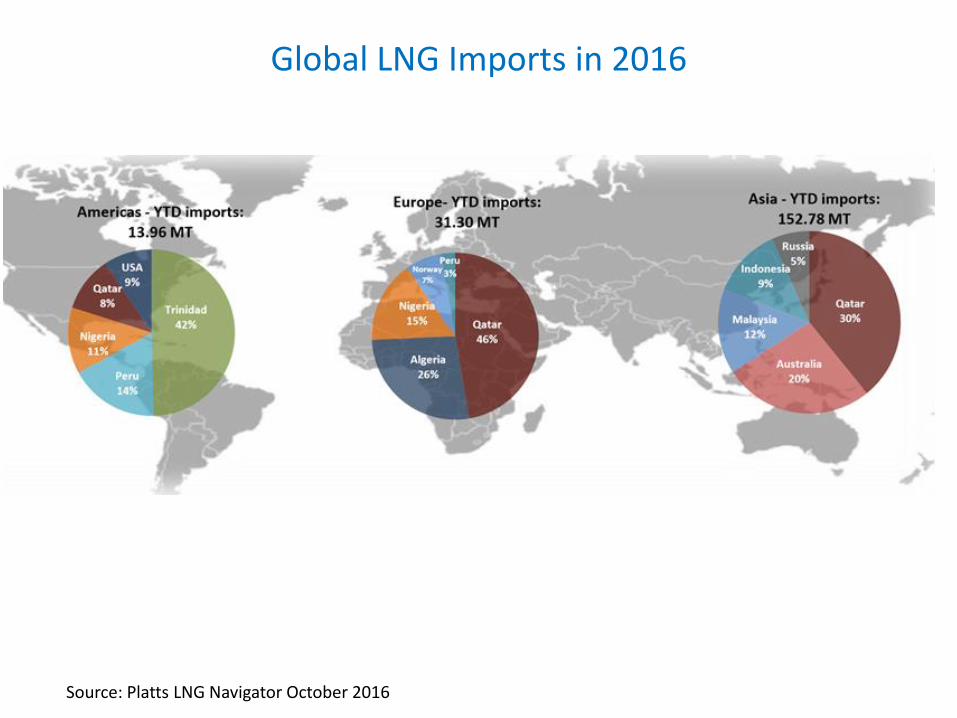
Global LNG Imports in 2016
Source: Platts LNG Navigator October 2016
Overview
Global Shipping Giant Maersk in 2016 • profit in quarter 3 of 2016 is USD 438 millions, • 44% fall as to Q3 of 2015
Overview
• Economic and regulatory incentives encourage individual owners to invest in modernizing their fleets;
• e.g. China COSCO and China Shipping merged, China COSCO Shipping;
Overview
Giant Shipping Merging • China China COSCO + China Shipping Sinotrans CSC + China Merchant
Holdings • Japan NYK + MOL + K-LINE
Overview
• New regulations require the shipping industry to invest in environmental technologies, covering issues such as emissions, waste, and ballast water treatment.
Overview
• Some investments are not only beneficial for the environment, but also lead to longer-term cost savings, due to energy efficiency.
Overview
Ports
• The performance of ports and terminals is important because it affects a country’s trade competitiveness,
• What are determinants to port performance? labour relations, – number and type of cargo handling equipment,
– quality of backhaul area,
– port access channel,
– land-side access and customs efficiency,
Overview
• World’s largest terminal operator handled 65.4 million TEUs in 2014,
• In 2015, Shanghai remained top throughput of 36.53 million TEUs,
Overview
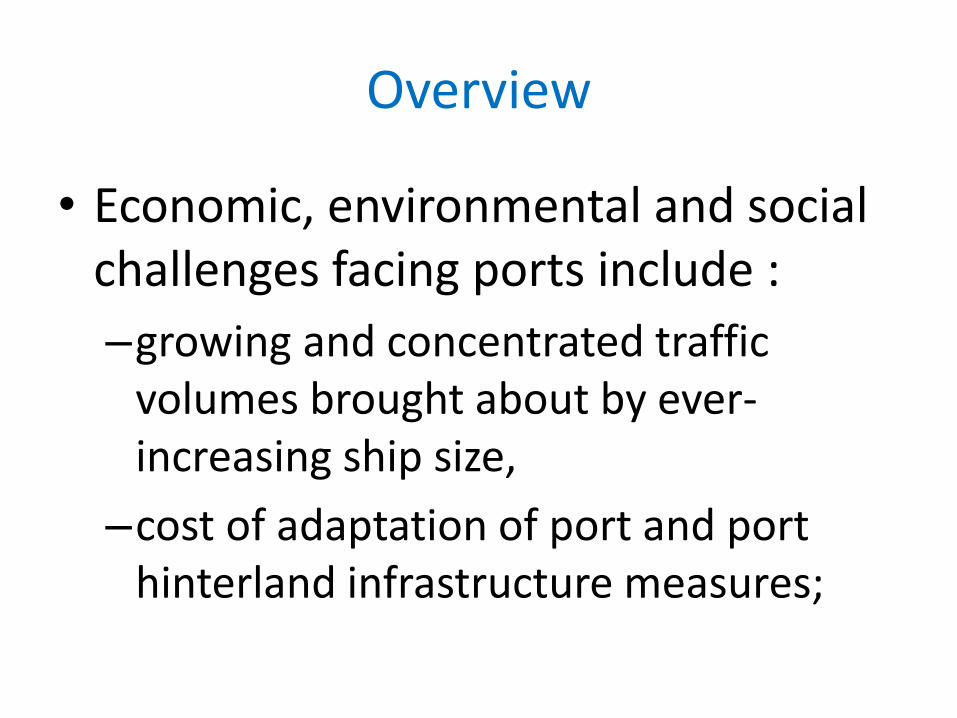
• Economic, environmental and social challenges facing ports include :
–growing and concentrated traffic volumes brought about by ever-increasing ship size,
–cost of adaptation of port and port hinterland infrastructure measures;

Overview
–a changing marketplace as a result of increased alliances between shipping lines;
–volatility in energy prices, the new energy landscape and the transition to alternative fuels;
–the entry into force of stricter sulphur limits;
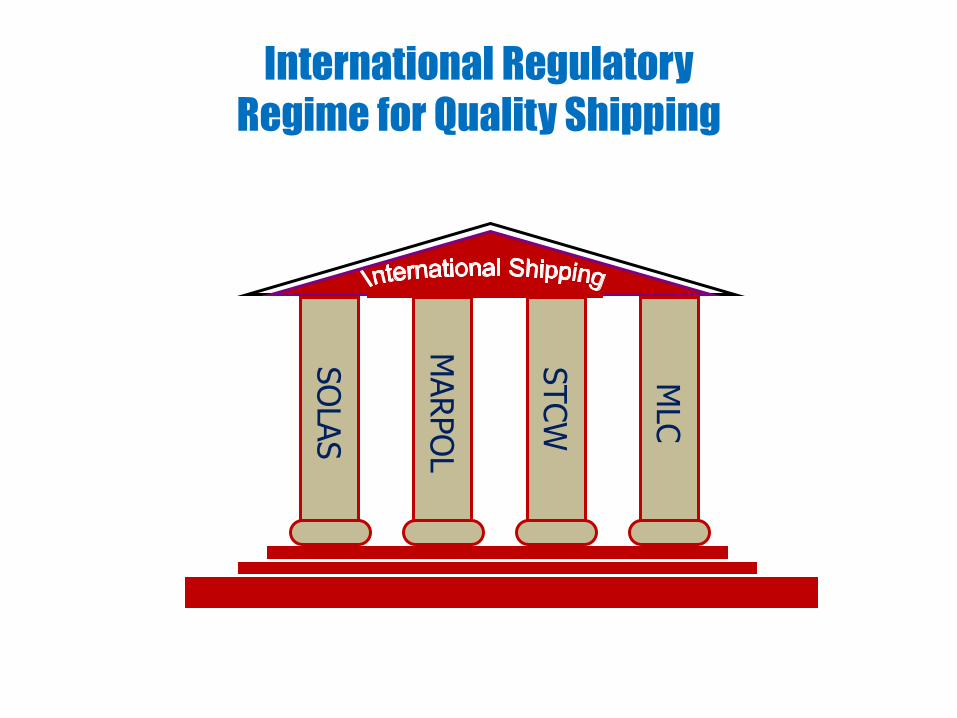
International Regulatory
Regime for Quality Shipping
SO
LAS
STCW
MLC
MARPO
L
Overview
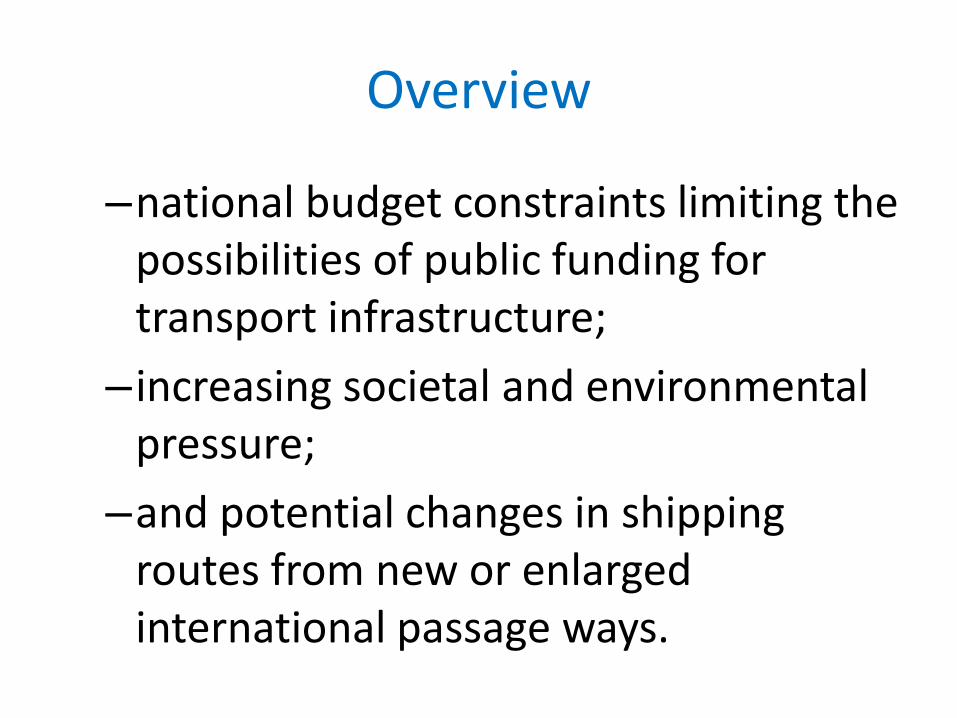
–national budget constraints limiting the possibilities of public funding for transport infrastructure;
– increasing societal and environmental pressure;
–and potential changes in shipping routes from new or enlarged international passage ways.
Overview
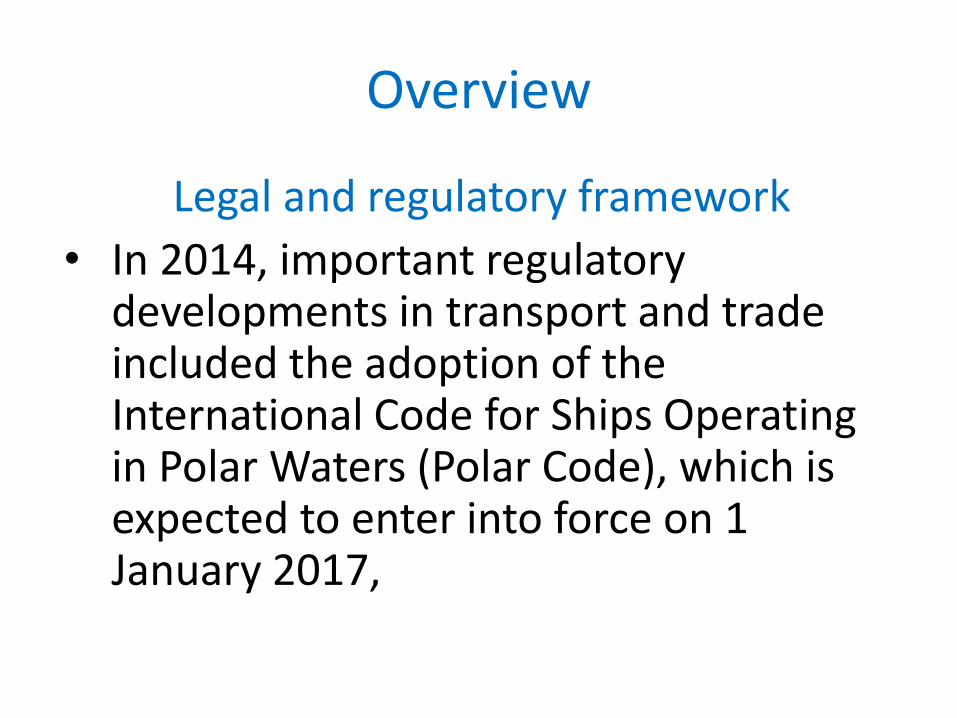
Legal and regulatory framework
• In 2014, important regulatory developments in transport and trade included the adoption of the International Code for Ships Operating in Polar Waters (Polar Code), which is expected to enter into force on 1 January 2017,
Overview
• To further strengthen the legal framework relating to ship-source air pollution and the reduction of greenhouse gas (GHG) emissions from international shipping, several regulatory measures were adopted at IMO, and the third IMO GHG Study 2014 was finalised.
Overview
• Guidelines for the development of the Inventory of Hazardous Materials required under the 2010 International Convention on Liability and Compensation for Damage in Connection with the Carriage of Hazardous and Noxious Substances by Sea (HNS Convention), which however is not yet in force, were adopted,
Overview
• Further progress was made with respect to technical matters related to ballast water management, ship recycling, and measures helping to prevent and combat pollution of the sea from oil and other harmful substances.
Overview
• For suppression of maritime piracy and armed robbery, positive developments were noted in the waters off the coast of Somalia and the wider western Indian Ocean.
Overview
• Concern remains about the seafarers still being held hostage.
• A downward trend of attacks in the Gulf of Guinea was also observed, indicating that international, regional and national efforts are beginning to take effect.
Overview
• 2006 Maritime Labour Convention entered into force in 2013, (2006 MLC)
• In 2015, Nairobi International Convention of Wreck Removal has entered into force, (Nairobi Wreck Removal Convention);
Overview
• International Convention for the Control and Management of Ships' Ballast Water and Sediments (BWM Convention) will enter into force on 8 September 2017.
Overview
• IMO MEPC 70: –New requirements for international
shipping, IMO as UN body continues to address greenhouse gas emissions,
–Adoption of Data Collection System, Approval of Roadmap, Voluntary data collection and submission to begin,
–Adoption the revised G8 Type Approval Guidelines of BWM Convention
2. Maritime Transport
2. Maritime Transport
• Developing countries remained the engine of growth, contributing three quarters of global expansion in 2014 (International Monetary Fund, 2015),
Maritime Transport
• Slower GDP growth reflects weaker expansion in developing America and a slowdown in China,
• Economies of the least developed countries continued to expand at a rapid rate (5.3%).
Maritime Transport
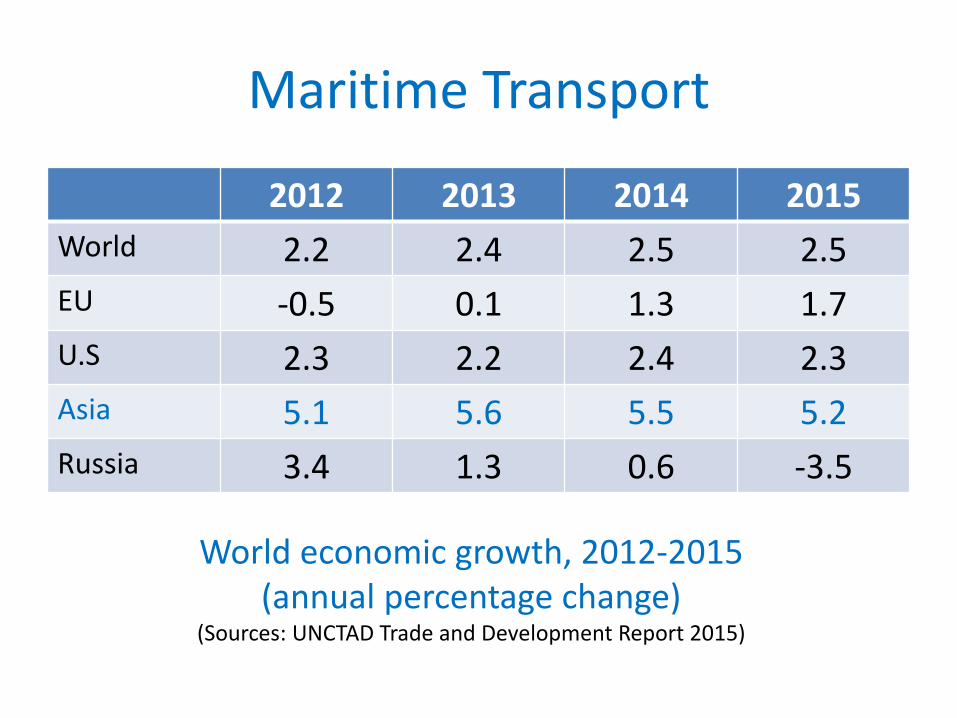
2012 2013 2014 2015
World 2.2 2.4 2.5 2.5
EU -0.5 0.1 1.3 1.7
U.S 2.3 2.2 2.4 2.3
Asia 5.1 5.6 5.5 5.2
Russia 3.4 1.3 0.6 -3.5
World economic growth, 2012-2015 (annual percentage change)
(Sources: UNCTAD Trade and Development Report 2015)
Maritime Transport
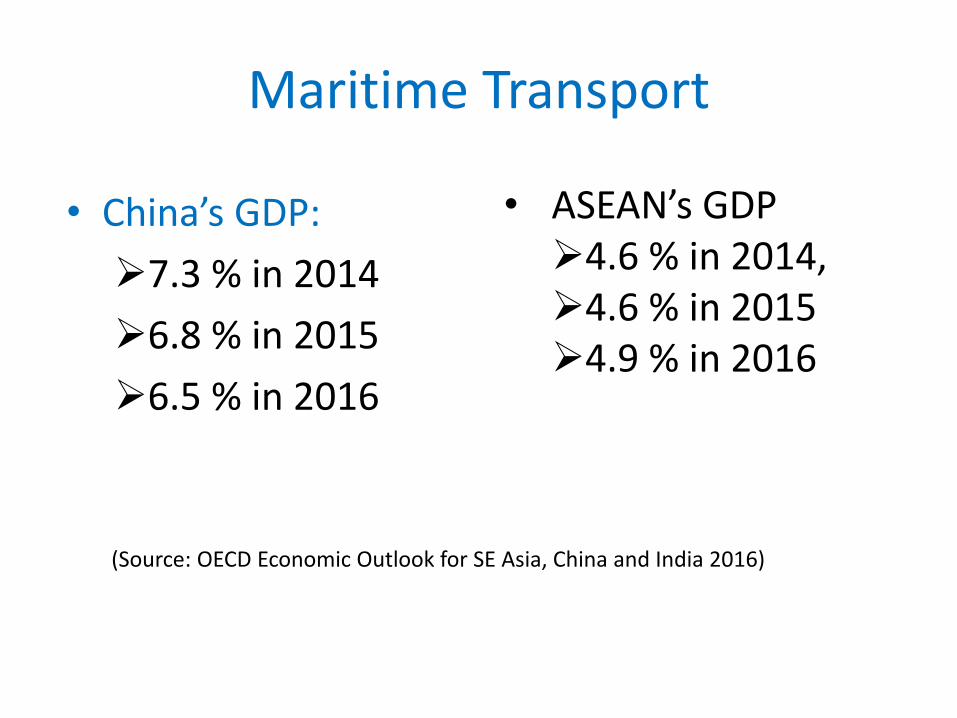
• China’s GDP:
7.3 % in 2014
6.8 % in 2015
6.5 % in 2016
• ASEAN’s GDP 4.6 % in 2014, 4.6 % in 2015 4.9 % in 2016
(Source: OECD Economic Outlook for SE Asia, China and India 2016)
Maritime Transport
• World economy has embarked on a slow moving global recovery,
• on balance, GDP growth is expected to continue to moderate in 2015,
• outlook remains subject to many downside risks.
Maritime Transport
• World merchandise trade in 2014 –volume of global merchandise trade
increased at the slower rate of 2.3 %, down from 2.6 per cent in 2013.
–reflect an uneven recovery in the developed economies,
–slower growth in developing economies.
Maritime Transport
• Developing countries in 2014:
–shared 45% world exports,
–shared 42.2% world imports,
–gained greater market share in world merchandise trade.
Maritime Transport
• A rebalancing of China’s economy can significantly reshape the maritime transport landscape and alter shipping and seaborne trade patterns.
Maritime Transport
• General trends in seaborne trade
–the volume of world seaborne shipments expanded by 3.4 per cent in 2014, that is, at the same rate as in 2013
Maritime Transport
–Additions to volumes exceeded 300 million tons, taking the total to 9.84 billion, or around four fifths of total world merchandise trade.
–Dry cargo has accounted for over two thirds of the total,
–Tanker trade slightly declined from nearly 30.0 % in 2013 to 28.7 % in 2014.
Maritime Transport
• Seaborne trade in ton–miles
–the ton–mile unit offers a more accurate measure of demand for shipping services and tonnage as it takes into account distance, which determines ships’ transportation capacity over time.
Maritime Transport
• In 2014, growth in ton–miles performed by maritime transportation was estimated to have increased by 4.4 %, up from 3.1 % in 2013
Maritime Transport
• Seaborne trade by cargo type
• Tanker trade
– Crude oil
– Refined petroleum products
– Natural gas and liquefied gases
• Dry cargo trade:
– Iron ore shipments
– Coal shipments
– Grain shipments
– Containerized trade
Maritime Transport
• Crude Oil
–crude oil shipments were estimated at 1.7 billion tons in 2014, a drop of 1.7 % over previous year.
–while imports into China increased by 9.8 %, 5.6 million barrels per day.
Maritime Transport
• Refined petroleum products in 2014,
–Global refinery capacity increased by 1.4 %, driven mainly by growth in Brazil, China, Singapore and Western Asia.
–Petroleum products are estimated to have increased by 1.7 % in 2014, reached 977 million tons,
Maritime Transport
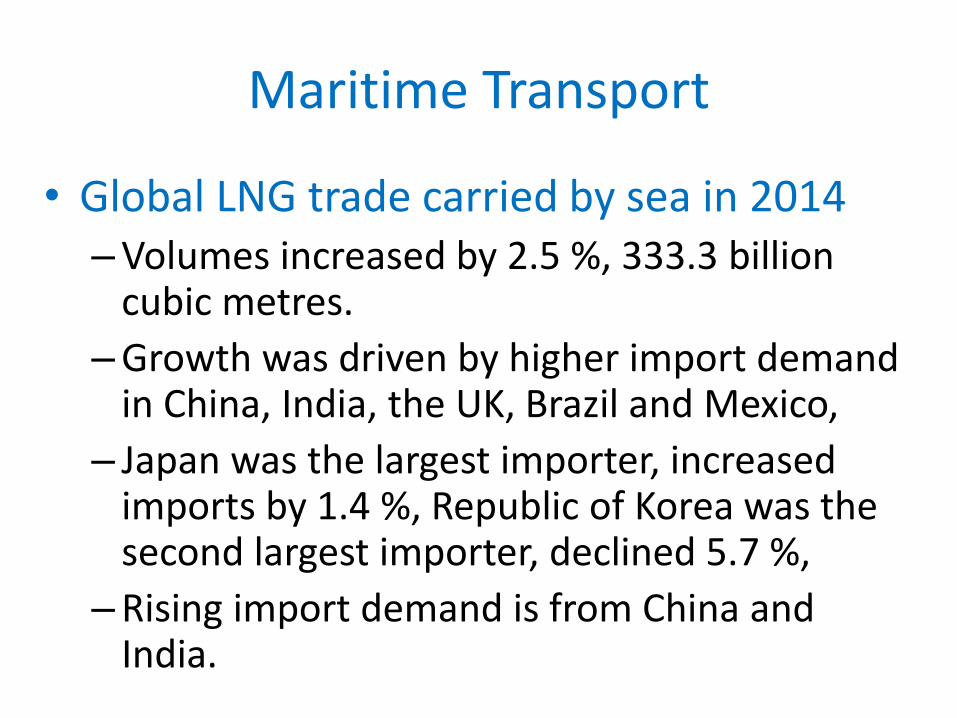
• Global LNG trade carried by sea in 2014 –Volumes increased by 2.5 %, 333.3 billion
cubic metres.
–Growth was driven by higher import demand in China, India, the UK, Brazil and Mexico,
– Japan was the largest importer, increased imports by 1.4 %, Republic of Korea was the second largest importer, declined 5.7 %,
–Rising import demand is from China and India.
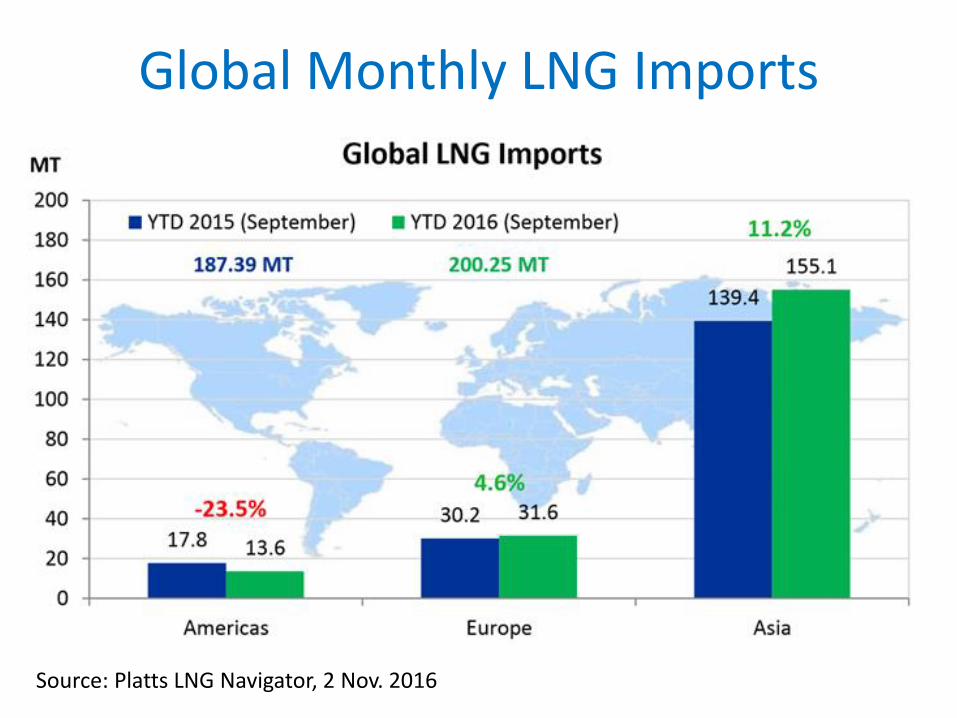
Global Monthly LNG Imports
Source: Platts LNG Navigator, 2 Nov. 2016
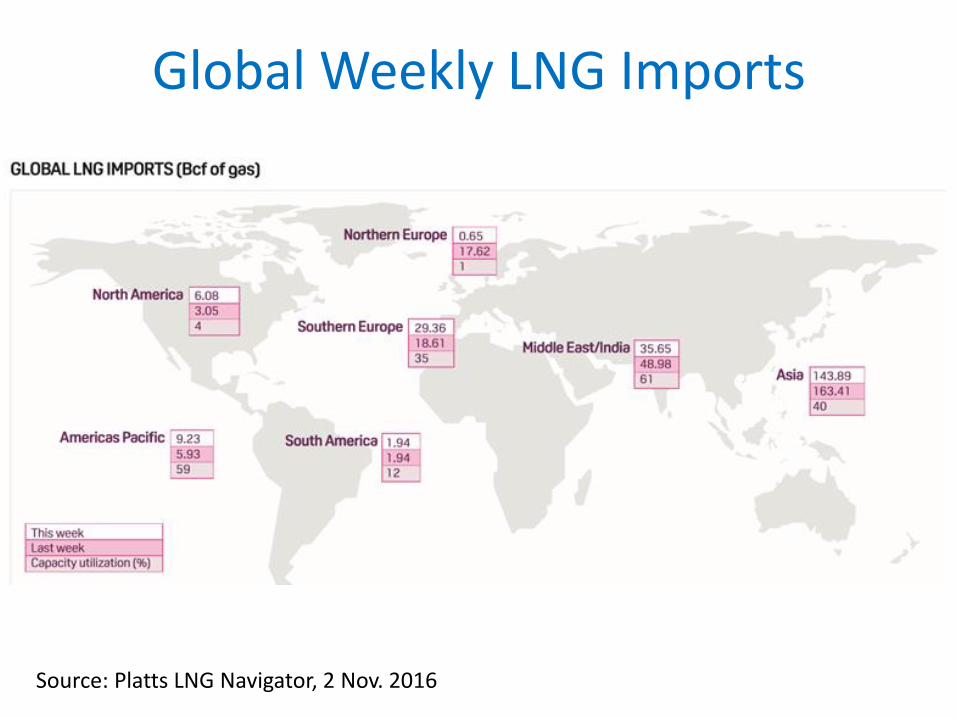
Global Weekly LNG Imports
Source: Platts LNG Navigator, 2 Nov. 2016

Global Weekly LNG Imports
Source: Platts LNG Navigator, 2 Nov. 2016
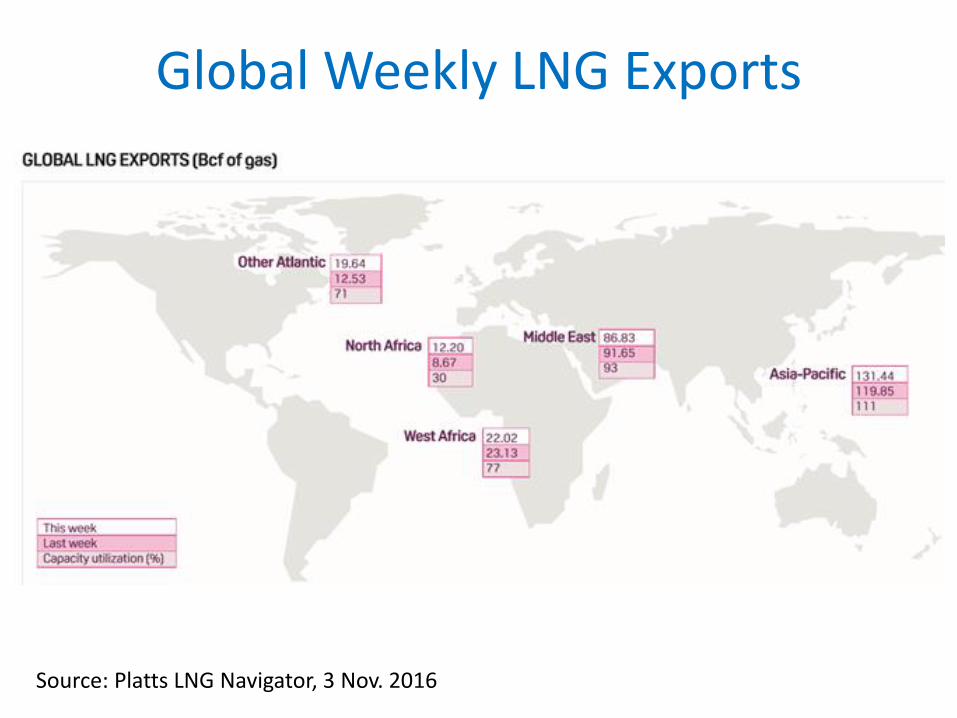
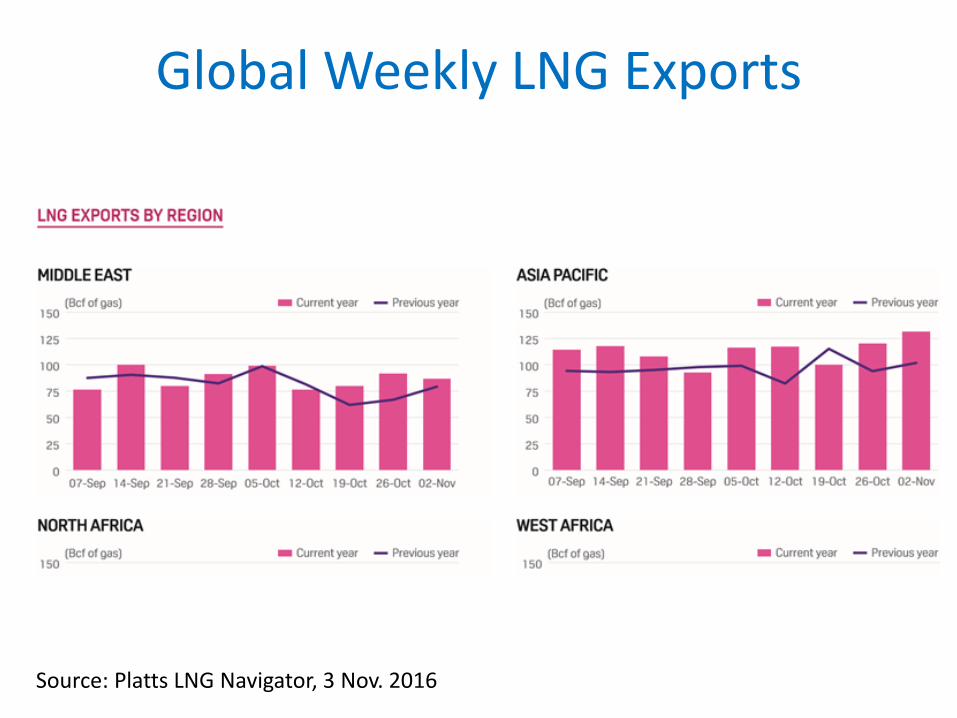
Global Weekly LNG Exports
Source: Platts LNG Navigator, 3 Nov. 2016
Global Weekly LNG Exports
Source: Platts LNG Navigator, 3 Nov. 2016
Maritime Transport
• Seaborne iron ore trade in 2014,
–estimated to have grown by 12.4 %, to 1.34 billion tons,
– India’s iron ore imports were estimated to grow by 23 % in 2015,
–Concerns relating to a slowdown of China’s steel industry and import demand caused uncertainty.
Maritime Transport
• Global seaborne coal trade in 2014,
–Growth in world coal decelerated to 2.8 % , 1.2 billion tons,
–China was the main engine fuelling the rapid expansion of world seaborne coal trade over the past decade, its share of global coal shipments reached 20 %,
Maritime Transport
• Global seaborne grain trade in 2014,
–Global grain shipments were estimated to have increased by 11.1 %, totalled 430 million tons,
– Japan, the top world importer, imported less grain, -1.3 %,
–China, the second world importer, increased its imports, + 16.4%
Maritime Transport
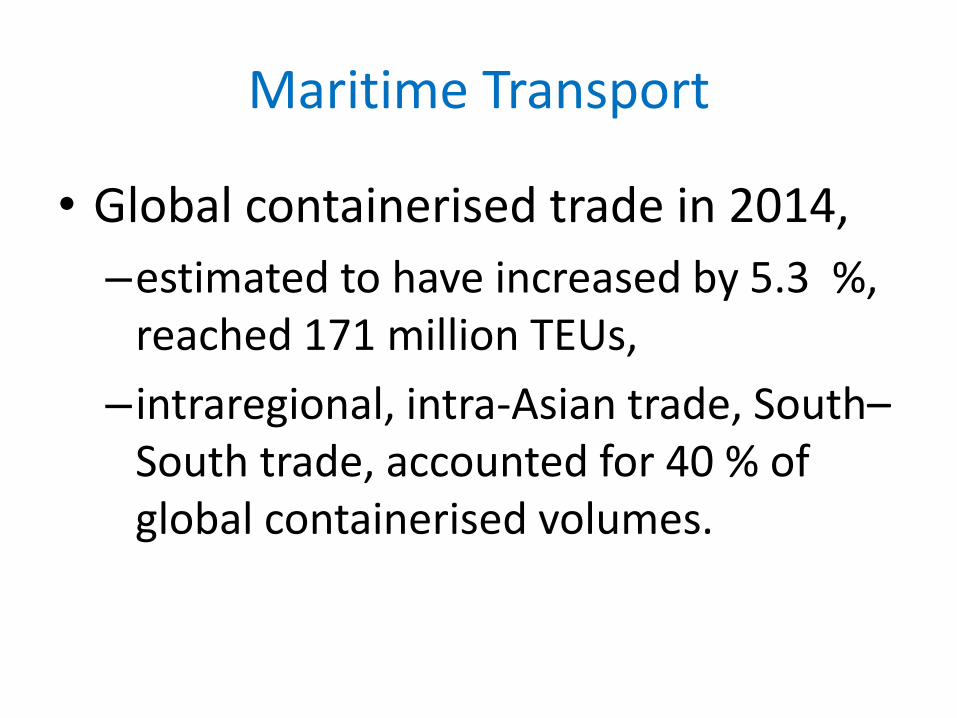
• Global containerised trade in 2014,
–estimated to have increased by 5.3 %, reached 171 million TEUs,
– intraregional, intra-Asian trade, South–South trade, accounted for 40 % of global containerised volumes.
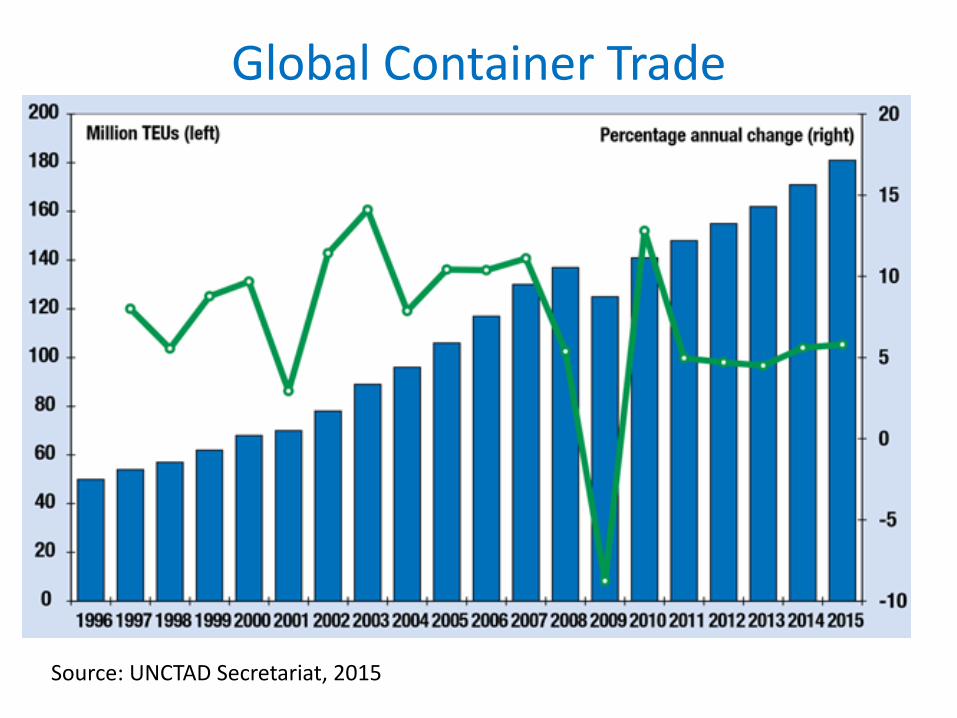
Global Container Trade
Source: UNCTAD Secretariat, 2015
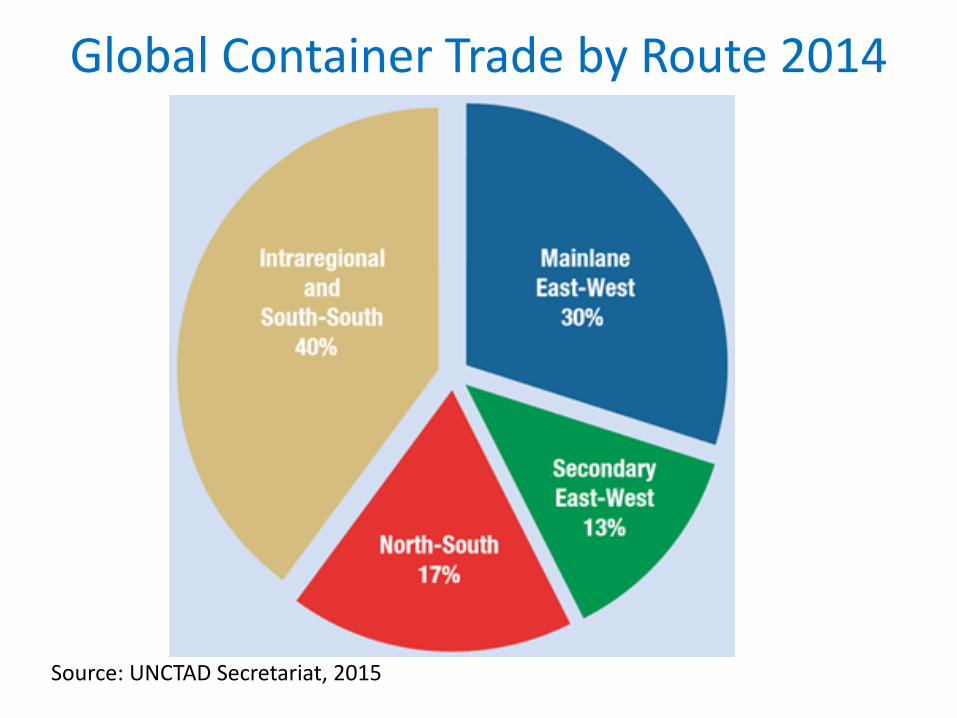
Global Container Trade by Route 2014
Source: UNCTAD Secretariat, 2015
Maritime Transport
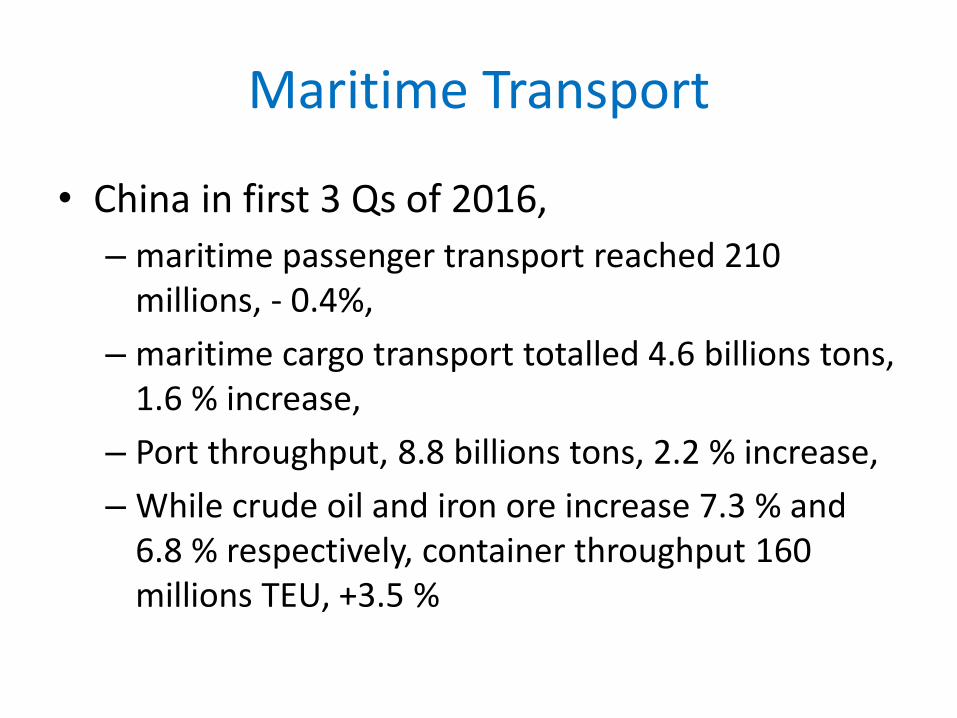
• China in first 3 Qs of 2016,
– maritime passenger transport reached 210 millions, - 0.4%,
– maritime cargo transport totalled 4.6 billions tons, 1.6 % increase,
– Port throughput, 8.8 billions tons, 2.2 % increase,
– While crude oil and iron ore increase 7.3 % and 6.8 % respectively, container throughput 160 millions TEU, +3.5 %
Maritime Transport
• Maritime transport system
–maritime transport remains the backbone of international trade and globalization, as over 80 % of world merchandise trade is carried by sea,
Maritime Transport
• Maritime transport enables other sectors:
–marine equipment manufacture,
–marine insurance,
–banking and brokering,
– classification and consultancy,
– fisheries,
– tourism
–offshore energy sector,
– shipbuilding and ship demolition
Maritime Transport • Sustainable maritime transport systems entail
transport infrastructure and services that are – safe,
– socially acceptable,
– universally accessible,
– reliable,
– affordable,
– fuel-efficient,
– environmentally friendly,
– low carbon and climate-resilient.
Maritime Transport
• Factors driving sustainability in maritime transport?
• Efforts to improve environmental and social performance of maritime transport are driven by regulation, market requirements and customer demands, in global supply chain for: – greater corporate social responsibility,
– transparency,
– reliability,
– lighter environmental footprints
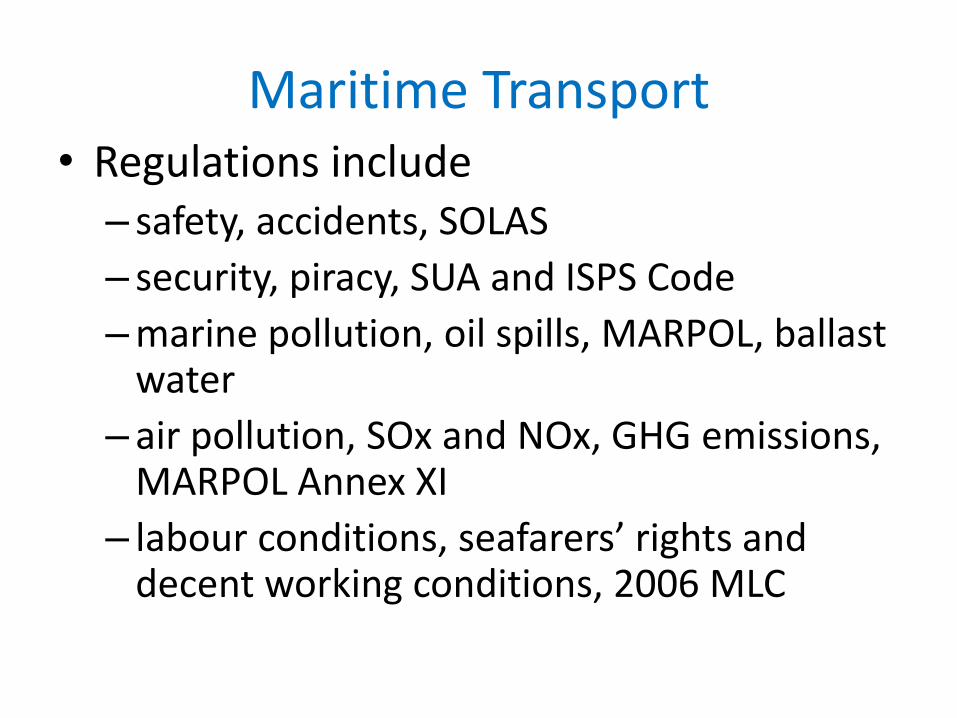
Maritime Transport • Regulations include
– safety, accidents, SOLAS
– security, piracy, SUA and ISPS Code
–marine pollution, oil spills, MARPOL, ballast water
– air pollution, SOx and NOx, GHG emissions, MARPOL Annex XI
– labour conditions, seafarers’ rights and decent working conditions, 2006 MLC
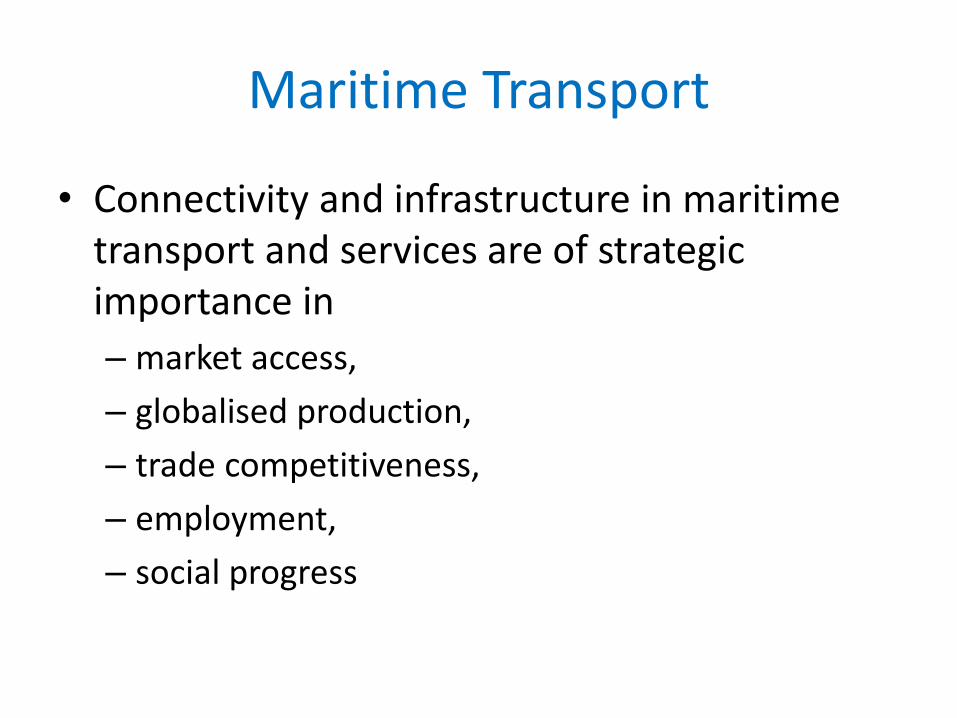
Maritime Transport
• Connectivity and infrastructure in maritime transport and services are of strategic importance in
– market access,
– globalised production,
– trade competitiveness,
– employment,
– social progress
3. World Fleet and Operations
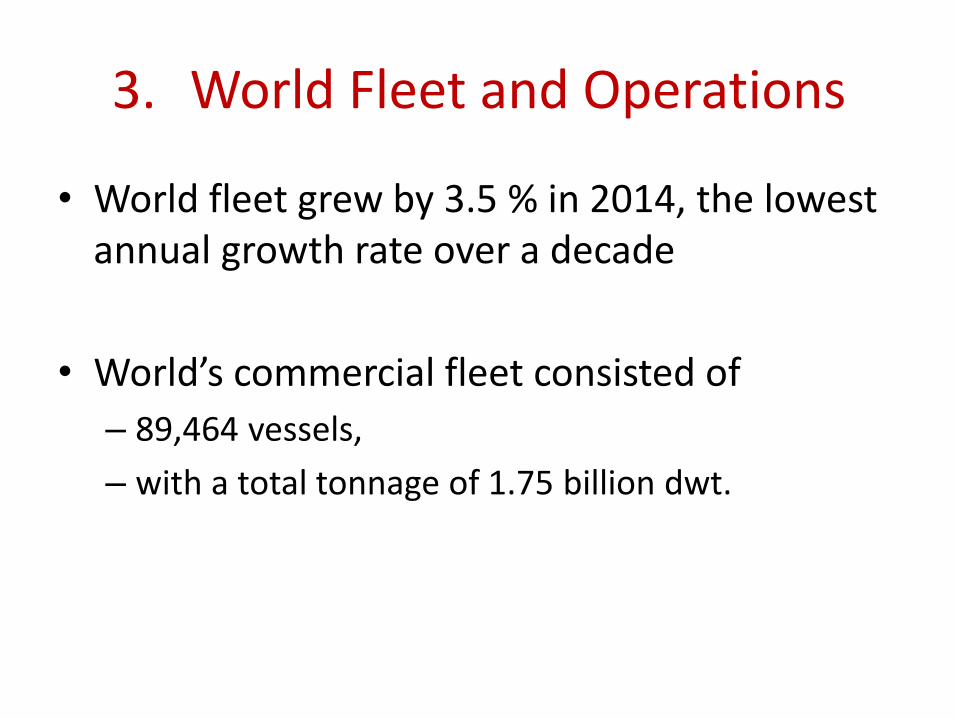
3. World Fleet and Operations
• World fleet grew by 3.5 % in 2014, the lowest annual growth rate over a decade
• World’s commercial fleet consisted of
– 89,464 vessels,
– with a total tonnage of 1.75 billion dwt.
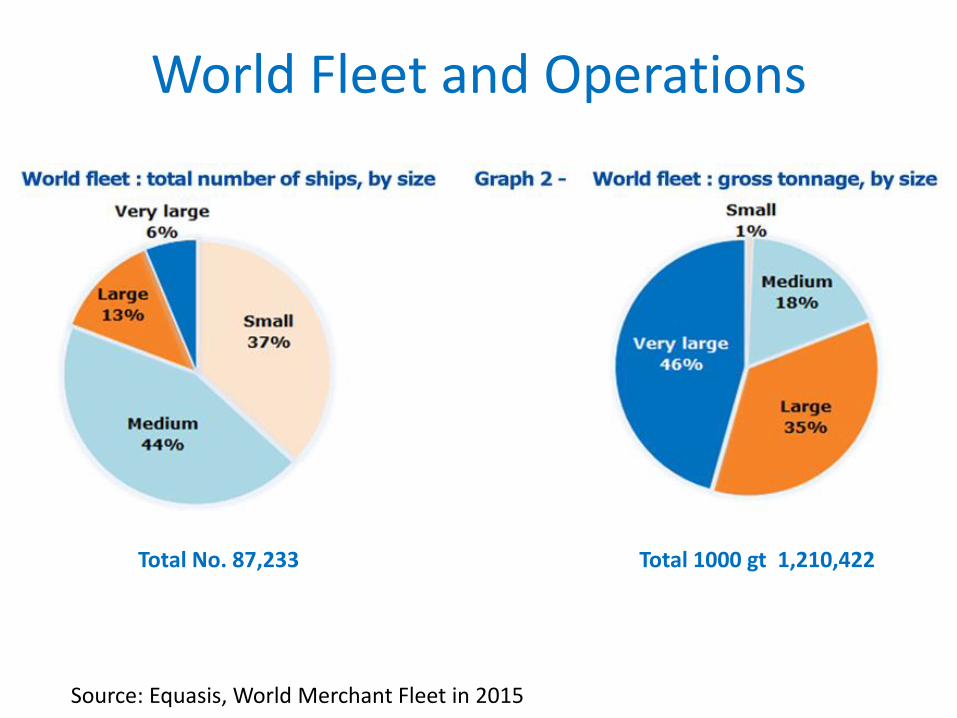
World Fleet and Operations
Source: Equasis, World Merchant Fleet in 2015
Total No. 87,233 Total 1000 gt 1,210,422
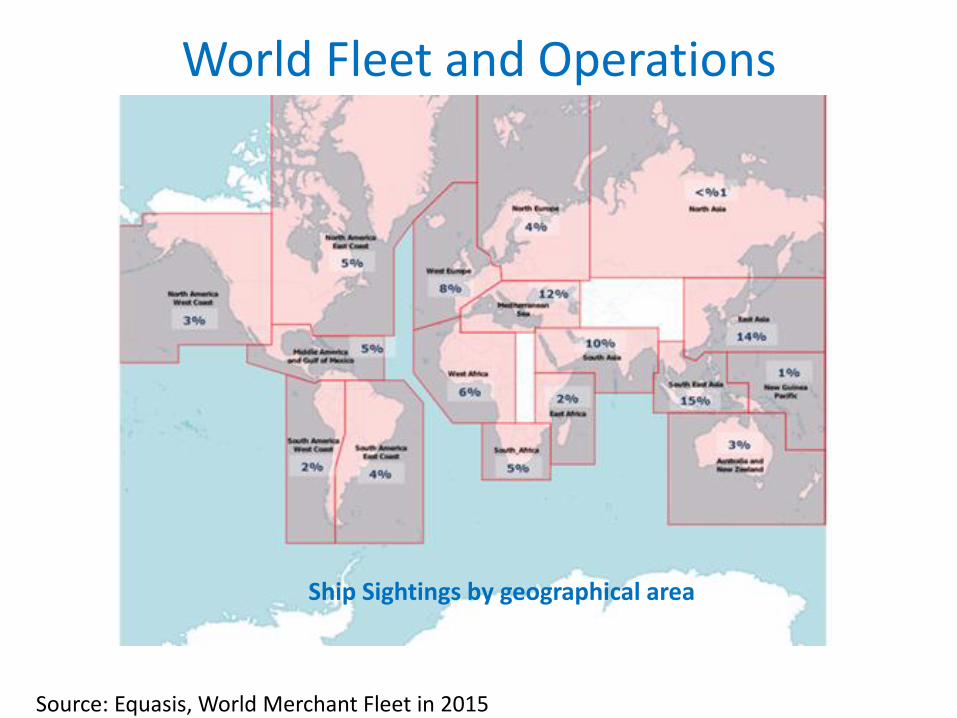
World Fleet and Operations
Source: Equasis, World Merchant Fleet in 2015
Ship Sightings by geographical area
World Fleet and Operations
• Greece continues to be the largest ship-owning country, followed by
– Japan,
–China,
–Germany
– Singapore
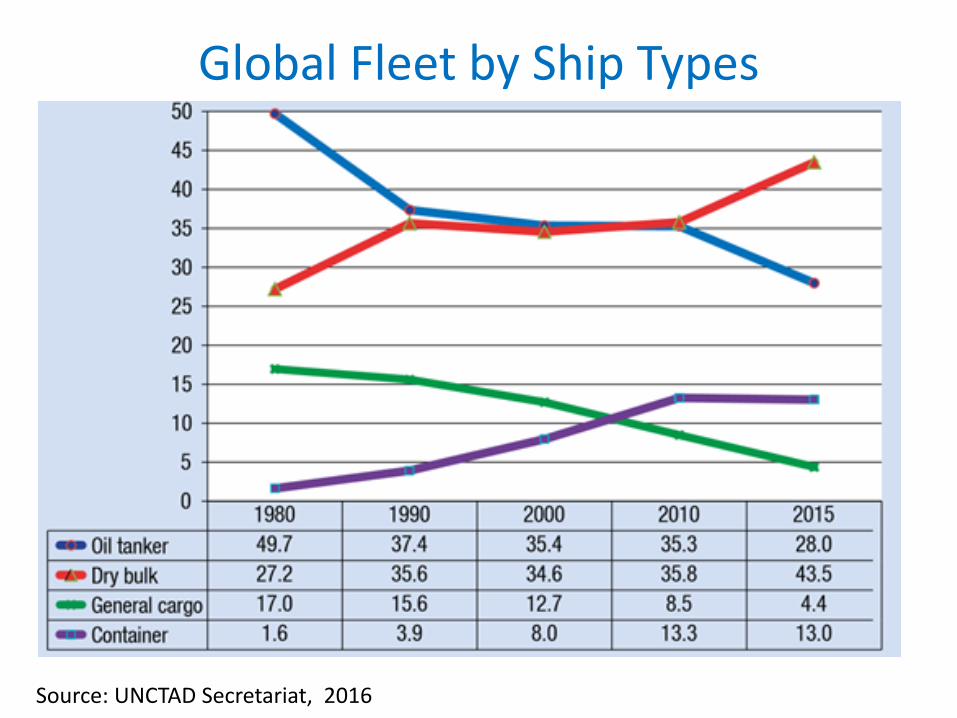
Global Fleet by Ship Types
Source: UNCTAD Secretariat, 2016
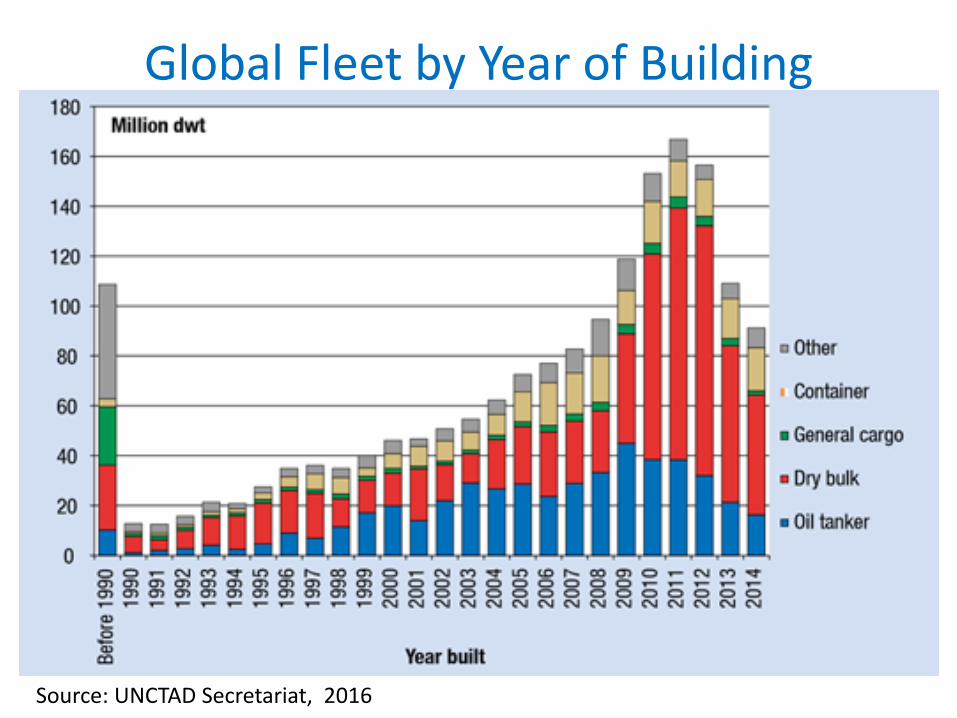
Global Fleet by Year of Building
Source: UNCTAD Secretariat, 2016
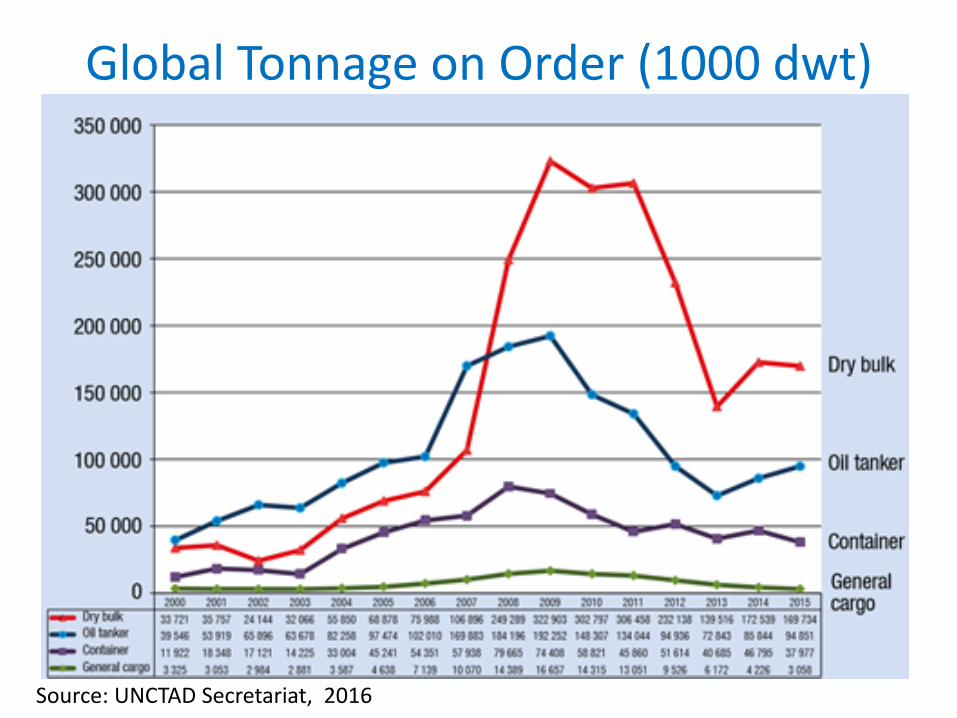
Global Tonnage on Order (1000 dwt)
Source: UNCTAD Secretariat, 2016
World Fleet and Operations
• New regulations require the shipping industry to invest in environmental technologies, in emissions, waste, and ballast water treatment.
• Some investments are not only beneficial for the environment, but may also lead to longer-term cost savings, due to increased fuel efficiency.
World Fleet and Operations
• World Fleet in 2014,
–World’s commercial fleet consisted of 89,464 vessels, with a total tonnage of 1.75 billion dwt.
– the greatest and expanding share in the global fleet are dry bulk carriers, which by the beginning of 2015 had reached a share of 43.5 % of total capacity.
World Fleet and Operations
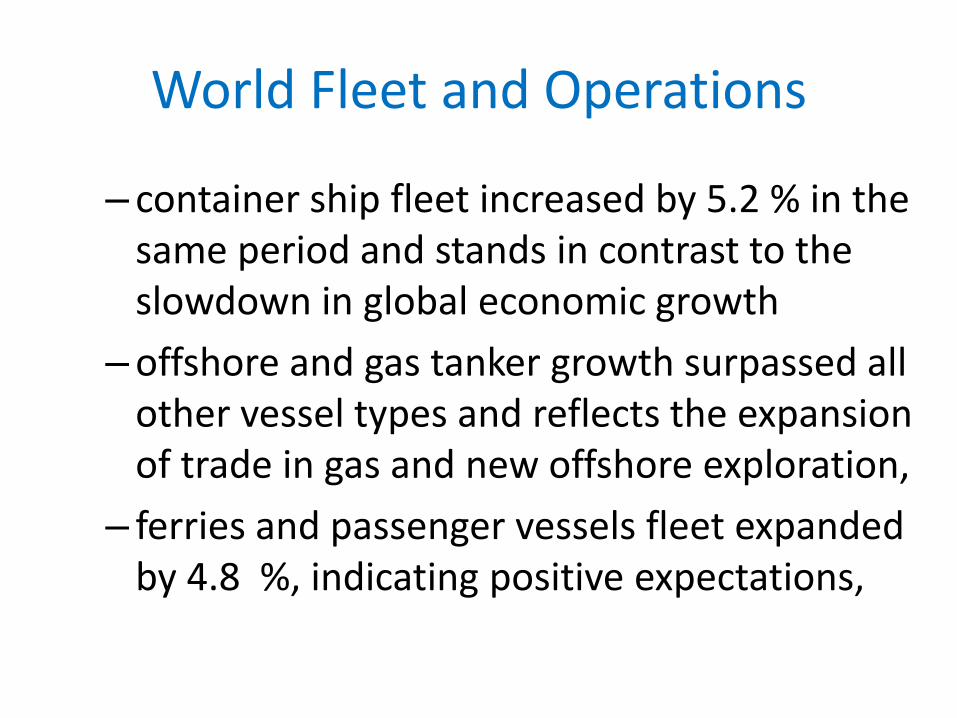
– container ship fleet increased by 5.2 % in the same period and stands in contrast to the slowdown in global economic growth
–offshore and gas tanker growth surpassed all other vessel types and reflects the expansion of trade in gas and new offshore exploration,
– ferries and passenger vessels fleet expanded by 4.8 %, indicating positive expectations,
World Fleet and Operations
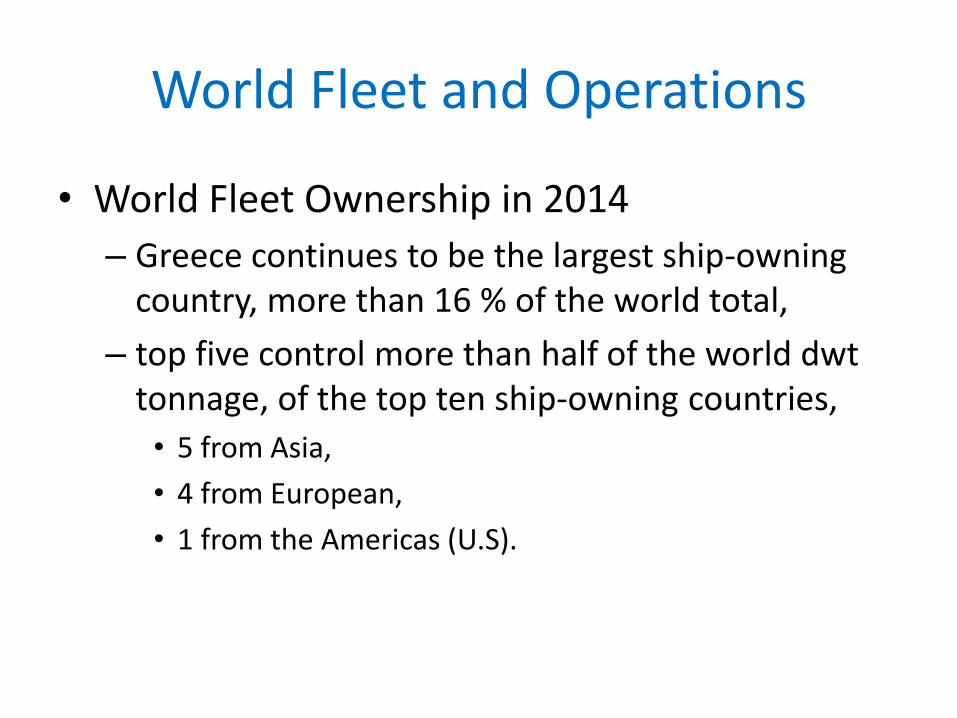
• World Fleet Ownership in 2014
– Greece continues to be the largest ship-owning country, more than 16 % of the world total,
– top five control more than half of the world dwt tonnage, of the top ten ship-owning countries,
• 5 from Asia,
• 4 from European,
• 1 from the Americas (U.S).
World Fleet and Operations
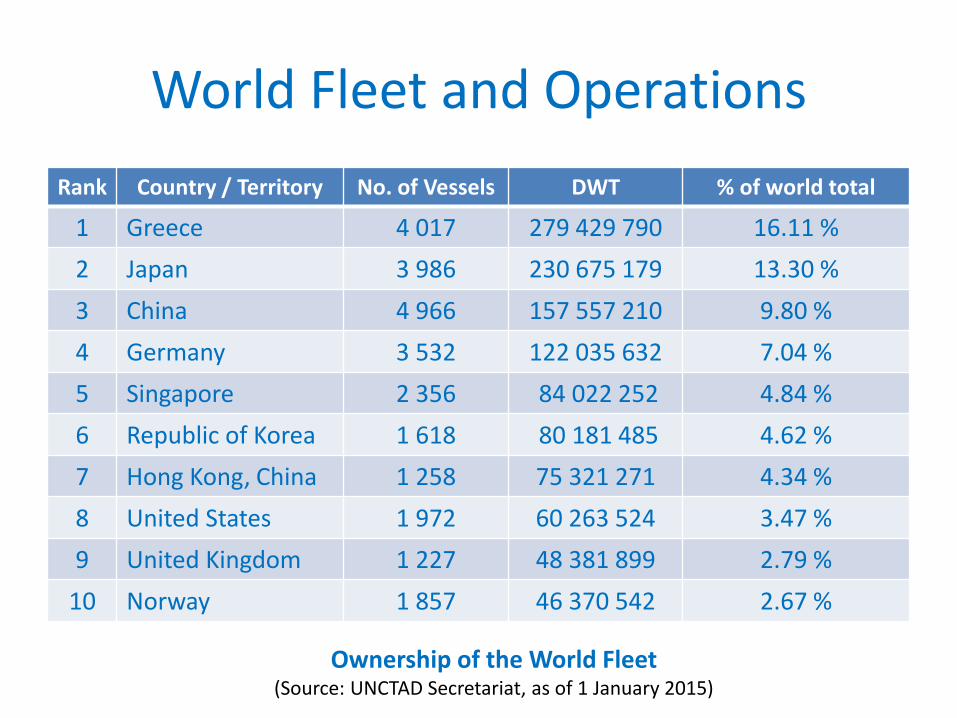
Rank Country / Territory No. of Vessels DWT % of world total
1 Greece 4 017 279 429 790 16.11 %
2 Japan 3 986 230 675 179 13.30 %
3 China 4 966 157 557 210 9.80 %
4 Germany 3 532 122 035 632 7.04 %
5 Singapore 2 356 84 022 252 4.84 %
6 Republic of Korea 1 618 80 181 485 4.62 %
7 Hong Kong, China 1 258 75 321 271 4.34 %
8 United States 1 972 60 263 524 3.47 %
9 United Kingdom 1 227 48 381 899 2.79 %
10 Norway 1 857 46 370 542 2.67 %
Ownership of the World Fleet (Source: UNCTAD Secretariat, as of 1 January 2015)
World Fleet and Operations
• China, Indonesia and the Russian Federation have a large number of nationally flagged and owned ships, which are largely employed in coastal or inter-island shipping.
• These markets tend to be protected from foreign competition and do not necessarily fall under global IMO regulations. Ships deployed on these services tend to be smaller and older than the fleet deployed on international routes.
World Fleet and Operations
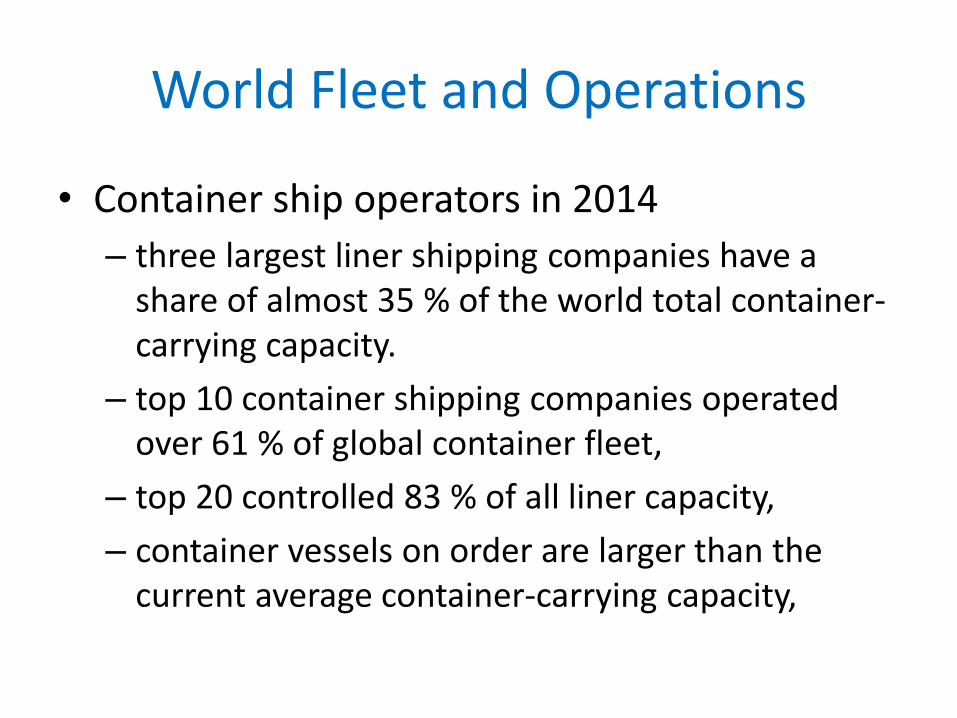
• Container ship operators in 2014
– three largest liner shipping companies have a share of almost 35 % of the world total container-carrying capacity.
– top 10 container shipping companies operated over 61 % of global container fleet,
– top 20 controlled 83 % of all liner capacity,
– container vessels on order are larger than the current average container-carrying capacity,
World Fleet and Operations
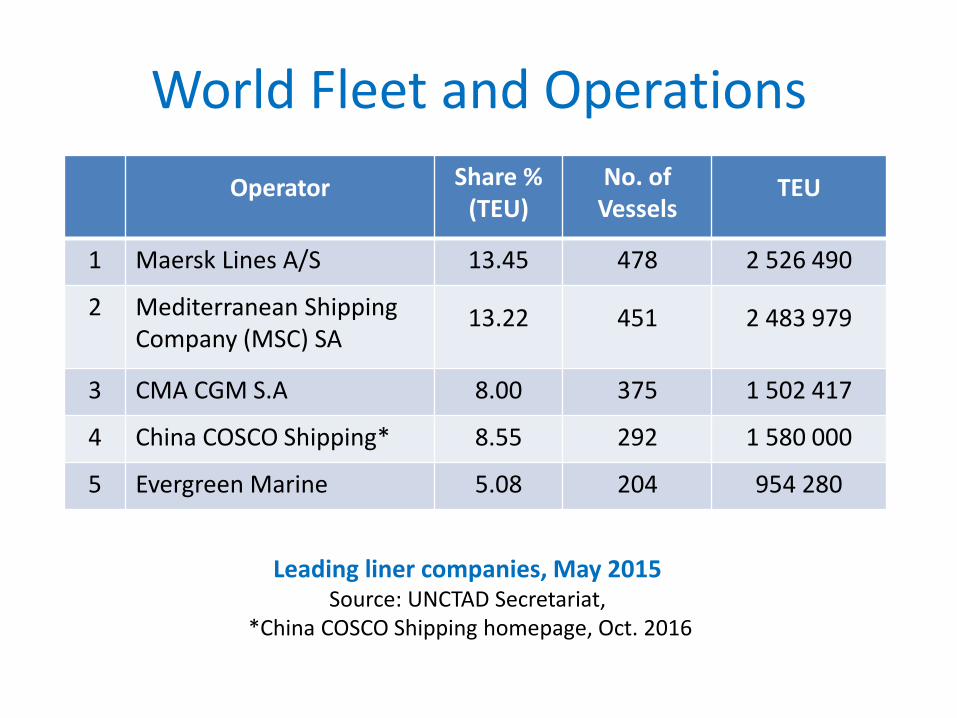
Operator Share % (TEU)
No. of Vessels
TEU
1 Maersk Lines A/S 13.45 478 2 526 490
2 Mediterranean Shipping Company (MSC) SA
13.22 451 2 483 979
3 CMA CGM S.A 8.00 375 1 502 417
4 China COSCO Shipping* 8.55 292 1 580 000
5 Evergreen Marine 5.08 204 954 280
Leading liner companies, May 2015 Source: UNCTAD Secretariat,
*China COSCO Shipping homepage, Oct. 2016
World Fleet and Operations
• China has the highest liner shipping connectivity index (LSCI), followed by Singapore, Hong Kong (China), Republic of Korea, Malaysia, and Germany.
• Morocco, Egypt and South Africa are best connected countries in Africa, reflecting their geographical position.
• Panama has the highest LSCI in Latin America, benefiting from its canal and the location and routes, followed by Mexico, Colombia and Brazil.
World Fleet and Operations
• Registration of Ships in 2014
– Panama, Liberia and the Marshall Islands are the largest vessel registries, together, they account for a 41.8 % share of the world tonnage,
– more than three quarters (75 %) of the world fleet are registered in developing countries,
– tonnage registered under a foreign flag is 71 % of the world total.
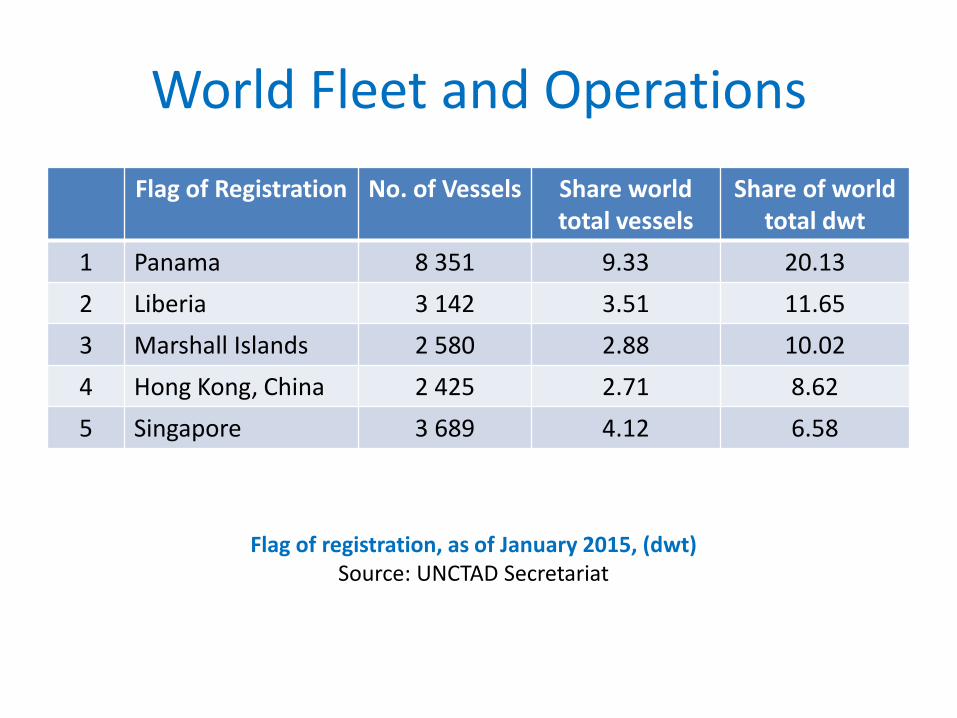
World Fleet and Operations
Flag of Registration No. of Vessels Share world total vessels
Share of world total dwt
1 Panama 8 351 9.33 20.13
2 Liberia 3 142 3.51 11.65
3 Marshall Islands 2 580 2.88 10.02
4 Hong Kong, China 2 425 2.71 8.62
5 Singapore 3 689 4.12 6.58
Flag of registration, as of January 2015, (dwt) Source: UNCTAD Secretariat
World Fleet and Operations
• Shipbuilding, Demolition and New Orders
• newbuildings
– World fleet grew by 42 million GT in 2014,
– newbuildings almost 64 million GT
– demolitions about 22 million GT.
World Fleet and Operations
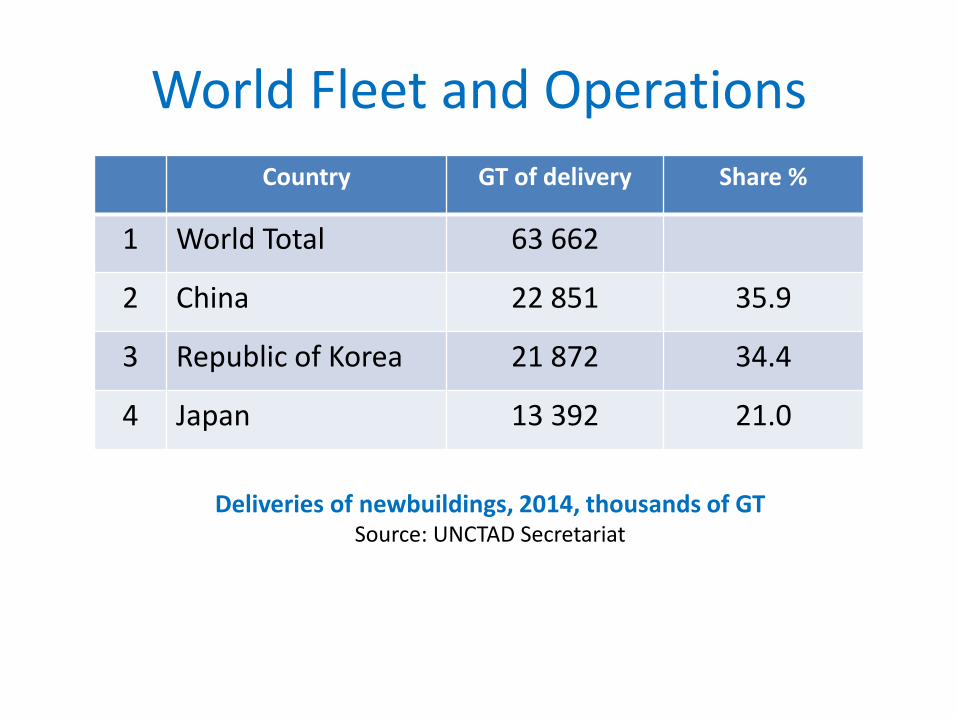
• 91 % GT delivered in 2014 was built in just three countries:
– China (35.9 %);
– Republic of Korea (34.4 %);
– Japan (21.0 %),
World Fleet and Operations
• China mostly built – dry bulk carriers,
– followed by container ships,
– tankers;
• Republic of Korea built mostly – container ships,
– oil tankers;
• Japan specialised fundamentally in – bulk carriers.
World Fleet and Operations
Country GT of delivery Share %
1 World Total 63 662
2 China 22 851 35.9
3 Republic of Korea 21 872 34.4
4 Japan 13 392 21.0
Deliveries of newbuildings, 2014, thousands of GT Source: UNCTAD Secretariat
World Fleet and Operations
• Demolition of ships
• scrapping of ships helps reduce oversupply of tonnage, it encourages the modernization of the fleet,
• vessels demolished tend to be less fuel efficient, more pollution to the environment as far as emissions are concerned.
World Fleet and Operations
• China has extended a subsidy programme that encourages shipping companies to scrap old vessels.
• The scheme, which began in 2013, provides financial incentives to shipowners to replace old vessels with newer, more environmentally friendly models

World Fleet and Operations
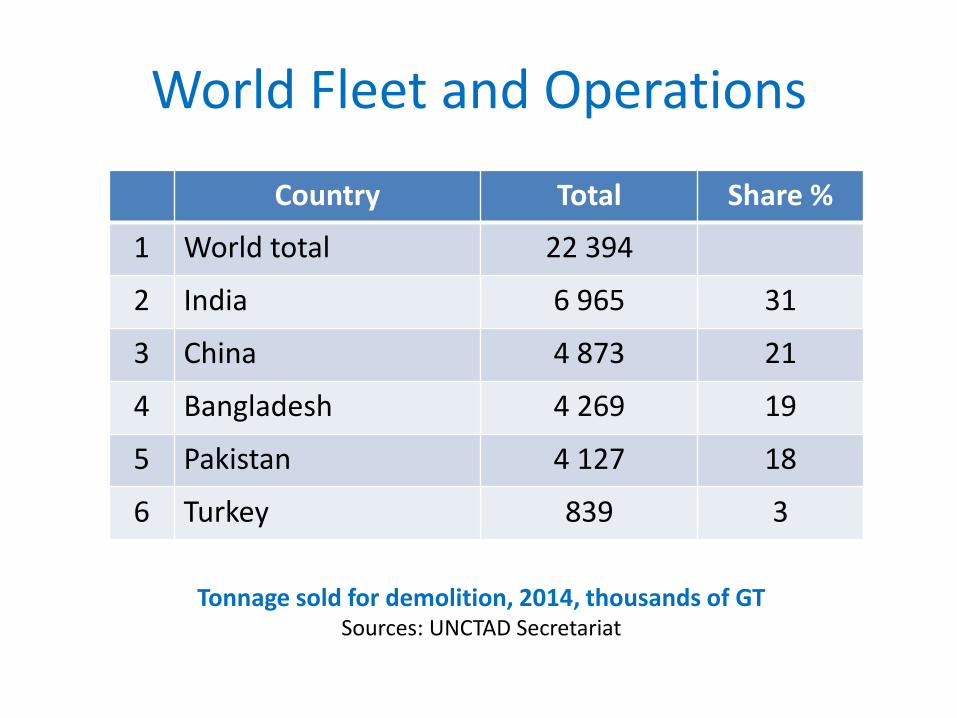
• Bangladesh, India and Pakistan and China together account for more than 90 % of global ship breaking.
• most container ships are demolished in India,
• Bangladesh and China purchased more dry bulk carriers,
• Pakistan mostly oil tankers.
World Fleet and Operations
Country Total Share %
1 World total 22 394
2 India 6 965 31
3 China 4 873 21
4 Bangladesh 4 269 19
5 Pakistan 4 127 18
6 Turkey 839 3
Tonnage sold for demolition, 2014, thousands of GT Sources: UNCTAD Secretariat

World Fleet and Operations
• Maritime Transport Cost
– International maritime transport costs are a key component of trade costs and economic development,
– seven main determinants of maritime transport costs are available to discuss possible reasons for the overall freight costs estimated,
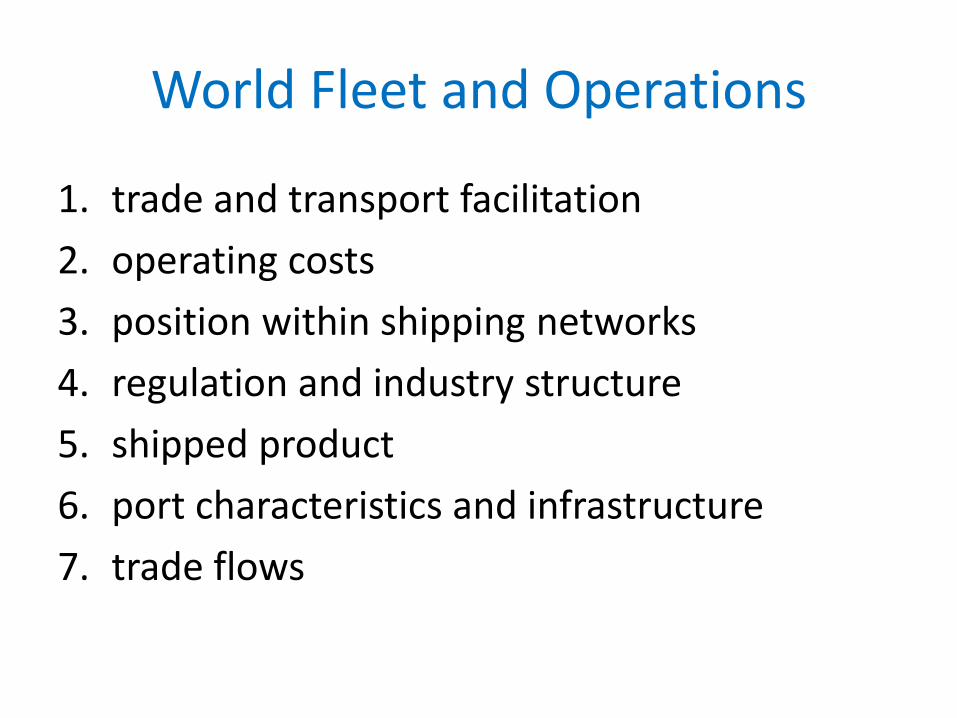
World Fleet and Operations
1. trade and transport facilitation
2. operating costs
3. position within shipping networks
4. regulation and industry structure
5. shipped product
6. port characteristics and infrastructure
7. trade flows
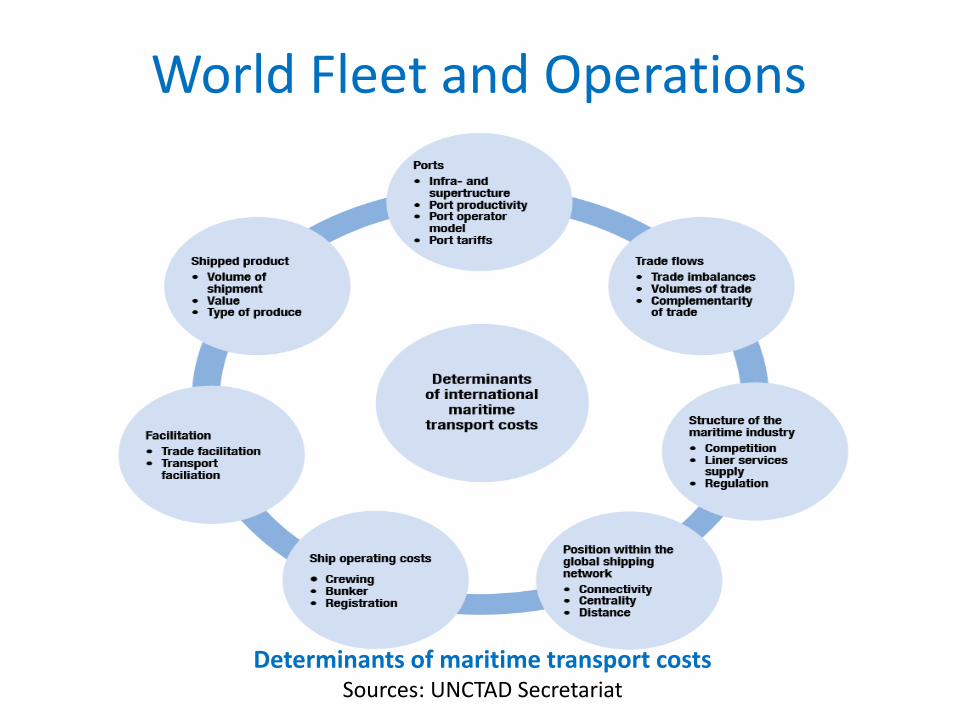
World Fleet and Operations
Determinants of maritime transport costs Sources: UNCTAD Secretariat
4. International Ports
and Sustainability
4. International Ports and Sustainability
• The performance of ports and terminals is important because it affects a country’s trade competitiveness,
• many determinants to port performance,
– labour relations,
– cargo handling equipment
– port access channel,
– customs efficiency,
International Ports and Sustainability
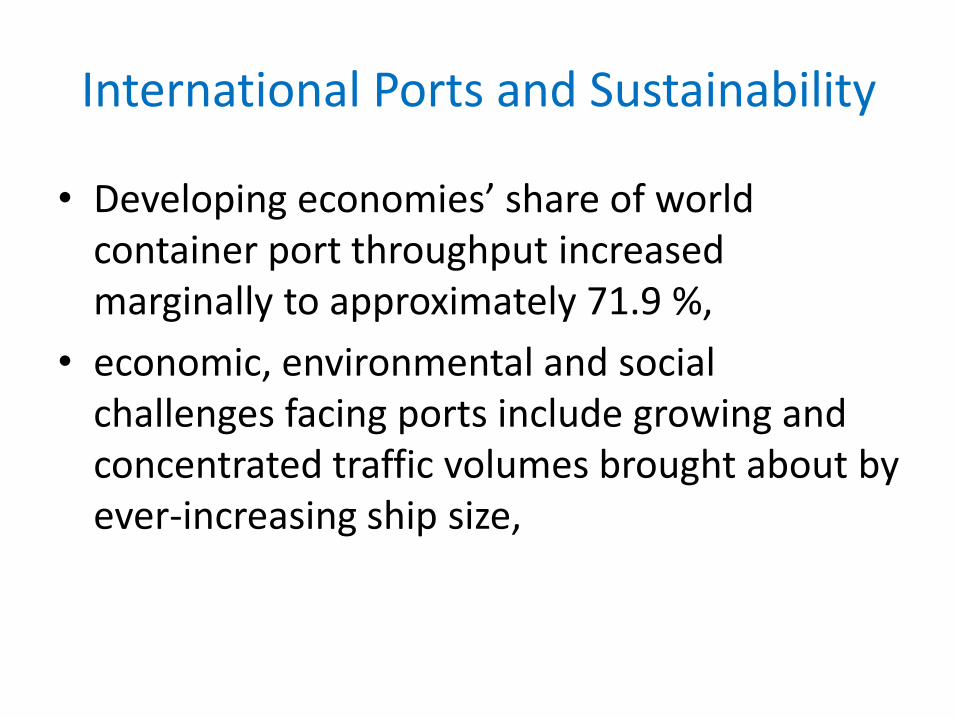
• Developing economies’ share of world container port throughput increased marginally to approximately 71.9 %,
• economic, environmental and social challenges facing ports include growing and concentrated traffic volumes brought about by ever-increasing ship size,
International Ports and Sustainability
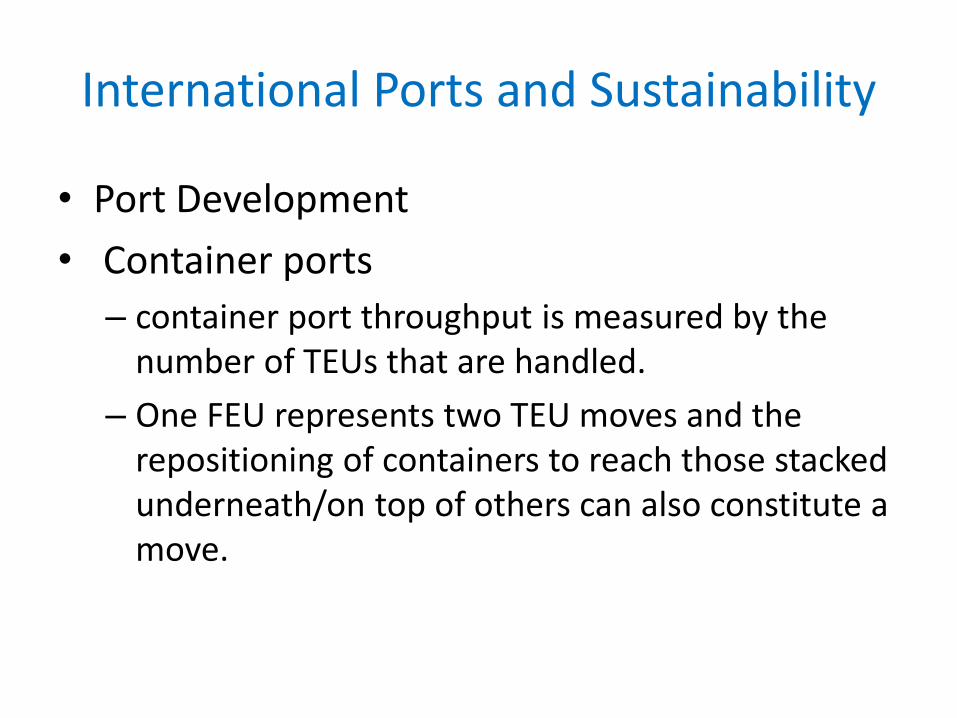
• Port Development
• Container ports
– container port throughput is measured by the number of TEUs that are handled.
– One FEU represents two TEU moves and the repositioning of containers to reach those stacked underneath/on top of others can also constitute a move.
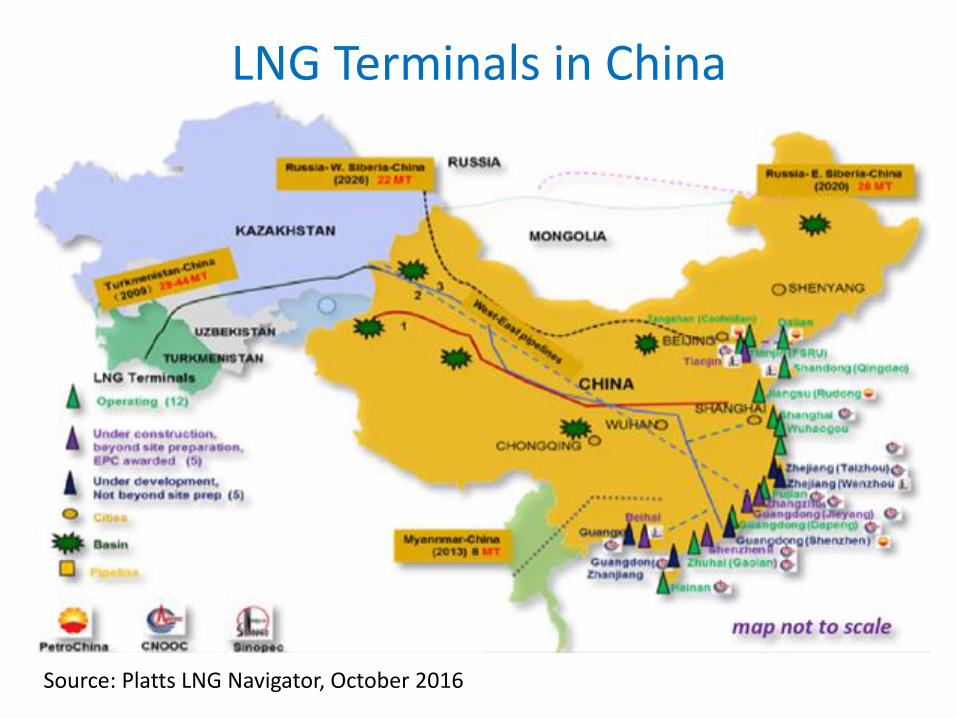
LNG Terminals in China
Source: Platts LNG Navigator, October 2016
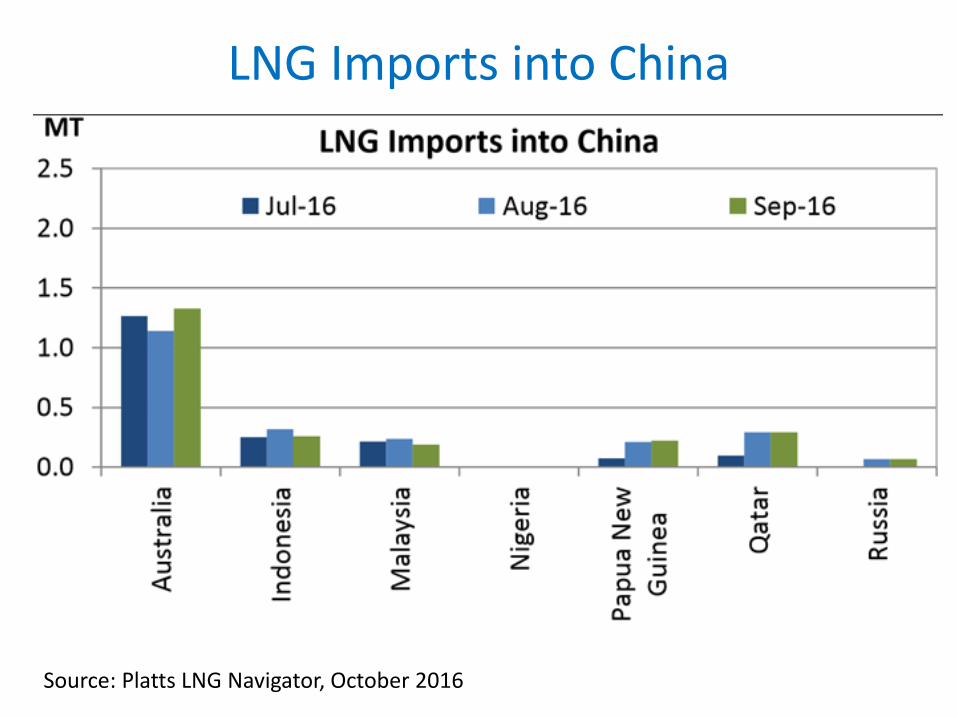
LNG Imports into China
Source: Platts LNG Navigator, October 2016
International Ports and Sustainability
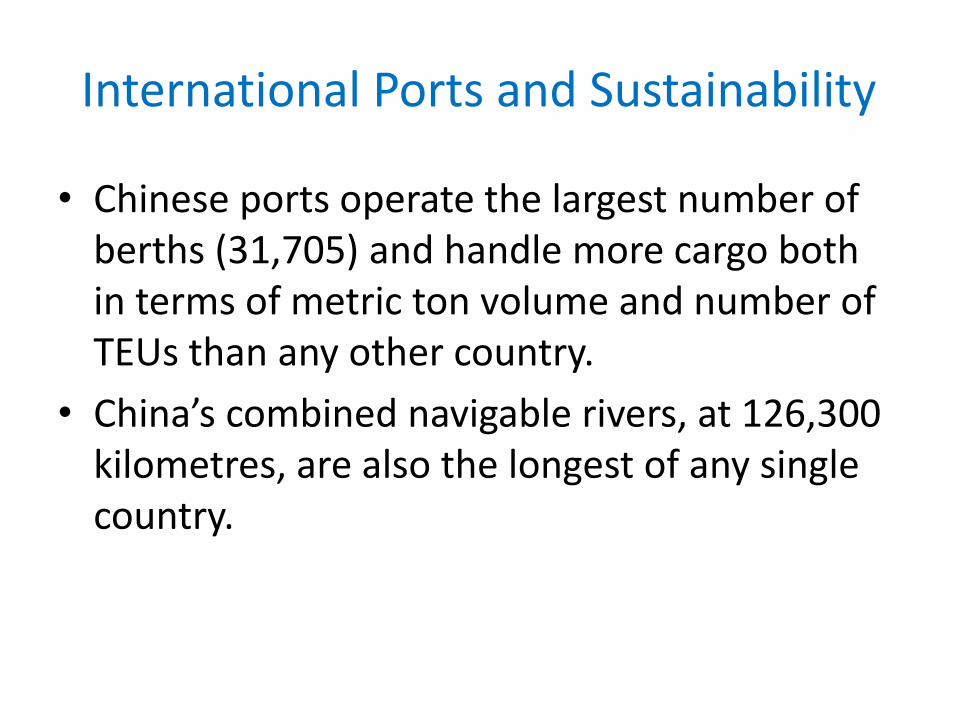
• Chinese ports operate the largest number of berths (31,705) and handle more cargo both in terms of metric ton volume and number of TEUs than any other country.
• China’s combined navigable rivers, at 126,300 kilometres, are also the longest of any single country.
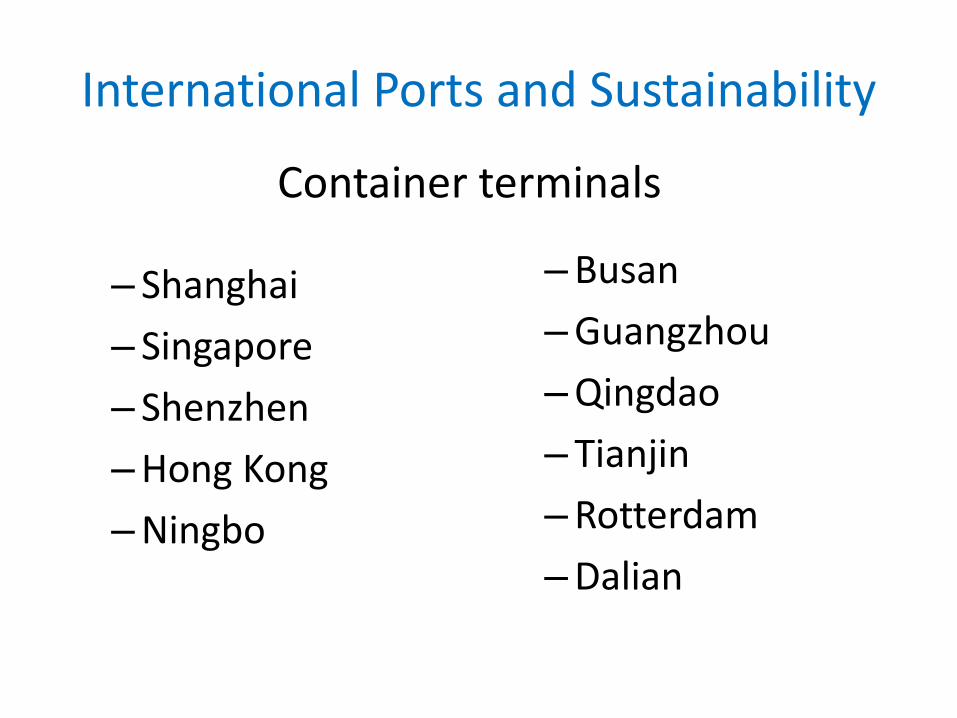
International Ports and Sustainability
– Shanghai
– Singapore
– Shenzhen
–Hong Kong
–Ningbo
–Busan
–Guangzhou
–Qingdao
– Tianjin
–Rotterdam
–Dalian
Container terminals
International Ports and Sustainability
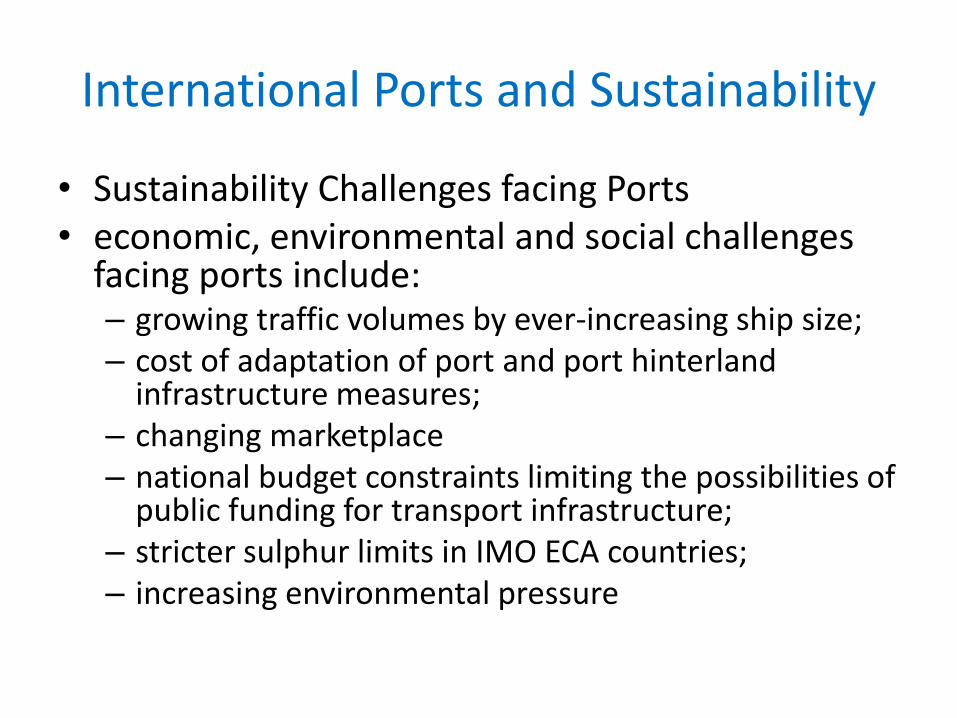
• Sustainability Challenges facing Ports • economic, environmental and social challenges
facing ports include: – growing traffic volumes by ever-increasing ship size; – cost of adaptation of port and port hinterland
infrastructure measures; – changing marketplace – national budget constraints limiting the possibilities of
public funding for transport infrastructure; – stricter sulphur limits in IMO ECA countries; – increasing environmental pressure
International Ports and Sustainability
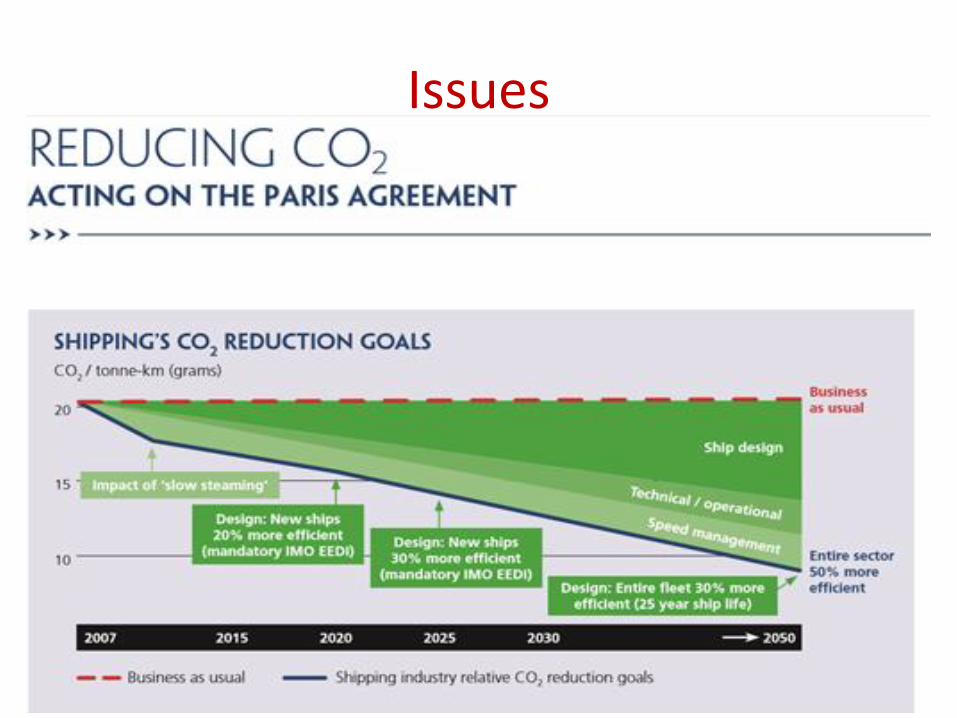
• Environmental challenges
– UNFCCC
– Kyoto Protocol
– Paris Agreement
– Roadmap
– IMO MARPOL Annex VI
International Ports and Sustainability
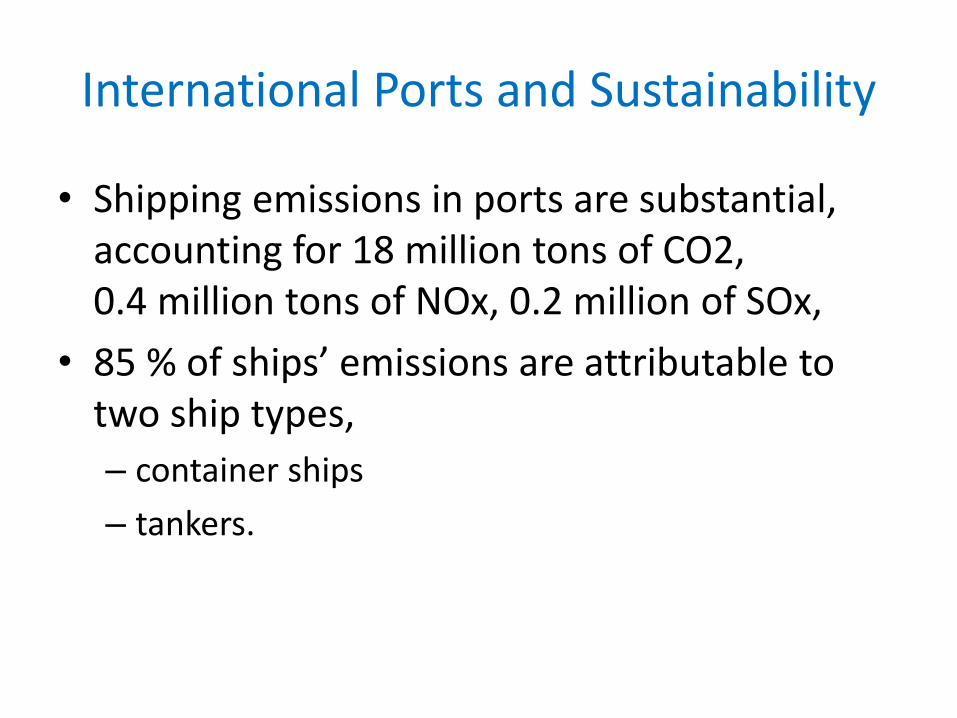
• Shipping emissions in ports are substantial, accounting for 18 million tons of CO2, 0.4 million tons of NOx, 0.2 million of SOx,
• 85 % of ships’ emissions are attributable to two ship types,
– container ships
– tankers.
International Ports and Sustainability
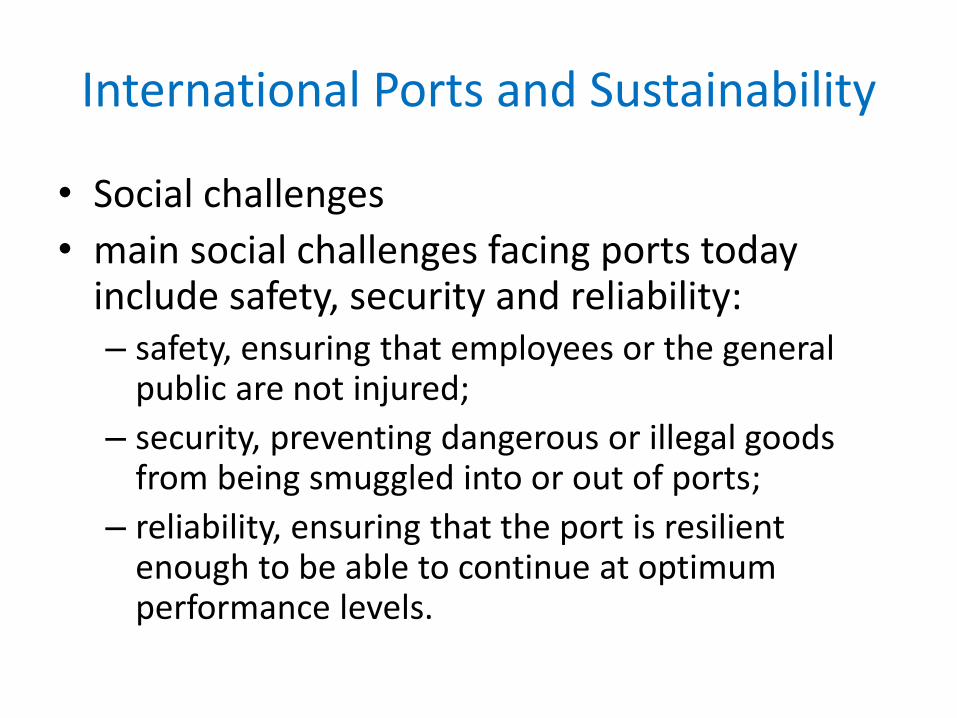
• Social challenges
• main social challenges facing ports today include safety, security and reliability: – safety, ensuring that employees or the general
public are not injured;
– security, preventing dangerous or illegal goods from being smuggled into or out of ports;
– reliability, ensuring that the port is resilient enough to be able to continue at optimum performance levels.
5. Regulatory Development
and Issues
5. Regulatory Development and Issues
• Polar Code
• HNS Protocol
• MLC
• BWM Convention
• GHG emission control and EEDI
Regulatory Development
• UNCLOS provisions also apply in polar areas, with respect to the jurisdictional status of polar waters and international straits, maritime boundaries, navigational rights and freedoms, as well as coastal and port State control.
Regulatory Development
• Article 234 of UNCLOS entitled “Ice-covered areas” provides that
–Coastal States have the right to adopt and enforce non-discriminatory laws and regulations for the prevention, reduction and control of marine pollution from vessels in ice-covered areas within the limits of the exclusive economic zone.
Regulatory Development
• both IMO and ILO deal with a wide range of safety, environmental and seafarers’ issues.
• Many of these legal instruments are widely accepted by States and their provisions are applicable generally, including in the polar areas,
• Main conventions that establish mandatory rules and regulations include – SOLAS
– MARPOL
– 2006 MLC
Regulatory Development
• several regulatory measures were adopted at IMO in legal framework of
– ship-source air pollution,
– reduction of greenhouse gas (GHG) emissions from international shipping,
• third IMO GHG Study 2014 was finalised.
Regulatory Development
• guidelines for the development of the Inventory of Hazardous Materials required under the 2010 HNS Convention were adopted,
• further progress was made relating to ballast water management, ship recycling, and measures to prevent and combat pollution of the sea from oil and other harmful substances.
Regulatory Development
• In 2014, important regulatory developments in maritime transport included the adoption of the International Code for Ships Operating in Polar Waters (Polar Code),
• Polar Code is expected to enter into force on 1 January 2017,
Regulatory Development
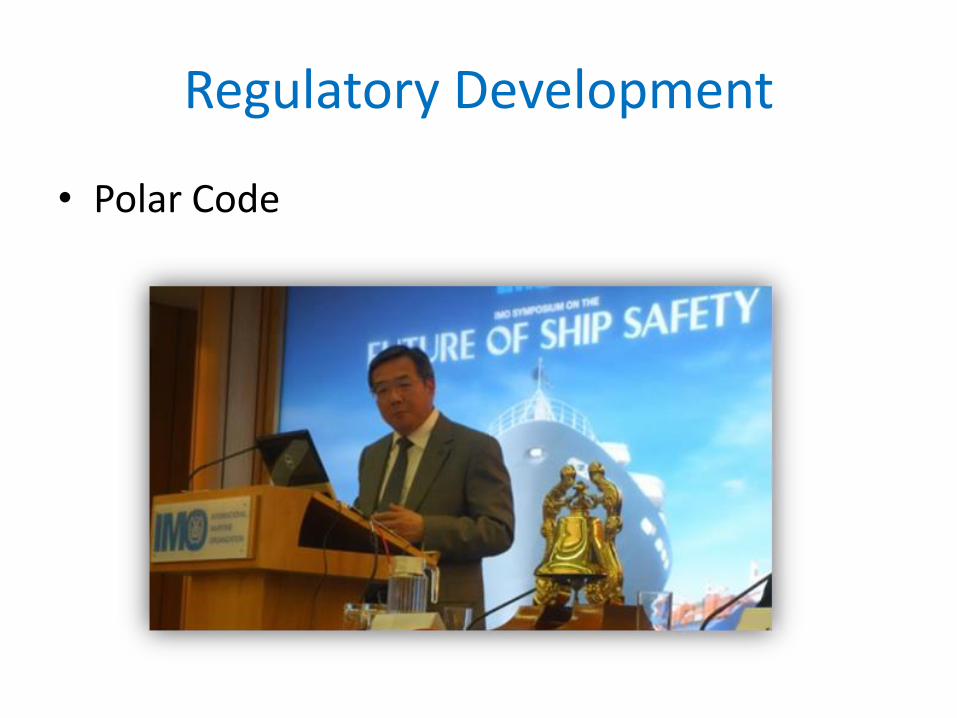
• Polar Code
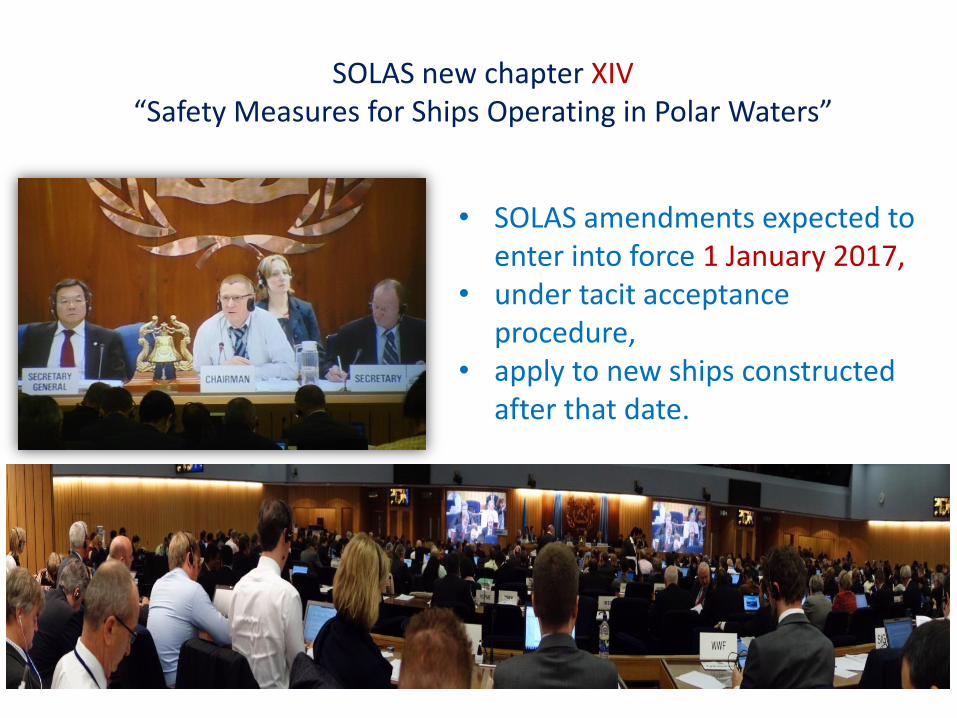
• SOLAS amendments expected to enter into force 1 January 2017,
• under tacit acceptance procedure,
• apply to new ships constructed after that date.
SOLAS new chapter XIV “Safety Measures for Ships Operating in Polar Waters”
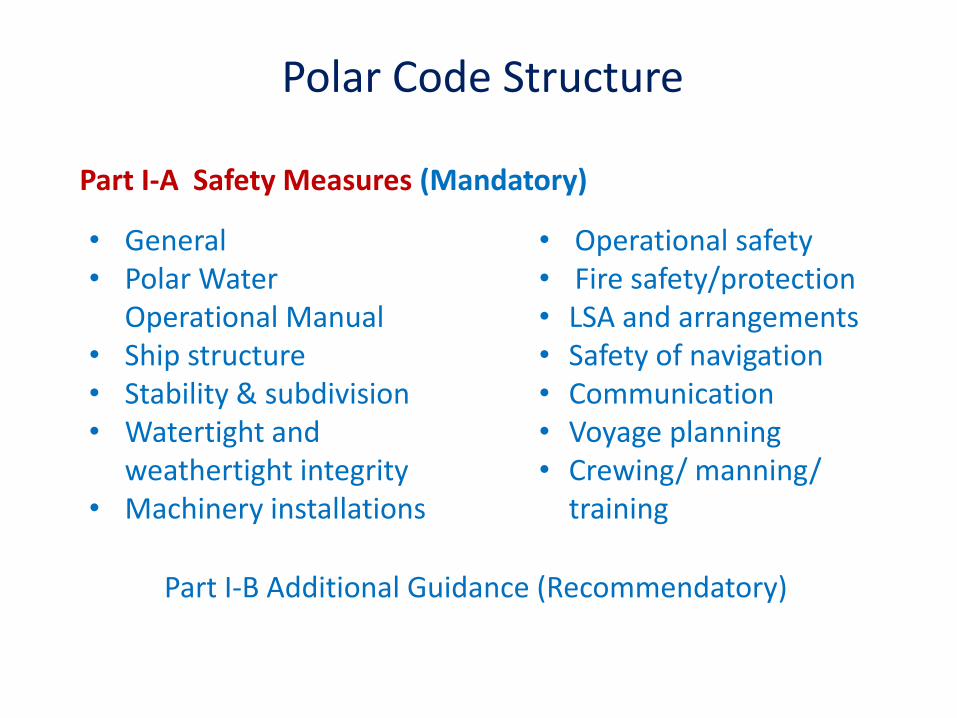
Polar Code Structure
• General • Polar Water
Operational Manual • Ship structure • Stability & subdivision • Watertight and
weathertight integrity • Machinery installations
Part I-A Safety Measures (Mandatory)
• Operational safety • Fire safety/protection • LSA and arrangements • Safety of navigation • Communication • Voyage planning • Crewing/ manning/
training
Part I-B Additional Guidance (Recommendatory)
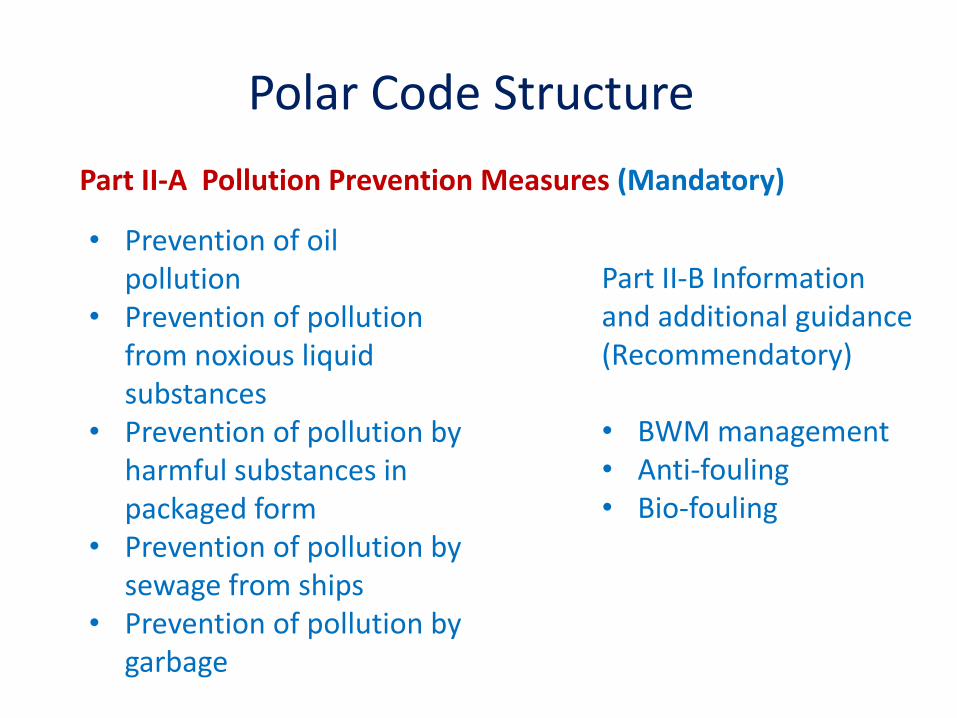
Polar Code Structure
• Prevention of oil pollution
• Prevention of pollution from noxious liquid substances
• Prevention of pollution by harmful substances in packaged form
• Prevention of pollution by sewage from ships
• Prevention of pollution by garbage
Part II-A Pollution Prevention Measures (Mandatory)
Part II-B Information and additional guidance (Recommendatory) • BWM management • Anti-fouling • Bio-fouling
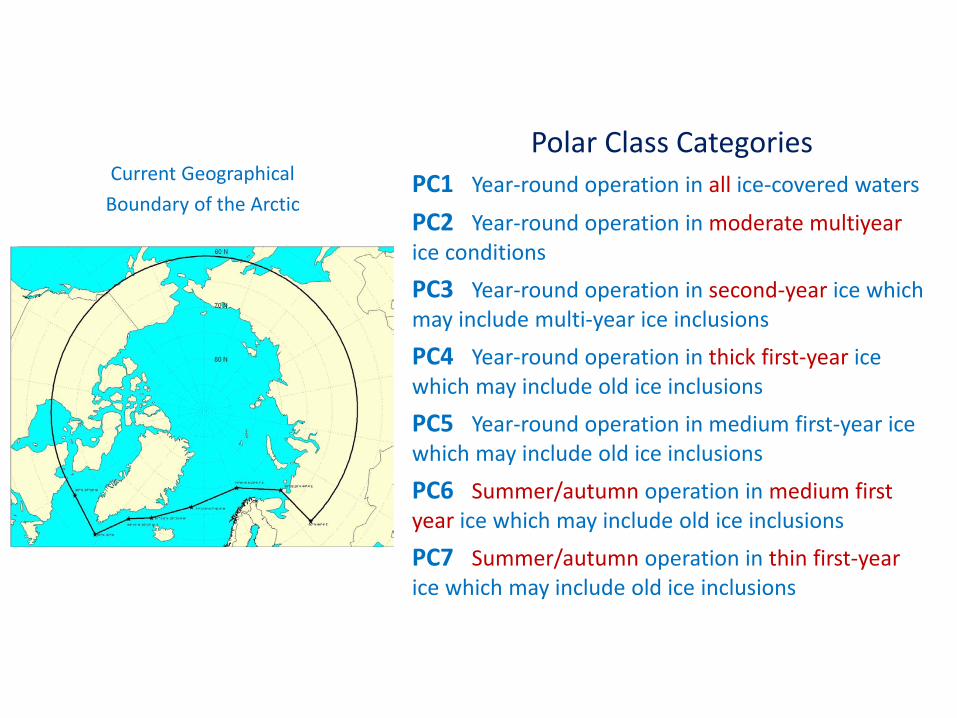
Polar Class Categories PC1 Year-round operation in all ice-covered waters
PC2 Year-round operation in moderate multiyear ice conditions
PC3 Year-round operation in second-year ice which may include multi-year ice inclusions
PC4 Year-round operation in thick first-year ice which may include old ice inclusions
PC5 Year-round operation in medium first-year ice which may include old ice inclusions
PC6 Summer/autumn operation in medium first year ice which may include old ice inclusions
PC7 Summer/autumn operation in thin first-year ice which may include old ice inclusions
Current Geographical
Boundary of the Arctic

Categories of Ships Operating in Polar Waters
A
B
C
• Designed for operation in at least medium first year ice which may include old ice inclusions
• PC 1 to 5 or equivalent
• Designed for operation in at least thin first-year ice which may include old ice inclusions
• PC 6 and 7 or equivalent
• Designed to operate in open water or in ice conditions less severe than those in categories A and B
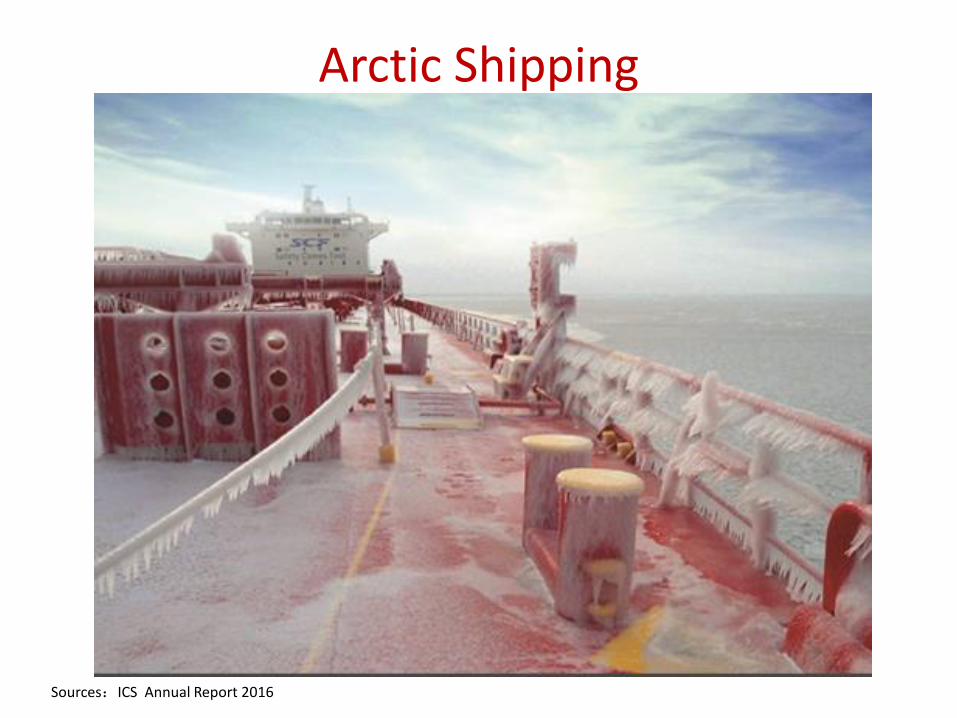
Arctic Shipping
Sources:ICS Annual Report 2016
Regulatory Development
• SOLAS
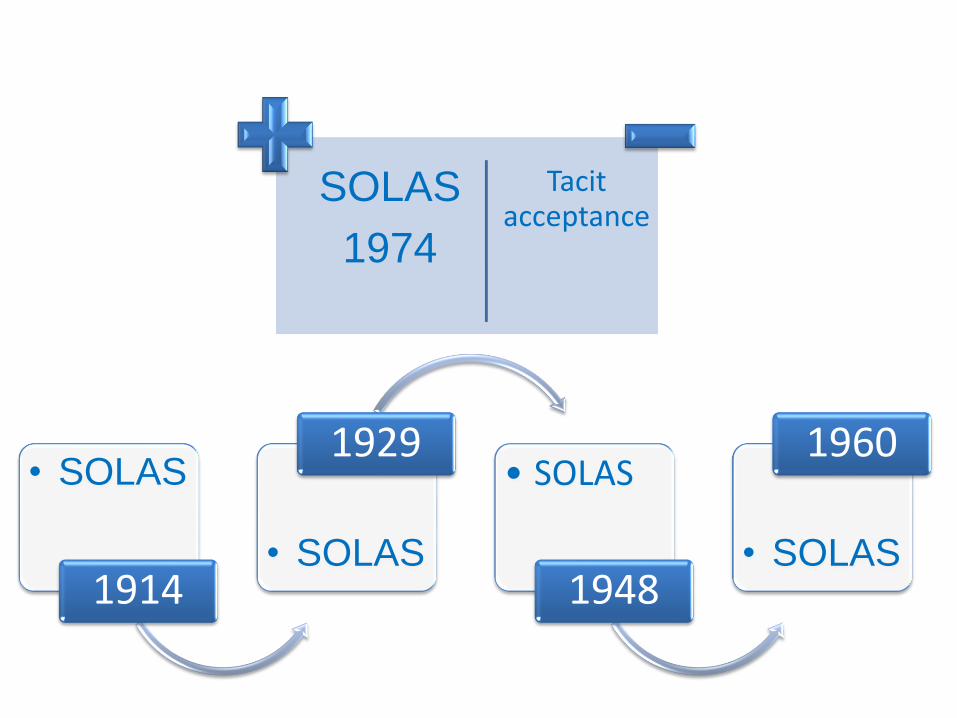
• SOLAS
1914
• SOLAS
1929 • SOLAS
1948
• SOLAS
1960
SOLAS
1974
Tacit acceptance
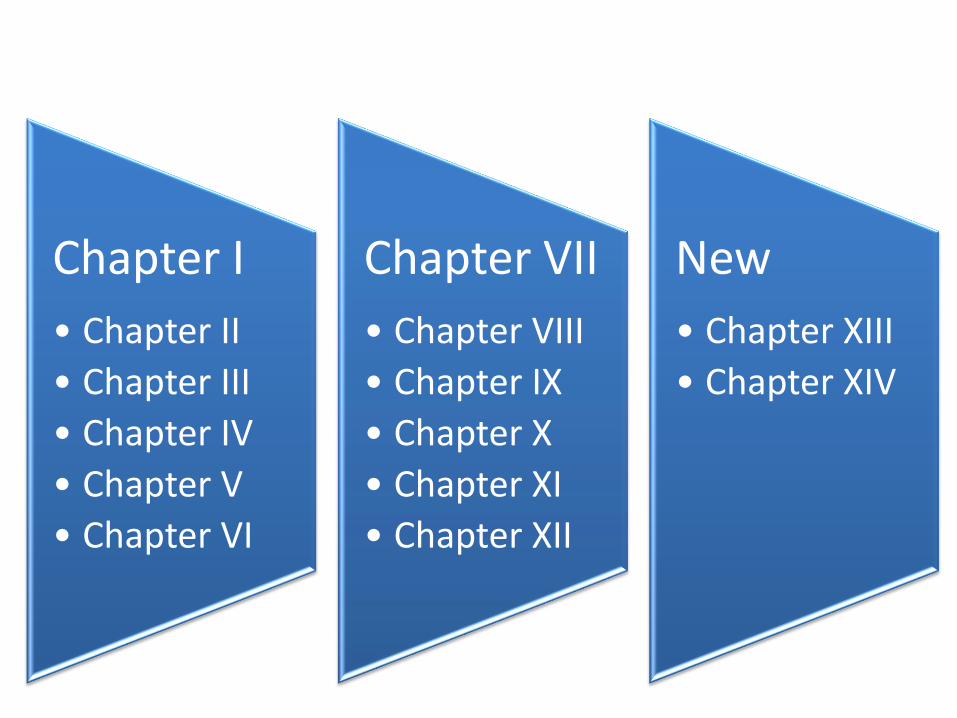
Chapter I
• Chapter II
• Chapter III
• Chapter IV
• Chapter V
• Chapter VI
Chapter VII
• Chapter VIII
• Chapter IX
• Chapter X
• Chapter XI
• Chapter XII
New
• Chapter XIII
• Chapter XIV
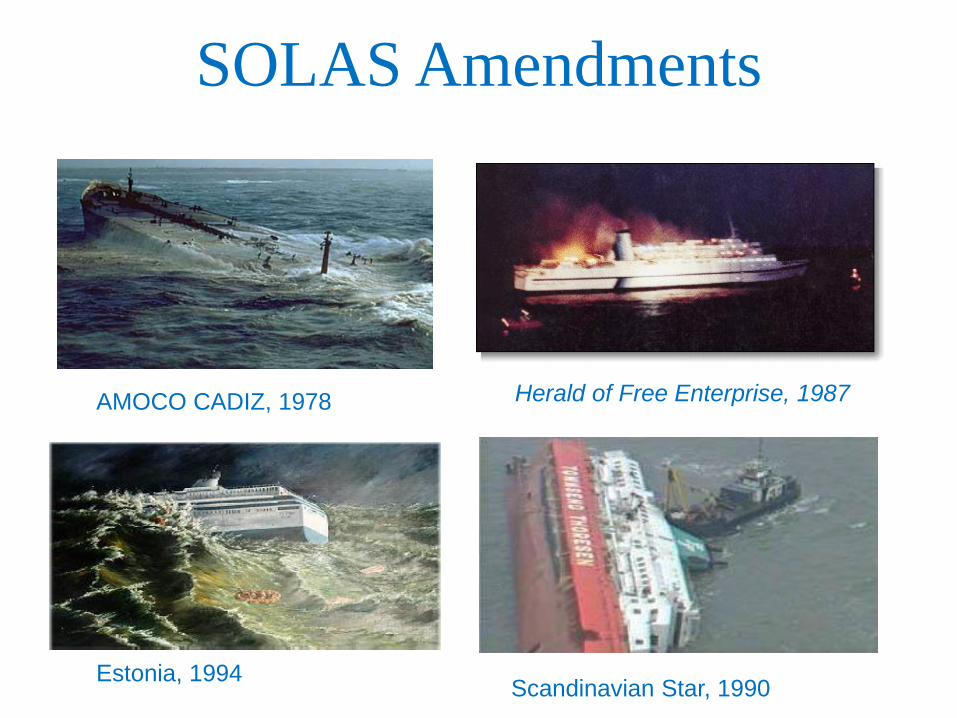
SOLAS Amendments
AMOCO CADIZ, 1978
Scandinavian Star, 1990 Estonia, 1994
Herald of Free Enterprise, 1987
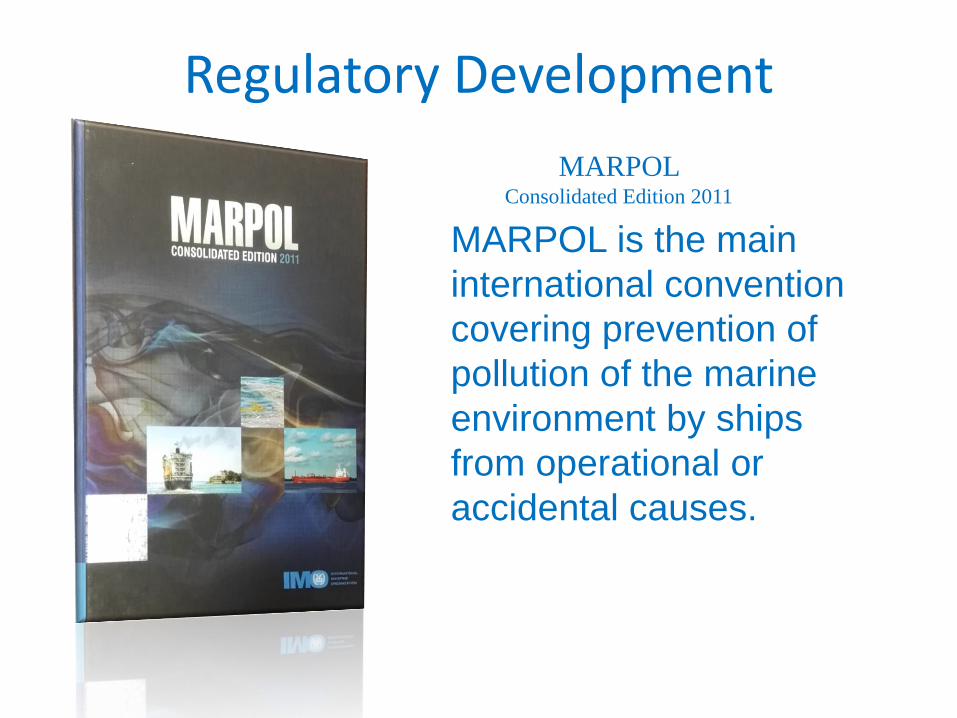
MARPOL is the main
international convention
covering prevention of
pollution of the marine
environment by ships
from operational or
accidental causes.
MARPOL Consolidated Edition 2011
Regulatory Development
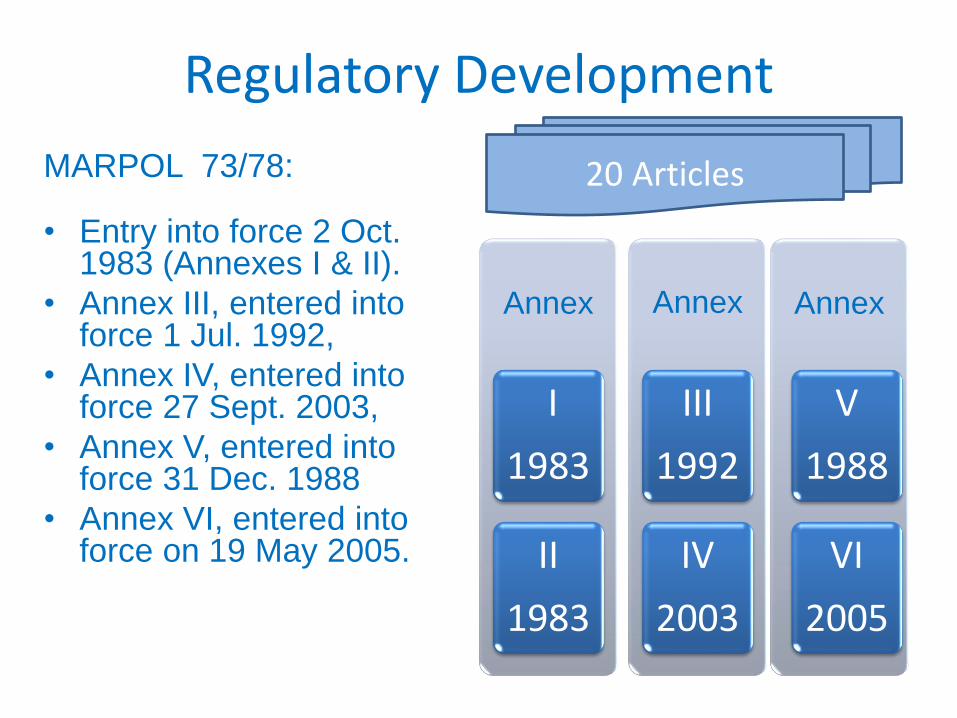
MARPOL 73/78:
• Entry into force 2 Oct. 1983 (Annexes I & II).
• Annex III, entered into force 1 Jul. 1992,
• Annex IV, entered into force 27 Sept. 2003,
• Annex V, entered into force 31 Dec. 1988
• Annex VI, entered into force on 19 May 2005.
Annex
I
1983
II
1983
Annex
III
1992
IV
2003
Annex
V
1988
VI
2005
20 Articles
Regulatory Development
Regulatory Development
• 2006 MLC
International Maritime Labour Convention
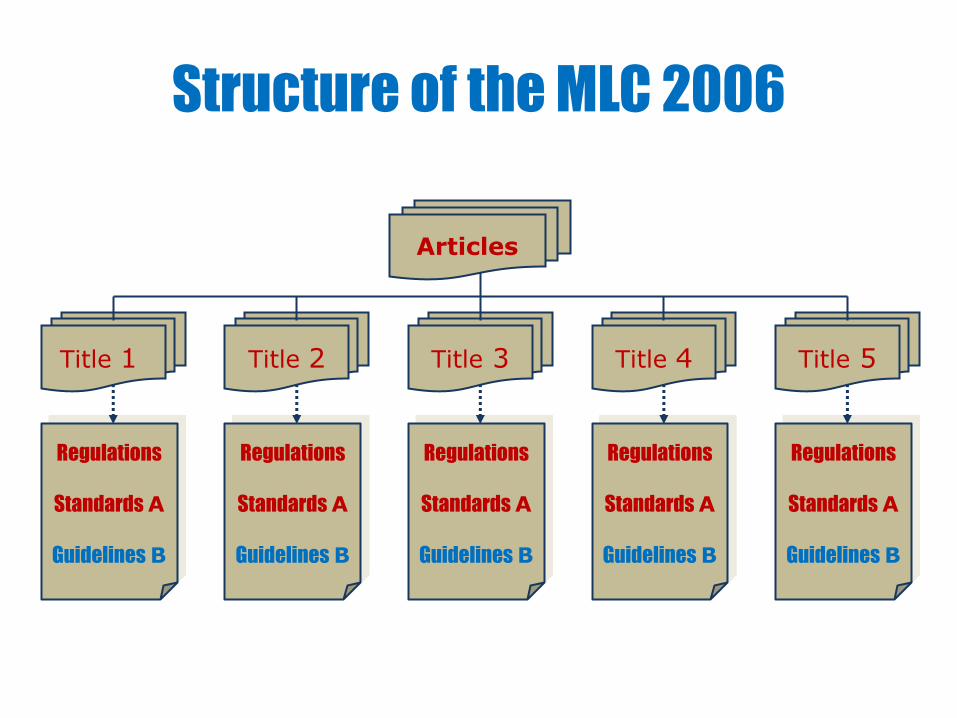
Structure of the MLC 2006
Articles
Title 1 Title 2 Title 3 Title 4 Title 5
Regulations
Standards A
Guidelines B
Regulations
Standards A
Guidelines B
Regulations
Standards A
Guidelines B
Regulations
Standards A
Guidelines B
Regulations
Standards A
Guidelines B
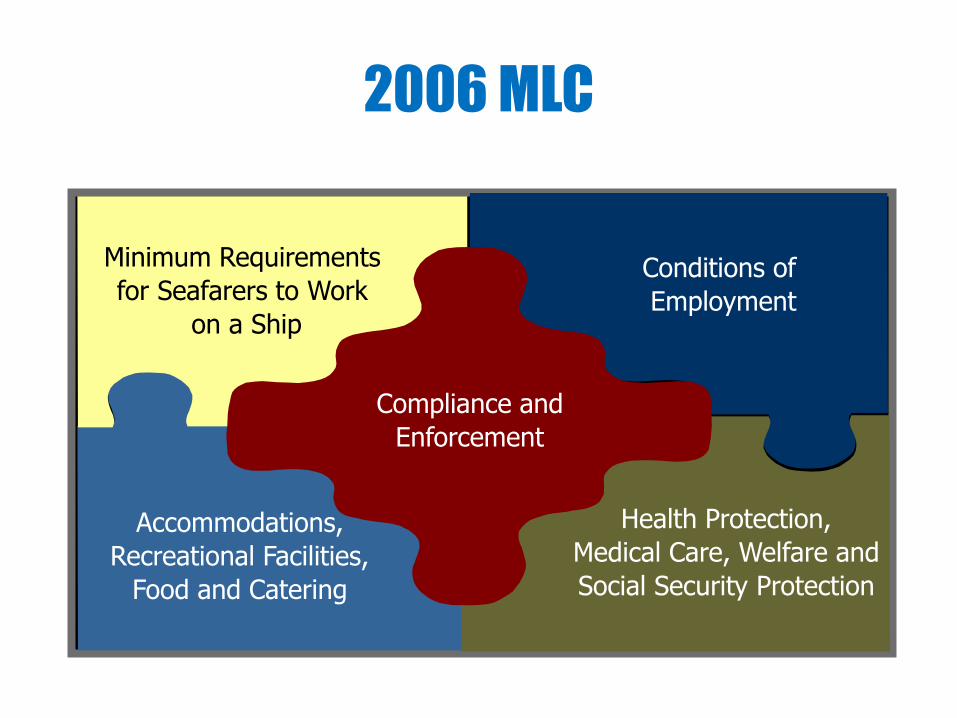
2006 MLC
Minimum Requirements
for Seafarers to Work
on a Ship
Accommodations,
Recreational Facilities,
Food and Catering
Conditions of
Employment
Health Protection,
Medical Care, Welfare and
Social Security Protection
Compliance and
Enforcement
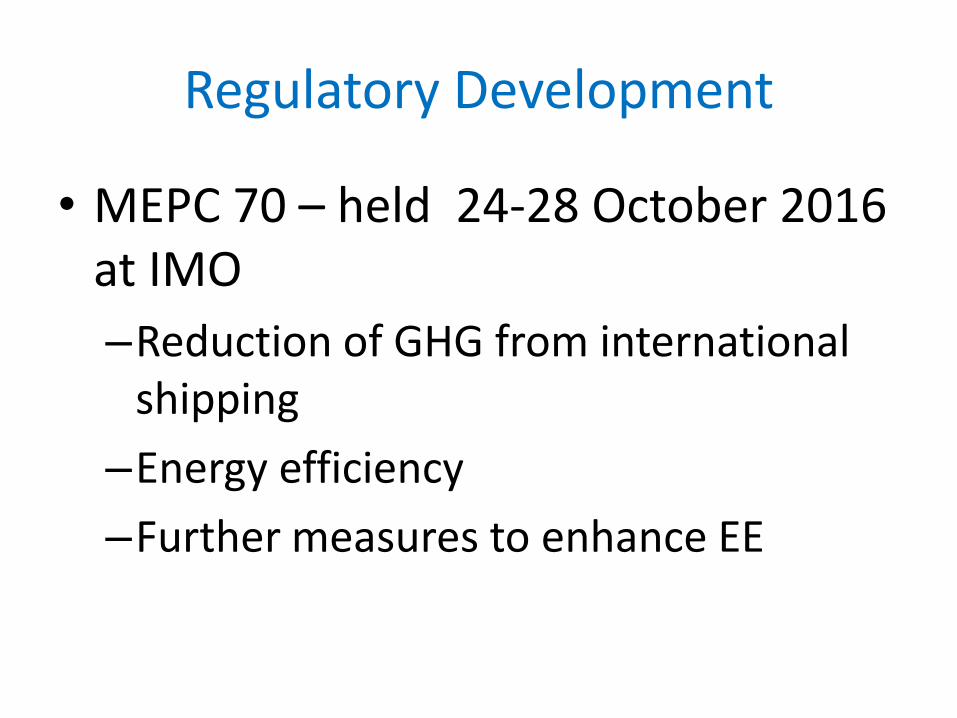
Regulatory Development
• MEPC 70 – held 24-28 October 2016 at IMO
–Reduction of GHG from international shipping
–Energy efficiency
–Further measures to enhance EE
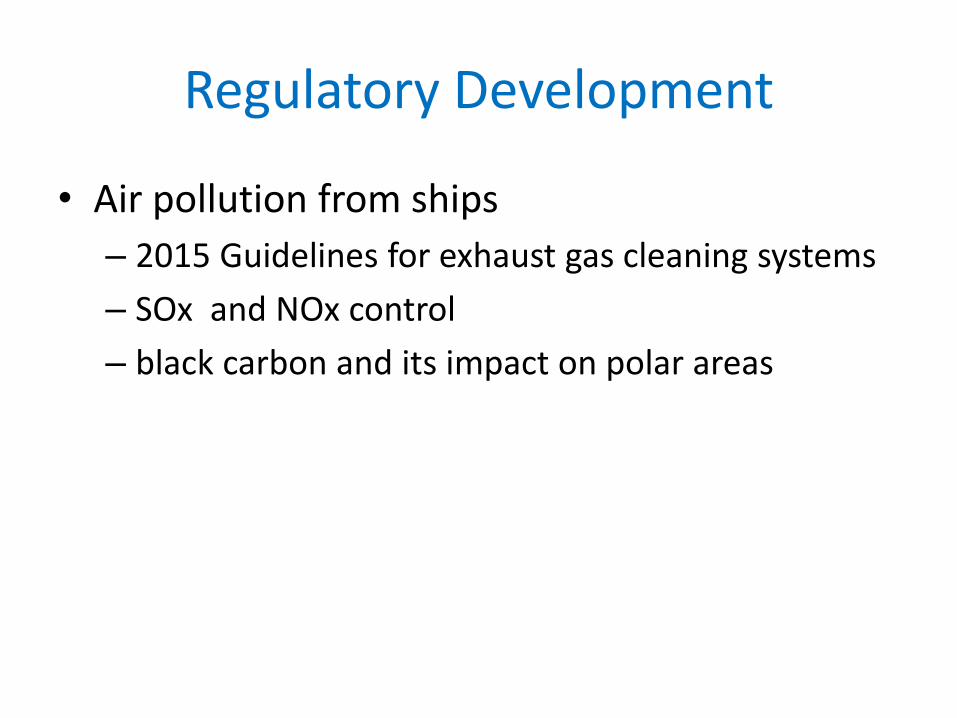
Regulatory Development
• Air pollution from ships
– 2015 Guidelines for exhaust gas cleaning systems
– SOx and NOx control
– black carbon and its impact on polar areas
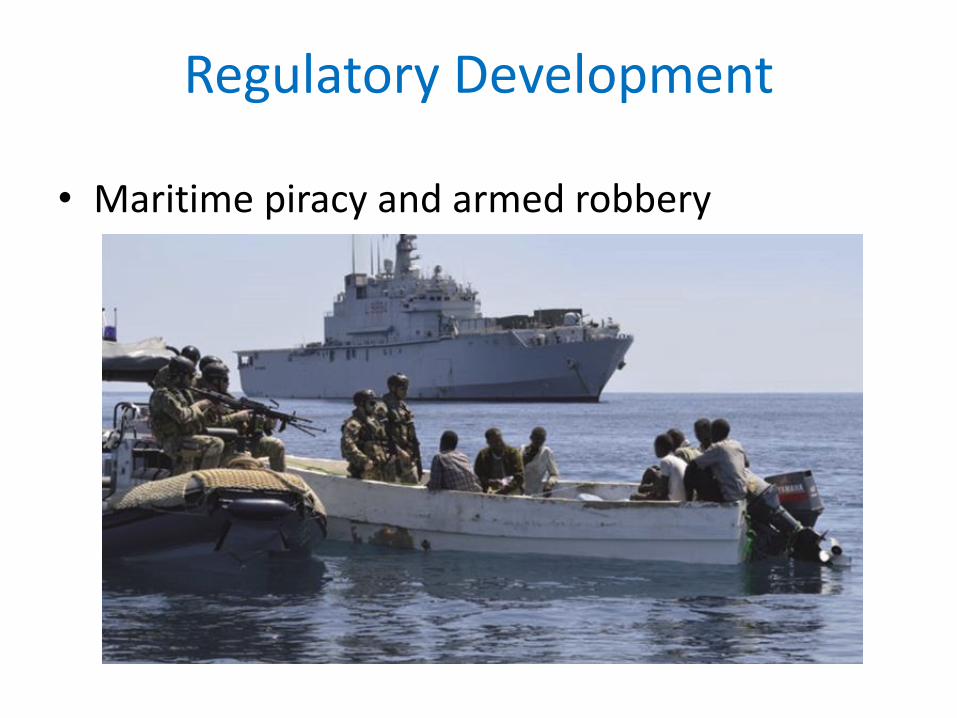
Regulatory Development
• Maritime piracy and armed robbery
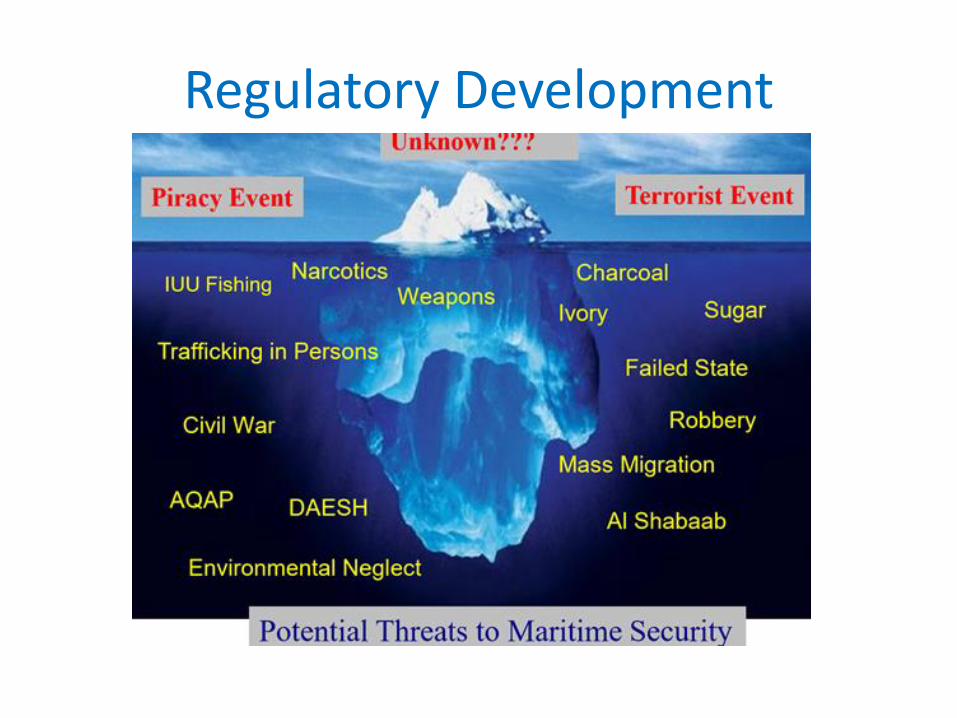
Regulatory Development
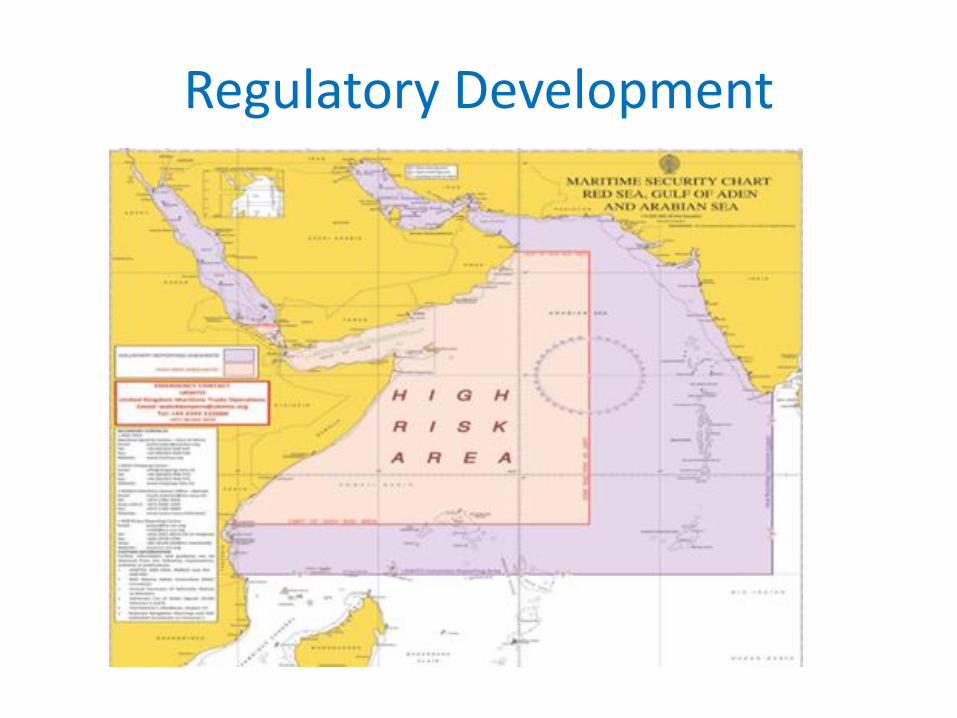
Regulatory Development
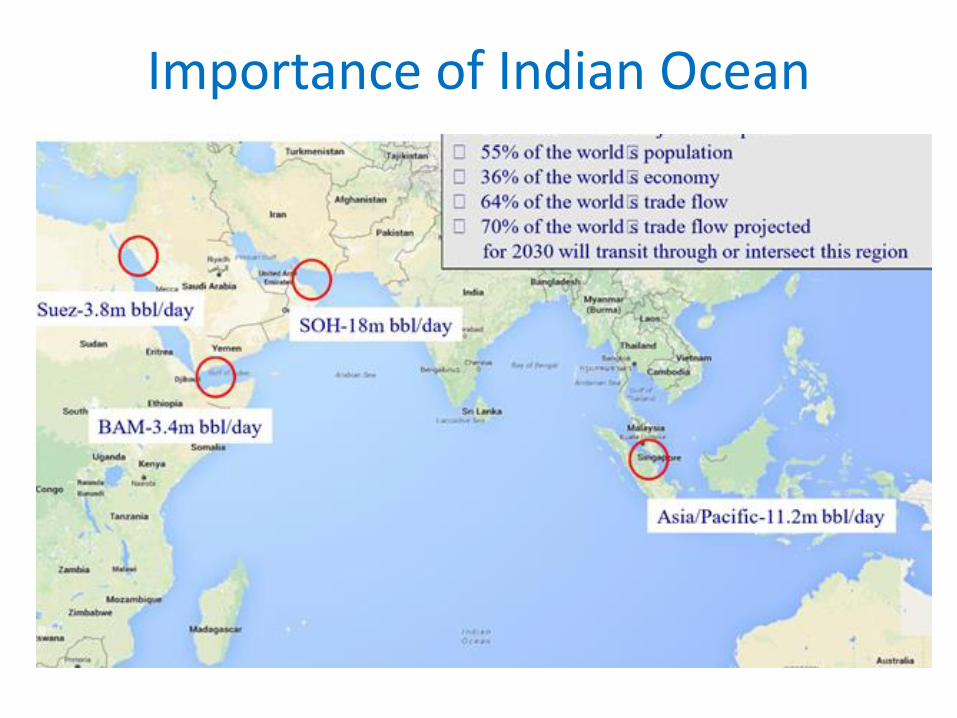
Importance of Indian Ocean
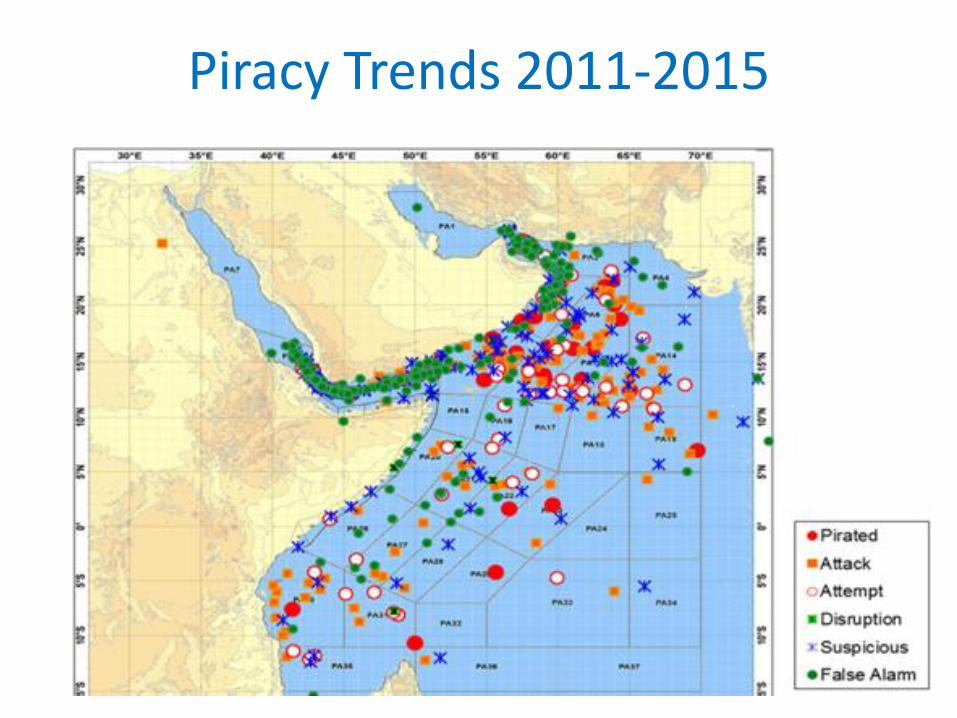
Piracy Trends 2011-2015
Regulatory Development
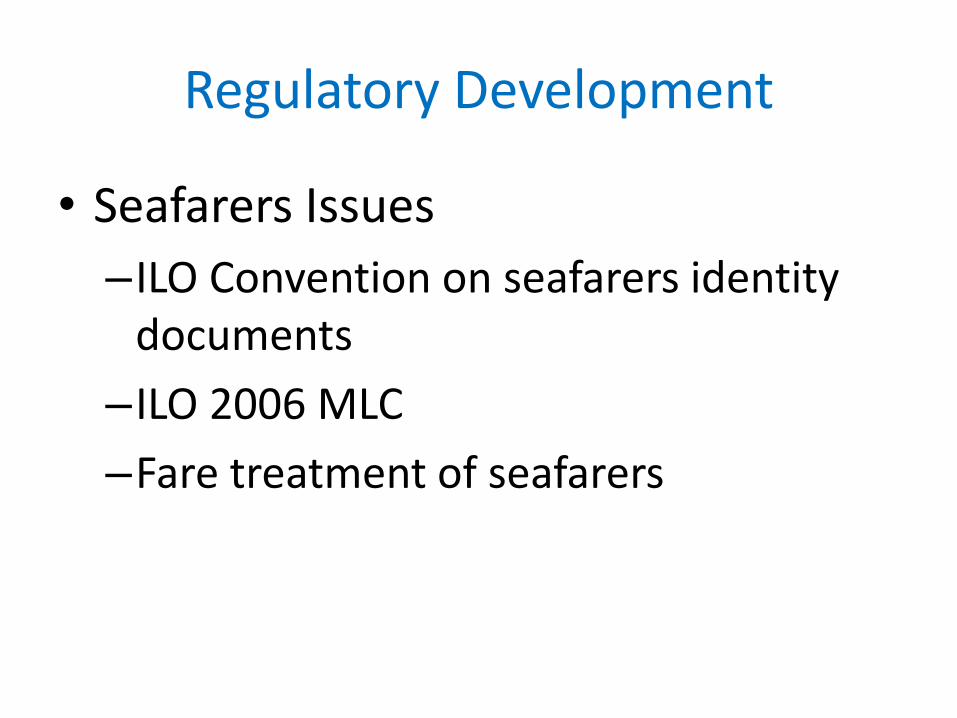
• Seafarers Issues
–ILO Convention on seafarers identity documents
–ILO 2006 MLC
–Fare treatment of seafarers
Regulatory Development
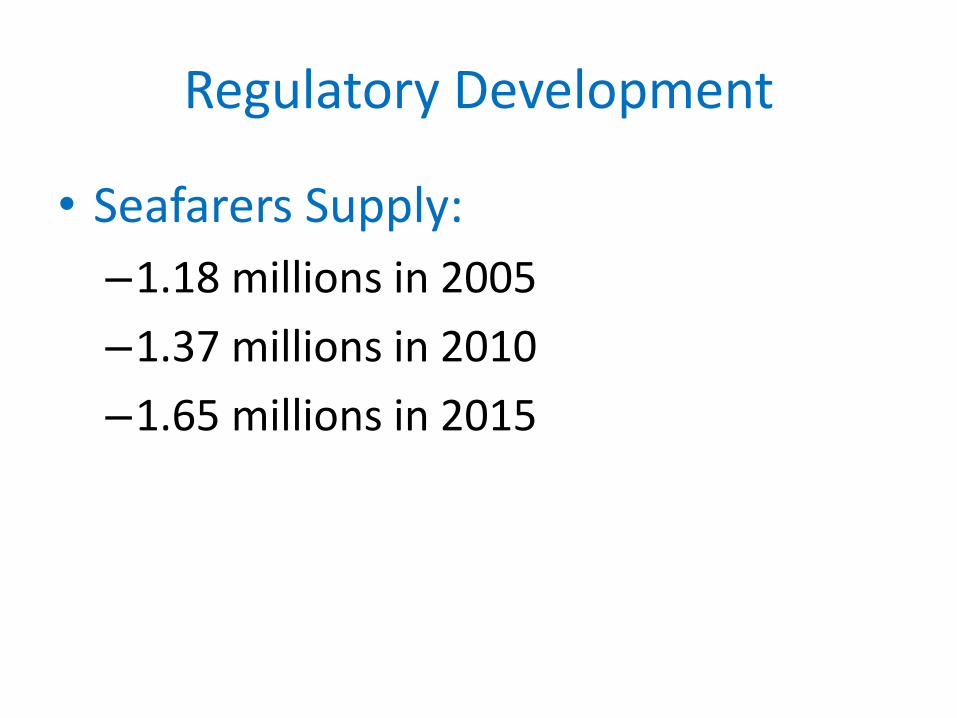
• Seafarers Supply:
–1.18 millions in 2005
–1.37 millions in 2010
–1.65 millions in 2015
Regulatory Development
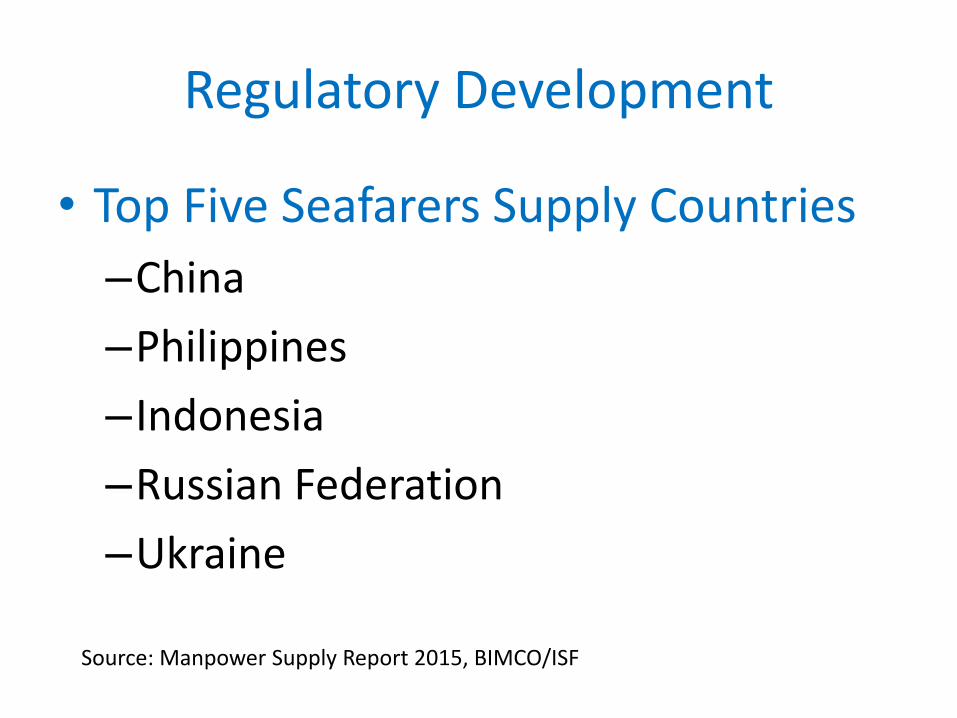
• Top Five Seafarers Supply Countries
–China
–Philippines
–Indonesia
–Russian Federation
–Ukraine
Source: Manpower Supply Report 2015, BIMCO/ISF
Issues
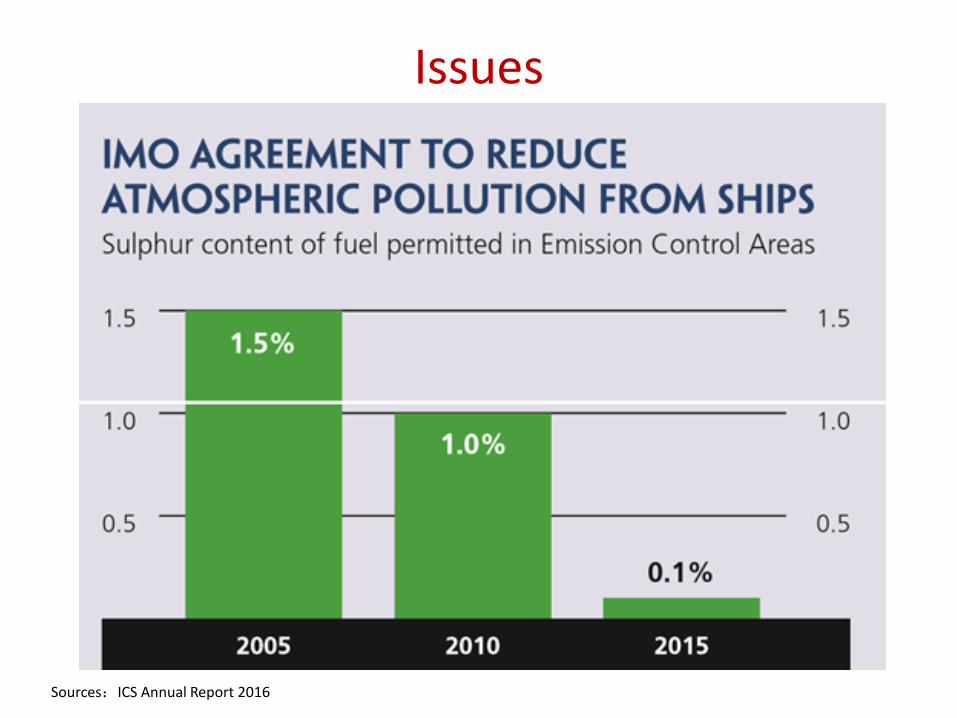
Issues
Sources:ICS Annual Report 2016
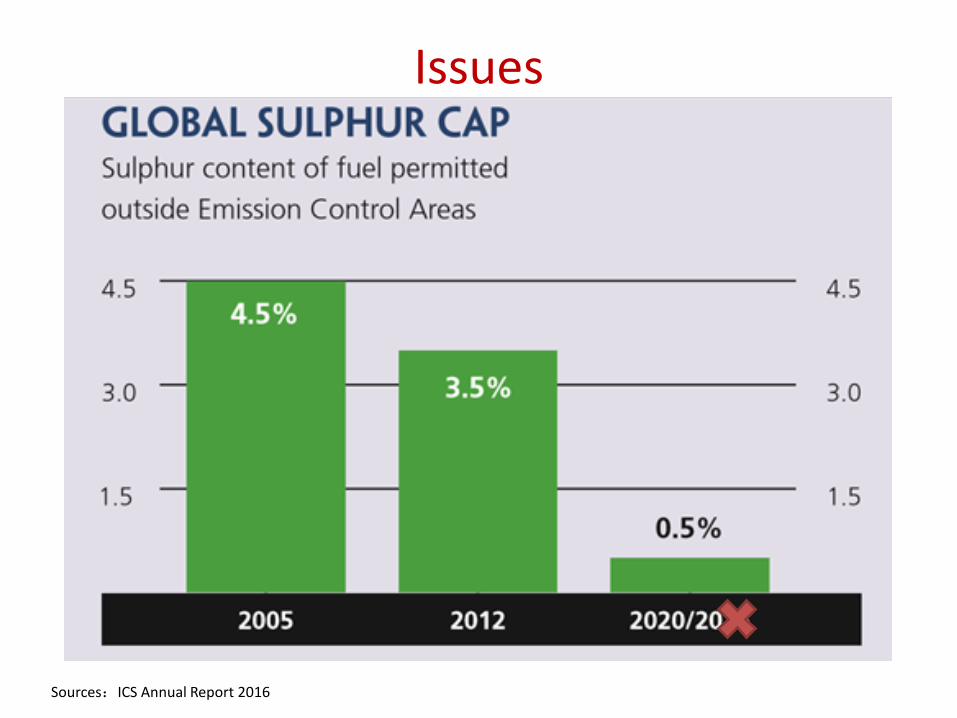
Issues
Sources:ICS Annual Report 2016
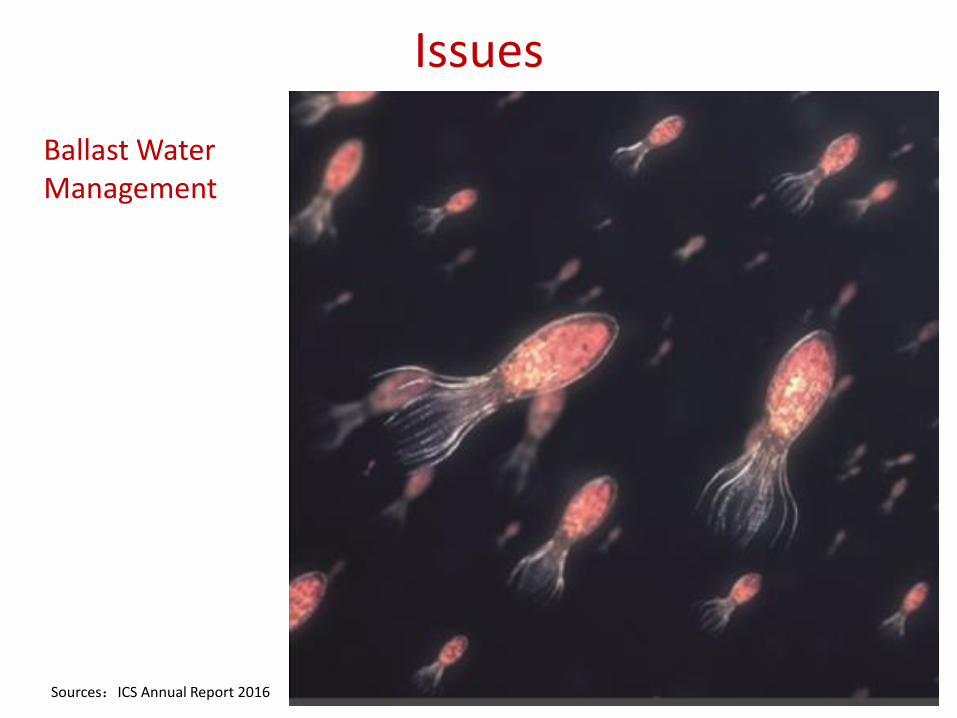
Issues
Sources:ICS Annual Report 2016
Ballast Water Management
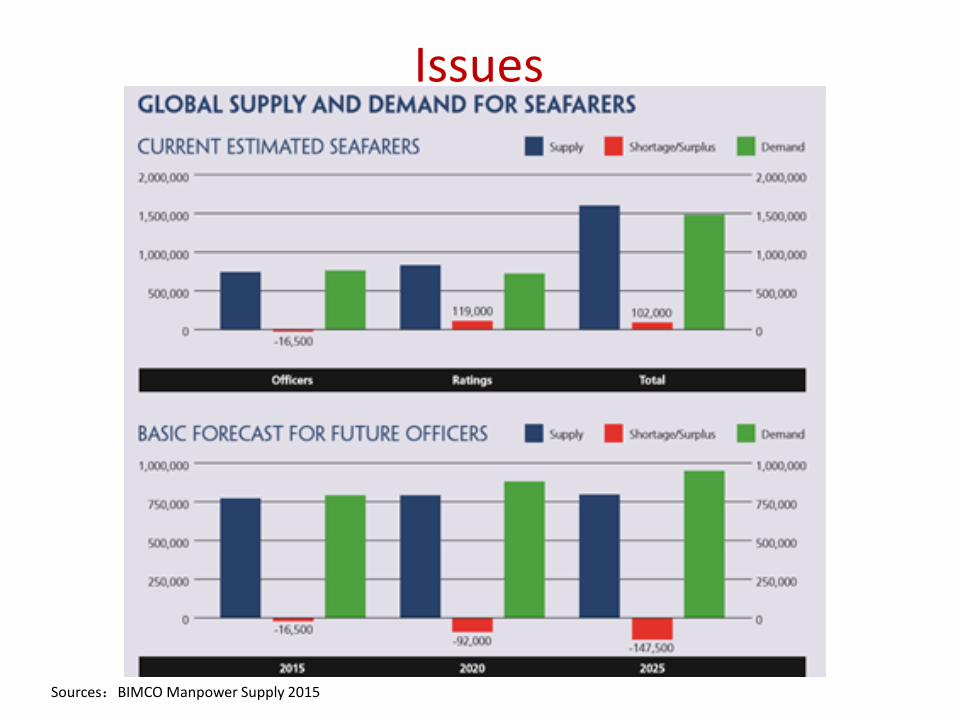
Issues
Sources:BIMCO Manpower Supply 2015
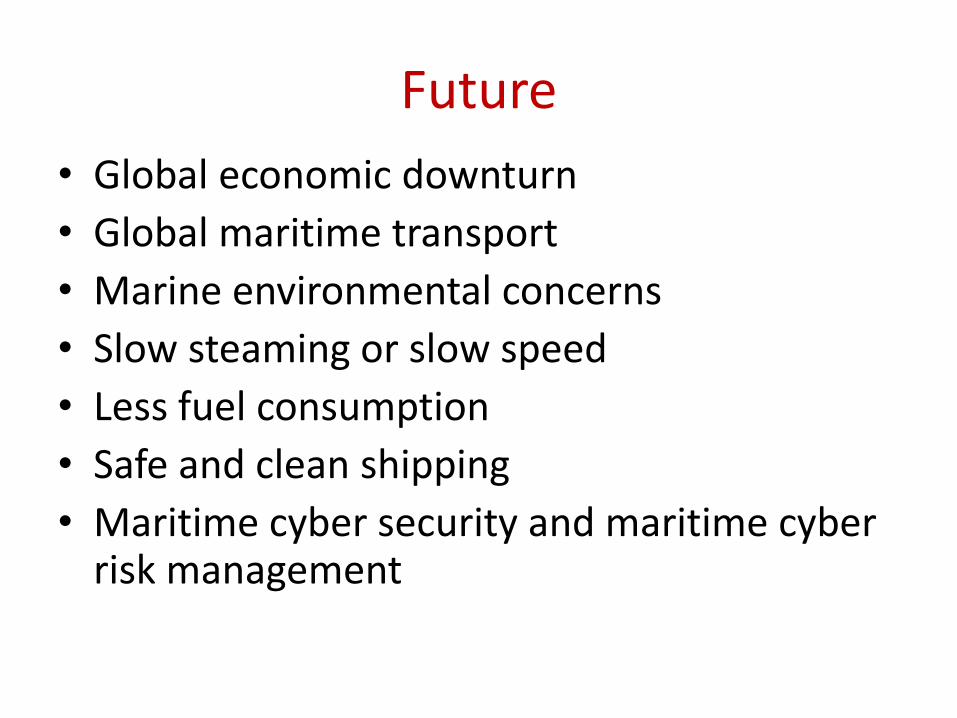
Future
• Global economic downturn
• Global maritime transport
• Marine environmental concerns
• Slow steaming or slow speed
• Less fuel consumption
• Safe and clean shipping
• Maritime cyber security and maritime cyber risk management
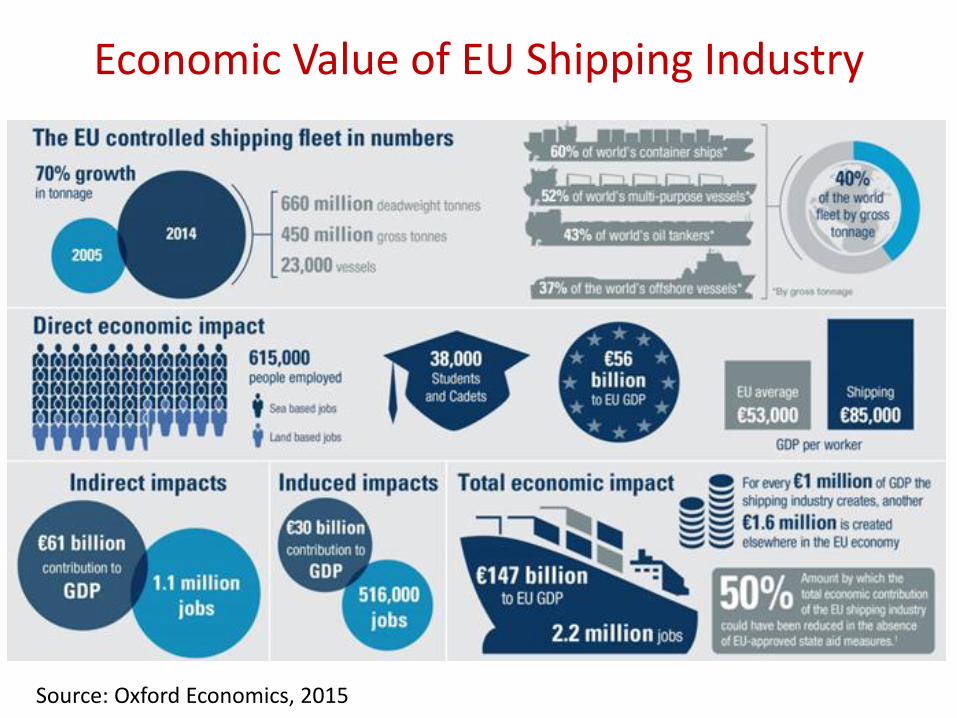
Economic Value of EU Shipping Industry
Source: Oxford Economics, 2015
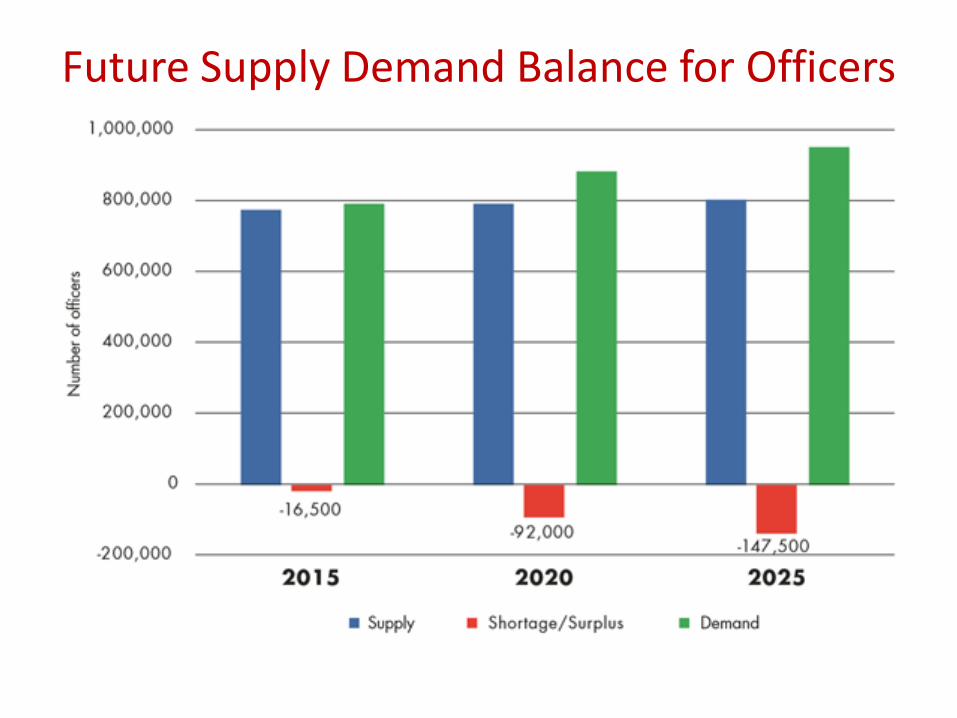
Future Supply Demand Balance for Officers
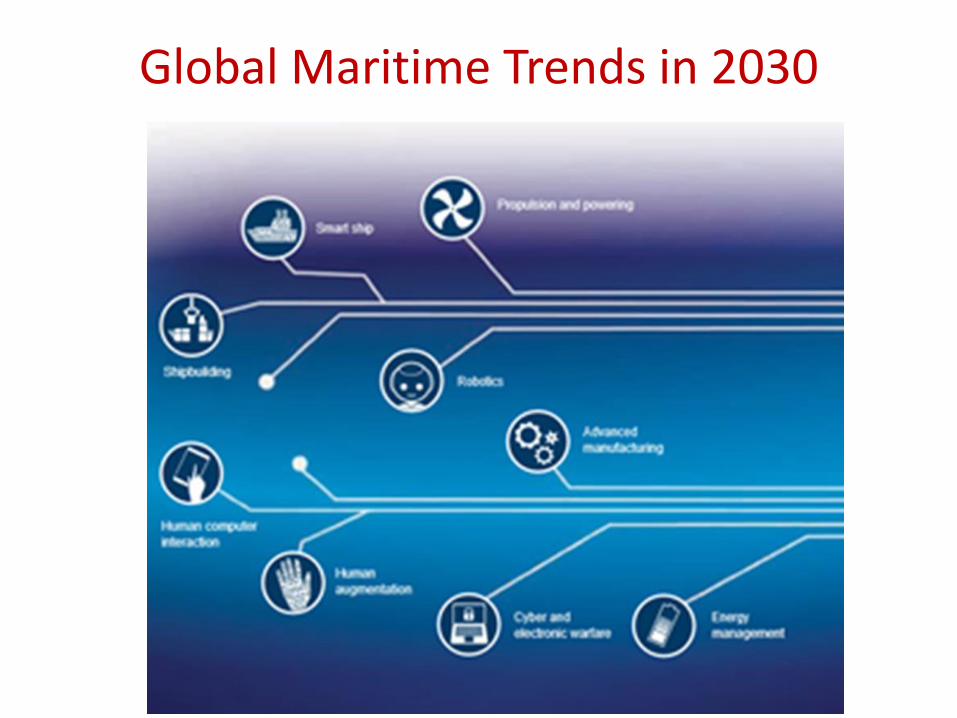
Global Maritime Trends in 2030