Embed Size (px)
Citation preview
Naval Submarine Medical Research Laboratory
NSMRL/50816/TR--2010-1282 May 28, 2010
Maritime Mobile Force Protection (MMFP) Program
by
Richard Severinghaus, M.S.
Kastley Marvin Jerry Lamb, Ph.D.
Richard Moore
Approved and Released by: P.C. KELLEHER, CAPT, MC, USN Commanding Officer NAVSUBMEDRSCHLAB
Approved for public release: distribution unlimited.

Standard Form 298 (Rev. 8/98)
REPORT DOCUMENTATION PAGE
Prescribed by ANSI Std. Z39.18
Form Approved OMB No. 0704-0188
The public reporting burden for this collection of information is estimated to average 1 hour per response, including the time for reviewing instructions, searching existing data sources, gathering and maintaining the data needed, and completing and reviewing the collection of information. Send comments regarding this burden estimate or any other aspect of this collection of information, including suggestions for reducing the burden, to the Department of Defense, Executive Services and Communications Directorate (0704-0188). Respondents should be aware that notwithstanding any other provision of law, no person shall be subject to any penalty for failing to comply with a collection of information if it does not display a currently valid OMB control number. PLEASE DO NOT RETURN YOUR FORM TO THE ABOVE ORGANIZATION. 1. REPORT DATE (DD-MM-YYYY) 2. REPORT TYPE 3. DATES COVERED (From - To)
4. TITLE AND SUBTITLE 5a. CONTRACT NUMBER
5b. GRANT NUMBER
5c. PROGRAM ELEMENT NUMBER
5d. PROJECT NUMBER
5e. TASK NUMBER
5f. WORK UNIT NUMBER
6. AUTHOR(S)
7. PERFORMING ORGANIZATION NAME(S) AND ADDRESS(ES) 8. PERFORMING ORGANIZATION REPORT NUMBER
9. SPONSORING/MONITORING AGENCY NAME(S) AND ADDRESS(ES) 10. SPONSOR/MONITOR'S ACRONYM(S)
11. SPONSOR/MONITOR'S REPORT NUMBER(S)
12. DISTRIBUTION/AVAILABILITY STATEMENT
13. SUPPLEMENTARY NOTES
14. ABSTRACT
15. SUBJECT TERMS
16. SECURITY CLASSIFICATION OF: a. REPORT b. ABSTRACT c. THIS PAGE
17. LIMITATION OF ABSTRACT
18. NUMBER OF PAGES
19a. NAME OF RESPONSIBLE PERSON
19b. TELEPHONE NUMBER (Include area code)
28-05-2010 Technical Report October 2007 - September 2009
Maritime Mobile Force Protection (MMFP) Program
50816
Richard Severinghaus, M.S. Kastley Marvin Jerry Lamb, Ph.D. Richard Moore
Naval Submarine Medical Research Laboratory Box 900 Groton, CT 06349-5900
NSMRL/50816/TR--2010-1282
Approved for public release: distribution unlimited.
The Maritime Mobile Force Protection (MMFP) project provided an on-water demonstration of the feasibility of providing US Coast Guard (USCG) escort vessels a real-time, user directed tactical command and control (C2) capability for the execution of mission escort duties and coordination with escorted units. The project focused on developing a mobile (on-the-water) C2 capability for USCG escort vessel Patrol Commanders during the conduct of escort missions of high value unit (HVU) vessels between port/harbor and open waters. The scope of the project consisted of integrating new off board (shore mounted) above water sensors with current on board sensors, adding organic underwater sensors, and integrating sensor collection and distribution networks with a vessel mounted Console Display. System design provided control of radars and cameras for detection of surface contacts, and acoustic sensors for detection of underwater objects. System software allowed ingestion of AIS (Automatic Identification System) and GPS data, and provided a contact correlation capability for discrimination among detected objects/contacts.
Maritime Mobile Force Protection, US Coast Guard escort vessels
U U U SAR 95
NAVSUBMEDRSCHLAB Commanding Officer
860-694-3263
Reset

[THIS PAGE INTENTIONALLY LEFT BLANK]
Maritime Mobile Force Protection (MMFP) Program
Richard Severinghaus, M.S.Kastley Marvin
Jerry Lamb, Ph.D.Richard Moore
Naval Submarine Medical Research Laboratory
Approved and Released by:
CAPT P.C. Kelleher, MC, USNCommanding Officer
Naval Submarine Medical Research LaboratorySubmarine Base New London Box 900
Groton, CT 06349-5900
Administrative Information:The views expressed in this report are those of the author and do not necessarily reflect the official policy orposition of the Department of the Navy, Department of Defense, nor the US. Government. I am a military servicemember (or employee of the us. Government). This work was prepared as part of my official duties. Title 17 Us. C.§105 provides that 'Copyright protection under this title is not available for any work of the United StatesGovernment.' This work was supported by andlorfunded by work unit number 50816.
Approved for public release: distribution unlimited.

ii
[THIS PAGE INTENTIONALLY LEFT BLANK]
iii
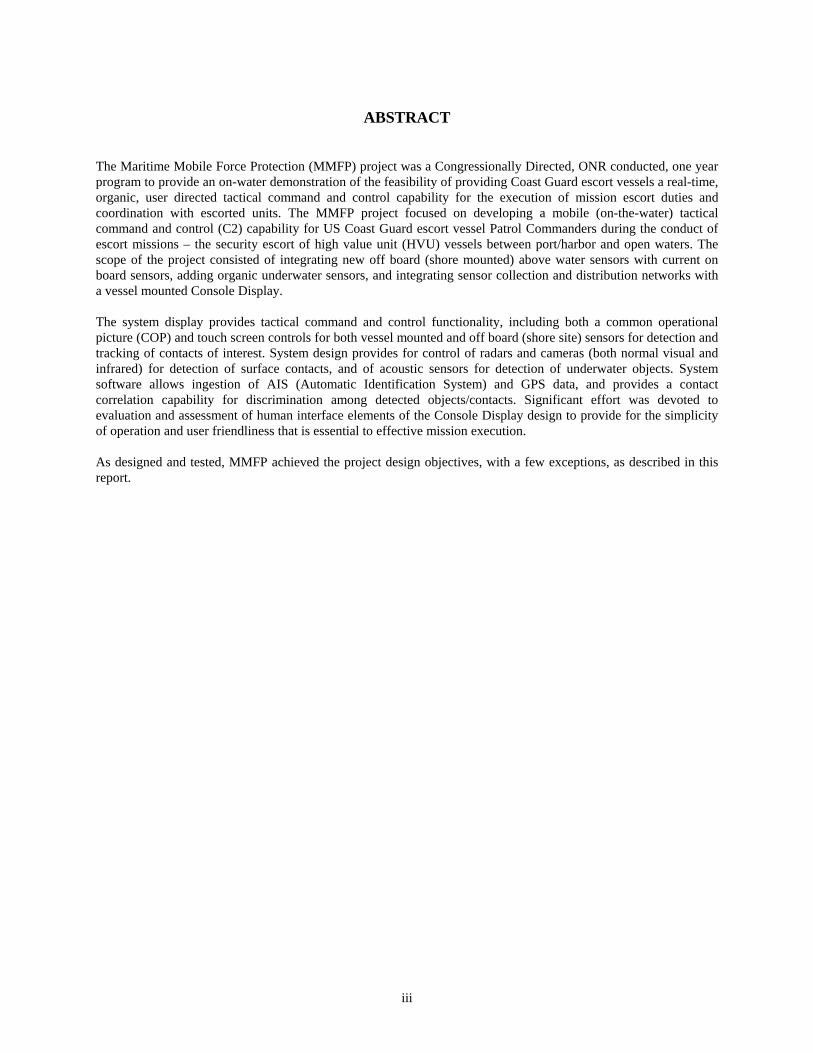
ABSTRACT
The Maritime Mobile Force Protection (MMFP) project was a Congressionally Directed, ONR conducted, one year program to provide an on-water demonstration of the feasibility of providing Coast Guard escort vessels a real-time, organic, user directed tactical command and control capability for the execution of mission escort duties and coordination with escorted units. The MMFP project focused on developing a mobile (on-the-water) tactical command and control (C2) capability for US Coast Guard escort vessel Patrol Commanders during the conduct of escort missions – the security escort of high value unit (HVU) vessels between port/harbor and open waters. The scope of the project consisted of integrating new off board (shore mounted) above water sensors with current on board sensors, adding organic underwater sensors, and integrating sensor collection and distribution networks with a vessel mounted Console Display. The system display provides tactical command and control functionality, including both a common operational picture (COP) and touch screen controls for both vessel mounted and off board (shore site) sensors for detection and tracking of contacts of interest. System design provides for control of radars and cameras (both normal visual and infrared) for detection of surface contacts, and of acoustic sensors for detection of underwater objects. System software allows ingestion of AIS (Automatic Identification System) and GPS data, and provides a contact correlation capability for discrimination among detected objects/contacts. Significant effort was devoted to evaluation and assessment of human interface elements of the Console Display design to provide for the simplicity of operation and user friendliness that is essential to effective mission execution. As designed and tested, MMFP achieved the project design objectives, with a few exceptions, as described in this report.

iv
ACKNOWLEDGMENTS
The project benefited greatly from the contributions and support of the organizations and individuals listed here.
US Coast Guard Station, New London CT. LCDR Andrew Ely, Commanding Officer
US Coast Guard Academy, New London, CT.
CAPT William R. Meese, Department Head, Maritime Studies Mr. Allen L. Kruger II, Chief, Sailing & Seamanship Branch LT John McTamney, Coordinator, Maritime Studies IV Mr. John Teeson, Waterfront Operations
US Coast Guard Research and Development Center, New London, CT Mr. Richard Hansen, Branch Head, Research & Development LT Joseph W. Kusek Mr. Mike Coleman
Naval Undersea Warfare Center, Newport, RI Mr. John Cooke
v
CONTENTS
ABSTRACT................................................................................................................................... iii ACKNOWLEDGMENTS ............................................................................................................. iv CONTENTS.................................................................................................................................... v FIGURES & TABLES.................................................................................................................... v INTRODUCTION .......................................................................................................................... 1 Objectives ....................................................................................................................................... 1 Hypothesis ...................................................................................................................................... 1 RESEARCH APPROACH ............................................................................................................. 1 TECHNICAL APPROACH............................................................................................................ 3 Display Technologies ..................................................................................................................... 4 Sensor and System Architecture ..................................................................................................... 4 Software Architecture ..................................................................................................................... 6 Contact Correlation (CC) Sub-System ........................................................................................... 8 EQUIPMENT OPERATION.......................................................................................................... 9 Camera (FLIR Voyager) ................................................................................................................. 9 Automatic Identification System (AIS) .......................................................................................... 9 GPS ................................................................................................................................................. 9 Radar ............................................................................................................................................... 9 TESTING AND DEMONSTRATION......................................................................................... 10 Demonstration Scenario................................................................................................................ 11 Scenario Evaluation ...................................................................................................................... 12 RESULTS AND CONCLUSIONS............................................................................................... 13 Future Development Efforts ......................................................................................................... 14 REFERENCES ............................................................................................................................. 16 APPENDICES ........................................................................................................................... A-G
FIGURES & TABLES
Figure 1. MMFP Nominal System Design ..................................................................................... 3 Figure 2. Console Display Conceptual Design............................................................................... 4 Figure 3. MMFP Prototype Configuration ..................................................................................... 5 Figure 4. Escort Vessel Component Configuration ........................................................................ 5 Figure 5. Shore Mounted Fixed Site Component Configuration.................................................... 6 Figure 6. Sensor, Contact, and Chart Data and Control Signal Flow Paths ................................... 7 Figure 7. Interface Diagram- position and contact data reporting.................................................. 8 Figure 8. MMFP Console Display- live screen shot (September 2009)....................................... 11 Table 1 – Touch-based user controls for chart interface .............................................................. 10 Table 2 – Property specifications for chart ................................................................................... 19 Table 3 – Properties specifications for HVU................................................................................ 19 Table 4 – Properties specifications for Escort Command............................................................. 20 Table 5 – Properties specifications for Escort Group vessels....................................................... 21
vi
Table 6 – Properties specifications for standard contacts............................................................. 21 Table 7 – Properties specifications for Contact of Interest........................................................... 22 Table 8 – Properties for general elements .................................................................................... 22 Table 9 – Data items and formats for tactical information ........................................................... 28 Table 10 – Data elements and formats for camera information.................................................... 28
INTRODUCTION
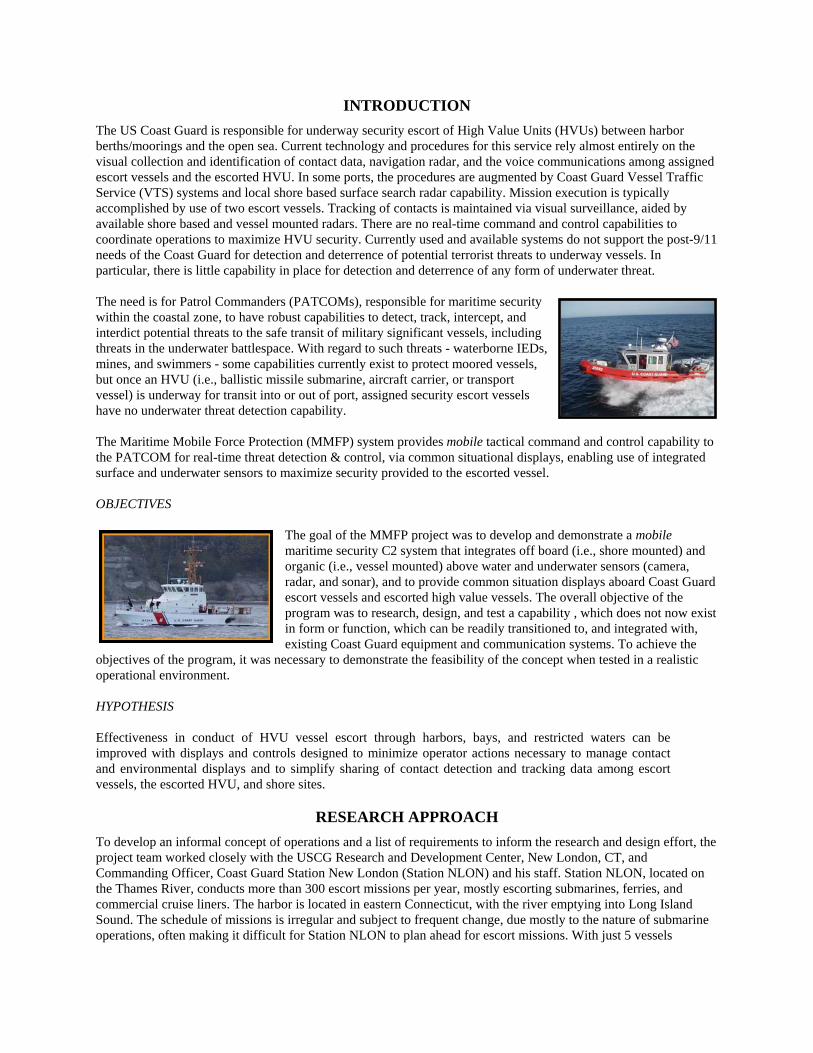
The US Coast Guard is responsible for underway security escort of High Value Units (HVUs) between harbor berths/moorings and the open sea. Current technology and procedures for this service rely almost entirely on the visual collection and identification of contact data, navigation radar, and the voice communications among assigned escort vessels and the escorted HVU. In some ports, the procedures are augmented by Coast Guard Vessel Traffic Service (VTS) systems and local shore based surface search radar capability. Mission execution is typically accomplished by use of two escort vessels. Tracking of contacts is maintained via visual surveillance, aided by available shore based and vessel mounted radars. There are no real-time command and control capabilities to coordinate operations to maximize HVU security. Currently used and available systems do not support the post-9/11 needs of the Coast Guard for detection and deterrence of potential terrorist threats to underway vessels. In particular, there is little capability in place for detection and deterrence of any form of underwater threat. The need is for Patrol Commanders (PATCOMs), responsible for maritime security within the coastal zone, to have robust capabilities to detect, track, intercept, and interdict potential threats to the safe transit of military significant vessels, including threats in the underwater battlespace. With regard to such threats - waterborne IEDs, mines, and swimmers - some capabilities currently exist to protect moored vessels, but once an HVU (i.e., ballistic missile submarine, aircraft carrier, or transport vessel) is underway for transit into or out of port, assigned security escort vessels have no underwater threat detection capability. The Maritime Mobile Force Protection (MMFP) system provides mobile tactical command and control capability to the PATCOM for real-time threat detection & control, via common situational displays, enabling use of integrated surface and underwater sensors to maximize security provided to the escorted vessel. OBJECTIVES
The goal of the MMFP project was to develop and demonstrate a mobile maritime security C2 system that integrates off board (i.e., shore mounted) and organic (i.e., vessel mounted) above water and underwater sensors (camera, radar, and sonar), and to provide common situation displays aboard Coast Guard escort vessels and escorted high value vessels. The overall objective of the program was to research, design, and test a capability , which does not now exist in form or function, which can be readily transitioned to, and integrated with, existing Coast Guard equipment and communication systems. To achieve the
objectives of the program, it was necessary to demonstrate the feasibility of the concept when tested in a realistic operational environment. HYPOTHESIS
Effectiveness in conduct of HVU vessel escort through harbors, bays, and restricted waters can be improved with displays and controls designed to minimize operator actions necessary to manage contact and environmental displays and to simplify sharing of contact detection and tracking data among escort vessels, the escorted HVU, and shore sites.
RESEARCH APPROACH
To develop an informal concept of operations and a list of requirements to inform the research and design effort, the project team worked closely with the USCG Research and Development Center, New London, CT, and Commanding Officer, Coast Guard Station New London (Station NLON) and his staff. Station NLON, located on the Thames River, conducts more than 300 escort missions per year, mostly escorting submarines, ferries, and commercial cruise liners. The harbor is located in eastern Connecticut, with the river emptying into Long Island Sound. The schedule of missions is irregular and subject to frequent change, due mostly to the nature of submarine operations, often making it difficult for Station NLON to plan ahead for escort missions. With just 5 vessels

2
available, Station NLON maintains a very high tempo operation in all weather conditions, including fog, ice, extremes of temperature, and hazardous storms, from both winter (blizzard conditions) and summer (tropical storms and severe maritime depressions) months. Station NLON staff provided extensive subject matter expertise and input to the research process. As part of data collection, project staff embarked on Coast Guard escort vessels to observe first hand how vessel crew and the PATCOM execute the escort mission. These “ride-a-long” data collection events during routine escort underways provided insight into how escort crews conduct search, tracking, surface vessel interdiction, and vessel coordination. Additionally, the project team was able to understand the PATCOM’s needs for gaining and maintaining situation awareness (SA), for generating and maintaining a shared (common) operational picture among escort vessel crew and escorted vessel crew and for communicating orders, reports, and vessel coordination information via UHF and VHF radio. The PATCOM is usually a Second Class Boatswain Mate and is responsible for commanding the underway escort mission, notifying the HVU of the current status of the mission, and keeping the local Coast Guard Station informed of their progress. In current practice, they have limited crew resources, and operate at and beyond sustainable workload limits. From the interaction with Coast Guard personnel, and from literature search and equipment investigation, a set of top level project goals were developed:
Identify a set of sensors, inputs to displays, and communication paths to provide the PATCOM integrated and enhanced mobile tactical SA.
Apply human performance principles in design of command and control displays for SA and management of the escort mission.
Incorporate escort vessel piloting station displays/controls for control of both organic and off-board cameras and radars for contact identification and tracking.
Integrate organic underwater sensors. Design and build a prototype MMFP system suitable for experimentation and operational testing.
The key performance parameter (KPP) identified was necessity for a system simple enough to operate with minimal need for interaction using keyboard, video, and mouse (KVM) hardware, yet containing sufficient functionality, utility, and capability to be useful to both the PATCOM and the escorted HVU Master or Commanding Officer. The performance needs identified resulted in breaking down overall project activity into a set of research efforts, each specific to the context of US Coast Guard security escort missions and crew performance demands. These efforts are listed in Table 1.
Mission requirements and operations research Display design research Research existing capability, both hardware and software Research and identify technology candidates suitable for both project objectives and eventual
integration with existing Coast Guard operational systems Research display and correlation software serving the PATCOM’s need for quick and accurate
sorting and classification of detected objects and contacts, with capability to integrate above and underwater sensor data
Experimentation to test utility/effectiveness and ability of candidate designs to address operational needs of USCG escort vessel PATCOM
Table 1 Project Research Effort

3
The research and analysis effort resulted in a prototype design based on the nominal system design illustrated in Figure 1.
Figure 1 MMFPP Nominal System Design
TECHNICAL APPROACH The KPP previously identified drove the design requirement to a work break down structure consisting of seven research, design, and development activities, listed in Table 2.
1. Identification of candidate systems – display, radar, camera, sonar, communications – for integration into a C2 package, meeting the performance objectives identified through research
2. Design and testing of an operator-machine interface for C2 display (“Console Display” or “Console”) aligned to the PATCOM’s operational needs
3. Design, development, and testing of software to support sensor interface to the Console Display, including contact correlation software, network interface design, and data storage and archiving
4. Design of software for controlling fixed site sensors in real time from a mobile platform, to enable real-time data acquisition and display on the Console Display1
5. Integration of sensor and contact data with navigation charts and maps of the types currently in use by US Coast Guard and Naval forces
6. Develop a systems engineering design capable of integrating underwater acoustic search and detection equipment available to the Coast Guard inventory of vessel mounted equipment*
7. Demonstrate a mobile tactical command & control system for use aboard Coast Guard escort vessels, with ability to display an operational picture on the escorted vessel
Table 2 Project Design and Development Work Breakdown Structure
[*NOTE: Of significance, the original plan to integrate underwater sensors into the project was not possible. Employment of active sonar for the project required government authorization based on an Environmental Assessment (EA) approved by the Federal government. As of project inception, the Coast Guard was led to believe that such authorization would be forthcoming in time to support project effort. However, as of the date of this project report, the needed EA had still not been approved.]
Development proceeded on four parallel tracks – Console Display and control design, sensor and system network architecture design and integration with escort vessel systems, software architecture design and integration with the results of the first two tracks, and design of contact correlation software for contact management.
1 Example: one functional requirement was to enable the Patrol Commander (PATCOM) to control a remote (shore mounted) camera with Pan, Tilt, Zoom (PTZ) capability to point to and track a selected contact on demand as selected by the PATCOM at the Console Display. Currently available commercial systems provide such capability, but only for fixed location Command and Control stations (e.g., Security Office for a guarded land site).
4
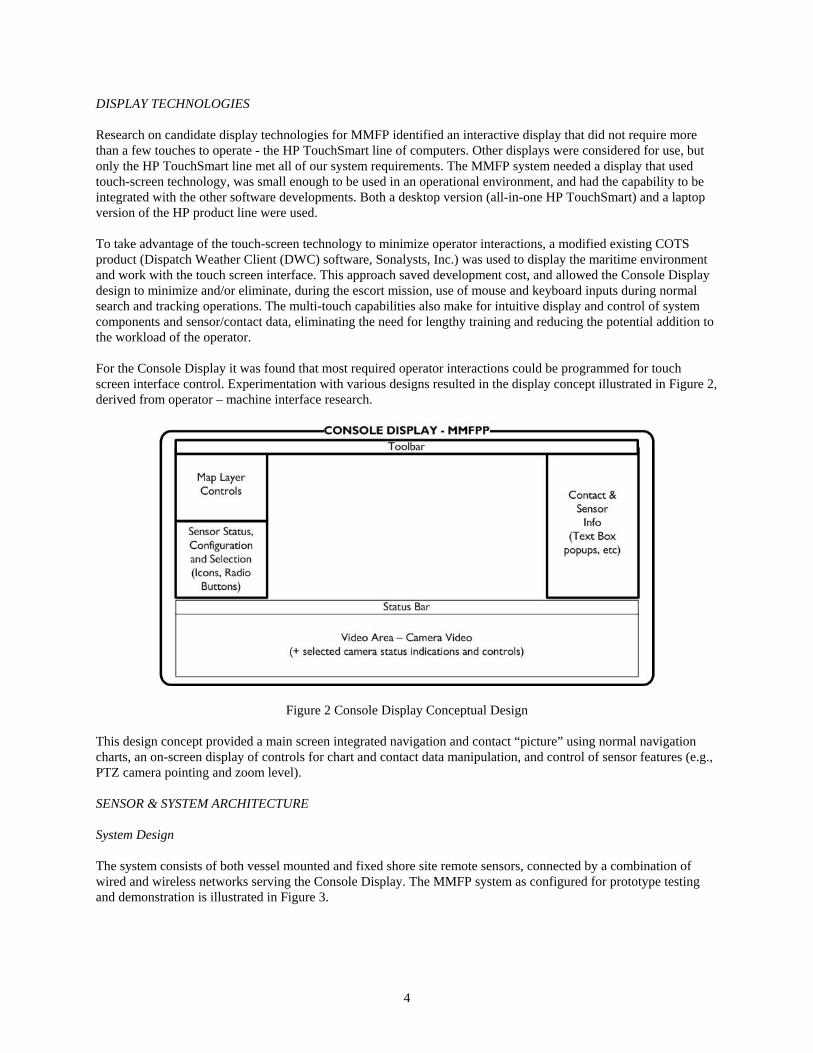
DISPLAY TECHNOLOGIES Research on candidate display technologies for MMFP identified an interactive display that did not require more than a few touches to operate - the HP TouchSmart line of computers. Other displays were considered for use, but only the HP TouchSmart line met all of our system requirements. The MMFP system needed a display that used touch-screen technology, was small enough to be used in an operational environment, and had the capability to be integrated with the other software developments. Both a desktop version (all-in-one HP TouchSmart) and a laptop version of the HP product line were used. To take advantage of the touch-screen technology to minimize operator interactions, a modified existing COTS product (Dispatch Weather Client (DWC) software, Sonalysts, Inc.) was used to display the maritime environment and work with the touch screen interface. This approach saved development cost, and allowed the Console Display design to minimize and/or eliminate, during the escort mission, use of mouse and keyboard inputs during normal search and tracking operations. The multi-touch capabilities also make for intuitive display and control of system components and sensor/contact data, eliminating the need for lengthy training and reducing the potential addition to the workload of the operator. For the Console Display it was found that most required operator interactions could be programmed for touch screen interface control. Experimentation with various designs resulted in the display concept illustrated in Figure 2, derived from operator – machine interface research.
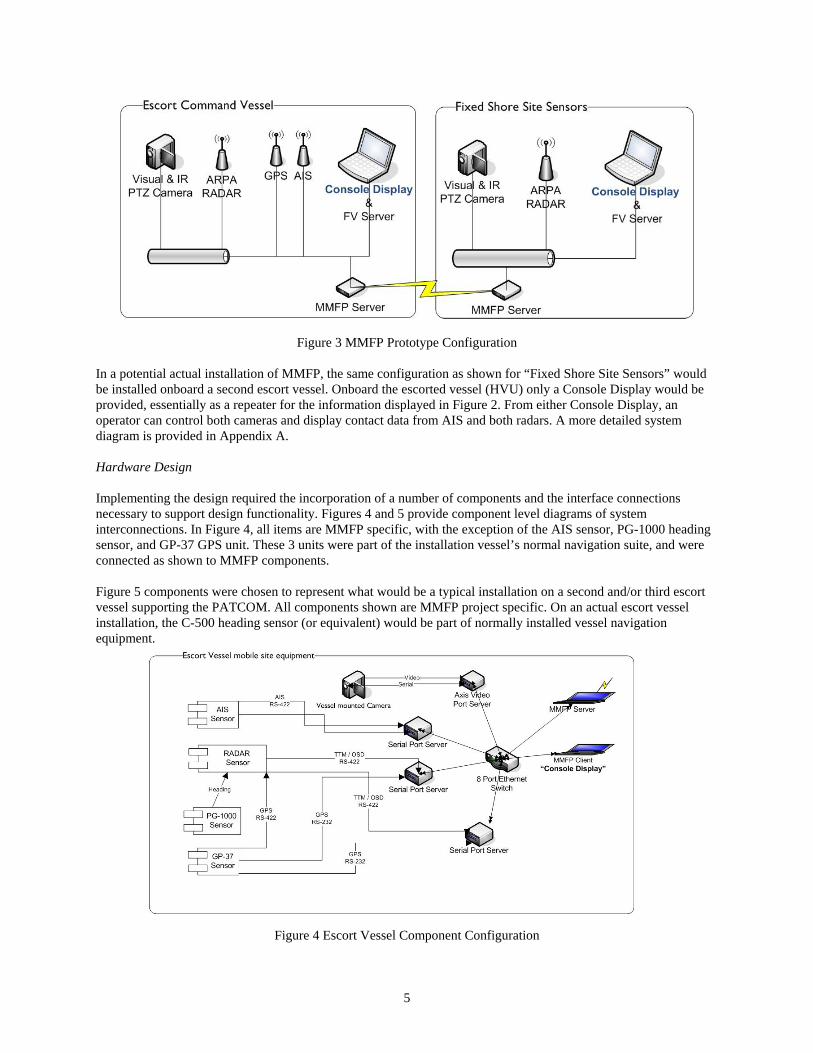
Figure 2 Console Display Conceptual Design This design concept provided a main screen integrated navigation and contact “picture” using normal navigation charts, an on-screen display of controls for chart and contact data manipulation, and control of sensor features (e.g., PTZ camera pointing and zoom level). SENSOR & SYSTEM ARCHITECTURE System Design The system consists of both vessel mounted and fixed shore site remote sensors, connected by a combination of wired and wireless networks serving the Console Display. The MMFP system as configured for prototype testing and demonstration is illustrated in Figure 3.
5
Figure 3 MMFP Prototype Configuration In a potential actual installation of MMFP, the same configuration as shown for “Fixed Shore Site Sensors” would be installed onboard a second escort vessel. Onboard the escorted vessel (HVU) only a Console Display would be provided, essentially as a repeater for the information displayed in Figure 2. From either Console Display, an operator can control both cameras and display contact data from AIS and both radars. A more detailed system diagram is provided in Appendix A. Hardware Design Implementing the design required the incorporation of a number of components and the interface connections necessary to support design functionality. Figures 4 and 5 provide component level diagrams of system interconnections. In Figure 4, all items are MMFP specific, with the exception of the AIS sensor, PG-1000 heading sensor, and GP-37 GPS unit. These 3 units were part of the installation vessel’s normal navigation suite, and were connected as shown to MMFP components. Figure 5 components were chosen to represent what would be a typical installation on a second and/or third escort vessel supporting the PATCOM. All components shown are MMFP project specific. On an actual escort vessel installation, the C-500 heading sensor (or equivalent) would be part of normally installed vessel navigation equipment.
Figure 4 Escort Vessel Component Configuration

6
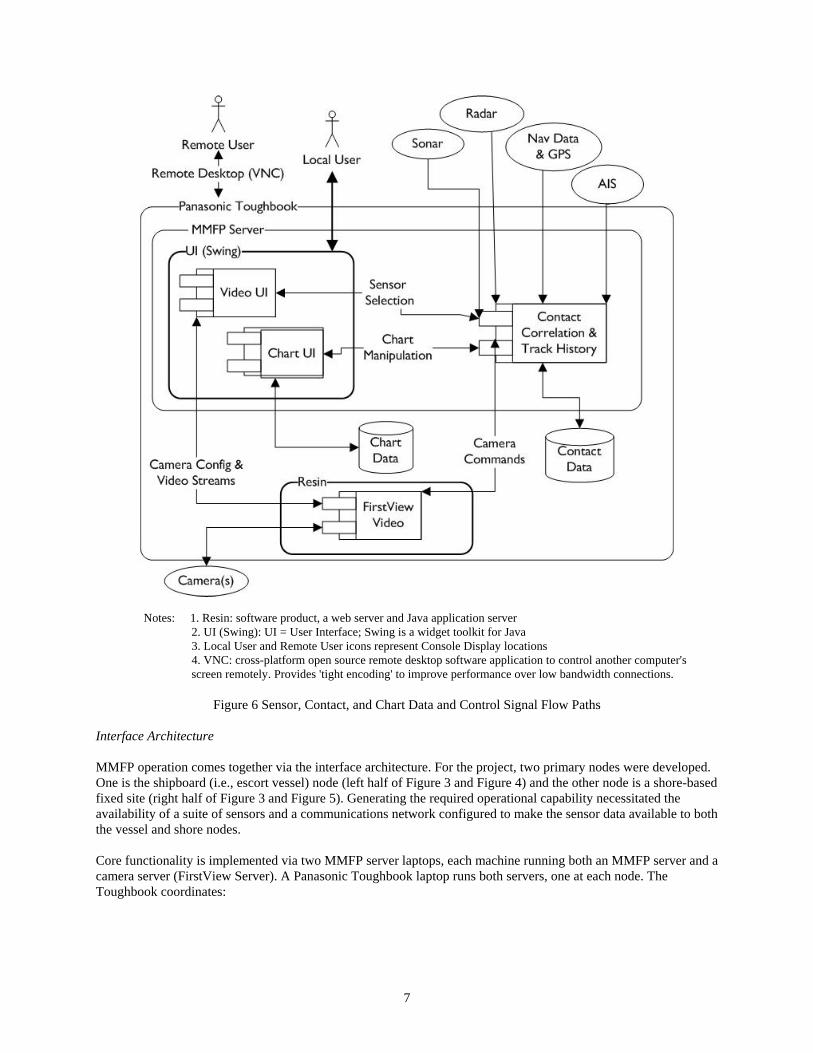
Figure 5 Shore Mounted Fixed Site Component Configuration Appendix B, MMFP Hardware List, provides a listing and description of major hardware components acquired for implementation of the prototype design. Appendix C, Bill of Materials, provides a detailed listing of material acquired for building the demonstration prototype system. A detailed description of MMFP components is provided in Appendix D, MMFP Hardware Description. Communications Network & Data Streams MMFP uses a standard COTS Verizon wireless (EV-DO) wireless network technology for data streams between the two major nodes and for routing of radar and camera data to the master server. For the project, the wireless network was leased access to Verizon’s mobile phone/cellular network. This approach was cost effective and provided sufficient bandwidth for component and network testing. Technical information for the network can be found on the Verizon public access website. SOFTWARE ARCHITECTURE The software architecture, illustrated in Figure 6, resulted from development of a detailed Software Design Document, Appendix E, implemented in accordance with a detailed Software Requirements Specification, Appendix F. The software integrates the vessel mounted and shore site sensors of the system, and provides for ingestion and display of radar, AIS, and GPS data streams. Modules automatically correlate contact data and allow the operator to control vessel mounted and shore site cameras via the Console Display. Cameras provide the ability to not only focus on and picture known targets, but also, for shore site cameras, the ability to “look around the corner”, beyond the PATCOM’s line of sight, for unknown targets that could pose a threat to vessels. All of this information is displayed on the Console Display. A key software design feature is the multi-touch functionality that eliminates need for a keyboard, mouse or input device other than an operator’s fingers. Appendices E and F describe the design features imposed to provide ease of use of the Console Display for the operator. Within Figure 6 a high level illustration of the software architecture implementation is provided, including flow paths of chart data, contact data, sensor data, and software instantiation of control signals for network-connected equipment. In Figure 6, the “Panasonic Toughbook” is the same component as the ‘MMFP Server’ shown in Figures 3, 4, and 5. (Note: in Figure 6, the First View Video, a COTS product, is a separate server within the Toughbook, which runs the MMFP Server software as shown. In Figure 3, for illustration purposes, the “FV Server” is shown running in the Console Display laptop, as the camera video is streamed ‘live’ to a window on the Console Display). The design makes use of Resin, a relatively new COTS product web and Java application server, to enable data streaming (camera video) across the low bandwidth wireless network used in the project.
7
Notes: 1. Resin: software product, a web server and Java application server
2. UI (Swing): UI = User Interface; Swing is a widget toolkit for Java 3. Local User and Remote User icons represent Console Display locations 4. VNC: cross-platform open source remote desktop software application to control another computer's screen remotely. Provides 'tight encoding' to improve performance over low bandwidth connections.
Figure 6 Sensor, Contact, and Chart Data and Control Signal Flow Paths
Interface Architecture MMFP operation comes together via the interface architecture. For the project, two primary nodes were developed. One is the shipboard (i.e., escort vessel) node (left half of Figure 3 and Figure 4) and the other node is a shore-based fixed site (right half of Figure 3 and Figure 5). Generating the required operational capability necessitated the availability of a suite of sensors and a communications network configured to make the sensor data available to both the vessel and shore nodes. Core functionality is implemented via two MMFP server laptops, each machine running both an MMFP server and a camera server (FirstView Server). A Panasonic Toughbook laptop runs both servers, one at each node. The Toughbook coordinates:
8
FLIR Voyager Camera control functions (via FirstView Server): video and control data routed via wired TCP/IP to an AXIS 241S Video Server (for local
sensors) video and control data routed via wireless TCP/IP to the other MMFP server (for remote
sensors) Access to position reports:
generated by organic GPS, AIS and radar sensors, using wired TCP/IP and/or serial port servers (for local sensors), and
Generated by remote GPS, AIS and radar sensors, via a wireless network (for remote sensors).
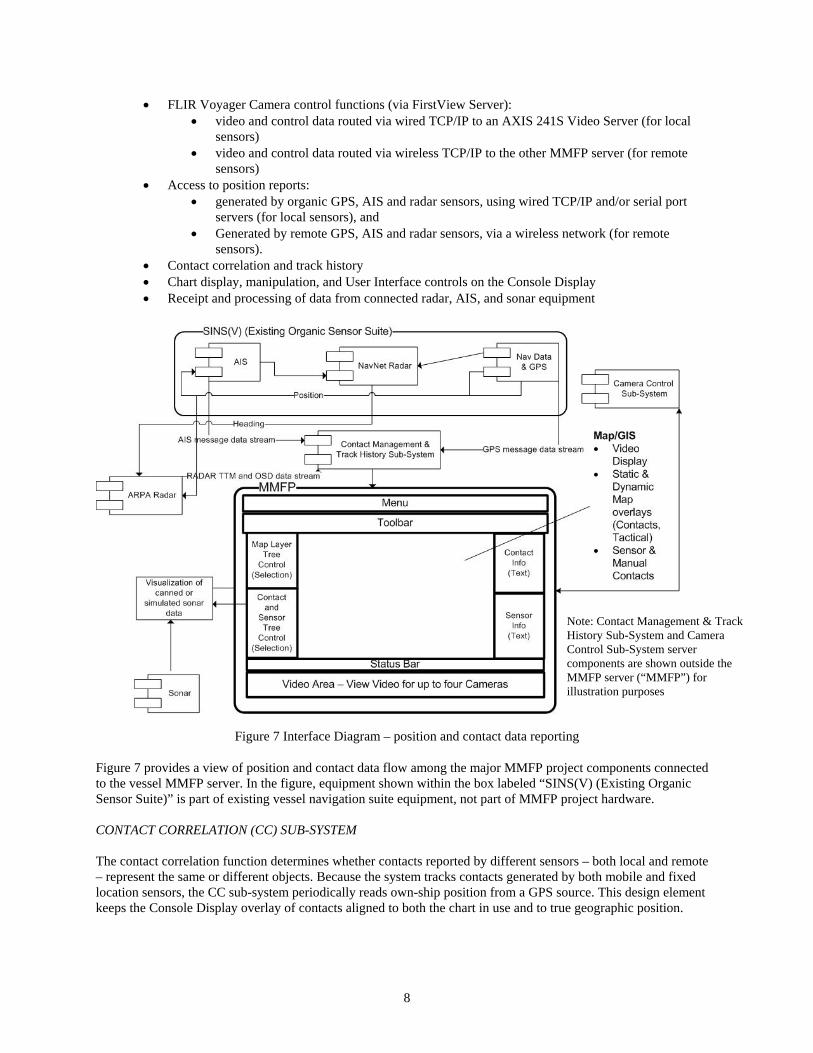
Contact correlation and track history Chart display, manipulation, and User Interface controls on the Console Display Receipt and processing of data from connected radar, AIS, and sonar equipment
Figure 7 Interface Diagram – position and contact data reporting
Figure 7 provides a view of position and contact data flow among the major MMFP project components connected to the vessel MMFP server. In the figure, equipment shown within the box labeled “SINS(V) (Existing Organic Sensor Suite)” is part of existing vessel navigation suite equipment, not part of MMFP project hardware. CONTACT CORRELATION (CC) SUB-SYSTEM The contact correlation function determines whether contacts reported by different sensors – both local and remote – represent the same or different objects. Because the system tracks contacts generated by both mobile and fixed location sensors, the CC sub-system periodically reads own-ship position from a GPS source. This design element keeps the Console Display overlay of contacts aligned to both the chart in use and to true geographic position.
Note: Contact Management & Track History Sub-System and Camera Control Sub-System server components are shown outside the MMFP server (“MMFP”) for illustration purposes

9
Sensor Data Listener software (for AIS and radar) reports new contacts and position updates for existing contacts to the CC sub-system as they become available. The CC sub-system correlates these contacts and holds Position Reports for each in memory for rendering by the Display sub-system, and communicates with a GPS device to update Own Ship position. (The Data Listener classes run in separate threads of execution to extract contact data, and the CC sub-system coordinates those threads’ initialization and shut-down sequences.) The CC sub-system directs the sensor data listeners, correlates contacts from sensors, and stores both uncorrelated and correlated contact data persistently in a MySQL database. An MMFP project unique software sub-routine analyzes contacts over time, comparing and contrasting reported positions, courses, speeds, etc., in order to decide that two different sensor contacts are in fact the same one.
EQUIPMENT OPERATION CAMERA (FLIR VOYAGER) Functionality for controlling both the shipboard and fixed site cameras is provided via the Console Display touch screen interface. Controls include:
1. Configuration of camera’s operational settings. 2. Access to and navigation of the camera system’s built in menu of camera controls. 3. Interactive control of the camera pan and tilt angles (azimuth and elevation), zoom, and focus. This is
executed via the FirstView web-based camera control panel. 4. Camera positioning, via camera control commands, including:
4.1. Commanding camera to orient to a given azimuth and elevation; 4.2. Retrieval of camera’s current azimuth and elevation; 4.3. Setting camera’s offset azimuth and elevation.
Detailed information on the FLIR Voyager camera units is provided in Appendix D, MMFP Hardware Description. AUTOMATIC IDENTIFICATION SYSTEM (AIS) AIS allows maritime vessels to be tracked in real time. Coast Guard regulations require all maritime vessels of > 300 tons displacement to operate AIS within US waters. Such vessels are equipped with either a Class A or Class B AIS transponder, which includes a GPS for accurate position and speed reporting. Each AIS-capable ship transmits required information. A standard AIS message report includes a vessel identification code and vessel specific data: Speed Over Ground, Course Over Ground, Latitude, Longitude, True Heading, and time of message. Vessels have the option of using an extended message report, which adds ship type and ship dimension (length and width) data to the message. AIS receivers decode the transmitted information and output the data for use in connected equipment. For the project, Class B AIS transponders were used and connected as shown in Figures 3, 4, and 6. Detailed information on the AIS units is provided in Appendix D, MMFP Hardware Description. GPS
GPS units provide accurate position data, based on triangulation, using a constellation of satellites; these provide essential GPS data (GPS fix data, position, speed, date, and heading). Data content and transmission protocols are specified by the NMEA 0183 standard. For the project, onboard the escort vessel, GPS data was obtained from the installed GP-37 GPS unit, part of the vessel’s navigation suite. GPS data routing is as shown illustrated in Figures 3, 4, and 6. Detailed information on GPS unit operation is provided in Appendix D, MMFP Hardware Description. RADAR The Furuno radar sets used for the project were ARPA-capable (Advanced Radar Plotting Aid, also termed “Tracked Target” (TT) – or Tracked Target Message (TTM) – capable). ARPA-capable means that internal radar set circuitry collects return signals, conducts analysis, determines which radar returns represent actual contacts, and
10
tracks them internally. For each tracked contact, the radar determines contact course, speed, and range and bearing from its sensor data, and computes both time to Closest Point of Approach (CPA) and distance at CPA. MMFP takes advantage of this capability by routing available contact data to the MMFP server, as shown in Figures 6 and 7, for use by the Contact Correlation and Track History sub-system. Figure 7 illustrates component interfaces for routing of navigation and contact data. Detailed technical discussion of the Furuno radar is provided in the vendor’s technical manuals. Operation of the Furuno radar as part of the MMFP project is described in the MMFP User’s Guide.
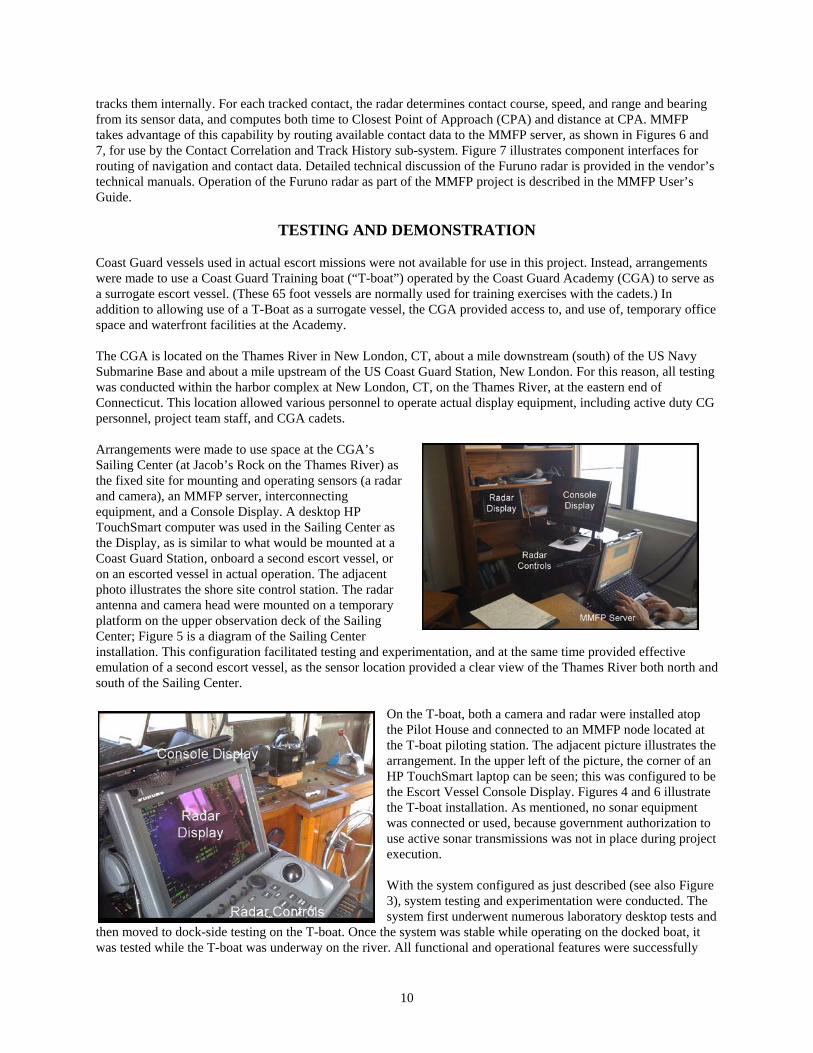
TESTING AND DEMONSTRATION Coast Guard vessels used in actual escort missions were not available for use in this project. Instead, arrangements were made to use a Coast Guard Training boat (“T-boat”) operated by the Coast Guard Academy (CGA) to serve as a surrogate escort vessel. (These 65 foot vessels are normally used for training exercises with the cadets.) In addition to allowing use of a T-Boat as a surrogate vessel, the CGA provided access to, and use of, temporary office space and waterfront facilities at the Academy. The CGA is located on the Thames River in New London, CT, about a mile downstream (south) of the US Navy Submarine Base and about a mile upstream of the US Coast Guard Station, New London. For this reason, all testing was conducted within the harbor complex at New London, CT, on the Thames River, at the eastern end of Connecticut. This location allowed various personnel to operate actual display equipment, including active duty CG personnel, project team staff, and CGA cadets. Arrangements were made to use space at the CGA’s Sailing Center (at Jacob’s Rock on the Thames River) as the fixed site for mounting and operating sensors (a radar and camera), an MMFP server, interconnecting equipment, and a Console Display. A desktop HP TouchSmart computer was used in the Sailing Center as the Display, as is similar to what would be mounted at a Coast Guard Station, onboard a second escort vessel, or on an escorted vessel in actual operation. The adjacent photo illustrates the shore site control station. The radar antenna and camera head were mounted on a temporary platform on the upper observation deck of the Sailing Center; Figure 5 is a diagram of the Sailing Center installation. This configuration facilitated testing and experimentation, and at the same time provided effective emulation of a second escort vessel, as the sensor location provided a clear view of the Thames River both north and south of the Sailing Center.
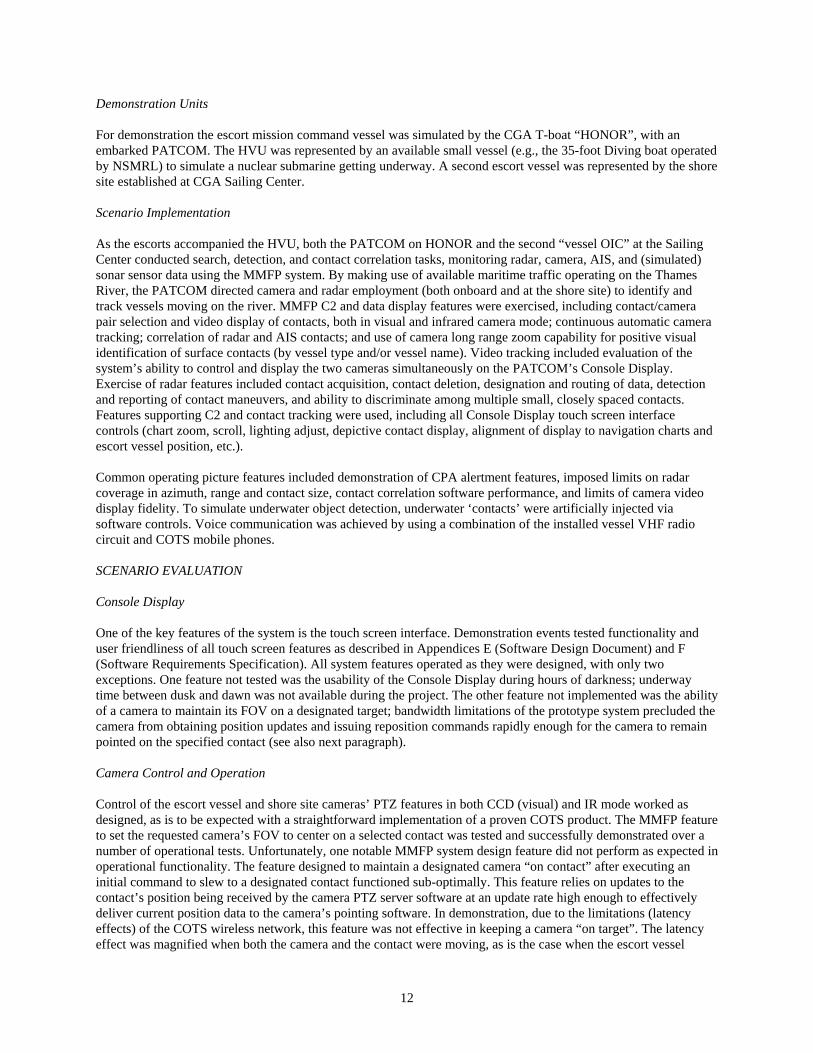
On the T-boat, both a camera and radar were installed atop the Pilot House and connected to an MMFP node located at the T-boat piloting station. The adjacent picture illustrates the arrangement. In the upper left of the picture, the corner of an HP TouchSmart laptop can be seen; this was configured to be the Escort Vessel Console Display. Figures 4 and 6 illustrate the T-boat installation. As mentioned, no sonar equipment was connected or used, because government authorization to use active sonar transmissions was not in place during project execution. With the system configured as just described (see also Figure 3), system testing and experimentation were conducted. The system first underwent numerous laboratory desktop tests and
then moved to dock-side testing on the T-boat. Once the system was stable while operating on the docked boat, it was tested while the T-boat was underway on the river. All functional and operational features were successfully

11
tested, however no sonar equipment was used. Throughout the testing, the Console Display on the T-boat functioned as the main display, and the display in the Sailing Center was utilized as a repeater display with limited functionality. Figure 8 is a screen shot of the Console Display typical of MMFP system operation while underway. Shown on the left side of the display, from top to bottom, are the main and auxiliary camera controls for the fixed site camera, with the live video feed from the camera displayed. On the right side of the screen is the MMFP main chart display. The chart can be zoomed in or out, and scrolled both east-west and north-south. Touching either the camera icon above the zoom buttons or the camera icon shown (“Shore Camera location”) calls up the camera video feed display; pointing of the camera is commanded by touching first a contact icon, and then the camera icon within the white pop-up data window. The popup window displays available contact data and its source. Touching the diamond shaped icon causes the software to command the camera to remain pointed to the contact.
Figure 8 MMFP Console Display – live screen shot (September 2009) DEMONSTRATION SCENARIO To provide for effective testing and evaluation of the developed system, the project staff worked closely with Station NLON and the Coast Guard R&D Center to develop escort mission scenarios similar to those encountered on the Thames River. Included in the discussion was development of methods to simulate the acquisition of underwater contact data and integration of that data into the overall MMFP project design. The following paragraphs provide a brief description of the testing scenarios employed and a summary of system performance evaluation. Basic Scenario An escort mission command vessel and a Response Boat – Small (RB-S) have been assigned to escort a High-Value Unit (HVU) from the pier at the Groton Submarine Base through the Long Island Sound to open water. The escort commences as the HVU begins its transit in the Thames River dredged channel, and ends sometime after the HVU passes Ledge Light beyond the marked harbor channel.
12
Demonstration Units For demonstration the escort mission command vessel was simulated by the CGA T-boat “HONOR”, with an embarked PATCOM. The HVU was represented by an available small vessel (e.g., the 35-foot Diving boat operated by NSMRL) to simulate a nuclear submarine getting underway. A second escort vessel was represented by the shore site established at CGA Sailing Center. Scenario Implementation As the escorts accompanied the HVU, both the PATCOM on HONOR and the second “vessel OIC” at the Sailing Center conducted search, detection, and contact correlation tasks, monitoring radar, camera, AIS, and (simulated) sonar sensor data using the MMFP system. By making use of available maritime traffic operating on the Thames River, the PATCOM directed camera and radar employment (both onboard and at the shore site) to identify and track vessels moving on the river. MMFP C2 and data display features were exercised, including contact/camera pair selection and video display of contacts, both in visual and infrared camera mode; continuous automatic camera tracking; correlation of radar and AIS contacts; and use of camera long range zoom capability for positive visual identification of surface contacts (by vessel type and/or vessel name). Video tracking included evaluation of the system’s ability to control and display the two cameras simultaneously on the PATCOM’s Console Display. Exercise of radar features included contact acquisition, contact deletion, designation and routing of data, detection and reporting of contact maneuvers, and ability to discriminate among multiple small, closely spaced contacts. Features supporting C2 and contact tracking were used, including all Console Display touch screen interface controls (chart zoom, scroll, lighting adjust, depictive contact display, alignment of display to navigation charts and escort vessel position, etc.).
Common operating picture features included demonstration of CPA alertment features, imposed limits on radar coverage in azimuth, range and contact size, contact correlation software performance, and limits of camera video display fidelity. To simulate underwater object detection, underwater ‘contacts’ were artificially injected via software controls. Voice communication was achieved by using a combination of the installed vessel VHF radio circuit and COTS mobile phones. SCENARIO EVALUATION Console Display One of the key features of the system is the touch screen interface. Demonstration events tested functionality and user friendliness of all touch screen features as described in Appendices E (Software Design Document) and F (Software Requirements Specification). All system features operated as they were designed, with only two exceptions. One feature not tested was the usability of the Console Display during hours of darkness; underway time between dusk and dawn was not available during the project. The other feature not implemented was the ability of a camera to maintain its FOV on a designated target; bandwidth limitations of the prototype system precluded the camera from obtaining position updates and issuing reposition commands rapidly enough for the camera to remain pointed on the specified contact (see also next paragraph). Camera Control and Operation Control of the escort vessel and shore site cameras’ PTZ features in both CCD (visual) and IR mode worked as designed, as is to be expected with a straightforward implementation of a proven COTS product. The MMFP feature to set the requested camera’s FOV to center on a selected contact was tested and successfully demonstrated over a number of operational tests. Unfortunately, one notable MMFP system design feature did not perform as expected in operational functionality. The feature designed to maintain a designated camera “on contact” after executing an initial command to slew to a designated contact functioned sub-optimally. This feature relies on updates to the contact’s position being received by the camera PTZ server software at an update rate high enough to effectively deliver current position data to the camera’s pointing software. In demonstration, due to the limitations (latency effects) of the COTS wireless network, this feature was not effective in keeping a camera “on target”. The latency effect was magnified when both the camera and the contact were moving, as is the case when the escort vessel

13
camera is attempting to track a contact. Correction of this tracking delay requires use of a wireless network having greater bandwidth than that available from the project’s wireless network. Escort Vessel and Contact Relative Motion Effects Also due to the limitations of the COTS wireless network used for the project, neither camera tracking nor radar plotting of contacts on the Console Display worked well when HONOR conducted a course change maneuver. For any course alteration beyond nominal (< 20 degrees), latency effects were found in the display of contacts on the chart, in slewing of the onboard camera to stay locked on/pointed to an assigned contact, and in the radar’s ability to initially designate a series of radar echoes as a contact. Similarly, neither onboard nor shore site camera tracking could stay ‘on contact’ for contacts with more than low (< 5 degrees/min) bearing rates. Various escort vessel maneuvers were conducted to evaluate the ability of the MMFP sensors (radar, camera) to “keep up” with such maneuvers. Contact and Threat Detection During the simulated escort mission, threat detection was accomplished by MMFP operators, but not necessarily in accordance with existing Coast Guard Concept of Operations (ConOps). In actual operations, Coast Guard PATCOMs respond in accordance with existing mission execution guidelines based on an approved ConOps. Developing ConOps for optimal use of MMFP equipment and capability was beyond the scope of the project. The MMFP contact detection features that enable long range search, detection, correlation, and tracking of contacts were tested. The tracking parameters and thresholds for initiation of threat response were varied, with the goal of informally examining the effect on the workload of the Console Display operator. The parameters changed included total numbers of tracked contacts, scale of chart in use, initial range of unknown object detection (e.g., a radar contact that cannot be correlated to a known AIS contact), and scalar data such as minimum Closest Point of Approach and speed of approach.
RESULTS AND CONCLUSIONS The goal of the MMFP project was not to develop a complete and integrated C2 system, but rather to prototype enough of the infrastructure of such a system to facilitate the exploration of some of the operational benefits and issues associated with the development of a real-time integrated mobile C2 system. This overall project goal was accomplished successfully. The project focused primarily on providing a distribution framework for:
Integrating multiple visual and infrared camera video streams, Identifying and rendering radar, Global Positioning System (GPS), and Automatic Identification
System (AIS) data on an Electronic Chart System (ECS), Incorporating display of escort vessel’s sonar data, Controlling camera field of view based on operator selection of a radar track, an AIS track, or a
specific position, Distribution of these displays among the escort vessels and Coast Guard harbor control facilities, Providing an intuitive, real-time, situation display common to all connected nodes, and Integrating all of these capabilities for use and control, at minimal possible workload, by escort vessel
operators during execution of assigned escort missions. The project developed an integrated set of sensors, situational displays, inputs to displays, object/contact tracking capability, and communications paths to demonstrate enhanced tactical control and situation awareness in the maritime environment for the protection of the nation’s high value maritime vessels. The prototype system exhibits sufficient functionality, information display, and operator ease-of-use to serve USCG PATCOMs as an integrated navigational chart and operations situation awareness control station. The major, previously unavailable, benefit of MMFP is the capability to generate and maintain a common operational view or picture of operationally relevant on-water and below surface activity which could present a threat to escorted vessels.

14
In particular, the mobile tactical control station – the Console Display - provides the controls, tools, and displays for maintaining situation awareness through the ability to control and direct both organic (vessel mounted) and remote (shore site mounted) sensors. Together, these sensors, controls, and displays can maximize surface and subsurface contact detection, tracking, classification, and monitoring. FUTURE DEVELOPMENT EFFORTS As of the date of this report, the MMFP program has essentially been completed. NSMRL, CGA, and USCG R&D Center staff maintain custody of all MMFP project equipment and software, with specific equipment in short term storage, available for setup and further demonstration and testing operations. Appendix G provides a brief discussion of possible future MMFP design and/or development work which may be useful in serving the needs of the USCG HVU Escort Mission.
15
REFERENCES
Electronic Navigational Charts: NOAA ENCs, National Oceanic and Atmospheric Administration, http://www.nauticalcharts.noaa.gov/mcd/enc/index.htm. Accessed Dec 2008. FirstView Enterprise Server – Command and Control System for Sensor Integration and Management, Smiths Detection-LiveWave Technical Document, 29 Oct 2008. Javadoc for LiveWave Prototype, Smiths Detection-LiveWave, Provided Dec 2008. Maritime Mobile Force Protection Program (MMFPP) Software Requirements Specification, Sonalysts, Inc, 7 January 2009 (See Appendix F). Maritime navigation and radiocommunication equipment and systems – Presentation of navigation-related information on shipborne navigational displays (IEC 80/492/CDV:2007), (DIN EN 62288:2008-1), DIN Deutsches Institut für Normung, e.V. English version prEN 622. NOAA Raster Navigational Chart (RNC) 13212 Approaches to New London Harbor and Chart 13213 New London Harbor and Vicinity. Pub 1310, Radar Navigation and Maneuvering Board Manual 7th Ed, 2001. Raster Navigational Charts: NOAA RNCs, National Oceanic and Atmospheric Administration, http://www.nauticalcharts.noaa.gov/mcd/Raster/index.htm. Accessed Dec 2008. Recommendation ITU-R M.1371-2, Technical characteristics for a universal shipborne automatic identification system using time division multiple access in the VHF maritime mobile band, International Telecommunications Union/ITU Radiocommunication Sector, 3 June 2007. Furuno FAR-2xx7 Series Marine Radar Operator’s Guide. Furuno Marine Radar/ARPA Installation Manual, models FAR-2117/2127/2817/2827, and FAR-2117-BB/2127-BB. Furuno Operator’s Manual, Marine Radar/ARPA, Model FAR-21x7(-BB) Series, FAR-28X7 Series. GP-37 DGPS Navigator, GP-32 GPS Furuno Navigator Operator’s Manual. GP32/37 Operations and Information Quick Guide. Pub 1310 Radar Navigation and Maneuvering Board Manual, 2001 7th Ed, 2001. Universal AIS Transponder FA-150, Furuno Installation Manual. Universal AIS Transponder FA-150, Furuno Operator’s Manual. Voyager Installation Guide, FLIR Document Number: 432-0002-00-11, rev 100. Voyager Operator’s Manual, FLIR Document Number: 432-0002-00-11. HP TouchSmart Laptop Owner’s Manual. HP TouchSmart TX2-1020US Notebook Owner’s Manual. Panasonic Toughbook, model CF-30K Owner’s Manual.

16
[THIS PAGE INTENTIONALLY LEFT BLANK]
A-1
APPENDICES
APPENDIX A
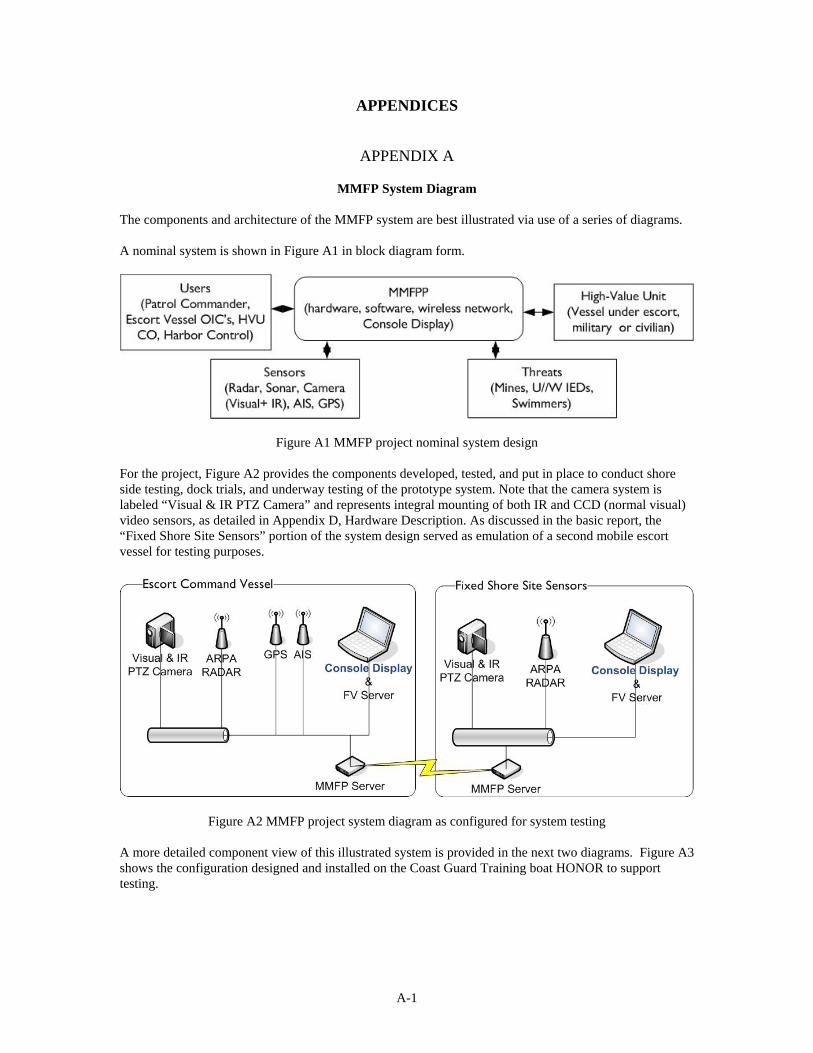
MMFP System Diagram The components and architecture of the MMFP system are best illustrated via use of a series of diagrams. A nominal system is shown in Figure A1 in block diagram form.
Figure A1 MMFP project nominal system design For the project, Figure A2 provides the components developed, tested, and put in place to conduct shore side testing, dock trials, and underway testing of the prototype system. Note that the camera system is labeled “Visual & IR PTZ Camera” and represents integral mounting of both IR and CCD (normal visual) video sensors, as detailed in Appendix D, Hardware Description. As discussed in the basic report, the “Fixed Shore Site Sensors” portion of the system design served as emulation of a second mobile escort vessel for testing purposes.
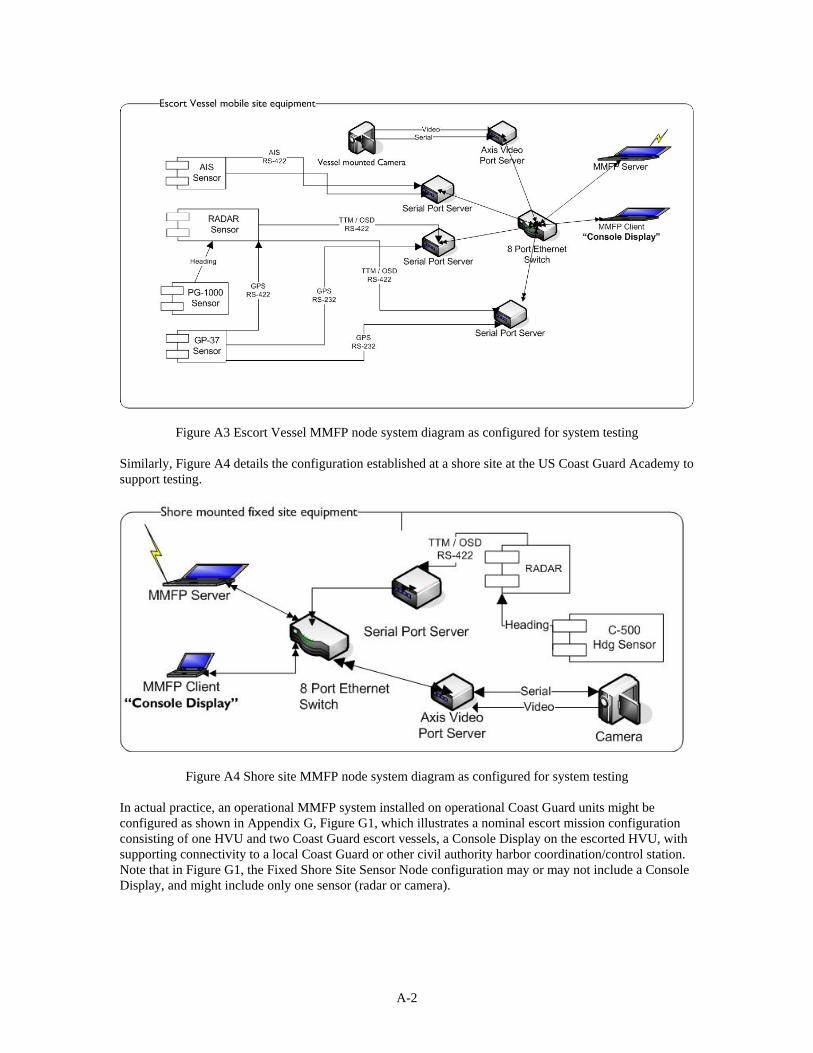
Figure A2 MMFP project system diagram as configured for system testing A more detailed component view of this illustrated system is provided in the next two diagrams. Figure A3 shows the configuration designed and installed on the Coast Guard Training boat HONOR to support testing.
A-2
Figure A3 Escort Vessel MMFP node system diagram as configured for system testing Similarly, Figure A4 details the configuration established at a shore site at the US Coast Guard Academy to support testing.
Figure A4 Shore site MMFP node system diagram as configured for system testing In actual practice, an operational MMFP system installed on operational Coast Guard units might be configured as shown in Appendix G, Figure G1, which illustrates a nominal escort mission configuration consisting of one HVU and two Coast Guard escort vessels, a Console Display on the escorted HVU, with supporting connectivity to a local Coast Guard or other civil authority harbor coordination/control station. Note that in Figure G1, the Fixed Shore Site Sensor Node configuration may or may not include a Console Display, and might include only one sensor (radar or camera).
B-1
APPENDIX B
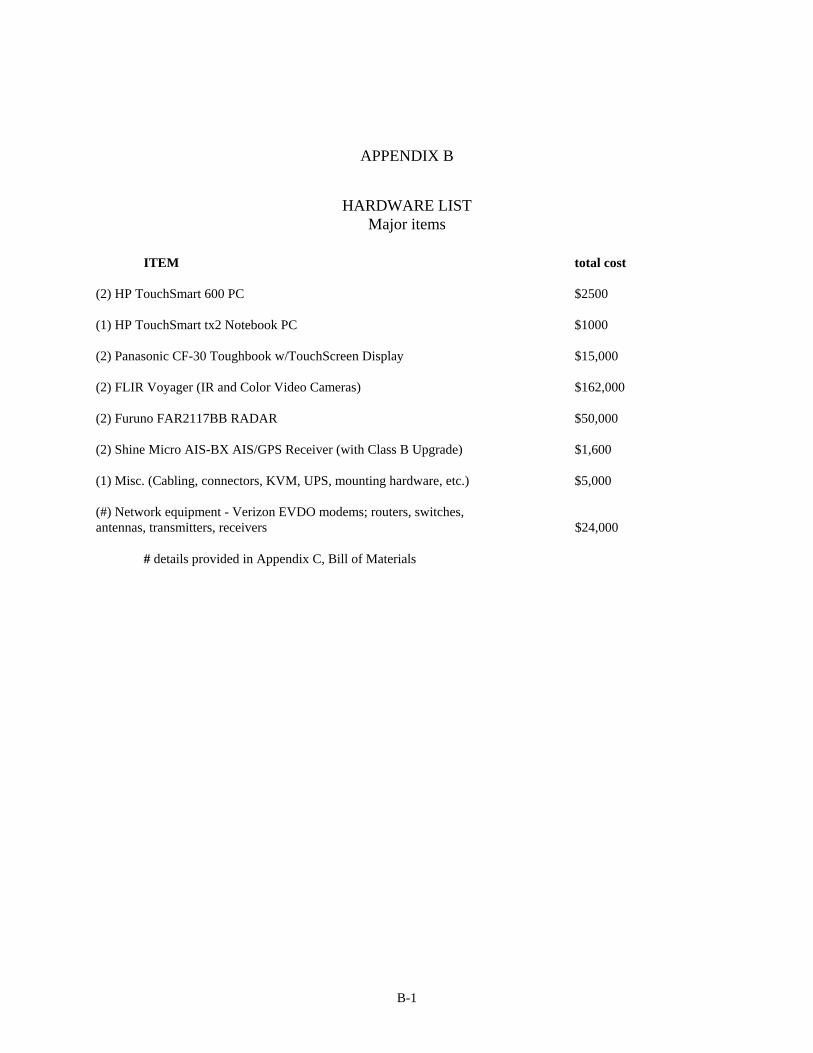
HARDWARE LIST Major items
ITEM total cost (2) HP TouchSmart 600 PC $2500 (1) HP TouchSmart tx2 Notebook PC $1000 (2) Panasonic CF-30 Toughbook w/TouchScreen Display $15,000 (2) FLIR Voyager (IR and Color Video Cameras) $162,000 (2) Furuno FAR2117BB RADAR $50,000 (2) Shine Micro AIS-BX AIS/GPS Receiver (with Class B Upgrade) $1,600 (1) Misc. (Cabling, connectors, KVM, UPS, mounting hardware, etc.) $5,000 (#) Network equipment - Verizon EVDO modems; routers, switches, antennas, transmitters, receivers $24,000
# details provided in Appendix C, Bill of Materials

B-2
[THIS PAGE INTENTIONALLY LEFT BLANK]
C-1
APPENDIX C
Bill of Materials MMFP Sensor Network Afloat and Ashore Nodes
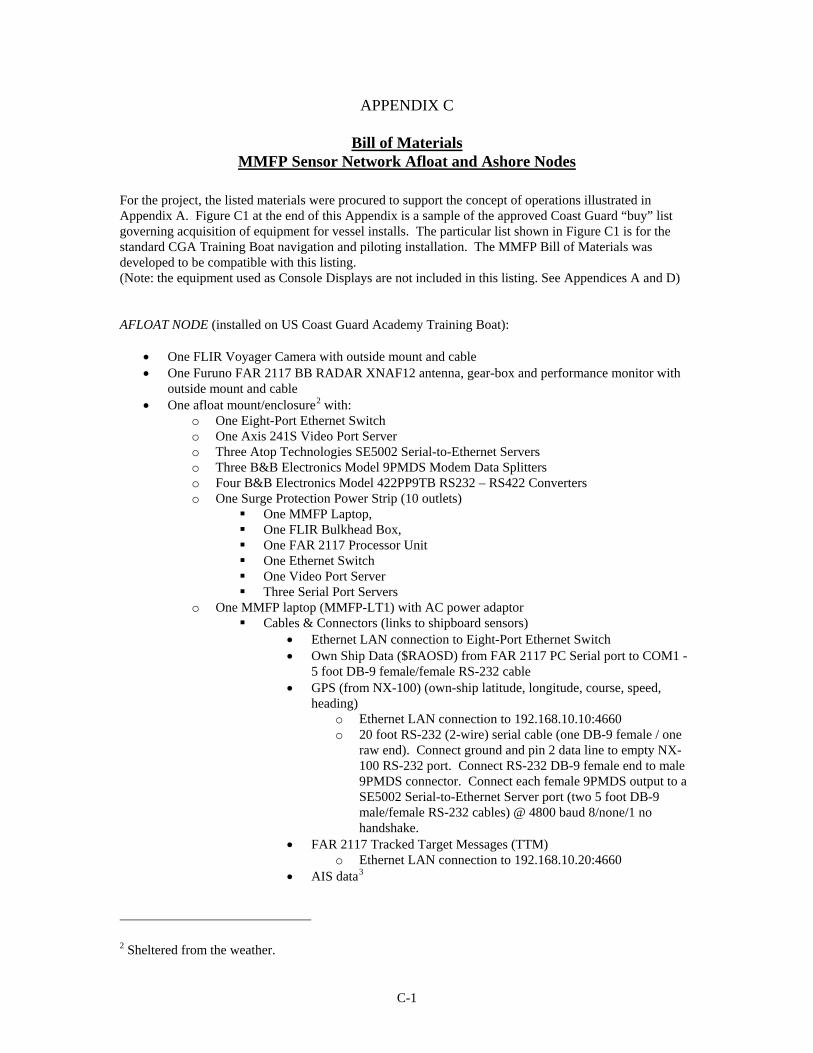
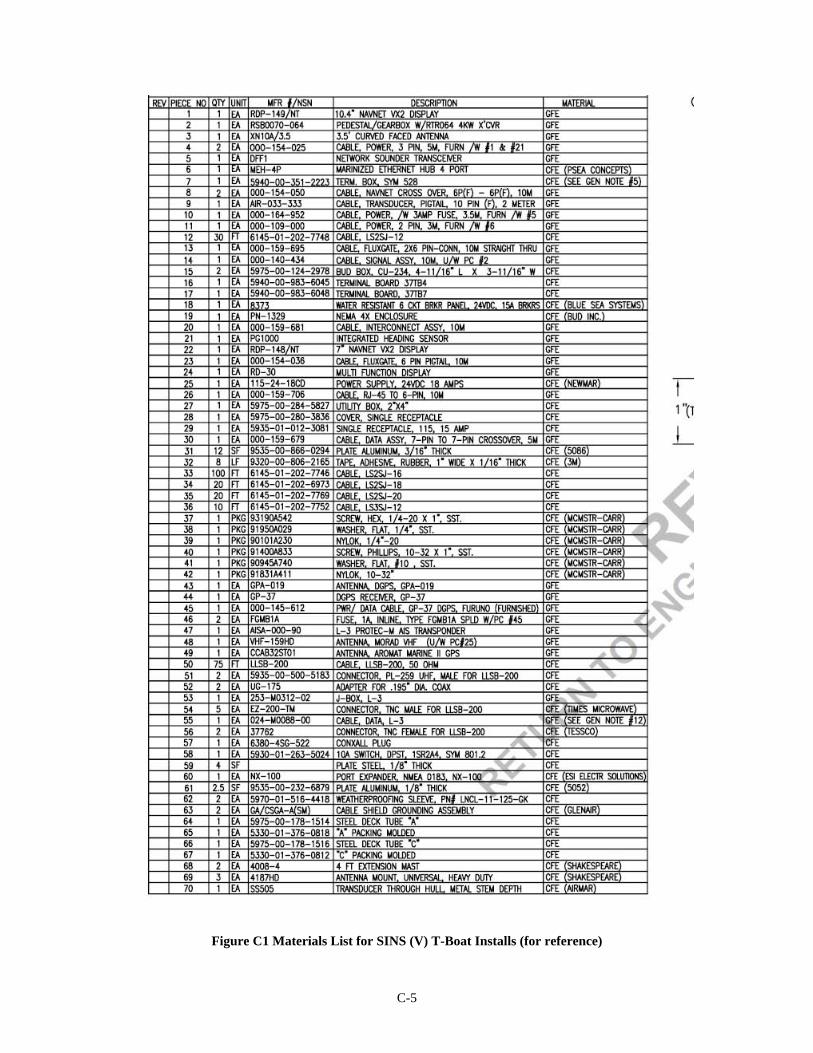
For the project, the listed materials were procured to support the concept of operations illustrated in Appendix A. Figure C1 at the end of this Appendix is a sample of the approved Coast Guard “buy” list governing acquisition of equipment for vessel installs. The particular list shown in Figure C1 is for the standard CGA Training Boat navigation and piloting installation. The MMFP Bill of Materials was developed to be compatible with this listing. (Note: the equipment used as Console Displays are not included in this listing. See Appendices A and D) AFLOAT NODE (installed on US Coast Guard Academy Training Boat):
One FLIR Voyager Camera with outside mount and cable One Furuno FAR 2117 BB RADAR XNAF12 antenna, gear-box and performance monitor with
outside mount and cable One afloat mount/enclosure2 with:
o One Eight-Port Ethernet Switch o One Axis 241S Video Port Server o Three Atop Technologies SE5002 Serial-to-Ethernet Servers o Three B&B Electronics Model 9PMDS Modem Data Splitters o Four B&B Electronics Model 422PP9TB RS232 – RS422 Converters o One Surge Protection Power Strip (10 outlets)
One MMFP Laptop, One FLIR Bulkhead Box, One FAR 2117 Processor Unit One Ethernet Switch One Video Port Server Three Serial Port Servers
o One MMFP laptop (MMFP-LT1) with AC power adaptor Cables & Connectors (links to shipboard sensors)
Ethernet LAN connection to Eight-Port Ethernet Switch Own Ship Data ($RAOSD) from FAR 2117 PC Serial port to COM1 -
5 foot DB-9 female/female RS-232 cable GPS (from NX-100) (own-ship latitude, longitude, course, speed,
heading) o Ethernet LAN connection to 192.168.10.10:4660 o 20 foot RS-232 (2-wire) serial cable (one DB-9 female / one
raw end). Connect ground and pin 2 data line to empty NX-100 RS-232 port. Connect RS-232 DB-9 female end to male 9PMDS connector. Connect each female 9PMDS output to a SE5002 Serial-to-Ethernet Server port (two 5 foot DB-9 male/female RS-232 cables) @ 4800 baud 8/none/1 no handshake.
FAR 2117 Tracked Target Messages (TTM) o Ethernet LAN connection to 192.168.10.20:4660
AIS data3
2 Sheltered from the weather.

C-2
o One 20 foot RS-422 (3-wire) serial cable (raw ends). Connect from AIS Junction Box (5R-RN2, see U.S.C.G. Drawing N0. 65-WTR-423-001, Sheet 4, 5R-RN3 cable) yellow to RD (B), green to RD (A), SHLD to GND on RS-422 side of 422PP9T converter. Connect (male) 9PMDS to (female) RS-232 side of 422PP9T converter. Connect both female 9PMDS outputs to SE5002 Serial-to-Ethernet Server (192.168.10.30) ports 1 & 2 (using two 5 foot DB-9 male/female RS-232 cables) @ 38400 baud 8/none/1 no handshake.
o Ethernet LAN connection to 192.168.10.30:4660 Video
o Ethernet LAN connection to 192.168.10.40:4001 Connection to fixed-site (ashore) sensors
Firewall configuration details TBD (or include a router in place of Eight-Port Ethernet Switch)
Fixed-site FLIR Voyager via fixed-site FV server Fixed-site FAR 2117 (192.168.20.20:4661)
o One FLIR Voyager Power Switching Regulator (110 V AC to 24 V DC) Bulkhead Breakout Box with 24 V DC power cable Joystick Control Unit (JCU) with JCU cable One five foot BNC Video cable (connects Bulkhead Breakout Box to Axis
Video Port Server) One five foot RS422 (5-wire) serial cable (raw ends). Connects Bulkhead
Breakout Box to Axis Video Port Server via 422PP9T converter) o One Furuno 2117
Processor Unit with 110 V AC power cable MU 120C Monitor Unit RCU 014 Control Unit EG-3000 Radar Echo Generator Cables & Connectors (links to shipboard sensors)
GPS (input, via NX-100) (own-ship latitude, longitude, course, speed) - One 20 foot RS-422 (3-wire) serial cable (raw ends). Connect ground and data lines to NX-100 RS-422 port. Connect other end to FAR 2117 Navigator port (J606).4
Heading (input via PG-1000) - 6-pin cable, Furuno part number XFUA0091, 5 meters) connects AD10 (J3) port of existing PG 1000 Heading Sensor to FAR 2117 AD10 input port (J608)
TTM (output) - One 10 foot RS-422 (3-wire) serial cable (raw ends). Connect from FAR 2117 Track Control port (J620) pins 1, 2 and 5 to RD (A), green to RD (B), and GND, respectively on RS-422 side of 422PP9T converter. Connect (male) 9PMDS to (female) RS-232 side of 422PP9T converter. Connect both female 9PMDS outputs to SE5002 Serial-to-Ethernet Server (192.168.10.20) ports 1 & 2 (using
3 There is the possibility that we could also incorporate an option to provide this AIS output feed to the FAR 2117 RADAR. 4 If not able to pull GPS data from NX-100 RS-422 output (which is also connected to shipboard AIS), will have to use NX-100 RS-232 output and convert to RS-422 for input to FAR 2117 J606. This option will require one 20 foot RS-232 (2-wire) serial cable (one DB-9 female / one raw end). Connect ground and pin 2 data line to empty NX-100 RS-232 port. Connect DB-9 female end to 422PP9TB Converter. Connect 5 foot RS-422 (3-wire) serial cable (raw ends) from 422PP9TB RS-422 outputs to FAR 2117 Navigator port (J606)
C-3
two 5 foot DB-9 male/female RS-232 cables) @ 9600 baud 8/none/1 no handshake.
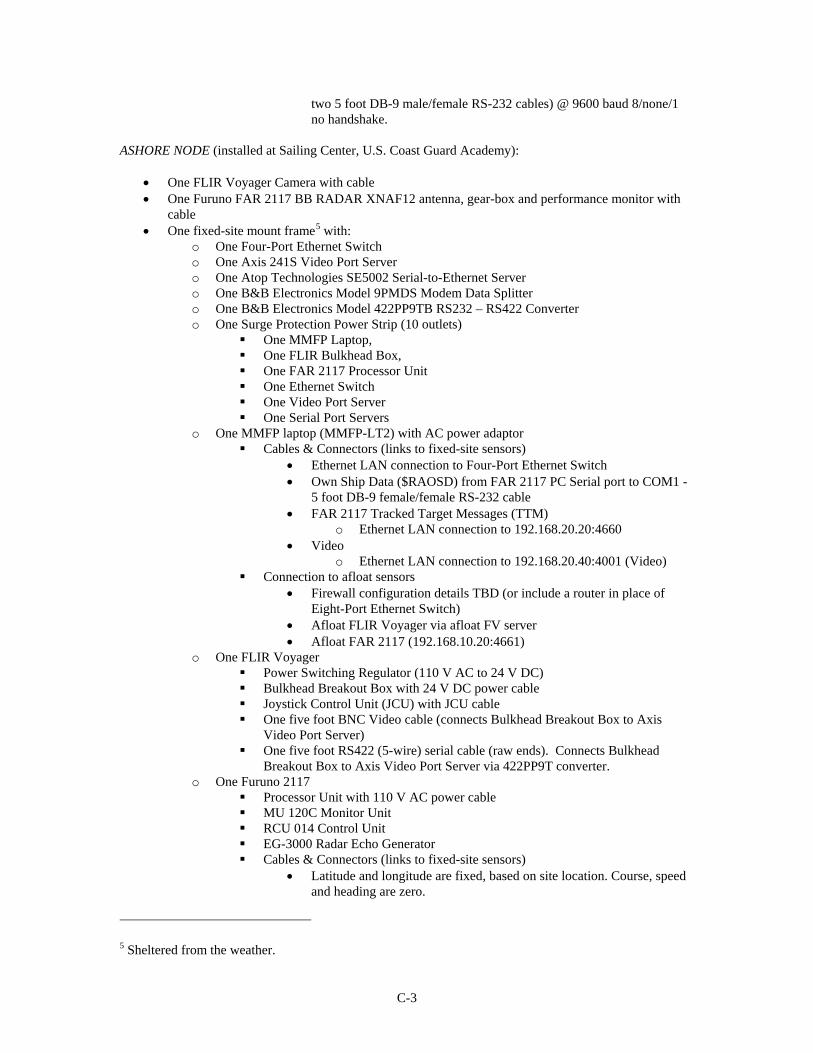
ASHORE NODE (installed at Sailing Center, U.S. Coast Guard Academy):
One FLIR Voyager Camera with cable One Furuno FAR 2117 BB RADAR XNAF12 antenna, gear-box and performance monitor with
cable One fixed-site mount frame5 with:
o One Four-Port Ethernet Switch o One Axis 241S Video Port Server o One Atop Technologies SE5002 Serial-to-Ethernet Server o One B&B Electronics Model 9PMDS Modem Data Splitter o One B&B Electronics Model 422PP9TB RS232 – RS422 Converter o One Surge Protection Power Strip (10 outlets)
One MMFP Laptop, One FLIR Bulkhead Box, One FAR 2117 Processor Unit One Ethernet Switch One Video Port Server One Serial Port Servers
o One MMFP laptop (MMFP-LT2) with AC power adaptor Cables & Connectors (links to fixed-site sensors)
Ethernet LAN connection to Four-Port Ethernet Switch Own Ship Data ($RAOSD) from FAR 2117 PC Serial port to COM1 -
5 foot DB-9 female/female RS-232 cable FAR 2117 Tracked Target Messages (TTM)
o Ethernet LAN connection to 192.168.20.20:4660 Video
o Ethernet LAN connection to 192.168.20.40:4001 (Video) Connection to afloat sensors
Firewall configuration details TBD (or include a router in place of Eight-Port Ethernet Switch)
Afloat FLIR Voyager via afloat FV server Afloat FAR 2117 (192.168.10.20:4661)
o One FLIR Voyager Power Switching Regulator (110 V AC to 24 V DC) Bulkhead Breakout Box with 24 V DC power cable Joystick Control Unit (JCU) with JCU cable One five foot BNC Video cable (connects Bulkhead Breakout Box to Axis
Video Port Server) One five foot RS422 (5-wire) serial cable (raw ends). Connects Bulkhead
Breakout Box to Axis Video Port Server via 422PP9T converter. o One Furuno 2117
Processor Unit with 110 V AC power cable MU 120C Monitor Unit RCU 014 Control Unit EG-3000 Radar Echo Generator Cables & Connectors (links to fixed-site sensors)
Latitude and longitude are fixed, based on site location. Course, speed and heading are zero.
5 Sheltered from the weather.
C-4
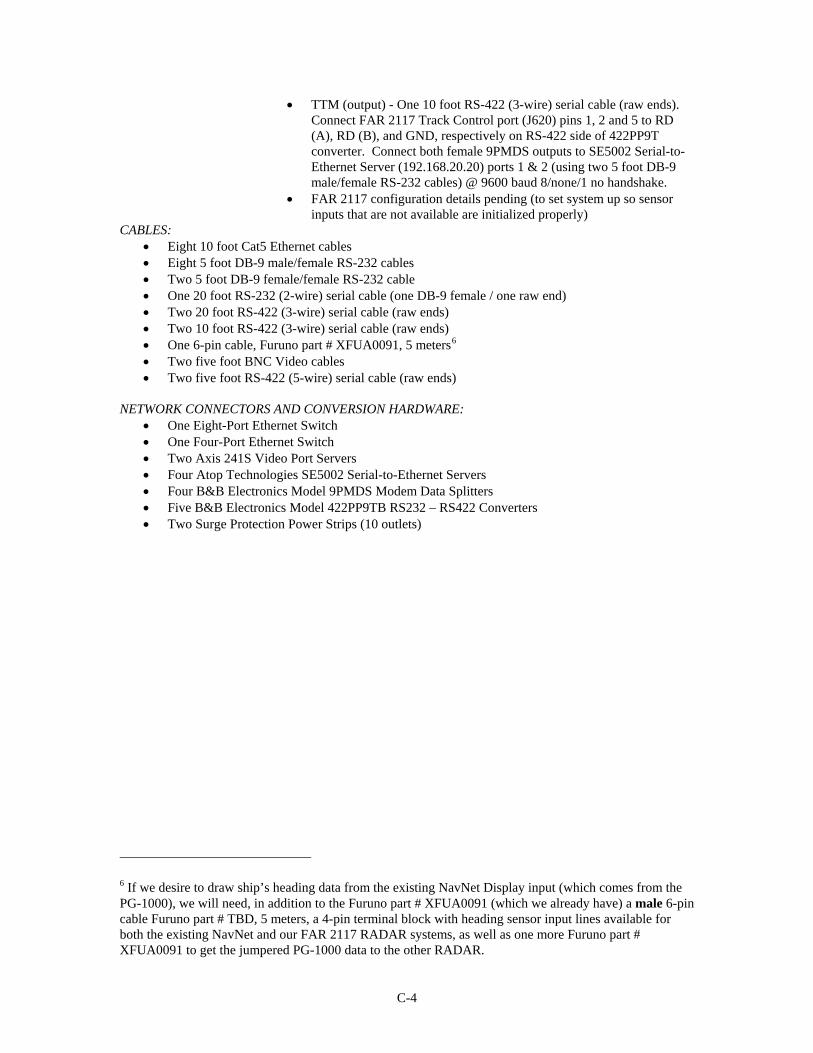
TTM (output) - One 10 foot RS-422 (3-wire) serial cable (raw ends). Connect FAR 2117 Track Control port (J620) pins 1, 2 and 5 to RD (A), RD (B), and GND, respectively on RS-422 side of 422PP9T converter. Connect both female 9PMDS outputs to SE5002 Serial-to-Ethernet Server (192.168.20.20) ports 1 & 2 (using two 5 foot DB-9 male/female RS-232 cables) @ 9600 baud 8/none/1 no handshake.
FAR 2117 configuration details pending (to set system up so sensor inputs that are not available are initialized properly)
CABLES: Eight 10 foot Cat5 Ethernet cables Eight 5 foot DB-9 male/female RS-232 cables Two 5 foot DB-9 female/female RS-232 cable One 20 foot RS-232 (2-wire) serial cable (one DB-9 female / one raw end) Two 20 foot RS-422 (3-wire) serial cable (raw ends) Two 10 foot RS-422 (3-wire) serial cable (raw ends) One 6-pin cable, Furuno part # XFUA0091, 5 meters6 Two five foot BNC Video cables Two five foot RS-422 (5-wire) serial cable (raw ends)
NETWORK CONNECTORS AND CONVERSION HARDWARE:
One Eight-Port Ethernet Switch One Four-Port Ethernet Switch Two Axis 241S Video Port Servers Four Atop Technologies SE5002 Serial-to-Ethernet Servers Four B&B Electronics Model 9PMDS Modem Data Splitters Five B&B Electronics Model 422PP9TB RS232 – RS422 Converters Two Surge Protection Power Strips (10 outlets)
6 If we desire to draw ship’s heading data from the existing NavNet Display input (which comes from the PG-1000), we will need, in addition to the Furuno part # XFUA0091 (which we already have) a male 6-pin cable Furuno part # TBD, 5 meters, a 4-pin terminal block with heading sensor input lines available for both the existing NavNet and our FAR 2117 RADAR systems, as well as one more Furuno part # XFUA0091 to get the jumpered PG-1000 data to the other RADAR.
C-5
Figure C1 Materials List for SINS (V) T-Boat Installs (for reference)

C-6
[THIS PAGE INTENTIONALLY LEFT BLANK]

D-1
APPENDIX D
MMFP Hardware Description
COMPUTERS/SERVERS/DISPLAYS HP TouchSmart 600 PC Features Powerful, compact, wireless all-in-one PC with 23" (diagonal) high-definition widescreen.
TouchSmart apps. Use multi-touch gestures such as pinch, rotate, arc, flick, or press & drag to access information, entertainment and social networks in a natural and intuitive way.
True HD experience when viewing HD content
Built-in wireless capabilities including a wireless keyboard and mouse
Watch, pause, rewind, and record live TV with the optional dual-format NTSC and over-air ATSC high-definition TV tuner
The slim design is essentially clutter-free (no cables except a single power cord)
SPECS
Genuine Windows® 7 Home Premium
Intel® Core™ 2 Duo processor
23" diagonal 1080p Full HD widescreen with 16:9 aspect ratio
Internal antennas for 802.11 Wi-Fi and Bluetooth
A slot-loading DVD drive and 6-in-1 digital media card reader
Integrated premium stereo speakers for crisp sound
A built-in, adjustable-tilt webcam and mic
Removable feet for wall mounting (bracket and adapter sold separately)
HP TouchSmart tx2 Notebook PC Overview and Features Mobile notebook, easily twists into slate mode. Features VISION Technology from AMD. With touch, interact more easily. Zip around PC with multi-touch gestures such as pick, rotate, scroll, flick, and press and drag. Use the pen or finger to draw or write on the screen.
Thin design has a starting weight of 4.65lbs.
Capture handwriting: scrawl onscreen with the included dockable/rechargeable eraser pen (no batteries)
Twist the display up to 180° to share content and watch video -- or fold it flat for writing
D-2
Built in wireless capabilities include a wireless keyboard and mouse
SPECS
Genuine Windows® 7 Home Premium
AMD Turion™ X2 Ultra Dual-Core Mobile Processor
12.1" diagonal WXGA High-Definition LED Widescreen (1280 x 800) touch-screen display
ATI Radeon HD graphics processor
Integrated low-light VGA webcam
Panasonic CF-30 Toughbook w/TouchScreen Display Workhorse rugged laptop stands up to any environment. MIL-STD-810G and 6-foot drop certified for ruggedness. The fully-rugged mobile computer features Windows Vista® Business (with XP downgrade option), a 13.3” optional sunlight-viewable 1,000 nit touchscreen display with Panasonic CircuLumin™ technology, Intel® Centrino® 2 with vPro™ technology and 160GB shock-mounted HDD. Toughbook 30 is mobile broadband ready, comes standard with draft-n Wi-Fi and Bluetooth®, with optional integrated Gobi™ mobile broadband. Enables real-time access to information even in the harshest environments thanks to IP65 certified sealed all-weather design. SPECS Operating System
Genuine Windows Vista™ Business (with XP downgrade option) CPU
- Intel® Core™ 2 Duo Processor SL9300 - Intel® Centrino® 2 with vPro™ technology - Processor speed 1.6Ghz - 6MB L2 cache - 1066MHz FSB
Storage 160GB HDD shock-mounted and quick-release
Memory 2048MB SDRAM (DDR2-667MHz) standard, expandable to 4096MB
Display - 13.3" 1024x768 XGA LCD
Optional touchscreen: 9-1000 nit sunlight-viewable with Panasonic CircuLumin™ technology Non-touchscreen: 500 nit
External video support Intel®GMA 4500MHD
Audio Analog Devices AD1883 compliant audio codec Intel® high-definition audio compliant Integrated speaker Convenient keyboard volume and mute controls
Expansion Slot PC Card Type II x 1 SD Card (SDHC) ExpressCard/54 x 1
Keyboard & Input Touchscreen LCD (only with touchscreen model)

D-3
87-key with dedicated Windows® key Pressure sensitive touchpad with vertical scrolling support Integrated stylus holder (only with touchscreen model)
Interface Port replicator External video Headphones/speaker Microphone/line in Serial Ext. antenna conn. USB 2.0 (x 3) IEEE 1394a (FireWire) 10/100/1000 ethernet 56K modem
Wireless Optional integrated Gobi™ mobile broadband Intel® Wireless WiFi Link 5100 802.11a/b/g/draft-n Bluetooth® v.2.0 + EDR (Class 1) High-gain antenna pass-through
Power Supply Lithium Ion battery pack (10.65V, 8550mAh) Battery operation: 9 hours (Vista), 10 hours (XP) -- 12.5 hours (Vista), 14 hours (XP) including optional 2nd battery Battery charging time: 5hrs. off/ 8.5hrs. on AC Adapter
Power Management Suspend / Resume Function, Hibernation, Standby, ACPI BIOS
Security Features
Password Security: Supervisor, User, Hard-Disk Lock Cable Lock Slot Trusted Platform Module (TPM) security chip V.1.2 Computrace® theft protection agent in BIOS Fingerprint reader (option) SmartCard reader (option)
Integrated Options Gobi™ mobile broadband (EV-DO Rev. A, HSPA) 250GB HDD (shock-mounted) GPS Backlit keyboard SmartCard reader Fingerprint reader HDD and battery lock
Durability Features MIL-STD-810G certified (6' drop)1 MIL-STD-461F certified IP65 certified1 UL1604 certified model CCX Certified v4 HDD heater Magnesium alloy case w/hand strap Shock-mounted, quick-release HDD
Dimensions & Weight 11.5"(L) x 11.9" (W) x 2.7-2.8"(H) 8.4 lbs.
D-4
Warranty 3-year limited warranty, parts & labor
CAMERAS FLIR Voyager IR and Color Video Cameras
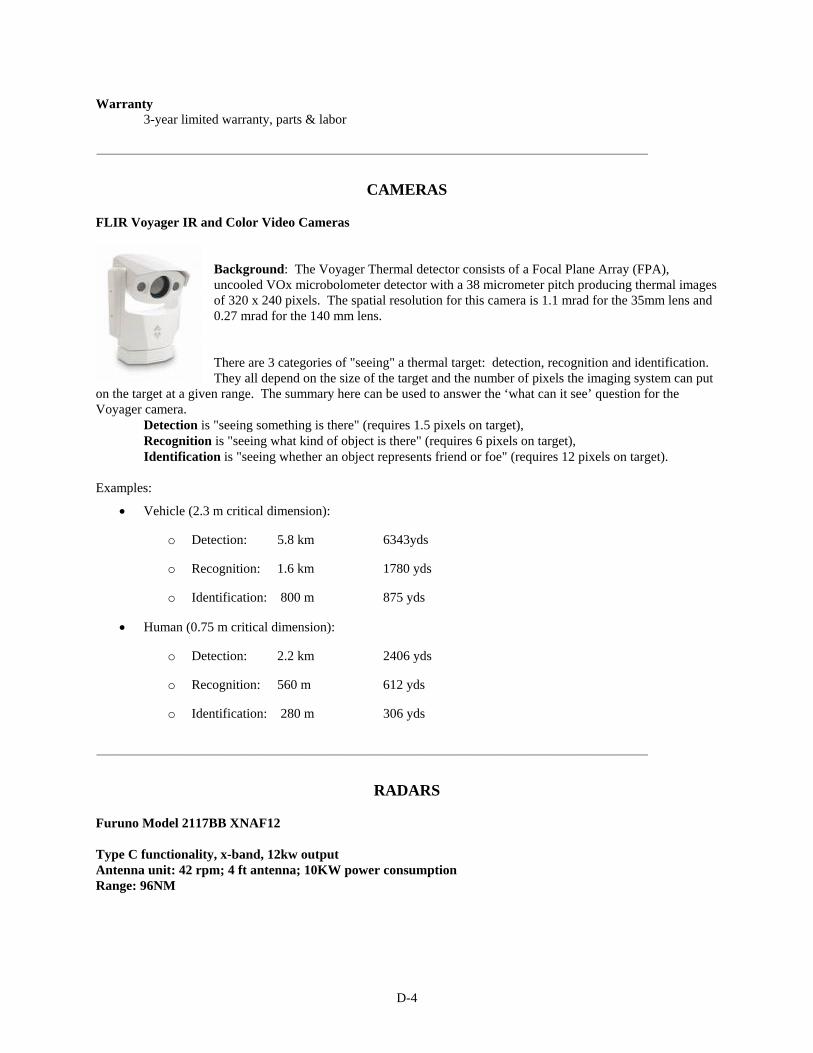
Background: The Voyager Thermal detector consists of a Focal Plane Array (FPA), uncooled VOx microbolometer detector with a 38 micrometer pitch producing thermal images of 320 x 240 pixels. The spatial resolution for this camera is 1.1 mrad for the 35mm lens and 0.27 mrad for the 140 mm lens. There are 3 categories of "seeing" a thermal target: detection, recognition and identification. They all depend on the size of the target and the number of pixels the imaging system can put
on the target at a given range. The summary here can be used to answer the ‘what can it see’ question for the Voyager camera.
Detection is "seeing something is there" (requires 1.5 pixels on target), Recognition is "seeing what kind of object is there" (requires 6 pixels on target), Identification is "seeing whether an object represents friend or foe" (requires 12 pixels on target).
Examples:
Vehicle (2.3 m critical dimension):
o Detection: 5.8 km 6343yds
o Recognition: 1.6 km 1780 yds
o Identification: 800 m 875 yds
Human (0.75 m critical dimension):
o Detection: 2.2 km 2406 yds
o Recognition: 560 m 612 yds
o Identification: 280 m 306 yds
RADARS Furuno Model 2117BB XNAF12 Type C functionality, x-band, 12kw output Antenna unit: 42 rpm; 4 ft antenna; 10KW power consumption Range: 96NM

D-5
Characteristics
Supports non-interlaced SXGA (1280 x 1024) monitors with DVI-D input
Presentation of very high-quality radar image by employing new Digital Video Interface (DVI) techniques
Advanced signal processing for improved detection in rough seas
Up to four radar sets can be interconnected in the network without an extra device
Standard ARPA plotting/tracking of 100 targets acquired automatically or manually
Displays up to 1,000 AIS-equipped targets
Easy operation by customizable function keys, trackball/wheel palm modules and rotary knobs
The BlackBox Radars work with virtually any size multi-sync SXGA (1280 x 1024) LCD or CRT monitor. Furuno also offers a premier line of high-quality LCD monitors that are a perfect compliment to the FAR-21x7-BB Radar series. FURUNO’s MU-155C is a high-resolution LCD monitor that features a variety of features and inputs, including 2 RGB analog, 1 DVI-D and 3 NTSC/PAL video inputs. Connecting a high-resolution SXGA monitor provides crisp radar images, which are presented in selectable colors with a day and night background for easy observation in any lighting condition. Different colors are assigned for marks, symbols and text for user-friendly operation. Target detection is enhanced by employing sophisticated signal processing techniques such as echo stretch, echo average and anti-clutter functions. With useful functions including ARPA, AIS target display, target trail, chart overlay and radar map, the operator can improve navigation efficiency and safety while cruising. The radar antenna is available with 4, 6.5, or 8 ft radiator. For the X-band, the rotation speed is selectable from 24 rpm for standard radar or 42 rpm for high speed craft (HSC). The S-band radar is available with the antenna radiator of 10 or 12 feet. The S-band radar assures target detection in adverse weather where an X-band is heavily affected by sea or rain clutter. Trackball Control Unit Use the Trackball Control Unit as a remote control for the main Control Unit, or as the main system controller for those helms with limited space. Control Unit Various menu options can be easily selected with the use of the trackball and scroll wheel. All of the settings are assigned to icons on the screen, which can be easily selected with single-hand operation. The sunlight viewable MU-155C is a 15" Color TFT LCD monitor and is an ideal match for the FAR-21x7-BB series. The monitor features 2 RGB analog, 1 DVI-D and 3 NTSC/PAL video inputs. Use the NTSC/PAL input for picture in picture (PIP)
AIS / GPS Units
AIS allows maritime vessels to be tracked in real time. All maritime vessels of > 300 tons displacement are required to be equipped with either a Class A or Class B AIS transponder, which includes a GPS for accurate position and speed reporting. Each AIS-capable ship transmits required information. AIS receivers decode the transmitted information and output the data as AIVDM messages. The structure of the AIVDM message is described in IEC 61993-2 and is a variation of the NMEA 0183 sentence format that includes raw data encoded in a

D-6
6-bit format. The meaning of each data element in the AIS messages is covered by various ITU M.1371 and IEC 62287 documents. GPS provides accurate position data based on triangulation, using a constellation of satellites. GPS sentences "$GPRMC", "$GPGGA", "$GPGLL", and "$--HDT" are currently supported. These provide essential GPS data (GPS fix data, position, speed, date, and heading). Data content and transmission protocols are specified by the NMEA 0183 standard.
Specific to Shine Micro vendor:
Class B AIS is a low cost safety of navigation aid. With the RADARPLUS® AIS-BX you can transmit vital data about your vessel while viewing the AIS transmissions of others in real-time. In addition, Shine Micro is an FCC approved issuer of the Maritime Mobile Service Identification number required for identifying your vessel, and provides this unique ID number free with your purchase. The assignment of your MMSI, or registration of an existing one, is online*; making activation easy.
Transmit Your Position Operating an AIS-BX ensures you are seen by other AIS fitted vessels, including the U.S. Coast Guard, Search and Rescue Operations and most commercial ships.
Internal GPS The AIS-BX includes an integral 16 channel GPS. (Antenna sold separately.)
Standard NMEA Interface The AIS-BX can interface with any NMEA compatible GPS plotter or suitably configured PC.
Water Resistance An IP65 rated aluminum case ensures that the AIS-BX is able to operate in harsh environments.
Online Activation*
* MMSI number can be assigned or registered and your transponder activated online (e.g., at www.shinemicro.com)
PRODUCT FEATURES
Physical Dimensions: 6.75 x 4.40 x 1.90 in. (L x W x H) Weight: less than 4 lb. Power 12V DC (9.6-15.6V) Average Power Consumption: 4W nominal (approx. 350 mA at 12V) Peak Power Consumption: 18W during transmit (approx. 1.5A at 12V)
GPS Receiver (Internal) IEC 61108-1 Compliant 16 Channels Receives message 17 for differential corrections to GPS from a transmitting base station Electrical Interfaces
RS232 38.4K baud bi-directional RS422 NMEA 38.4K baud bi-directional
Connectors VHF Antenna Connector: BNC female GPS Antenna Connector: TNC female RS232/RS422/Power: DB15 female
VHF Transceiver Transmitter x 1 Receiver x 2 (one shared between AIS/DSC) Frequency: 156.025 to 162.025 in 25 KHz steps

D-7
Output Power: 33dBm (2 watts) ± 1.5dB Channel Bandwidth: 25KHz Channel Step: 25KHz Modulation Modes:
- 25KHz GMSK (AIS, TX and RX) - 25KHz AFSK (DSC, RX only)
Bit Rate: - 9600 b/s ± 50 ppm (GMSK) - 1200 b/s ± 30 ppm (FSK)
RX Sensitivity: - Sensitivity: -107dBm @ 20% PER
- Co Channel: 10dB - Adjacent Channel: 70dB - IMD: 65dB - Blocking: 84dB
Environmental IEC 60945 (Cat C) Operating Temperature: -25°C to +55°C Compliant with the following standards:
IEC 62287-1 IEC standard, Class B shipborne equipment IEC 60945 Edn 4.0 IEC standard, environmental requirements ITU-RM.1371-1 Universal AIS technical characteristics IEC 61162-1 Edn 2.0 IEC standard, digital interfaces part 1 IEC 61162-2 Edn 1.0 IEC standard, digital interfaces - part 2 IEC 61108-1 IEC standard, GPS receiver equipment ITU RR AP18eWRC2000 Radio regs., appendix 18, table of frequencies in the VHF maritime mobile band ITU R M.493-9 Digital Selective Calling (DSC) system for use in the maritime mobile service ITU R.M 825-3 Characteristics of a transponder system using DSC for use with VTS and ship-to-ship identification

D-8
[THIS PAGE INTENTIONALLY LEFT BLANK]
E-1
APPENDIX E
SOFTWARE DESIGN DOCUMENT (SDD)
Sonalysts, Inc.
215 Parkway North
Waterford, CT 06385

E-2
Revision History
Date Name Description Approvals 19 Jan 09 G. Lucas Initial Draft 21 Jan 09 G. Lucas Modifications for Internal Review 29 Jan 09 G. Lucas Accepted changes from Rick Severinghaus
review
30 Jan 09 G. Lucas Figure 1 update North Up/Head Up icon. Table 9 (information block) range and bearing updated following teleconference of 30 Jan 09
E-3
TABLE OF CONTENTS REVISION HISTORY................................................................................................................................... 2 1 INTRODUCTION ........................................................................................................................... 4 1.1 Purpose 4 1.2 Scope 4 2 REFERENCES................................................................................................................................. 4 2.1 Definitions, Acronyms, and Abbreviations 4
2.1.1 Definitions 4 2.1.2 Acronyms and Abbreviations 6
2.2 References 7 3 SYSTEM OVERVIEW.................................................................................................................... 7 3.1 Chart Display and User Interface 8
3.1.1 Tactical Display Elements 8 3.1.2 User Controls 10
3.2 Back-End Processing of Real-World Data 11 3.3 Pre-Deployment Configuration 11 4 DESIGN CONSIDERATIONS ..................................................................................................... 11 5 ARCHITECTURE ......................................................................................................................... 11 5.1 Overview 11 5.2 Major Software Modules 12
5.2.1 Java Graphics and Chart Display Module 12 5.2.2 Modeling and Analysis Module 12 5.2.3 Chart Production Module 13 5.2.4 Contact Manager 13 5.2.5 Camera Controller and Video Display Dialogs 13
6 HIGH LEVEL DESIGN ................................................................................................................ 13 6.1 Program Start-up Sequences 13 6.2 Communications between Modules 15
6.2.1 Contact Manager Sends Data to Modeling and Analysts Module 15 6.2.2 Modeling and Analysis Supplies Tactical Data to Chart Display 15 6.2.3 Modeling and Analysis Requests a New Chart Background Image 15 6.2.4 User Interaction on Chart Display Selects Camera or Tactical Element (signal to Modeling and Analysis) 17 6.2.5 Modeling and Analysis Communications with Camera Controller 17 6.2.6 User Interaction with Video Display Dialogs 17
7 LOW-LEVEL DESIGN................................................................................................................. 17 7.1 Directory Structure for MMFPP User Interface Resources 17 7.2 Source Data for Charts 18
7.2.1 Installing New Chart Products 18 7.2.2 Supported Chart Products 18
7.3 Configuration Elements 18 7.3.1 Display Properties File (display.properties) 18
8 USER INTERFACE ...................................................................................................................... 23 8.1 Symbols for Representing Vessels 23
8.1.1 Issues of Chart Scale when Selecting Symbols 25 8.1.2 Definition for the Generic Vessel Depiction Symbol 25 8.1.3 Rules for Symbol Selection 26
8.2 Depiction of Heading and Direction Vectors 27 8.3 Information Blocks 28
8.3.1 Information Blocks for Tactical Elements 28 8.3.2 Information Blocks for Camera Elements 28
8.4 Pre-Deployment Data Entry Forms [Deferred] 29 9 CALCULATIONS......................................................................................................................... 33 9.1 Calculation of Closest Point of Approach and Closing Speed 33
E-4
Introduction
Purpose This document provides a software design for a system integration project to be performed for the Naval Submarine Medical Research Laboratory (NSMRL) under U.S. Government contract number N00189-09-P-G035. The project will create a chart-based display and user interface software subsystem to operate as part of a Maritime Mobile Force Protection Program (MMFPP) system being developed for the NSMRL by Sonalysts and Smiths Detection, Inc. The intended audience for this document includes Customers, Project Managers, Developers, and other stake-holders in the MMFPP program. Because the software integration effort is limited in scope, this Software Design Document (SDD) discusses the design at a high-level view. The SDD restricts itself to elements necessary to establish a general understanding of the software and to facilitate discussion of the design with the stake-holders in the MMFPP system.
Scope Sonalysts will perform system integration work to adapt its Commercial-Off-The-Shelf (COTS) chart data presentation software for use in the MMFPP system. The Sonalysts software will be integrated into a software subsystem called the MMFPP Chart Display and User Interface (hereafter, to be referred to as the “Chart Interface”) that will present users with a chart-based display giving real-time information about contacts, sensors, and other data products. These data products will be supplied by the MMFPP Contact/Sensor Management System being developed by Smiths Detection, Inc. The combined system is intended to be used by Escort Mission personnel (e.g., the Patrol Commander) during submarine-escort and other vessel escort operations conducted by the U.S. Coast Guard. During these operations a group of one or more Coast Guard vessels escort U.S. Navy submarines or other High-Value Units (HVU) in and out of U.S. harbors. The MMFPP is intended to enhance the Patrol Commander’s personnel situational awareness by providing information about maritime operations and possible contacts of interest beyond that available to his immediate senses or through existing ship-board systems. The Patrol Commander typically operates in open boats or in vessels providing minimal shelter. Additionally, escort operations place high demand on the Patrol Commander’s personnel workload and attention. Therefore, the MMFPP Chart Display must feature displays that are readable in daylight conditions, and must provide simple controls and largely hands-off operation. To support these requirements, Sonalysts will provide mapping and user interactions customized to the mission objectives of the MMFPP system.
References This section of the SDD provides references relevant to understanding the documentation that follows.
Definitions, Acronyms, and Abbreviations
Definitions Term Description Application Administrator An expert user or system administrator who can operate various system
interfaces to configure the system for operations. Duties of the application administrator include setting of threshold values for alerting conditions, installation of chart products, entry of MMSI data for members of the escort group, etc.
Application Programming Interface (API)
A set of functions, modules, classes, methods, or protocols that allow one software subsystem to interact with another. APIs are used internally to create programs or applications and are not usually apparent to the user.
Automatic Identification A system in which vessels broadcast own-ship position and descriptive data

E-5
Term Description System (AIS) based on information derived from a GPS. Information is broadcast in digital
form over a VHF transmit network. Automatic Radar Plotting Aid (ARPA)
Maritime radar with mapping and other capabilities. Radar with this capability also called TTM –Tracked Target Message and TT – Tracked Target capable.
Console-Style Display A user interface display which acquires control of the entire computer display area, superseding or removing all window decorations (minimize, maximize, desktop, etc.). Console interfaces are often used to provide user access to selected function while preventing them from accessing system-level controls or other programs. The term “console” reflects the similarity of such interfaces to console-based computer game systems. Console-style displays are sometimes called kiosk-style displays.
Camera Elements Graphics elements used to represent camera positions and field of view on the display.
Contact/Sensor Manager The contact management system provided by Smiths Detection-LiveWave to correlate AIS, Radar and Sonar contact data and report own-ship GPS information.
Dialog A window with independent controls usually raised (put on screen) by a larger application. Also called Information Block.
Dispatch Weather Client (DWC)
Sonalysts’ commercial software system developed to present weather, aviation traffic, and other time-sensitive geo-referenced data.
Electronic Chart Display and Information System (ECDIS)
A computer-based navigation information system that meets International Maritime Organization (IMO) standards and is approved for navigation purposes.
Escort Group The collective group of escort vessels and escorted HVU Electronic Navigational Chart (ENC)
A digital chart. To be certified as an Electronic Navigational Chart, a data product must conform to standard stated in the International Hydrographic Organization (IHO) Special Publication S-57.
Evolution-Data Optimized (EV-DO)
A wireless telecommunications standard supported by Verizon and other commercial vendors.
FirstView A commercial video surveillance and camera management system sold by Smiths Detection-LiveWave.
Furuno Electric Co, LTD. A supplier of marine electronics systems, particularly ARPA radar systems to be used by the MMFPP Contact/Sensor Management System
Information Block A window with independent controls usually raised (put on screen) by a larger application. Also called ‘Dialog’.
Java A popular, modern computer programming language most notable for its portability between different computer architectures (including Windows, Linux, Macintosh, and many Unix systems). Both the existing Smiths Detection and Sonalysts software are written in Java.
Java Repaint An internal feature of a Java program in which one software component requests that a Java user interface component update its graphical display. A repaint is often used as a mechanism for background processes to notify the user interface of changes to the information it displays.
Java Database Connectivity (JDBC)
An industry standard Java interface for establishing connectivity and query capability with database implementations.
Kiosk-Style Display A Console-Style Display with limited user interface functions (usually no keyboard or mouse). Variations of the terms “kiosk display” and “console display” are often used interchangeably.
Chart Interface Software modules contributed by Sonalysts to provide mapping, user interactions, and contact display.
Heading Up Indicates that the chart display is rotated so that the heading of the reference vessel is shown pointing upward.
E-6
Term Description MARSEC Marine Security A U.S. Coast Guard system providing three-tiered security levels. Maritime Mobile Service Identity (MMSI)
A nine-digit self-identification code transmitted by vessels when operating Automatic Identification Systems (AIS). Each vessel is assigned a code value.
MySQL An open-source relational database management system, officially pronounced “my skwel”, but more commonly as “my sequel”.
North Up Indicates that the chart display is rotated to the standard orientation of the source chart product used for the backdrop, typically with North oriented upward.
Raster Navigational Charts (RNC)
A NOAA data product giving nautical charts in a raster (image) format.
Repaint See “Java Repaint” Reference Vessel The vessel used to provide a position defining the area of interest for the
chart display. The chart is drawn centered on the reference vessel. ShapeFile An industry-standard data format for the representation of map data in a
vector form. Tactical Elements Graphics elements used to represent tactical information on the display.
Typically maritime contacts - vessels, buoys, etc. TrackableContext A Sonalysts software package used to represent metadata and definitions
graphics elements. The TrackableContext provides the core functionality for permitting the user to interact with the Tactical Elements.
Acronyms and Abbreviations Acronym Description AIS Automatic Identification System ARPA Automatic Radar Plotting Aid API Application Programming Interface COTS Commercial Off-the-Shelf CPA Closest Point of Approach DWC Dispatch Weather Client (Sonalysts software) ECDIS Electronic Chart Display and Information System ENC Electronic Navigational Chart EVDO Evolution-Data Optimized (wireless telecommunications standard). Sometimes
written EV-DO. FOV Field of View (for cameras) GIS Geographic Information System GPS Global Positioning System HVU High Value Unit IHO International Hydrographic Organization IMO International Maritime Organization JDBC Java Database Connectivity MARSEC Marine Security MMFPP Maritime Mobile Force Protection Program MMSI Maritime Mobile Service Identity (an AIS identification code) NOAA National Oceanic and Atmospheric Administration NSMRL Naval Submarine Medical Research Laboratory, Groton CT. NTDS Naval Tactical Data System PTZ Pan-Tilt-Zoom (for remotely operated cameras) RADAR RAdio Detection And Ranging RNC Raster Navigational Chart SDD Software Design Document
E-7
Acronym Description SRS Software Requirements Specification UI User Interface VHF Very High Frequency
References Electronic Navigational Charts: NOAA ENCs, National Oceanic and Atmospheric Administration, http://www.nauticalcharts.noaa.gov/mcd/enc/index.htm. Accessed Dec 2008. FirstView Enterprise Server – Command and Control System for Sensor Integration and Management, Smiths Detection-LiveWave Technical Document, 29 Oct 2008. Javadoc for LiveWave Prototype, Smiths Detection-LiveWave, Provided Dec 2008. Maritime Mobile Force Protection Program (MMFPP) Software Requirements Specification, Sonalysts, Inc, 7 January 2009. Maritime navigation and radiocommunication equipment and systems – Presentation of navigation-related information on shipborne navigational displays (IEC 80/492/CDV:2007), (DIN EN 62288:2008-1), DIN Deutsches Institut für Normung, e.V. English version prEN 622 Raster Navigational Charts: NOAA RNCs, National Oceanic and Atmospheric Administration, http://www.nauticalcharts.noaa.gov/mcd/Raster/index.htm. Accessed Dec 2008. Recommendation ITU-R M.1371-2, Technical characteristics for a universal shipborne automatic identification system using time division multiple access in the VHF maritime mobile band, International Telecommunications Union/ITU Radiocommunication Sector, 3 June 2007.
System Overview The MMFPP provides a nautical chart display onto which the program plots contacts, escort group vessels, and own-ship position. Tactical data is obtained through the use of back-end systems that ingest ARPA radar information, AIS position reports, and own-ship GPS information. To maximize the use of screen real estate, the program maintains a console style display. In this mode, the program claims the entire screen for the chart display. The chart is shown without window decorations or other computer operating system related controls. For the purpose of discussion, a conceptual mockup of the display layout and controls is shown in Figure E1. While the figure gives an approximate representation of the design of the display, some details will be refined in the implementation phase. For example, the icons used for control elements will be replaced with appropriate artwork, full color imagery will be used for the display, and the symbols for displaying tactical data will be enhanced.

E-8
Figure E1 – Conceptual mockup of display (icon design, size, and placement are subject to change)
Chart Display and User Interface The features shown on the chart-based display shown in Figure E1 consists of two general categories:
Tactical Display Elements (including camera placement) Control Elements
Both sets of features support touch-based interactions with the user. The Tactical Display Elements provide information about shipping traffic, including both the Escort Group and other vessels. They also include representations of camera placement and orientation. The Control Elements include icons that serve as control buttons, allowing the user to adjust the display and invoke various display functions. Details of these two general feature sets follow below. In the figure above, the chart is oriented to its standard North/South orientation, but that orientation can also be tied to the heading of the reference vessel. The selection of a reference vessel is established in the pre-departure configuration elements of the program and can be either the HVU or Escort Command vessel. When the chart is configured to the standard North/South orientation, it is said to be in “North Up” orientation. When it is tied to the heading of the reference vessel, it is said to be in “Heading Up” orientation. A control on the touch-based user interface allows the user to toggle between orientation options.
Tactical Display Elements The Tactical Display Elements represent shipping and sensors. The placement and orientation of symbols and mark up data is derived from real-time, real-world information sources. The user may select individual Tactical Display Elements by touching the screen position at which the element of interest is located.
E-9
In the scenario shown in Figure E1, the HVU is moving steadily at heading 175º. Its course and relative speed are represented by a direction vector drawn to the head of the vessel. Based on the direction vector for Escort Command, it is apparent that the vessel is matching the HVU’s course and speed. Contact R1 is moving toward the HVU. The direction vector for the contact vector is roughly twice as long as that for the HVU, indicating that is moving twice as fast as the HVU and Escort Command vessels. A short indicator line drawn at the end of the direction vector indicates that Contact R1 is turning to its starboard. Patrol is moving to block Contact R1 and prevent it from moving too close to the HVU. The ellipse shown around the HVU represents the HVU Exclusion Zone. Figure E1 also shows a depiction of a sensor labeled “Camera 3”. The symbol shows the position and orientation of the camera.
Selection Functions for Tactical Display Elements When the user touches and selects a Tactical Display Element, the program performs the following functions:
The Tactical Element is redrawn in a “highlighted” state emphasizing that it is selected. Additional graphical mark ups are added to provide data for the element. For tactical elements,
this includes prior track data (if available). For the camera, this includes a Field Of View (FOV) indicator based on camera orientation and angle of view (if available).
A text block is presented giving information about the element. For vessels, this includes MMSI, name and dimensions (if available), position, course, heading, speed, bearing and range to HVU (if appropriate), CPA to HVU (time of CPA, range of CPA), closing speed to HVU, etc. For cameras, this includes camera type, status, FOV information, and other data as available.
In addition to the elements listed above, the text block also provides a control button allowing the user to perform functions related to the element:
Contacts Designate contact as “Contact of Interest”. A contact of interest is drawn with emphasized graphics attributes (see User Interface section below).
Cameras Raise a dialog window showing a live video feed from the selected camera.
Symbols for Vessel Display Symbols for the display of vessels in the MMFPP are based on conventions established for AIS systems in the standards cited in the References section above (see Maritime navigation and radiocommunication equipment and systems – Presentation of navigation-related information on shipborne navigational displays). The chart shown in the conceptual mock up figure above is of sufficiently large a scale that the HVU and Escort vessels can be shown scaled to their relative size. The symbols used to show these vessels are referred to as depictive symbols because they show a scaled depiction of the general outline of the vessels. In the figure, both the Patrol and Contact R1 vessels are shown using a non-depictive symbol. Non-depictive symbols are used in cases where the vessel dimensions are unavailable or where the vessel is too small to be shown using a depictive symbol at the selected chart scale. Data supplying dimensions for vessels is obtained in two ways. For vessels in the Escort Group, dimensions can be specified as part of the MMFPP’s pre-deployment configuration. For other vessels, dimensions can be obtained via the Type-5 message in the AIS data feed which supplies length, beam, draft, position of GPS (distance from bow) and vessel name.
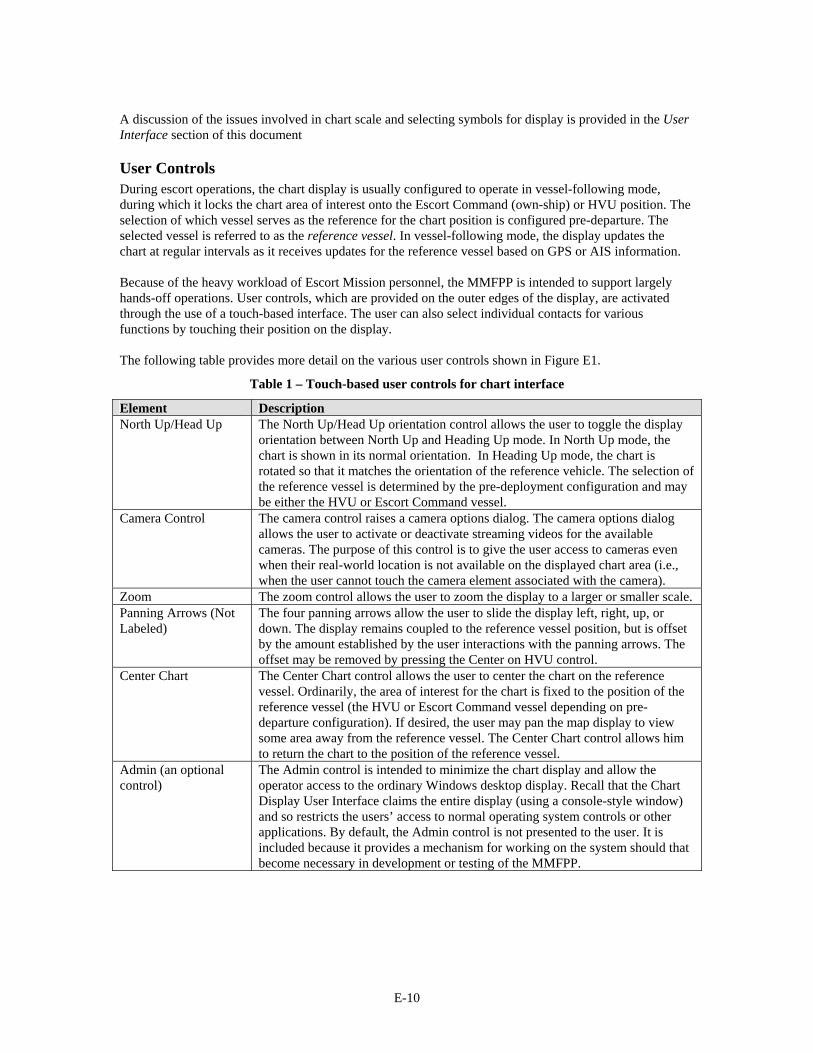
E-10
A discussion of the issues involved in chart scale and selecting symbols for display is provided in the User Interface section of this document
User Controls During escort operations, the chart display is usually configured to operate in vessel-following mode, during which it locks the chart area of interest onto the Escort Command (own-ship) or HVU position. The selection of which vessel serves as the reference for the chart position is configured pre-departure. The selected vessel is referred to as the reference vessel. In vessel-following mode, the display updates the chart at regular intervals as it receives updates for the reference vessel based on GPS or AIS information. Because of the heavy workload of Escort Mission personnel, the MMFPP is intended to support largely hands-off operations. User controls, which are provided on the outer edges of the display, are activated through the use of a touch-based interface. The user can also select individual contacts for various functions by touching their position on the display. The following table provides more detail on the various user controls shown in Figure E1.
Table 1 – Touch-based user controls for chart interface
Element Description North Up/Head Up The North Up/Head Up orientation control allows the user to toggle the display
orientation between North Up and Heading Up mode. In North Up mode, the chart is shown in its normal orientation. In Heading Up mode, the chart is rotated so that it matches the orientation of the reference vehicle. The selection of the reference vessel is determined by the pre-deployment configuration and may be either the HVU or Escort Command vessel.
Camera Control The camera control raises a camera options dialog. The camera options dialog allows the user to activate or deactivate streaming videos for the available cameras. The purpose of this control is to give the user access to cameras even when their real-world location is not available on the displayed chart area (i.e., when the user cannot touch the camera element associated with the camera).
Zoom The zoom control allows the user to zoom the display to a larger or smaller scale. Panning Arrows (Not Labeled)
The four panning arrows allow the user to slide the display left, right, up, or down. The display remains coupled to the reference vessel position, but is offset by the amount established by the user interactions with the panning arrows. The offset may be removed by pressing the Center on HVU control.
Center Chart The Center Chart control allows the user to center the chart on the reference vessel. Ordinarily, the area of interest for the chart is fixed to the position of the reference vessel (the HVU or Escort Command vessel depending on pre-departure configuration). If desired, the user may pan the map display to view some area away from the reference vessel. The Center Chart control allows him to return the chart to the position of the reference vessel.
Admin (an optional control)
The Admin control is intended to minimize the chart display and allow the operator access to the ordinary Windows desktop display. Recall that the Chart Display User Interface claims the entire display (using a console-style window) and so restricts the users’ access to normal operating system controls or other applications. By default, the Admin control is not presented to the user. It is included because it provides a mechanism for working on the system should that become necessary in development or testing of the MMFPP.
E-11
Back-End Processing of Real-World Data Tactical data for the MMFPP program is supplied via back-end processing systems developed by Smiths Detection/LiveWave. Radar, AIS, and GPS information gathered by these processors is conveyed to the MMFPP charting and display systems via a software Application Program Interface (API) provided by Smiths Detection.
Pre-Underway Configuration Because the MMFPP depends on information derived from real-world data sources, information about the Escort Group and HVU must be supplied prior to escort mission underway. All vessels in the Escort Group are expected to operate AIS systems, which serve as the source of position data during escort operations. In order to recognize the data for these vessels (which may change from escort mission to escort mission), the MMFPP must be configured with the MMSI codes for the vessels in the Escort Group, including the HVU. Data for these values may be supplied through configuration files or a user interface that operates separately from the chart interface.
Design Considerations The fundamental design considerations for the MMFPP are established in the Software Requirements Specification (SRS) for the system. This section provides a brief overview of some of the major design considerations described in the SRS. These considerations are reflected in the design discussion to follow in the remainder of this SDD. Proof-of-Concept The MMFPP is to provide a proof-of-concept for demonstrating opportunities
to apply human performance and factors analysis to the design of software systems for joint U.S. Coast Guard and U.S. Navy Escort operations.
Explore Human Factors Issues
The MMFPP is intended to help explore the issues related to human factors in a joint escort system and stimulate further research into the area. In a sense, it is to serve as a “brain-storming” tool for future user interface design.
Workload Restrictions The Patrol Commander operates under a full workload and can spare only minimal attention to the operation of the MMFPP. The program must operate in a largely hands-off mode.
Access to Data for Command-and-Control Decisions
The MMFPP is intended to give the Patrol Commander and other personnel access to data in support of command-and-control decisions. In some cases, no other channel for access to such data currently exists.
Architecture
Overview This section provides a brief description of the overall organization of the software to be implemented for the MMFPP. It identifies the major software components and describes the general flow of information and control through the system. Figure E2 shows the relationships between the user, the software components, and the back-end systems processing real-world data. The MMFPP is a multi-threaded application, and all the major software modules shown as blocks in the figure operate one or more background threads. External processor systems are shown using server icons. A brief discussion of individual software modules follows.
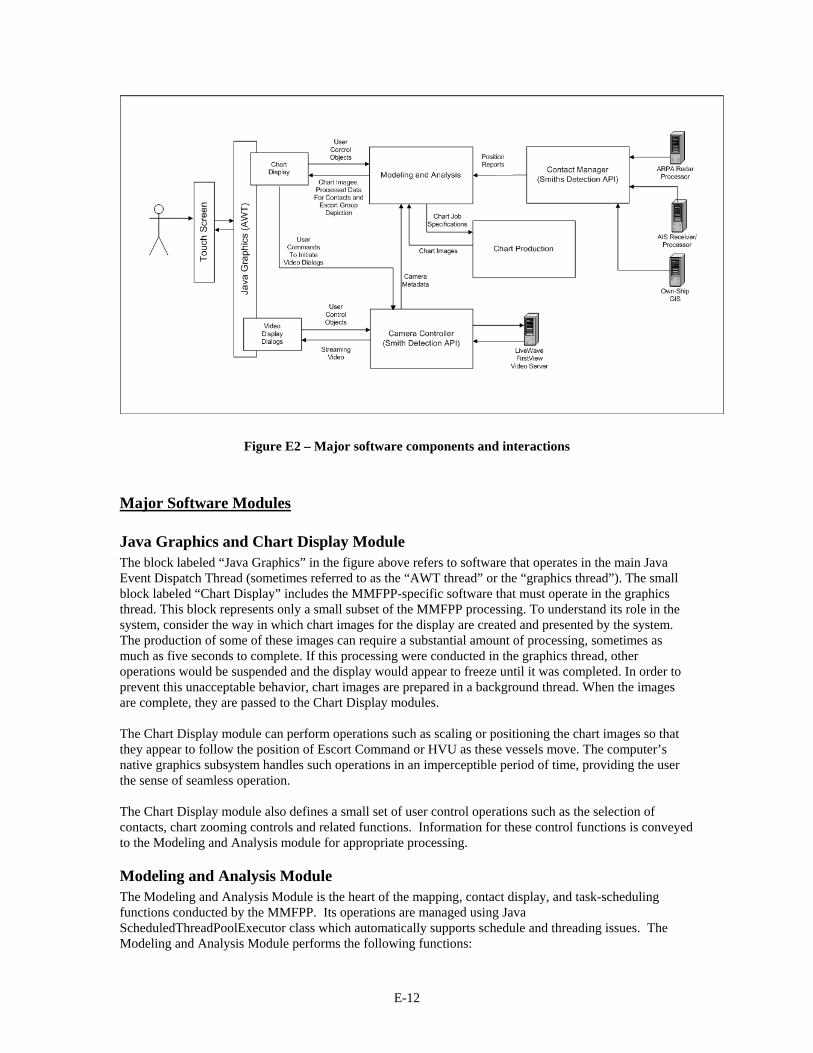
E-12
Figure E2 – Major software components and interactions
Major Software Modules
Java Graphics and Chart Display Module The block labeled “Java Graphics” in the figure above refers to software that operates in the main Java Event Dispatch Thread (sometimes referred to as the “AWT thread” or the “graphics thread”). The small block labeled “Chart Display” includes the MMFPP-specific software that must operate in the graphics thread. This block represents only a small subset of the MMFPP processing. To understand its role in the system, consider the way in which chart images for the display are created and presented by the system. The production of some of these images can require a substantial amount of processing, sometimes as much as five seconds to complete. If this processing were conducted in the graphics thread, other operations would be suspended and the display would appear to freeze until it was completed. In order to prevent this unacceptable behavior, chart images are prepared in a background thread. When the images are complete, they are passed to the Chart Display modules. The Chart Display module can perform operations such as scaling or positioning the chart images so that they appear to follow the position of Escort Command or HVU as these vessels move. The computer’s native graphics subsystem handles such operations in an imperceptible period of time, providing the user the sense of seamless operation. The Chart Display module also defines a small set of user control operations such as the selection of contacts, chart zooming controls and related functions. Information for these control functions is conveyed to the Modeling and Analysis module for appropriate processing.
Modeling and Analysis Module The Modeling and Analysis Module is the heart of the mapping, contact display, and task-scheduling functions conducted by the MMFPP. Its operations are managed using Java ScheduledThreadPoolExecutor class which automatically supports schedule and threading issues. The Modeling and Analysis Module performs the following functions:
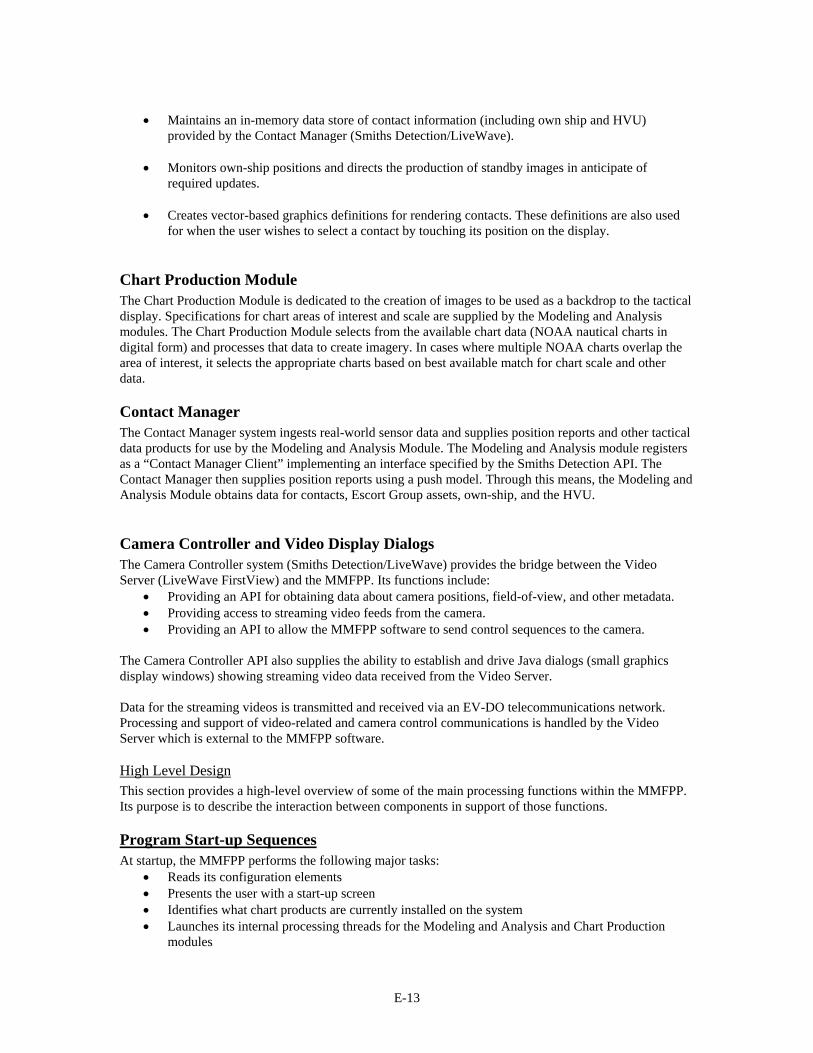
E-13
Maintains an in-memory data store of contact information (including own ship and HVU)
provided by the Contact Manager (Smiths Detection/LiveWave). Monitors own-ship positions and directs the production of standby images in anticipate of
required updates.
Creates vector-based graphics definitions for rendering contacts. These definitions are also used for when the user wishes to select a contact by touching its position on the display.
Chart Production Module The Chart Production Module is dedicated to the creation of images to be used as a backdrop to the tactical display. Specifications for chart areas of interest and scale are supplied by the Modeling and Analysis modules. The Chart Production Module selects from the available chart data (NOAA nautical charts in digital form) and processes that data to create imagery. In cases where multiple NOAA charts overlap the area of interest, it selects the appropriate charts based on best available match for chart scale and other data.
Contact Manager The Contact Manager system ingests real-world sensor data and supplies position reports and other tactical data products for use by the Modeling and Analysis Module. The Modeling and Analysis module registers as a “Contact Manager Client” implementing an interface specified by the Smiths Detection API. The Contact Manager then supplies position reports using a push model. Through this means, the Modeling and Analysis Module obtains data for contacts, Escort Group assets, own-ship, and the HVU.
Camera Controller and Video Display Dialogs The Camera Controller system (Smiths Detection/LiveWave) provides the bridge between the Video Server (LiveWave FirstView) and the MMFPP. Its functions include:
Providing an API for obtaining data about camera positions, field-of-view, and other metadata. Providing access to streaming video feeds from the camera. Providing an API to allow the MMFPP software to send control sequences to the camera.
The Camera Controller API also supplies the ability to establish and drive Java dialogs (small graphics display windows) showing streaming video data received from the Video Server. Data for the streaming videos is transmitted and received via an EV-DO telecommunications network. Processing and support of video-related and camera control communications is handled by the Video Server which is external to the MMFPP software.
High Level Design This section provides a high-level overview of some of the main processing functions within the MMFPP. Its purpose is to describe the interaction between components in support of those functions.
Program Start-up Sequences At startup, the MMFPP performs the following major tasks:
Reads its configuration elements Presents the user with a start-up screen Identifies what chart products are currently installed on the system Launches its internal processing threads for the Modeling and Analysis and Chart Production
modules
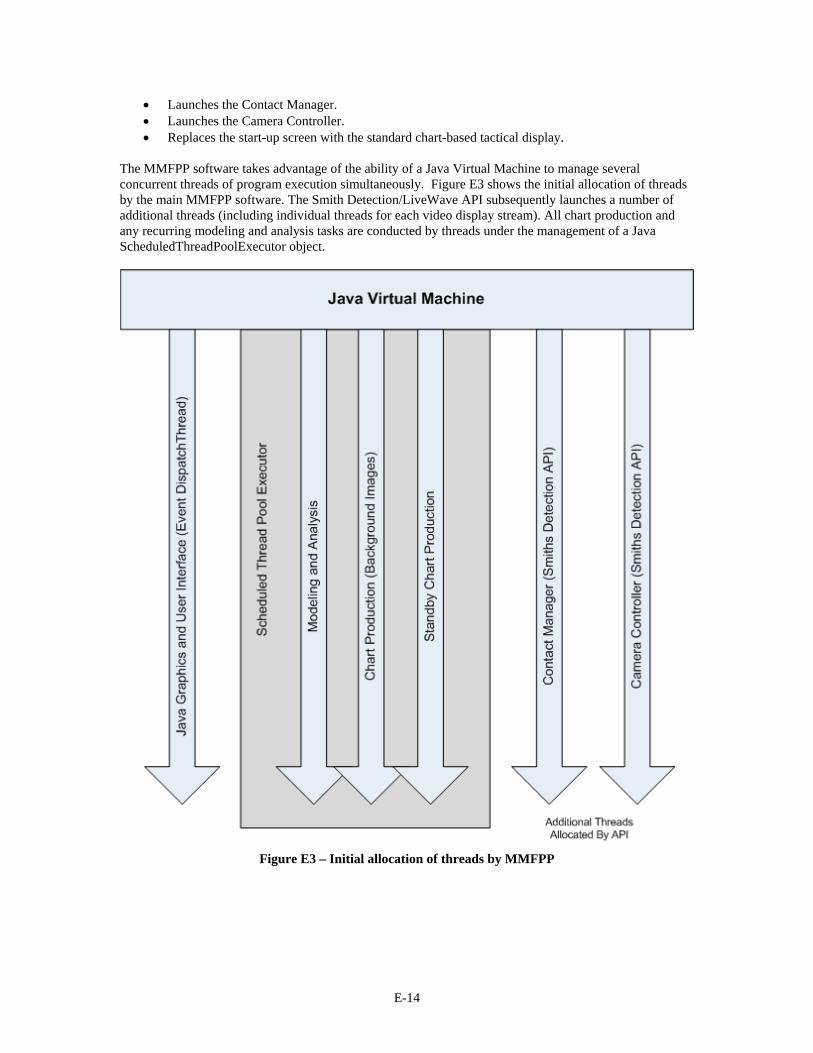
E-14
Launches the Contact Manager. Launches the Camera Controller. Replaces the start-up screen with the standard chart-based tactical display.
The MMFPP software takes advantage of the ability of a Java Virtual Machine to manage several concurrent threads of program execution simultaneously. Figure E3 shows the initial allocation of threads by the main MMFPP software. The Smith Detection/LiveWave API subsequently launches a number of additional threads (including individual threads for each video display stream). All chart production and any recurring modeling and analysis tasks are conducted by threads under the management of a Java ScheduledThreadPoolExecutor object.
Figure E3 – Initial allocation of threads by MMFPP
E-15
Communications between Modules
Contact Manager Sends Data to Modeling and Analysis Module The Contact Manager is the sole source of tactical data for own-ship position (Escort Command), the HVU (via AIS information), Escort Group assets, and other contacts. The Contact Manager provides data to the Modeling and Analysis Module through an event model. In this model, a module that wishes to receive tactical data registers a listener object with the Contact Manager. The listener object implements the interface com.livewave.navy.prototype.contacts.IPositionReport which specifies two methods: addPositionReport(PositionReport posReport); removePositonReport(String sensor, String contactName); When the Contact Manager determines that new data is available, it invokes the appropriate method from the IPositionReport interface and passes the data to the object that was registered as a listener. The Contact Manager operates in its own separate thread. The listener code will also operate within that thread, but must pass the data to the Modeling and Analysis Module which operates in a second thread. This transmission is made through a synchronous method call. It is important that this transmission occur quickly. If it were to block the Contact Manager thread for any significant period of time, system performance could be compromised or degraded.
Modeling and Analysis Supplies Tactical Data to Chart Display The Modeling and Analysis module uses information from the Contact Manager to develop graphics elements for the tactical display. This process involves the following steps:
Maintain an in-memory data store of recent (last 15 minutes) position data received from the Contact Manager (asynchronous, driven by inputs from the Contact Manager).
Perform periodic (scheduled) numerical modeling of contact data (if the model determines that a new chart background image is required, it performs operations described below). Numerical modeling is processed every five seconds.
Create graphics primitives for the rendering of the contact information (using Sonalysts’ TrackableContext API).
Signal the Chart Display module that new information is available (using a call to the Java repaint method on the main Chart Display window object).
When the Chart Display window object receives the repaint, it obtains the TrackableContext (and chart background) image from the Modeling and Analysts Module using a synchronized API.
Modeling and Analysis Requests a New Chart Background Image Based on the results of its numerical modeling, the Modeling and Analysis Module determines when new background images are required. New images are required when the motion of the HVU or Escort Command vessel results in a change to the area-of-interest to be displayed on the chart. If the change is sufficiently large that the previously existing charts would be inadequate to cover the area of interest, the Module determines what chart is needed and issues a request to the Chart Production modules to produce new imagery.
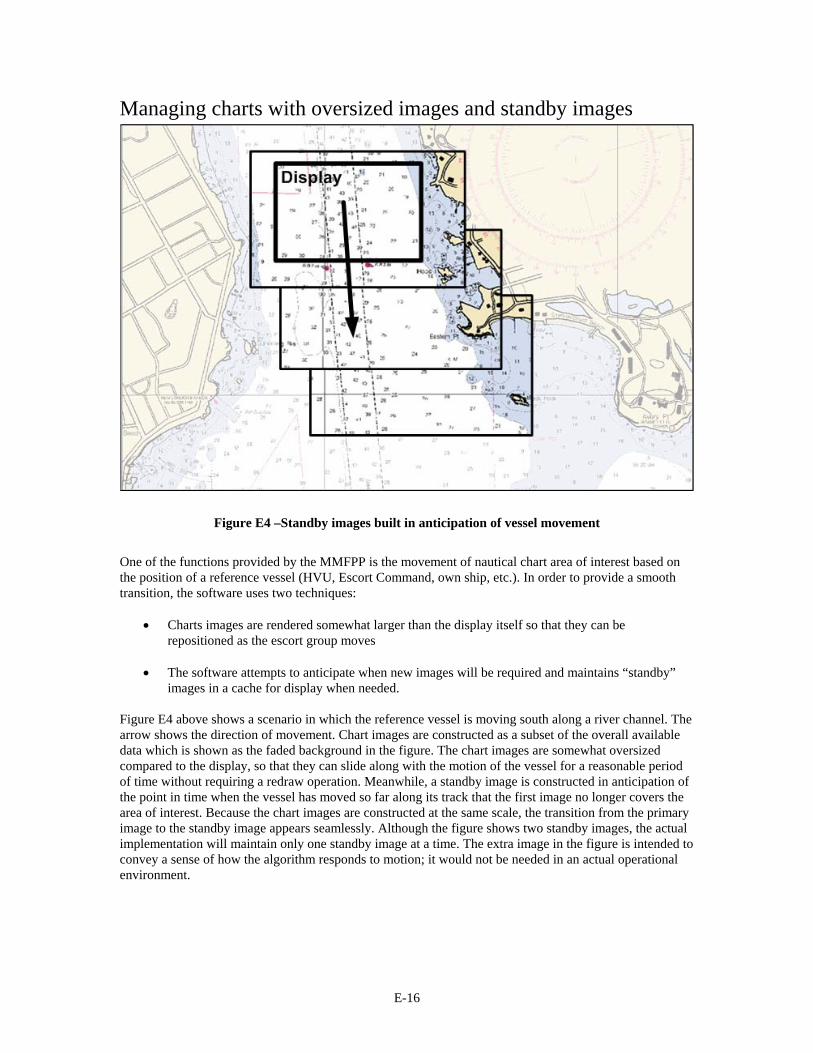
E-16
Managing charts with oversized images and standby images
Figure E4 –Standby images built in anticipation of vessel movement
One of the functions provided by the MMFPP is the movement of nautical chart area of interest based on the position of a reference vessel (HVU, Escort Command, own ship, etc.). In order to provide a smooth transition, the software uses two techniques:
Charts images are rendered somewhat larger than the display itself so that they can be repositioned as the escort group moves
The software attempts to anticipate when new images will be required and maintains “standby”
images in a cache for display when needed. Figure E4 above shows a scenario in which the reference vessel is moving south along a river channel. The arrow shows the direction of movement. Chart images are constructed as a subset of the overall available data which is shown as the faded background in the figure. The chart images are somewhat oversized compared to the display, so that they can slide along with the motion of the vessel for a reasonable period of time without requiring a redraw operation. Meanwhile, a standby image is constructed in anticipation of the point in time when the vessel has moved so far along its track that the first image no longer covers the area of interest. Because the chart images are constructed at the same scale, the transition from the primary image to the standby image appears seamlessly. Although the figure shows two standby images, the actual implementation will maintain only one standby image at a time. The extra image in the figure is intended to convey a sense of how the algorithm responds to motion; it would not be needed in an actual operational environment.

E-17
User Interaction on Chart Display Selects Camera or Tactical Element (signal to Modeling and Analysis)
The TrackableContext elements provided to the Chart Display allow the user to select a contact or camera on the display. When the user touches a contact, the Chart Display notifies the Modeling and Analysis module of the user’s touch. The Modeling and Analysis Module then updates the TrackableContext with elements that render that contact with enlarged and more prominent graphics elements. It also creates a text block describing the current data values (course, speed, position, bearing and range from HVU, CPA to HVU) for the contact. The text block also features an additional control element which appears as a button within the text block. If the user has selected a contact, the button is used to designate the contact as a “contact of interest”. If the contact is already a contact of interest, the button is used to restore it to standard status (so that it is no longer treated as a contact of interest). If the user has selected a camera symbol, the button provides a way of enabling a streaming-video dialog for the display of surveillance data from the camera. If the user touches a neutral area of the display (one with no other contact data or controls), the program will remove the text block and revert the display of the contact to its standard mode. After a configurable period of time without further user interaction, the Modeling and Analysis module signals the Chart Display to remove the text block and restore the depiction of the contact to its standard “non-selected” model. Note that most of the business logic for this operation is resident within the Modeling and Analysis Module. The reason for this design decision is that tactical data continues to change and update while the user-selected contact is being displayed. Thus the display elements, including the text block, need to be rebuilt to stay current with the changing tactical scenario. Because the information to do so is resident in the Modeling and Analysis Module, but not the Chart Display, the Modeling and Analysis Module must perform the work required to update the display elements.
Modeling and Analysis Communications with Camera Controller When the user selects a camera object and the Chart Display relays the touch information to the Modeling and Analysis module as described above, the Modeling and Analysis Module requests Field of View and related information from the Camera Controller. The Field of View information is used to determine a camera-coverage area which is displayed on the chart while the camera remains selected. The Camera Controller object also provides an API to permit the Modeling and Analysis Module to request the launch of a streaming-video dialog as described above.
User Interaction with Video Display Dialogs The Smiths Detection/LiveWave software handles all interactions with the video display dialogs based on the API supplied for the MMFPP.
Low-Level Design This section provides low-level design information for selected elements of the MMFPP chart-based user interface and supporting system.
Directory Structure for MMFPP User Interface Resources The MMFPP User Interface requires a certain number of resources that are not bundled directly with application jar files. These external resources will be stored in the path:
c:/MMFPP/UserInterface
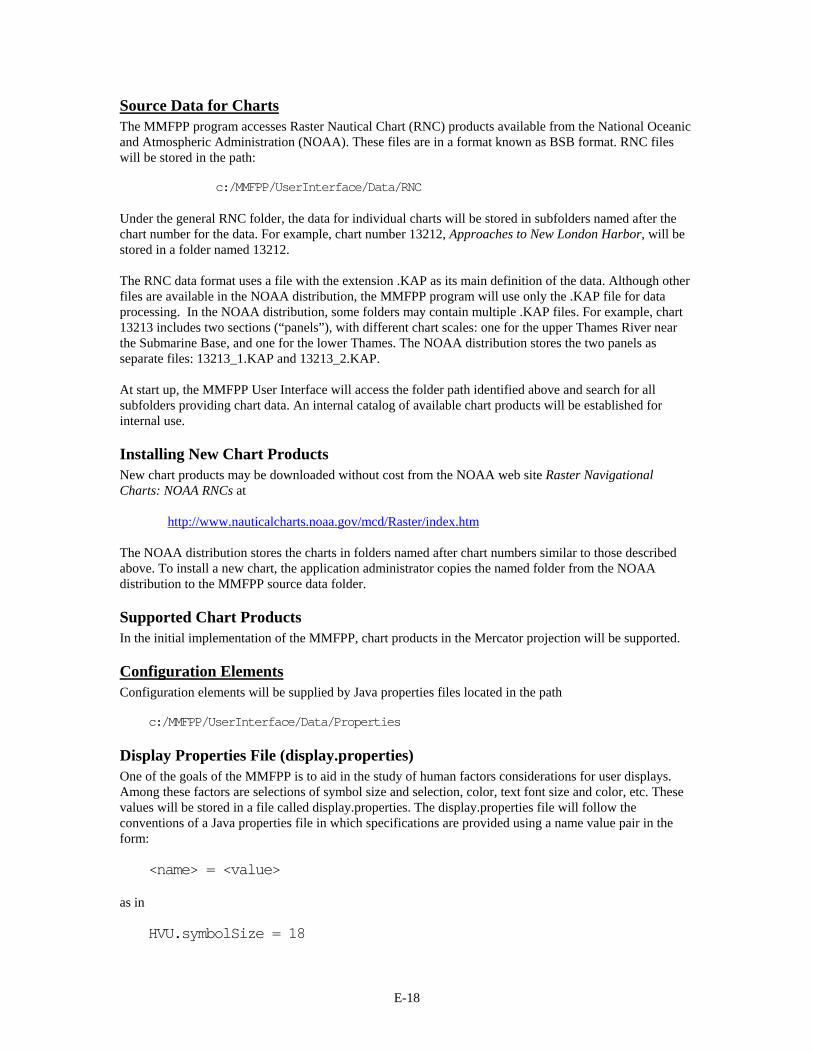
E-18
Source Data for Charts The MMFPP program accesses Raster Nautical Chart (RNC) products available from the National Oceanic and Atmospheric Administration (NOAA). These files are in a format known as BSB format. RNC files will be stored in the path:
c:/MMFPP/UserInterface/Data/RNC Under the general RNC folder, the data for individual charts will be stored in subfolders named after the chart number for the data. For example, chart number 13212, Approaches to New London Harbor, will be stored in a folder named 13212. The RNC data format uses a file with the extension .KAP as its main definition of the data. Although other files are available in the NOAA distribution, the MMFPP program will use only the .KAP file for data processing. In the NOAA distribution, some folders may contain multiple .KAP files. For example, chart 13213 includes two sections (“panels”), with different chart scales: one for the upper Thames River near the Submarine Base, and one for the lower Thames. The NOAA distribution stores the two panels as separate files: 13213_1.KAP and 13213_2.KAP. At start up, the MMFPP User Interface will access the folder path identified above and search for all subfolders providing chart data. An internal catalog of available chart products will be established for internal use.
Installing New Chart Products New chart products may be downloaded without cost from the NOAA web site Raster Navigational Charts: NOAA RNCs at http://www.nauticalcharts.noaa.gov/mcd/Raster/index.htm The NOAA distribution stores the charts in folders named after chart numbers similar to those described above. To install a new chart, the application administrator copies the named folder from the NOAA distribution to the MMFPP source data folder.
Supported Chart Products In the initial implementation of the MMFPP, chart products in the Mercator projection will be supported.
Configuration Elements Configuration elements will be supplied by Java properties files located in the path
c:/MMFPP/UserInterface/Data/Properties
Display Properties File (display.properties) One of the goals of the MMFPP is to aid in the study of human factors considerations for user displays. Among these factors are selections of symbol size and selection, color, text font size and color, etc. These values will be stored in a file called display.properties. The display.properties file will follow the conventions of a Java properties file in which specifications are provided using a name value pair in the form:
<name> = <value> as in
HVU.symbolSize = 18
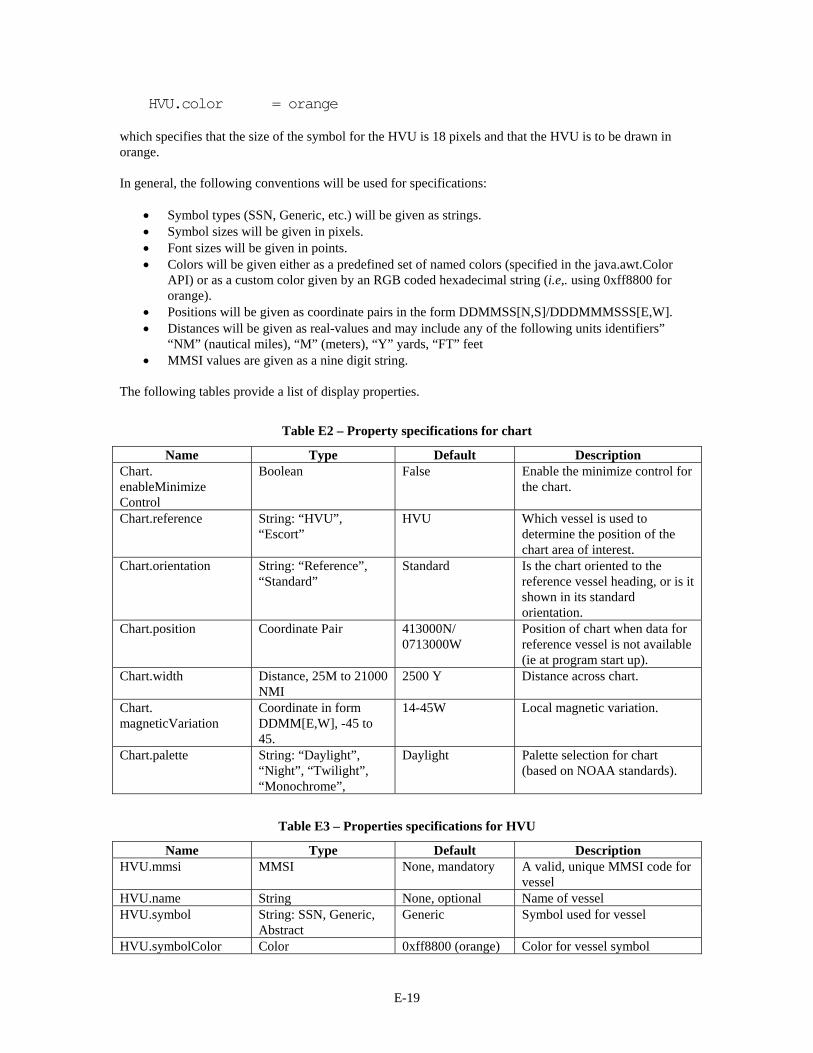
E-19
HVU.color = orange which specifies that the size of the symbol for the HVU is 18 pixels and that the HVU is to be drawn in orange. In general, the following conventions will be used for specifications:
Symbol types (SSN, Generic, etc.) will be given as strings. Symbol sizes will be given in pixels. Font sizes will be given in points. Colors will be given either as a predefined set of named colors (specified in the java.awt.Color
API) or as a custom color given by an RGB coded hexadecimal string (i.e,. using 0xff8800 for orange).
Positions will be given as coordinate pairs in the form DDMMSS[N,S]/DDDMMMSSS[E,W]. Distances will be given as real-values and may include any of the following units identifiers”
“NM” (nautical miles), “M” (meters), “Y” yards, “FT” feet MMSI values are given as a nine digit string.
The following tables provide a list of display properties.
Table E2 – Property specifications for chart
Name Type Default Description Chart. enableMinimize Control
Boolean False Enable the minimize control for the chart.
Chart.reference String: “HVU”, “Escort”
HVU Which vessel is used to determine the position of the chart area of interest.
Chart.orientation String: “Reference”, “Standard”
Standard Is the chart oriented to the reference vessel heading, or is it shown in its standard orientation.
Chart.position Coordinate Pair 413000N/ 0713000W
Position of chart when data for reference vessel is not available (ie at program start up).
Chart.width Distance, 25M to 21000 NMI
2500 Y Distance across chart.
Chart. magneticVariation
Coordinate in form DDMM[E,W], -45 to 45.
14-45W Local magnetic variation.
Chart.palette String: “Daylight”, “Night”, “Twilight”, “Monochrome”,
Daylight Palette selection for chart (based on NOAA standards).
Table E3 – Properties specifications for HVU
Name Type Default Description HVU.mmsi MMSI None, mandatory A valid, unique MMSI code for
vessel HVU.name String None, optional Name of vessel HVU.symbol String: SSN, Generic,
Abstract Generic Symbol used for vessel
HVU.symbolColor Color 0xff8800 (orange) Color for vessel symbol
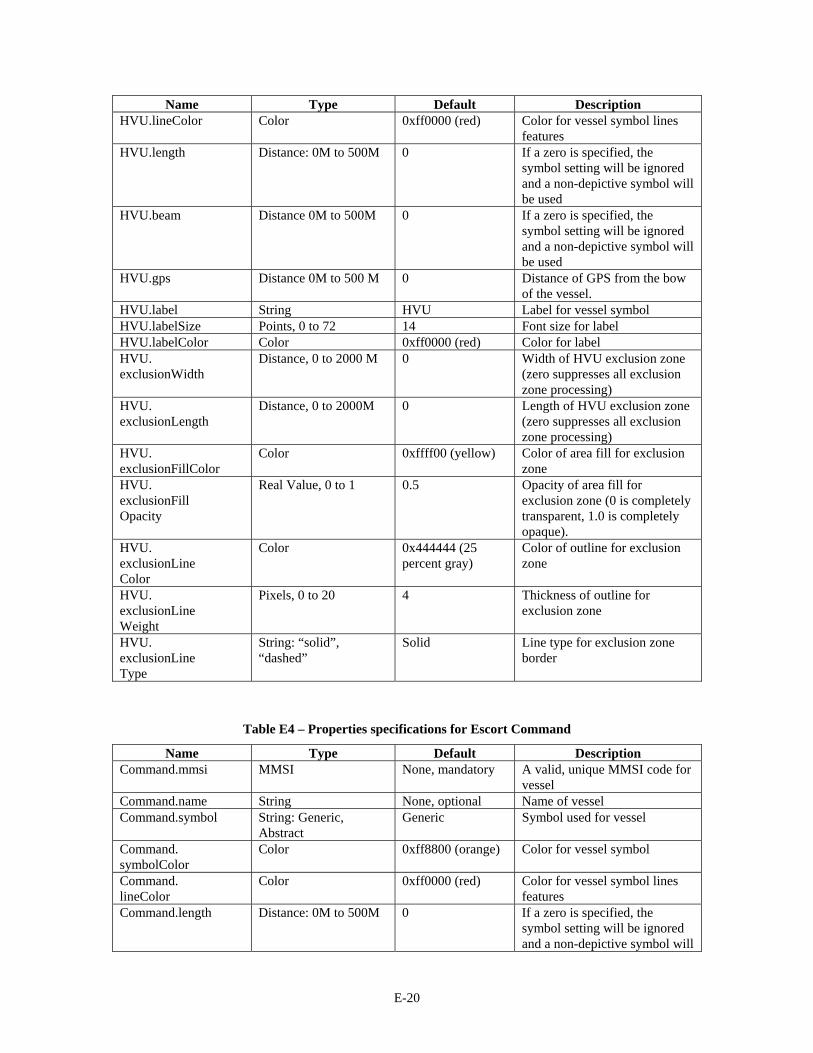
E-20
Name Type Default Description HVU.lineColor Color 0xff0000 (red) Color for vessel symbol lines
features HVU.length Distance: 0M to 500M 0 If a zero is specified, the
symbol setting will be ignored and a non-depictive symbol will be used
HVU.beam Distance 0M to 500M 0 If a zero is specified, the symbol setting will be ignored and a non-depictive symbol will be used
HVU.gps Distance 0M to 500 M 0 Distance of GPS from the bow of the vessel.
HVU.label String HVU Label for vessel symbol HVU.labelSize Points, 0 to 72 14 Font size for label HVU.labelColor Color 0xff0000 (red) Color for label HVU. exclusionWidth
Distance, 0 to 2000 M 0 Width of HVU exclusion zone (zero suppresses all exclusion zone processing)
HVU. exclusionLength
Distance, 0 to 2000M 0 Length of HVU exclusion zone (zero suppresses all exclusion zone processing)
HVU. exclusionFillColor
Color 0xffff00 (yellow) Color of area fill for exclusion zone
HVU. exclusionFill Opacity
Real Value, 0 to 1 0.5 Opacity of area fill for exclusion zone (0 is completely transparent, 1.0 is completely opaque).
HVU. exclusionLine Color
Color 0x444444 (25 percent gray)
Color of outline for exclusion zone
HVU. exclusionLine Weight
Pixels, 0 to 20 4 Thickness of outline for exclusion zone
HVU. exclusionLine Type
String: “solid”, “dashed”
Solid Line type for exclusion zone border
Table E4 – Properties specifications for Escort Command
Name Type Default Description Command.mmsi MMSI None, mandatory A valid, unique MMSI code for
vessel Command.name String None, optional Name of vessel Command.symbol String: Generic,
Abstract Generic Symbol used for vessel
Command. symbolColor
Color 0xff8800 (orange) Color for vessel symbol
Command. lineColor
Color 0xff0000 (red) Color for vessel symbol lines features
Command.length Distance: 0M to 500M 0 If a zero is specified, the symbol setting will be ignored and a non-depictive symbol will
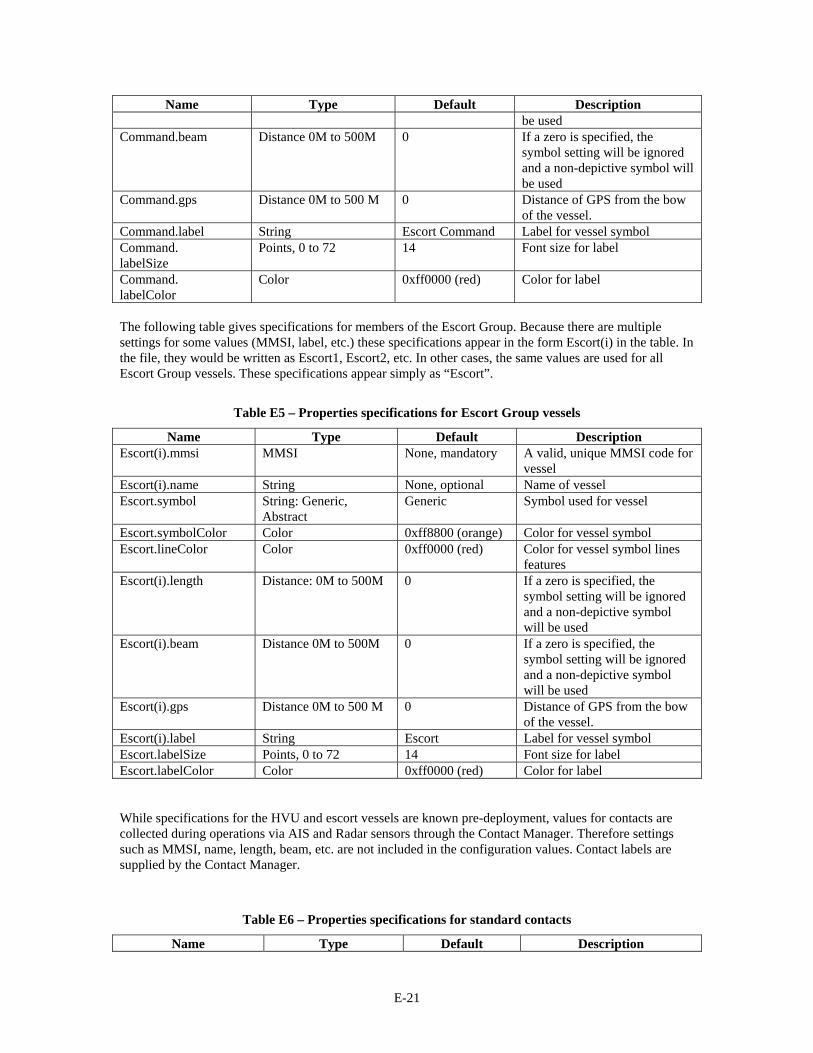
E-21
Name Type Default Description be used
Command.beam Distance 0M to 500M 0 If a zero is specified, the symbol setting will be ignored and a non-depictive symbol will be used
Command.gps Distance 0M to 500 M 0 Distance of GPS from the bow of the vessel.
Command.label String Escort Command Label for vessel symbol Command. labelSize
Points, 0 to 72 14 Font size for label
Command. labelColor
Color 0xff0000 (red) Color for label
The following table gives specifications for members of the Escort Group. Because there are multiple settings for some values (MMSI, label, etc.) these specifications appear in the form Escort(i) in the table. In the file, they would be written as Escort1, Escort2, etc. In other cases, the same values are used for all Escort Group vessels. These specifications appear simply as “Escort”.
Table E5 – Properties specifications for Escort Group vessels
Name Type Default Description Escort(i).mmsi MMSI None, mandatory A valid, unique MMSI code for
vessel Escort(i).name String None, optional Name of vessel Escort.symbol String: Generic,
Abstract Generic Symbol used for vessel
Escort.symbolColor Color 0xff8800 (orange) Color for vessel symbol Escort.lineColor Color 0xff0000 (red) Color for vessel symbol lines
features Escort(i).length Distance: 0M to 500M 0 If a zero is specified, the
symbol setting will be ignored and a non-depictive symbol will be used
Escort(i).beam Distance 0M to 500M 0 If a zero is specified, the symbol setting will be ignored and a non-depictive symbol will be used
Escort(i).gps Distance 0M to 500 M 0 Distance of GPS from the bow of the vessel.
Escort(i).label String Escort Label for vessel symbol Escort.labelSize Points, 0 to 72 14 Font size for label Escort.labelColor Color 0xff0000 (red) Color for label While specifications for the HVU and escort vessels are known pre-deployment, values for contacts are collected during operations via AIS and Radar sensors through the Contact Manager. Therefore settings such as MMSI, name, length, beam, etc. are not included in the configuration values. Contact labels are supplied by the Contact Manager.
Table E6 – Properties specifications for standard contacts
Name Type Default Description

E-22
Name Type Default Description Contact.symbol String: Generic,
Abstract Generic Symbol used for vessel
Contact.symbolColor Color 0xff8800 (orange) Color for vessel symbol Contact.lineColor Color 0xff0000 (red) Color for vessel symbol lines
features Contact.labelSize Points, 0 to 72 14 Font size for label Contact.labelColor Color 0xff0000 (red) Color for label Contact. symbolSize
Pixel, 5..50 10 Size of non-depictive symbol to be used for contact
Contacts may be designated contacts of interest by the user. Contacts of interest may be shown using different size and color settings to emphasize their status.
Table E7 – Properties specifications for Contact of Interest
Name Type Default Description ContactOfInterest. symbol
String: Generic, Abstract
Generic Symbol used for vessel
ContactOfInterest. symbolColor
Color 0xff8800 (orange) Color for vessel symbol
ContactOfInterest. lineColor
Color 0xff0000 (red) Color for vessel symbol lines features
ContactOfInterest. labelSize
Points, 0 to 72 18 Font size for label
ContactOfInterest. labelColor
Color 0xff0000 (red) Color for label
ContactOfInterest. symbolSize
Pixel, 5..50 14 Size of non-depictive symbol to be used for contact of interest
The tail feature shows the track of a vessel for a fixed period of time and allows the user to judge course and speed of the contact. Because tails are always shown in the vessel color, no color specification is included in this table.
Table E8 – Properties for general elements
Name Type Default Description
General. minDepictive SymbolSize
Pixels, 4 to 50 7 Minimum size of scaled beam for use of a depictive symbol
General. tacticalTouch Sensitivity
Integer (millisecods), 0 to 5000
500 Time of duration of user touch on display before system recognizes it as an activation for a tactical element. Note that the user interface would show the range “low” to “high” rather than a numeric value.
General. controlTouch Sensitivity
Integer (millisecods), 0 to 5000
1000 Time of duration of user touch on display before system recognizes it as an activation
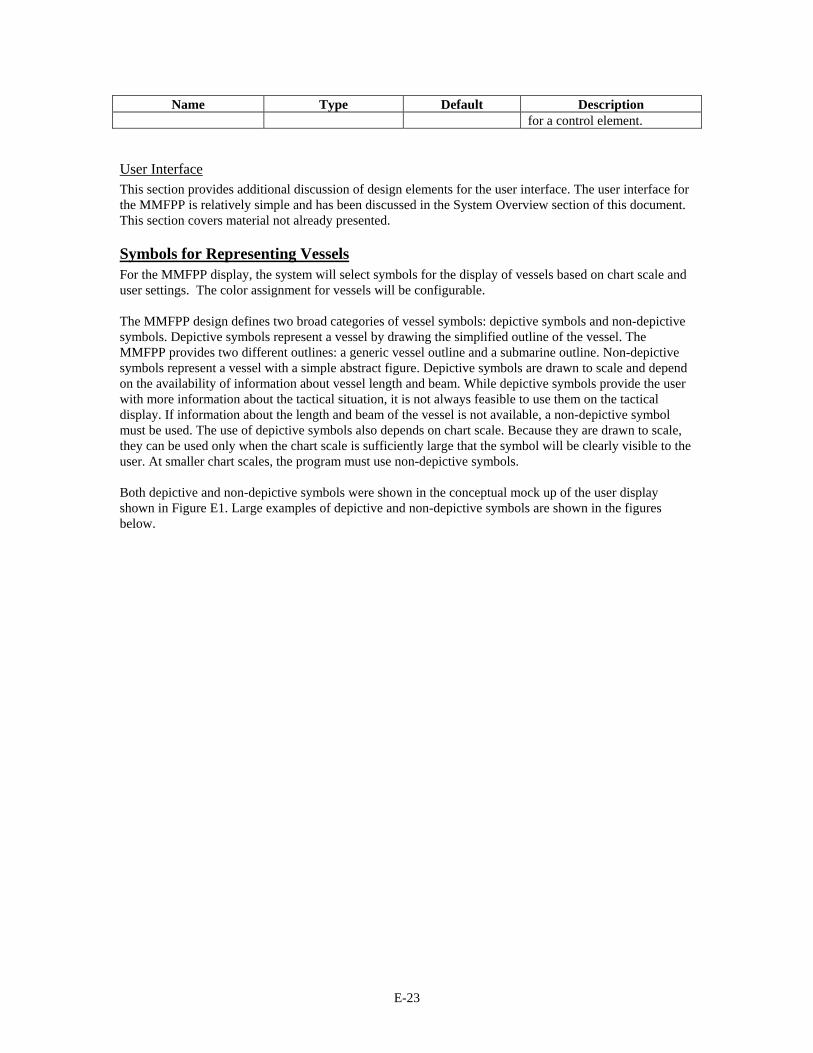
E-23
Name Type Default Description for a control element.
User Interface This section provides additional discussion of design elements for the user interface. The user interface for the MMFPP is relatively simple and has been discussed in the System Overview section of this document. This section covers material not already presented.
Symbols for Representing Vessels For the MMFPP display, the system will select symbols for the display of vessels based on chart scale and user settings. The color assignment for vessels will be configurable. The MMFPP design defines two broad categories of vessel symbols: depictive symbols and non-depictive symbols. Depictive symbols represent a vessel by drawing the simplified outline of the vessel. The MMFPP provides two different outlines: a generic vessel outline and a submarine outline. Non-depictive symbols represent a vessel with a simple abstract figure. Depictive symbols are drawn to scale and depend on the availability of information about vessel length and beam. While depictive symbols provide the user with more information about the tactical situation, it is not always feasible to use them on the tactical display. If information about the length and beam of the vessel is not available, a non-depictive symbol must be used. The use of depictive symbols also depends on chart scale. Because they are drawn to scale, they can be used only when the chart scale is sufficiently large that the symbol will be clearly visible to the user. At smaller chart scales, the program must use non-depictive symbols. Both depictive and non-depictive symbols were shown in the conceptual mock up of the user display shown in Figure E1. Large examples of depictive and non-depictive symbols are shown in the figures below.
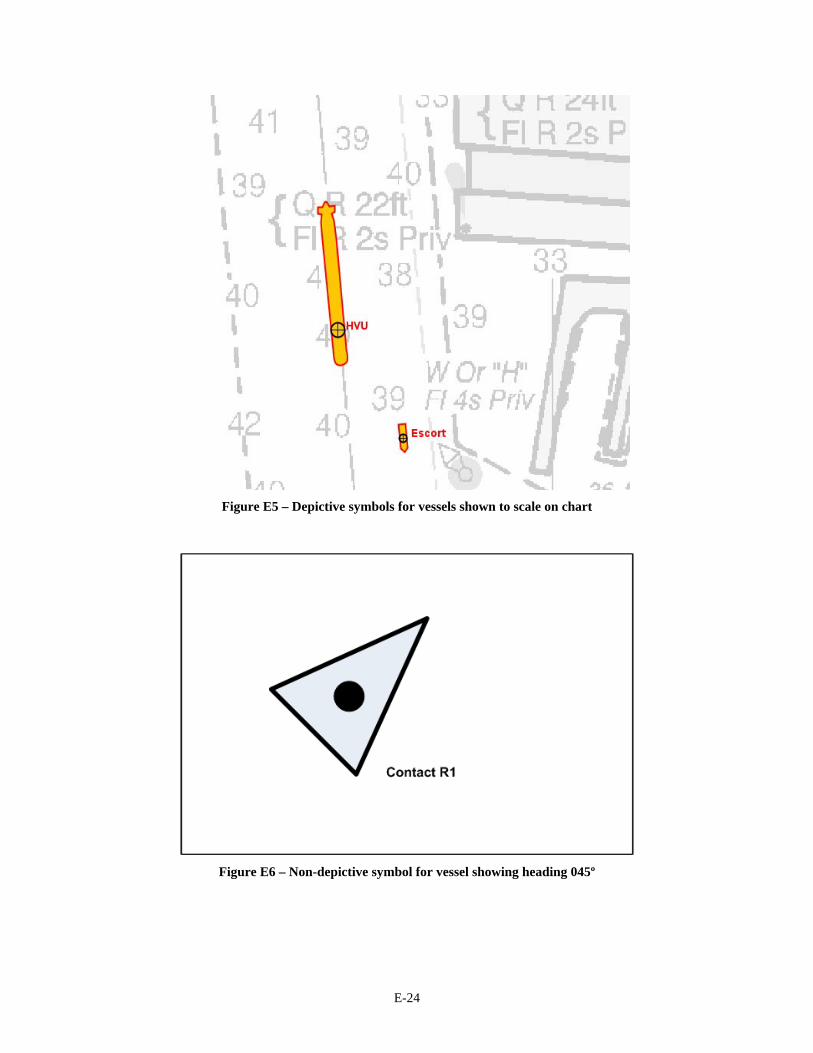
E-24
Figure E5 – Depictive symbols for vessels shown to scale on chart
Figure E6 – Non-depictive symbol for vessel showing heading 045º

E-25
Issues of Chart Scale when Selecting Symbols If the chart scale is sufficiently large, it is feasible to show a depiction of the symbols for vessels which corresponds to their relative size adjusted for the chart scale. Figure E5 above shows the rough outline of a Virginia class submarine (377 ft length) and a Coast Guard T-Boat (65 ft length). The circle/cross symbol shows the relative position of the on-board GPS used for AIS purposes. In other words, these are the positions given in the AIS messages. The size of the vessel outline is based on the current chart scale. Thus a 377 foot long submarine would be shown the same size as a 377 foot pier on the background chart. In this document, this approach to rendering a symbol for a vessel or other contact will be referred to as a scale-based depiction. Information about the vessel’s size and on-board GPS antenna location can be configured in the program before deployment or obtained via an AIS Type-5 message. The scale-based depiction of the vessel is suitable for large chart scales (ie maps showing a relatively small area of interest). The limitations of this approach become apparent as the user zooms the chart display outward to show a larger area and, thus, a smaller map scale. The figure below shows an example of graphics that were extracted from a chart display; each shows a 1000 pixel wide window of a chart (the images in the figures are about 175 pixels wide). The left-hand image was taken from a display showing an “area of interest” 500 yards wide. On the printed page, this image corresponds to a traditional chart scale of about 1:3000. The next two images were taken from displays showing larger areas of interest (small chart scales), showing chart widths of roughly 1000 and 2000 yards respectively. Even in the 2000 yard chart, the scale-based depiction begins to break down; the quality of the depiction is degraded, but even more importantly, the symbol becomes too small for the user to see.
500 yards, 1000 pixels 1000 yards, 1000 pixels 2000 yards, 1000 pixels
Figure E7 –Effectiveness of scale-based depiction at different scales
Definition for the Generic Vessel Depiction Symbol The definition for the generic vessel depiction is based on conventions used in AIS specifications cited above. The coordinates for the symbol are given as percentages of the vessel length and beam, as shown in Figure E8. The position of the GPS unit used by the AIS system is obtained as part of the Type-5 AIS message type. The vessel symbol is drawn so that its GPS position is centered at the point on the chart corresponding to the latitude and longitude of the position report for the vessel.
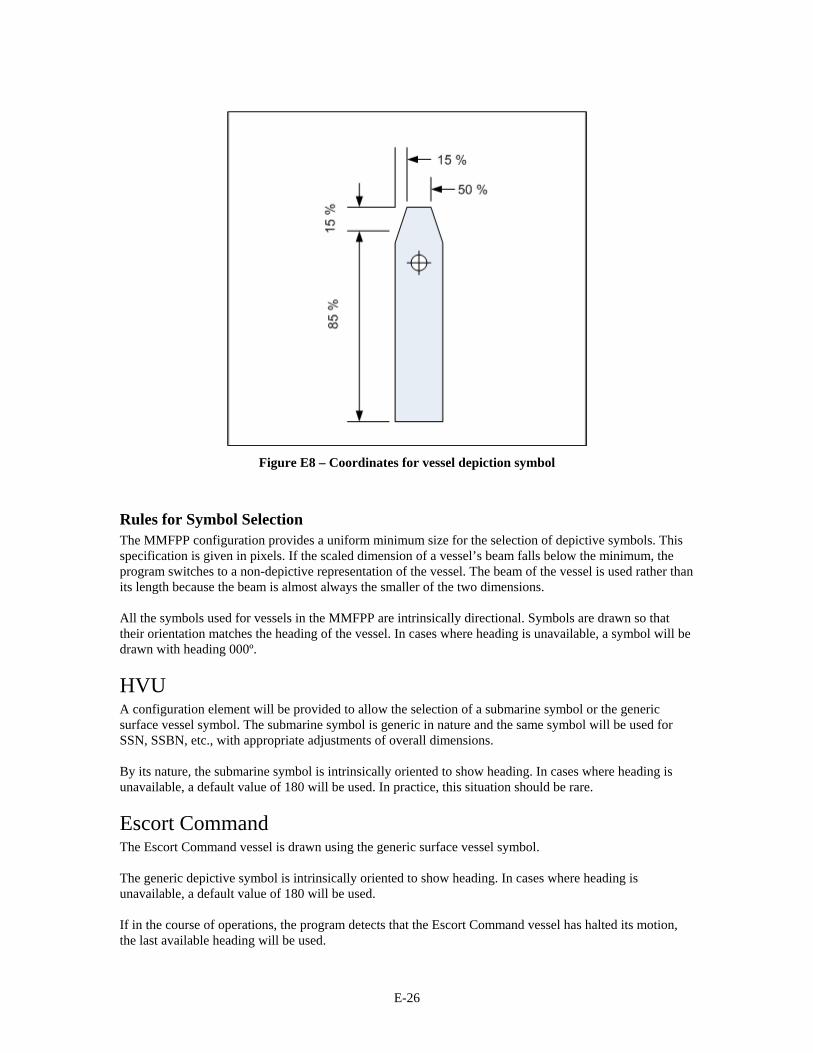
E-26
Figure E8 – Coordinates for vessel depiction symbol
Rules for Symbol Selection The MMFPP configuration provides a uniform minimum size for the selection of depictive symbols. This specification is given in pixels. If the scaled dimension of a vessel’s beam falls below the minimum, the program switches to a non-depictive representation of the vessel. The beam of the vessel is used rather than its length because the beam is almost always the smaller of the two dimensions. All the symbols used for vessels in the MMFPP are intrinsically directional. Symbols are drawn so that their orientation matches the heading of the vessel. In cases where heading is unavailable, a symbol will be drawn with heading 000º.
HVU A configuration element will be provided to allow the selection of a submarine symbol or the generic surface vessel symbol. The submarine symbol is generic in nature and the same symbol will be used for SSN, SSBN, etc., with appropriate adjustments of overall dimensions. By its nature, the submarine symbol is intrinsically oriented to show heading. In cases where heading is unavailable, a default value of 180 will be used. In practice, this situation should be rare.
Escort Command The Escort Command vessel is drawn using the generic surface vessel symbol. The generic depictive symbol is intrinsically oriented to show heading. In cases where heading is unavailable, a default value of 180 will be used. If in the course of operations, the program detects that the Escort Command vessel has halted its motion, the last available heading will be used.
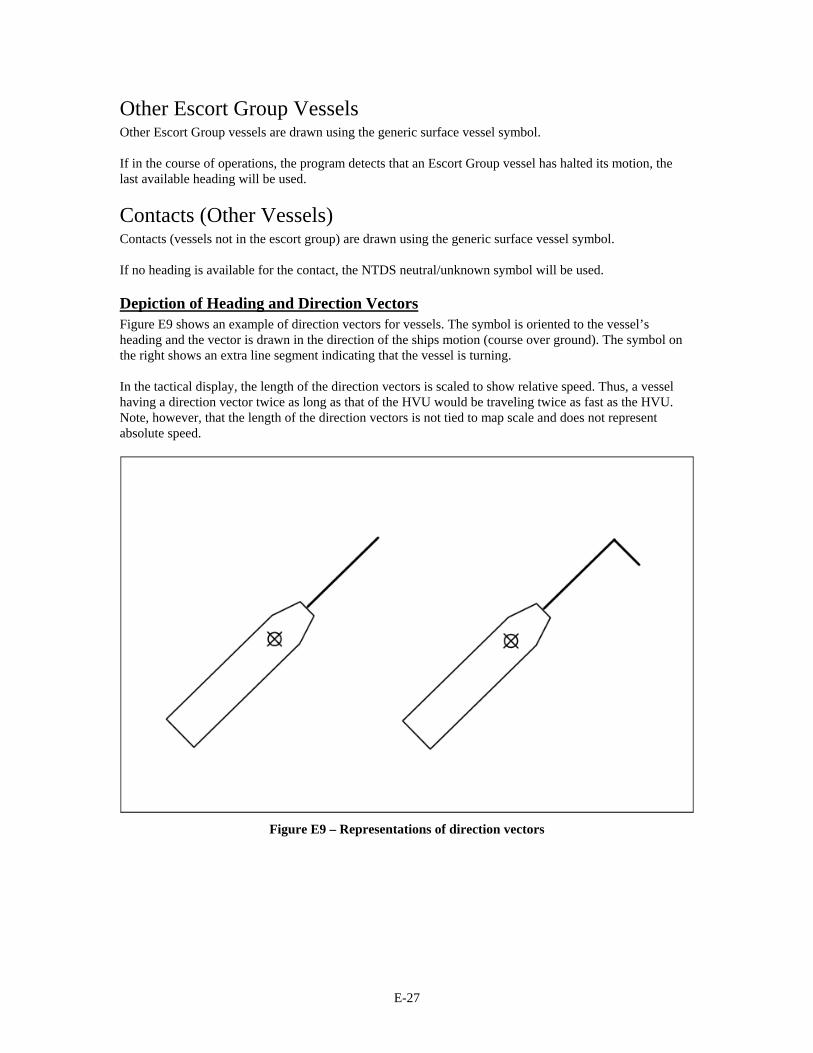
E-27
Other Escort Group Vessels Other Escort Group vessels are drawn using the generic surface vessel symbol. If in the course of operations, the program detects that an Escort Group vessel has halted its motion, the last available heading will be used.
Contacts (Other Vessels) Contacts (vessels not in the escort group) are drawn using the generic surface vessel symbol. If no heading is available for the contact, the NTDS neutral/unknown symbol will be used.
Depiction of Heading and Direction Vectors Figure E9 shows an example of direction vectors for vessels. The symbol is oriented to the vessel’s heading and the vector is drawn in the direction of the ships motion (course over ground). The symbol on the right shows an extra line segment indicating that the vessel is turning. In the tactical display, the length of the direction vectors is scaled to show relative speed. Thus, a vessel having a direction vector twice as long as that of the HVU would be traveling twice as fast as the HVU. Note, however, that the length of the direction vectors is not tied to map scale and does not represent absolute speed.
Figure E9 – Representations of direction vectors
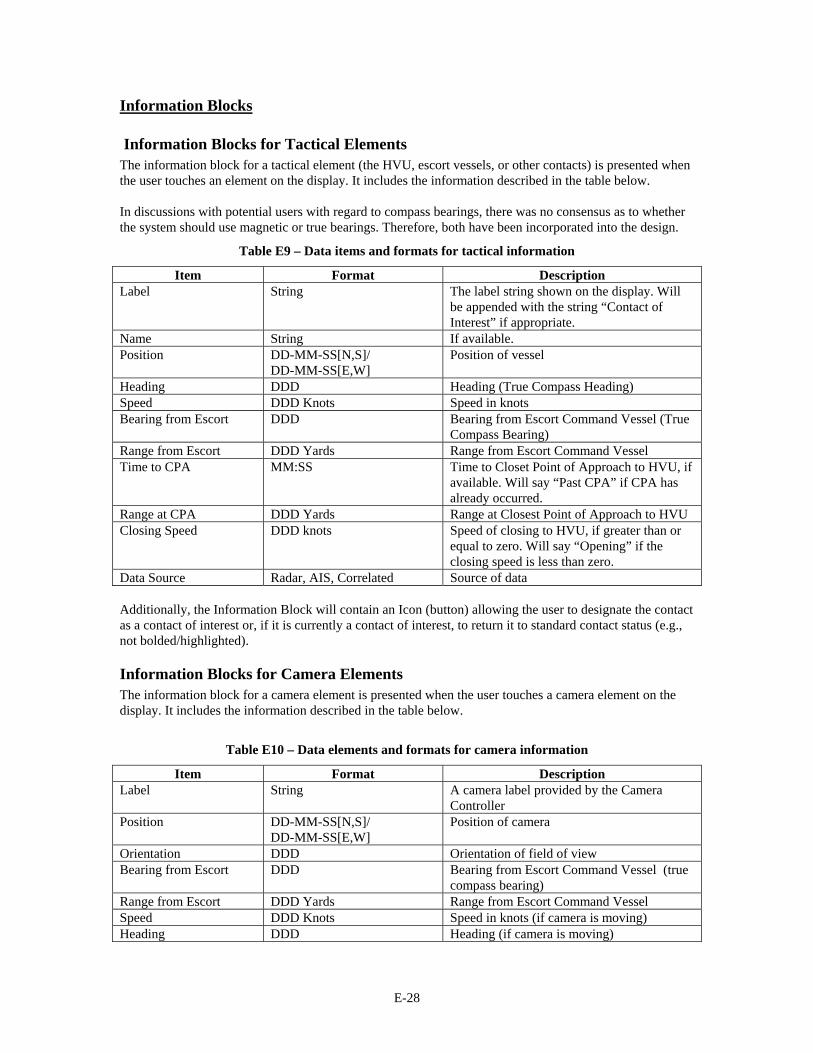
E-28
Information Blocks
Information Blocks for Tactical Elements The information block for a tactical element (the HVU, escort vessels, or other contacts) is presented when the user touches an element on the display. It includes the information described in the table below. In discussions with potential users with regard to compass bearings, there was no consensus as to whether the system should use magnetic or true bearings. Therefore, both have been incorporated into the design.
Table E9 – Data items and formats for tactical information
Item Format Description Label String The label string shown on the display. Will
be appended with the string “Contact of Interest” if appropriate.
Name String If available. Position DD-MM-SS[N,S]/
DD-MM-SS[E,W] Position of vessel
Heading DDD Heading (True Compass Heading) Speed DDD Knots Speed in knots Bearing from Escort DDD Bearing from Escort Command Vessel (True
Compass Bearing) Range from Escort DDD Yards Range from Escort Command Vessel Time to CPA MM:SS Time to Closet Point of Approach to HVU, if
available. Will say “Past CPA” if CPA has already occurred.
Range at CPA DDD Yards Range at Closest Point of Approach to HVU Closing Speed DDD knots Speed of closing to HVU, if greater than or
equal to zero. Will say “Opening” if the closing speed is less than zero.
Data Source Radar, AIS, Correlated Source of data Additionally, the Information Block will contain an Icon (button) allowing the user to designate the contact as a contact of interest or, if it is currently a contact of interest, to return it to standard contact status (e.g., not bolded/highlighted).
Information Blocks for Camera Elements The information block for a camera element is presented when the user touches a camera element on the display. It includes the information described in the table below.
Table E10 – Data elements and formats for camera information
Item Format Description Label String A camera label provided by the Camera
Controller Position DD-MM-SS[N,S]/
DD-MM-SS[E,W] Position of camera
Orientation DDD Orientation of field of view Bearing from Escort DDD Bearing from Escort Command Vessel (true
compass bearing) Range from Escort DDD Yards Range from Escort Command Vessel Speed DDD Knots Speed in knots (if camera is moving) Heading DDD Heading (if camera is moving)
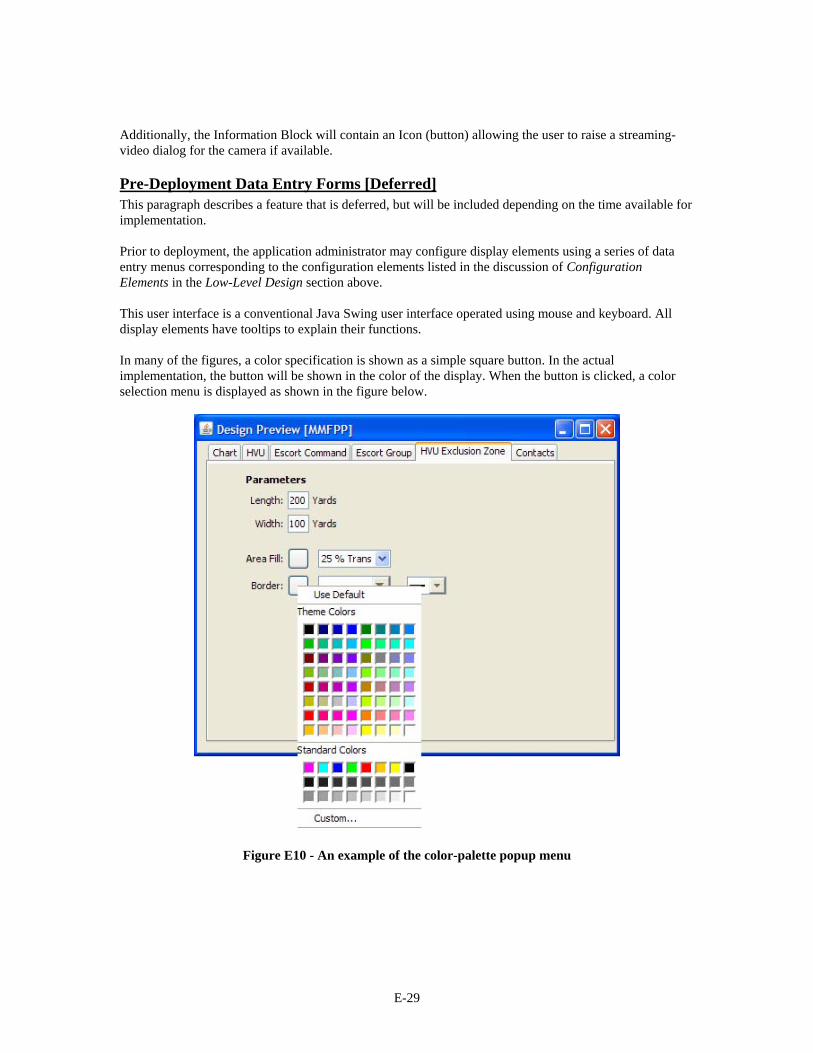
E-29
Additionally, the Information Block will contain an Icon (button) allowing the user to raise a streaming-video dialog for the camera if available.
Pre-Deployment Data Entry Forms [Deferred] This paragraph describes a feature that is deferred, but will be included depending on the time available for implementation. Prior to deployment, the application administrator may configure display elements using a series of data entry menus corresponding to the configuration elements listed in the discussion of Configuration Elements in the Low-Level Design section above. This user interface is a conventional Java Swing user interface operated using mouse and keyboard. All display elements have tooltips to explain their functions. In many of the figures, a color specification is shown as a simple square button. In the actual implementation, the button will be shown in the color of the display. When the button is clicked, a color selection menu is displayed as shown in the figure below.
Figure E10 - An example of the color-palette popup menu
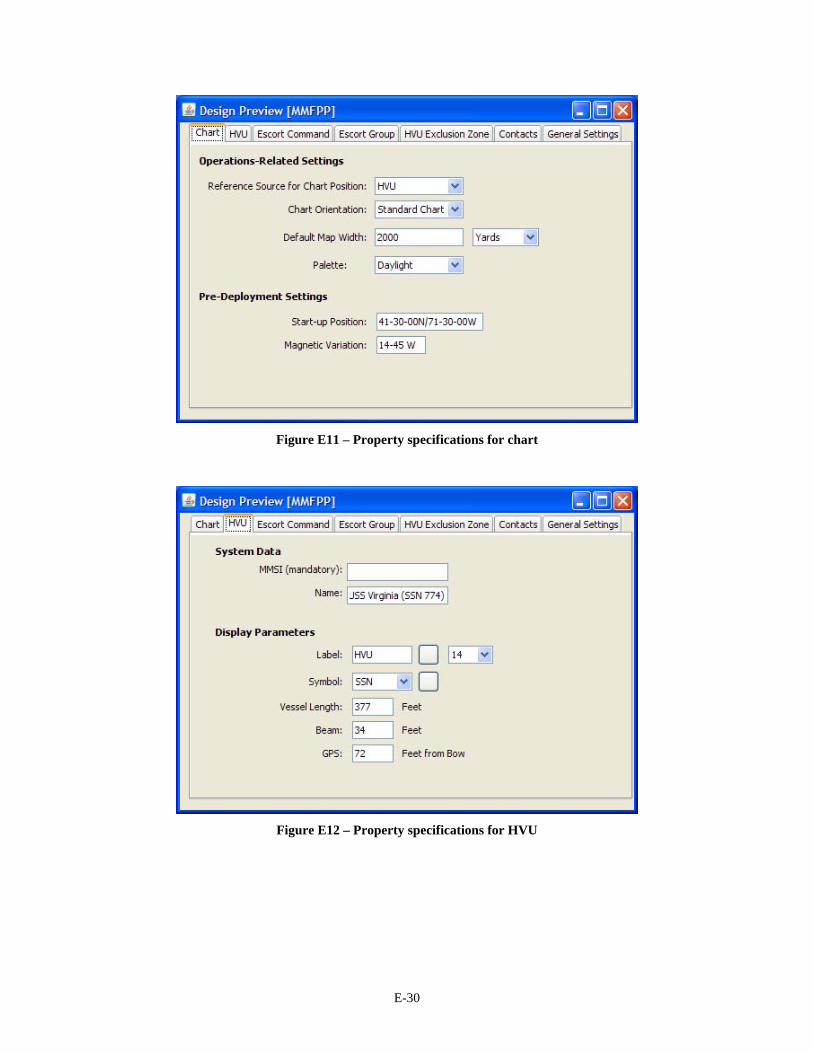
E-30
Figure E11 – Property specifications for chart
Figure E12 – Property specifications for HVU
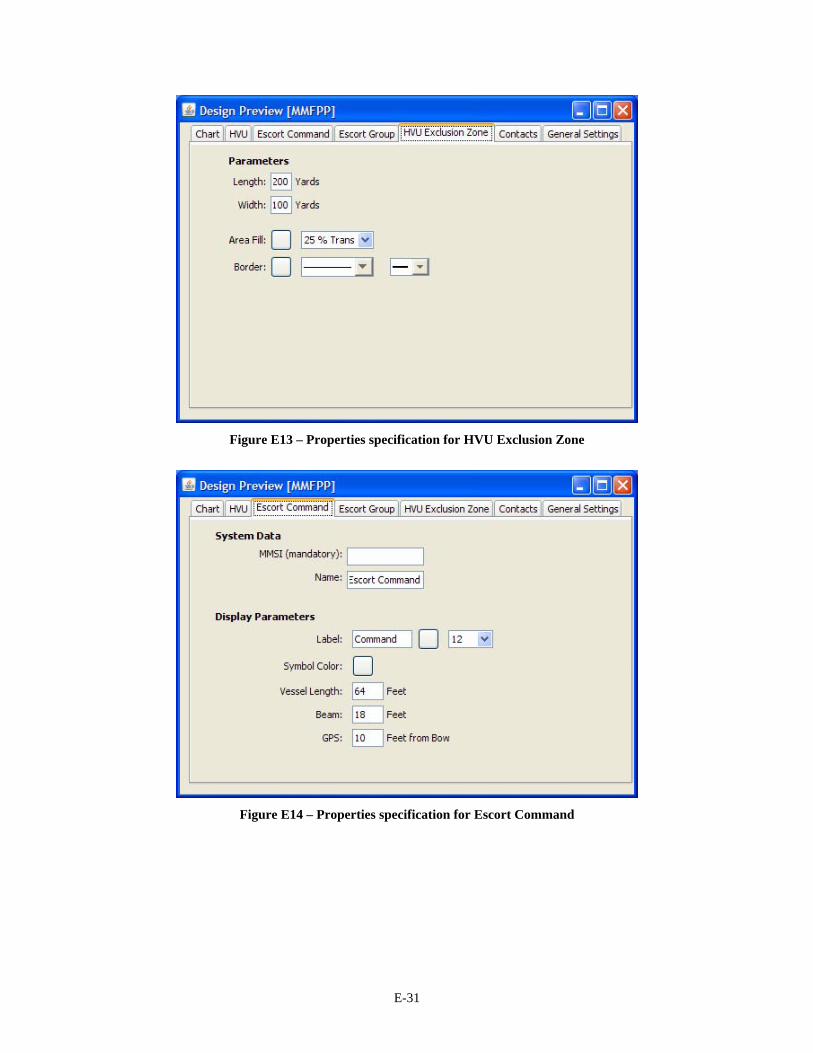
E-31
Figure E13 – Properties specification for HVU Exclusion Zone
Figure E14 – Properties specification for Escort Command

E-32
Figure E15 – Properties specification for other escort vessels
Figure E16 – Properties specification for contacts
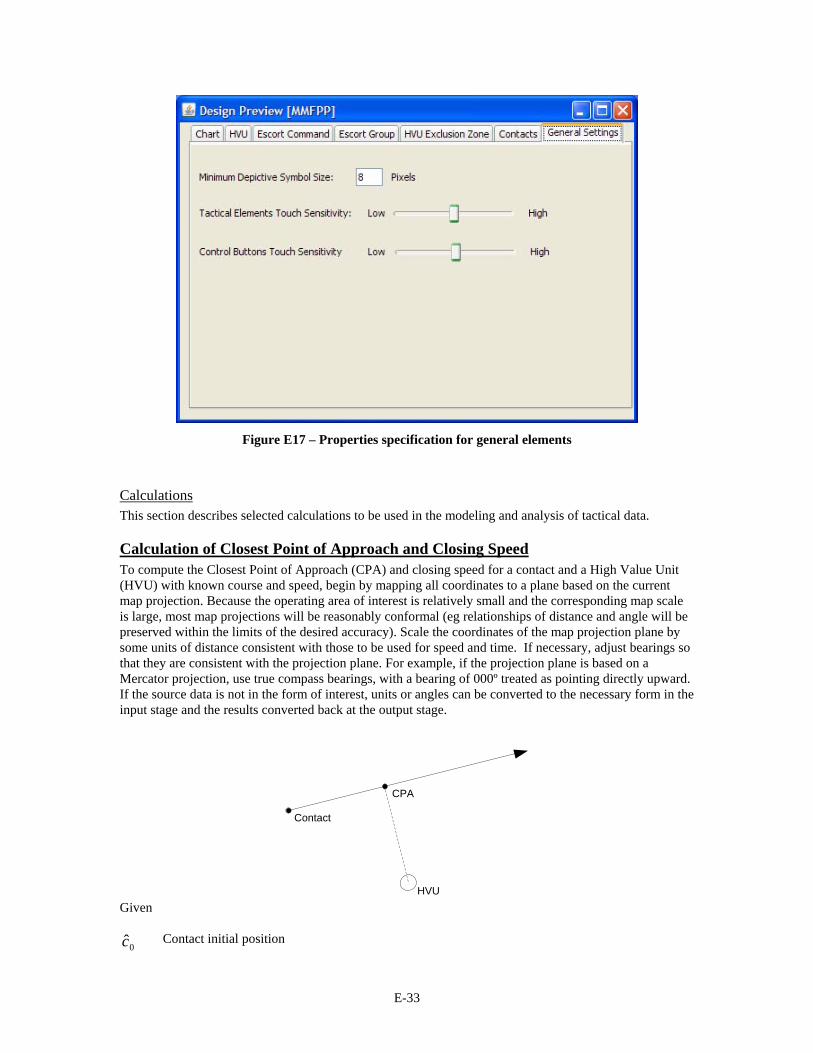
E-33
Figure E17 – Properties specification for general elements
Calculations This section describes selected calculations to be used in the modeling and analysis of tactical data.
Calculation of Closest Point of Approach and Closing Speed To compute the Closest Point of Approach (CPA) and closing speed for a contact and a High Value Unit (HVU) with known course and speed, begin by mapping all coordinates to a plane based on the current map projection. Because the operating area of interest is relatively small and the corresponding map scale is large, most map projections will be reasonably conformal (eg relationships of distance and angle will be preserved within the limits of the desired accuracy). Scale the coordinates of the map projection plane by some units of distance consistent with those to be used for speed and time. If necessary, adjust bearings so that they are consistent with the projection plane. For example, if the projection plane is based on a Mercator projection, use true compass bearings, with a bearing of 000º treated as pointing directly upward. If the source data is not in the form of interest, units or angles can be converted to the necessary form in the input stage and the results converted back at the output stage.
Contact
HVU
CPA
Given
0c Contact initial position
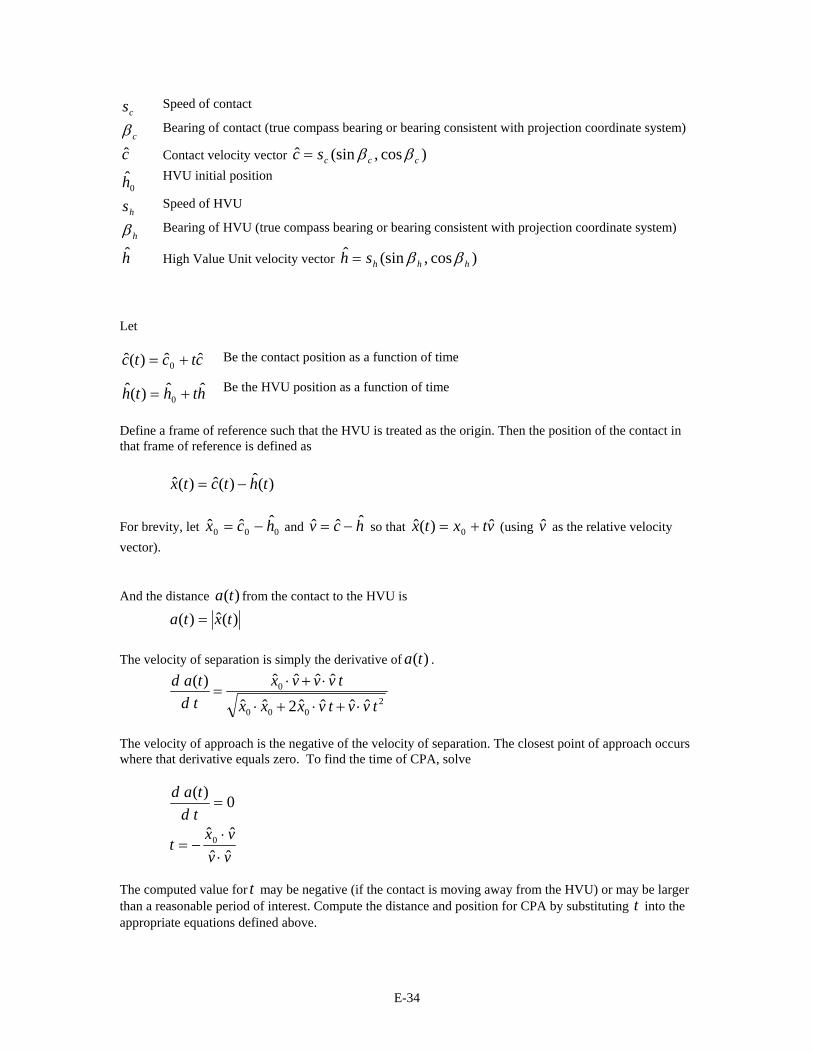
E-34
cs Speed of contact
c Bearing of contact (true compass bearing or bearing consistent with projection coordinate system)
c Contact velocity vector )cos ,(sinˆ cccsc
0h HVU initial position
hs Speed of HVU
h Bearing of HVU (true compass bearing or bearing consistent with projection coordinate system)
h High Value Unit velocity vector )cos ,(sinˆhhhsh
Let
ctctc ˆˆ)(ˆ 0 Be the contact position as a function of time
hthth ˆˆ)(ˆ 0 Be the HVU position as a function of time
Define a frame of reference such that the HVU is treated as the origin. Then the position of the contact in that frame of reference is defined as
)(ˆ)(ˆ)(ˆ thtctx
For brevity, let 000ˆˆˆ hcx and hcv ˆˆˆ so that vtxtx ˆ)(ˆ 0 (using v as the relative velocity
vector). And the distance )(ta from the contact to the HVU is
)(ˆ)( txta
The velocity of separation is simply the derivative of )(ta .
2000
0
ˆˆ ˆˆ2ˆˆ
ˆˆˆˆ
)(
tvvtvxxx
tvvvx
td
tad
The velocity of approach is the negative of the velocity of separation. The closest point of approach occurs where that derivative equals zero. To find the time of CPA, solve
0
)(
td
tad
vv
vxt
ˆˆ
ˆˆ0
The computed value for t may be negative (if the contact is moving away from the HVU) or may be larger than a reasonable period of interest. Compute the distance and position for CPA by substituting t into the appropriate equations defined above.
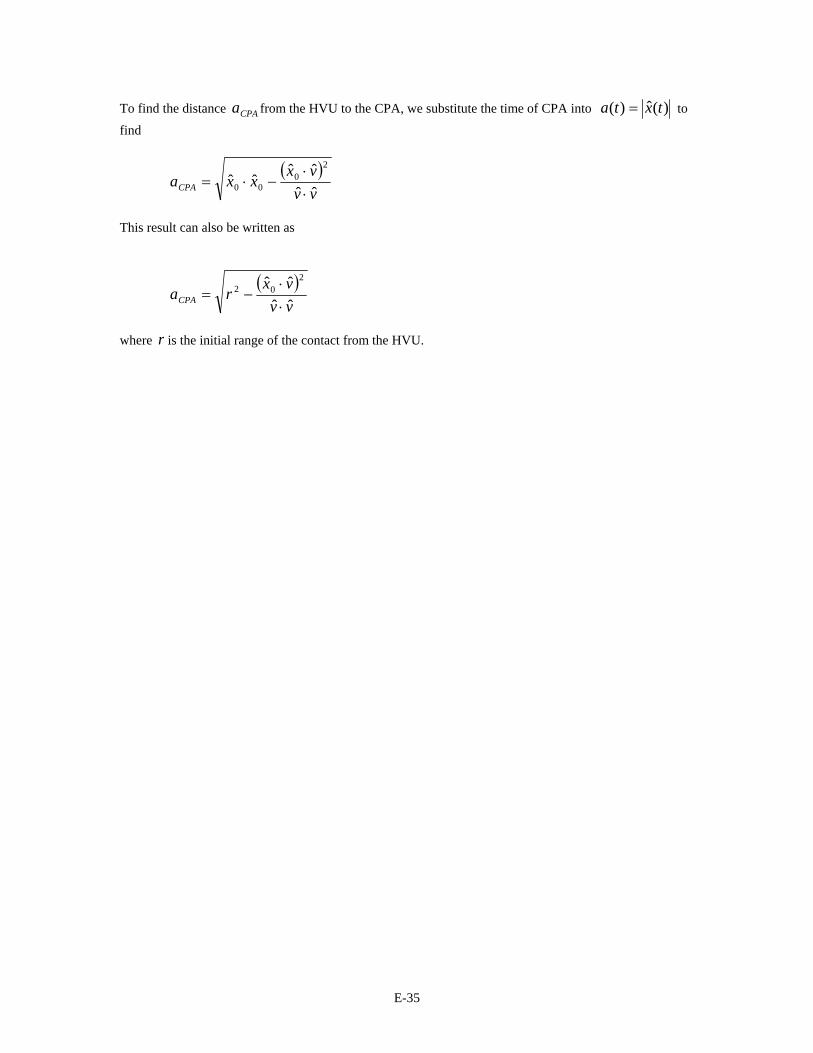
E-35
To find the distance CPAa from the HVU to the CPA, we substitute the time of CPA into )(ˆ)( txta to
find
vv
vxxxaCPA ˆˆ
ˆˆˆˆ
20
00
This result can also be written as
vv
vxraCPA ˆˆ
ˆˆ 202
where r is the initial range of the contact from the HVU.

E-36
[THIS PAGE INTENTIONALLY LEFT BLANK]
F-1
APPENDIX F
SOFTWARE REQUIREMENTS SPECIFICATION
Sonalysts, Inc.
215 Parkway North
Waterford, CT 06385
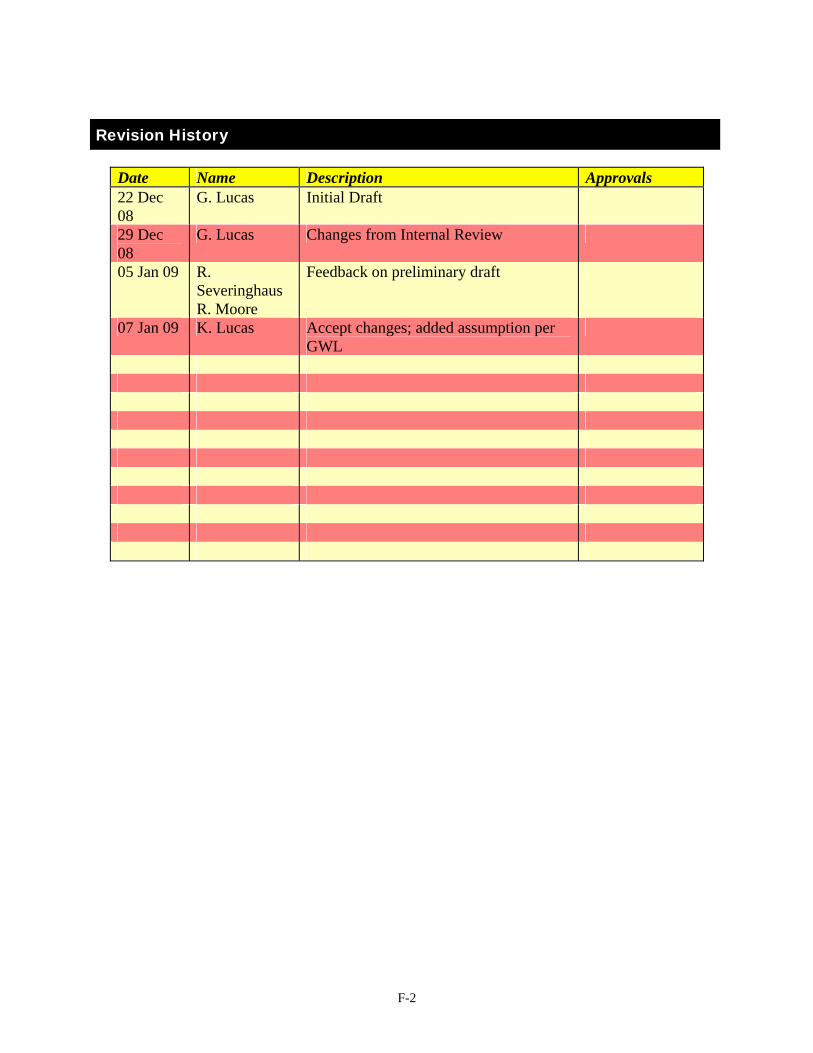
F-2
Revision History
Date Name Description Approvals 22 Dec 08
G. Lucas Initial Draft
29 Dec 08
G. Lucas Changes from Internal Review
05 Jan 09 R. Severinghaus R. Moore
Feedback on preliminary draft
07 Jan 09 K. Lucas Accept changes; added assumption per GWL
F-3
TABLE OF CONTENTS
REVISION HISTORY ................................................................................................................................... 2 1 INTRODUCTION............................................................................................................................ 3 1.1 Purpose 4 1.2 Scope 4 1.3 Definitions, Acronyms, and Abbreviations 4
1.3.1 Definitions 4 1.3.2 Acronyms and Abbreviations 6
1.4 References 7 1.5 Overview 6 2 OVERALL DESCRIPTION ............................................................................................................ 7 2.1 Product Perspective 7
2.1.1 Modules 7 2.1.2 Data Sources for Map Products 8
2.2 Interfaces 8 2.2.1 System Interfaces 8 2.2.2 User Interfaces 8 2.2.3 Hardware Interfaces 9 2.2.4 Software Interfaces 9 2.2.5 Communications Interfaces 9
2.3 Product Functions 9 2.4 User Characteristics 10 2.5 Constraints 10
2.5.1 System Constraints 10 2.5.2 Memory Constraints 10
2.6 Assumptions and Dependencies 10 3 SPECIFIC REQUIREMENTS....................................................................................................... 10 3.1 External Interfaces 10
3.1.1 System Configuration Interface 10 3.2 Functions 11
3.2.1 Map Presentation and Control 11 3.2.2 Contact Display and Interactions 11 3.2.3 Functions Related to Camera Operation 12
3.3 Performance Requirements 12 3.4 Logical Database Requirements 12 3.5 Design Constraints 12 3.6 Software System Attributes 12
3.6.1 Reliability 12 3.6.2 Availability 13 3.6.3 Security 13 3.6.4 Maintainability 13 3.6.5 Portability 13
4 CHANGE MANAGEMENT PROCESS ....................................................................................... 13 5 DOCUMENT APPROVALS......................................................................................................... 13 6 SUPPORTING INFORMATION .................................................................................................. 13
F-4
Introduction
Purpose This document provides a specification of software requirements for a system integration project performed for the Naval Submarine Medical Research Laboratory (NSMRL) under U.S. Government contract number N00189-09-P-G035. The project created a map-based display and user interface software subsystem to operate as part of a Maritime Mobile Force Protection Program (MMFPP) system developed for NSMRL by Sonalysts and Smiths Detection, Inc. Contents of the SRS may be of interest to Customers, Project Managers, Developers, and other stake-holders in the MMFPP program.
Scope Sonalysts performed system integration work to adapt its Commercial-Off-The-Shelf (COTS) map data presentation software for use in the MMFPP system. Sonalysts software was integrated into a software subsystem called the MMFPP Map Display and User Interface (hereafter, to be referred to as the “Map Interface”). The Map Interface presents users with a map-based display which displays real-time information about contacts, sensors, and other data products. These data products are supplied by the MMFPP Contact/Sensor Management System (developed by Smiths Detection, Inc.) The combined system is intended to be used by Coast Guard escort vessel personnel (e.g., the Patrol Commander) during escort operations conducted by the U.S. Coast Guard. During these operations a group of one or more Coast Guard vessels escort U.S. Navy submarines or other High-Value Units (HVU) in and out of U.S. harbors. The MMFPP is intended to enhance the Patrol Commander’s personnel situational awareness by providing information about maritime operations and possible hazards beyond that available to his immediate senses or through existing ship-board systems. The Patrol Commander typically operates small vessels, such as the 25’ RB-S (figure adjacent) or a 41’ Utility boat. Depending on vessel configuration, vessel crewmembers are exposed to the elements (heat/cold, rain/snow, high winds, and/or rough seas) during operations. Additionally, escort operations at times place high demand on the Patrol Commander’s personnel workload and attention. Under such conditions, for navigation and tactical displays to remain readable and operable over a range of conditions, the MMFPP Map Display has been designed to provide simple controls and largely hands-off operation. Mapping and user interactions are customized to the mission objectives of the MMFPP system.
Definitions, Acronyms, and Abbreviations
Definitions Term Description Application Administrator An expert user or system administrator who can operate various system
interfaces to configure the system for operations. Duties of the application administrator include setting of threshold values for alerting conditions, installation of map products, entry of MMSI data for members of the Escort Group, etc.
Application Programming Interface (API)
A set of functions, modules, classes, methods, or protocols that allow one software subsystem to interact with another. APIs are used internally to create programs or applications and are not usually apparent to the user.
Automatic Identification System (AIS)
A system in which ships broadcast own-ship position and descriptive data based on information derived from a GPS. Information is broadcast in digital form over a VHF transmitter.
Automatic Radar Plotting Aid (ARPA)
Maritime radar with mapping and other capabilities.
Console-Style Display A user interface display which acquires control of the entire computer

F-5
display area, superseding or removing all window decorations (minimize, maximize, desktop, etc.). Console interfaces are often used to provide user access to selected functions while preventing them from accessing system-level controls or other programs. The term “console” reflects the similarity of such interfaces to console-based computer game systems. Console-style displays are sometimes called kiosk-style displays.
Contact/Sensor Manager The contact management system provided by Smiths Detection-LiveWave to correlate AIS, Radar and Sonar contact data and report own-ship GPS information.
Dispatch Weather Client (DWC)
A commercial software system developed by Sonalysts Inc to present weather, aviation traffic, and other time-sensitive geo-referenced data on a variety of commercial display products
Electronic Chart Display and Information System (ECDIS)
A computer-based navigation information system that meets International Maritime Organization (IMO) standards and is approved for navigation purposes.
Patrol Group The collective group of Patrol vessels and escorted HVU Electronic Navigational Chart (ENC)
A digital nautical chart. To be certified as an Electronic Navigational Chart, a data product must conform to standard stated in the International Hydrographic Organization (IHO) Special Publication S-57.
Evolution-Data Optimized (EVDO)
A wireless telecommunications standard supported by Verizon and other commercial vendors.
FirstView A commercial video surveillance and camera management system sold by Smiths Detection, Inc (formerly LiveWave).
Furuno Electric Co, LTD. A supplier of marine electronics systems, particularly ARPA radar systems to be used by the MMFPP Contact/Sensor Management System
Java A popular, modern computer programming language most notable for its portability across different computer architectures (including Windows, Linux, Macintosh, and many Unix systems). Both Smiths Detection and Sonalysts software are written in Java.
Java Database Connectivity (JDBC)
An industry standard Java interface for establishing connectivity and query capability with database implementations.
Kiosk-Style Display A Console-Style Display with limited user interface functions (usually no keyboard or mouse). Variations of the terms “kiosk display” and “console display” are often used interchangeably.
Map Interface Software modules designed by Sonalysts to provide mapping, user interactions, and contact display.
MARSEC Marine Security A U.S. Coast Guard system providing three-tiered security levels. Maritime Mobile Service Identity (MMSI)
A nine-digit self-identification code transmitted by vessels when operating Automatic Identification Systems (AIS). Each vessel is assigned a code value.
MySQL An open-source relational database management system, (officially pronounced “my skwel”, but more commonly as “my sequel”)
Raster Navigational Charts (RNC)
A NOAA data product giving nautical charts in a raster (image) format.
ShapeFile An industry-standard data format for the representation of map data in a vector form.
Acronyms and Abbreviations Acronym Description AIS Automatic Identification System ARPA Automatic Radar Plotting Aid API Application Programming Interface
F-6
COTS Commercial Off-the-Shelf CPA Closest Point of Approach DWC Dispatch Weather Client (Sonalysts software) ECDIS Electronic Chart Display and Information System ENC Electronic Navigation Chart EVDO Evolution-Data Optimized (wireless telecommunications standard). Sometimes
written “EV-DO” FOV Field of View (for cameras) GIS Geographic Information System GPS Global Positioning System HVU High Value Unit IHO International Hydrographic Organization IMO International Maritime Organization JDBC Java DataBase Connectivity MARSEC Marine Security MMFPP Maritime Mobile Force Protection Product MMSI Maritime Mobile Service Identity (an AIS identification code) NOAA National Oceanic and Atmospheric Administration NSMRL Naval Submarine Medical Research Laboratory (Groton CT) PTZ Pan-Tilt-Zoom (for remotely operated cameras) RADAR RAdio Detection And Ranging RNC Raster Navigation Charts SRS Software Requirements Specification VHF Very High Frequency
References Electronic Navigational Charts: NOAA ENCs, National Oceanic and Atmospheric Administration, http://www.nauticalcharts.noaa.gov/mcd/enc/index.htm. Accessed Dec 2008. FirstView Enterprise Server – Command and Control System for Sensor Integration and Management, Smiths Detection-LiveWave Technical Document, 29 Oct 2008. Javadoc for LiveWave Prototype, Smiths Detection-LiveWave, Provided Dec 2008. Raster Navigational Charts: NOAA RNCs, National Oceanic and Atmospheric Administration, http://www.nauticalcharts.noaa.gov/mcd/Raster/index.htm. Accessed Dec 2008.
Overview This Software Requirements Specification (SRS) document is organized as follows
Section 2: Overall Description – provides an overall description of the system as background into the requirements.
Section 3: Specific Requirements – contains the specific requirements.
Section 4: Change Management Process – identifies the change management process that will be used to
identify, log, evaluate, and update the requirements.
Section 5: Document Approvals – identifies the approvers of the requirement document.
Section 6: Supporting Information – provides any additional information required to understand and support the requirements.

F-7
Overall Description This section of the SRS document provides background and a description of general factors that affect the product and its requirements. This section does not state specific requirements. It is intended to establish context in which the requirements presented in the next section may be discussed and understood.
Product Perspective As part of its research into human performance and human factors in man-machine interfaces, the Naval Submarine Medical Research Laboratory (NSMRL) intends to develop a prototype system to support joint U.S Navy and Coast Guard vessel escort operations. In these operations, a group of one or more Coast Guard vessels escort High-Value Units (HVU) (e.g., U.S. Navy submarines) in and out of U.S. harbors. The Coast Guard requires a system to support the Patrol Commander’s personnel situational awareness, with particular regard to electronic sensor and correlations systems from data sources such as AIS and Radar derived contacts. Such situational-awareness systems have the potential of extending the scope of the Patrol Commander’s awareness beyond that available through conventional ship-board radar and other organic sensors (visual and audio identification). But development of such systems presents significant user interface challenges due to the fact that they must function in rugged conditions. Coast Guard vessels used for escort duties are typically small boats or vessels providing minimal shelter. The boats can, and do, operate at high speeds, often in rough seas. This constant motion, and the fact that the operators are often wearing heavy gloves, makes it difficult for an operator to manipulate conventional user interfaces. Additionally, the crews’ normal workload of monitoring and directing vessel and escort operations limits the time and attention available to operate onboard equipment. Therefore, the MMFPP Map Display must feature displays that are readable in daylight conditions, and must provide simple controls and largely hands-off operation. To support a demonstration of capability suited for use in escort operations, Sonalysts will customize a map interface to situational-awareness data and related user interactions under the conditions described above. Real-time data including own-ship position, AIS data, and Radar derived contact data will be provided by a separate processing system created by Smiths Detection (SD) of Middletown, RI. Sonalysts will use a Java API provided by Smiths Detection to access SD data. The SD system will also manage networking and telecommunications and provide interfaces for live-streaming video of remotely located video cameras operating during the demonstration. The Sonalysts system will use data from the SD software to display imagery showing the contacts. The Sonalysts system will also provide the user the ability to manipulate the map and obtain drill-down style information on the sensors and contacts shown.
Modules The MMFPP system integrates software developed independently by two vendors, Sonalysts, Inc. and Smiths Detection. The following paragraphs describe the functions and overall areas of responsibility for each set of software.
Modules contributed by Smiths Detection Major functions provided by Smiths Detection include
Access to data from Smith Detections’ FirstView camera server system, including telecommunications and EV-DO networking with land-based, stationary video cameras to provide video imagery during demonstration. Video imagery will be provided by a Java API supplied by Smiths Detection.
Receipt and processing of GPS data. GPS information provided to other modules through a Java API supplied by Smiths Detection.
Receipt and correlation of AIS data and Radar contacts through commercial hardware systems (including the Furuno Radar and AIS data captured through a VHF receiver) to be provided and installed by Smiths Detection. Contact information is stored in a MySQL database; data may be obtained through standard SQL queries.
F-8
On-board High-Resolution Sonar Interface (planned for future development).
Modules contributed by Sonalysts, Inc. Major functions provided by the Sonalysts software include
Storage of Raster Navigational Chart (RNC) map data products for New London Harbor and vicinity. Ability to create and display map data products in an interactive display. Ability to lock map to own-ship position and optionally orient it to own-ship heading. Logic for transforming latitude/longitude coordinates and mapping sensor and contact data to display using
appropriate symbols and/or icons. Interaction with sensor and contact symbols to obtain additional detail, including course, speed, and
computed Closest Point of Approach (CPA) when sufficient data is available. Logic for display of camera and RADAR icons on the map and for interacting with the Smiths Detection
API to raise (put on screen) video imagery for contacts, when available.
Sonalysts will provide this functionality through package and class files from its existing geographic framework (GeoFramework) and general geographic transform (Geo) module libraries to support rendering and mapping as well as custom code specific to the needs of the MMFPP application.
Data Sources for Map Products Map data will be obtained from electronic products prepared by the National Oceanic and Atmospheric Administration. Sonalysts will provide the means to download and install these data products, which are available without cost from the NOAA web site (see References). The Map Interface will use NOAA’s Raster Navigational Charts (RNC).
Interfaces The following paragraphs describe interfaces between the Sonalysts Map Interface software and other systems. A description of interfaces between the Smiths Detection software and other systems is outside the scope of this document.
System Interfaces The Sonalysts Map Interface software will interact with the standard computer graphics subsystem interface, disk drives, user input devices, and other system resources.
Touch Screen, Mouse and Keyboard A touch-screen based system interface will be used for user interactions during escort operations. During escort operations, mouse and keyboard interactions will not be available. Mouse and keyboard interfaces will be used for user interactions during setup and system configuration functions to be conducted in pre-deployment and post-exercise operations.
User Interfaces The following user interfaces will be used by the Sonalysts Map Interface.
Console-Style Interface for Maps All map display and user interactions will be provided by a console-style interface (the “Console Display”). The console-style map display will take advantage of the touch screen interface described above. In laboratory and development operations (as in cases where a touch screen is not available), the use of a mouse will be limited to functions which have direct analogs to touch-screen functions.
F-9
Touch-Based User Controls The conditions under which the system is to operate require that the user be presented with distinct, simple icons and controls. Because it will be difficult for the user to accurately point to a particular element on the screen (whether control icon or contact symbol), the display elements must be large, distinct, and relatively forgiving of inaccuracies in the placements of the user’s touch. To allow the user to steady his hand while operating controls, button-like icons or switch-like functions (selectors, activators, reset buttons, etc.) will be placed on the edges of the display outer (left, right, and bottom). The MMFPP system operates under daylight conditions, so it is possible that a hood or some form of shade device will be placed over the display to improve visibility. Therefore, the top edge of the display will not be used. At this time, it is unknown whether the available hardware drivers and Java language interface will permit “two-finger” touch interactions such as the “pinch interaction” used for map zooming on devices such as Apple’s iPhone. Such interactions may also prove difficult for users operating the system under the conditions described above. Therefore the design of Sonalysts’ Map Interface will depend on two basic types of interactions:
touch and hold – the user touches a point on the display long enough to indicate a selection of a function (a control icon) or a display object (such as a contact on the display).
touch and drag – the users touches a point and then slides his finger along the display, for example when
activating a zoom tool or panning the map.
Hardware Interfaces All hardware interfaces will be managed by the Smiths Detection API. The Smiths Detection API provides access to:
Latitude, longitude and elevation (position) information for stationary cameras and RADAR systems, Course, heading and speed information for mobile cameras and RADAR systems (in addition to the
position information), Pan angle (azimuth) and tilt angle information for cameras, and Allows software to control camera pan and tilt settings.
Access to these functions will be accomplished through the Smiths Detection API.
Software Interfaces Sonalysts’ Map Interface module will access the Smiths Detection ContactMgr (contact manager) software interface to obtain own-ship and contact position, course, and speed data (defined in the com.livewave.prototype.contacts package, see Javadoc for LiveWave Prototype for further information). The Map Interface module will access Smiths Detection CameraController software interface to obtain camera information and control functions (defined in the com.livewave.prototype.camera package, see Javadoc for LiveWave Prototype for further information).
Communications Interfaces Communications issues are managed by the Smiths Detection modules and are outside the scope of this document.
Product Functions The Map Interface module is a kiosk-style display interface (“Console Display”) that operates in full-screen mode and accepts user inputs through touch-based interactions. During HVU escort operations, no mouse or keyboard input is accepted. Contacts and other real-time tactical information are presented on a map-based display.
F-10
User Characteristics The user of the Map Interface module is the U.S. Coast Guard Patrol Commander, or personnel assigned by him, operating the system onboard the escort mission command vessel during HVU escort mission operations. It is expected that the user will receive only minimal training before operating the system.
Constraints
System Constraints The Map Interface module will operate on hardware shared by the Smiths Detection prototype software and API.
Memory Constraints The Map Interface module will operate on a system with at least 1 Gigabyte of available memory.
Assumptions and Dependencies This SRS assumes that Sonalysts will have access to a stable version of the Smiths Detection software modules by 9 Jan 2009 in order to permit development of their own software. This SRS assumes that the Smiths Detection software can operate under a simulation mode to provide data for testing and software development in advance of installation on actual ship-board or operational systems. This SRS assumes that Sonalysts will have access to Government Furnished Equipment in the form of a HP TouchSmart computer or other interface compatible with the hardware to be used during the product demonstration. This SRS assumes that the Smiths Detection software will provide an interface that supplies streaming video from camera feeds in a manner consistent with the touch-screen interface to be used in the MMFPP. This SRS assumes that the Smiths Detection software will provide available AIS-derived contacts including MMSI code, contact name, position, course, and speed and heading (when available). This SRS assumes that the Smiths Detection software will provide an API suitable for the control of camera operations in a real-time environment. This SRS assumes that it will be possible to obtain a track history of contacts from the Contact/Sensor Manager. This SRS assumes that the Map Interface modules can perform data access for all contacts with a polling rate of approximately every two seconds without degrading overall system performance.
Specific Requirements This section provides specific requirements for the implementation of the Map Interface module.
External Interfaces
System Configuration Interface Sonalysts shall provide an application configuration interface to allow the application administrator to configure the Map Interface module prior to deployment. This interface will operate separate from the Map Interface described below. The System Configuration Interface shall provide the application administrator the ability to specify the following information:
The MMSI for the HVU

F-11
Distance specifications (length and width) for the HVU Exclusion Zone (area and/or volume) The MMSI for one or more vessels in the Escort Group Palette selections for the Map Display including: palette night-operations, palette for daylight operations. Default map size (defined as a distance across map when set to default view).
Functions
Map Presentation and Control The Map Interface module shall provide the ability to display map products at a level of accuracy equivalent to a 1:20,000 map scale (a typical harbor chart scale for navigational charts). The Map Interface module shall implement map projections and display transformations compatible with NOAA Raster Navigational Chart (RNC) 13212 Approaches to New London Harbor and Chart 13213 New London Harbor and Vicinity. The Map Interface shall provide the ability to center a map on the Escort Command vessel position obtained from on-board Differential GPS systems via the Smiths Detection interface. The position of the map will be adjusted in real time to follow the motion of the Escort Command vessel. The Map Interface shall provide the ability to orient the map display based on the Escort Command vessel heading. The Map Interface shall provide the ability to orient the map display to its standard vertical orientation. The Map Interface shall provide the user a control to select whether the map is displayed in its standard orientation or to associate the orientation with the Escort Command vessel heading. The Map Interface shall provide the user with a control to select scale of the map through a zoom in/out operation. The Map Interface shall provide the user with the ability to pan the map and adjust its area of interest (within the limits of the available map products and real-time data). The Map Interface shall provide a user control that resets the map to its default map size and position (centered on the Escort Command vessel).
Contact Display and Interactions The Map Interface shall provide the ability to display all vessels in the Escort Group with appropriate symbols. The Map Interface shall provide the ability to display HVU Exclusion Zone around the position of the HVU. The Map Interface shall indicate the positions and courses of contact data obtained through the Smiths Detection Contact/Sensor Manager API by displaying these contacts with appropriate symbols. The Map Interface shall allow a user to select a contact by pressing the touch screen for a sufficient period of time at the position associated with the contact. When a contact is selected, the Map Interface shall adjust its display characteristics in a manner to indicate its selection. Possible visual cues for a selected contact include display with an enlarged icon or symbol, highlighting, and display of track history information. When a contact is selected, the Map Interface shall provide textual information giving data available from the Contact/Sensor Manager, including course, speed, name (if available), and other AIS-derived metadata (as available).

F-12
A distinct symbol will be provided for contacts of unknown characteristics (such as Radar derived contacts with no associated AIS information). The Map Interface module shall use Maritime Mobile Service Identity (MMSI) information to identify vessels operating as part of the Patrol Group and indicate them as such on the display through the choice of appropriate symbols or other notations.
Functions Related to Camera Operation The Map Interface shall indicate the locations/positions and pan/tilt of camera assets through the placement of appropriate symbols or icons on the display. When the user selects a camera by touching its associated symbol, the Map Interface shall provide textual data giving available information about the camera including position, elevation, active status, whether the camera is mobile, and direction of view. When the user selects a camera by touching its associated symbol, the Map Interface shall provide a graphical representation of the camera’s current direction of view. When the user maintains his touch with a camera long enough, the Map Interface shall invoke the Smith Detection API to connect streaming video from the camera to the display. The operation of the streaming video and associated graphics will be under the management of the Smiths Detection software. When the user touches the camera icon within the Information Block of a tactical element (e.g., a vessel contact) the Map Interface shall pan the nearest camera to look at the map position indicated. A timer shall be activated so that the nearest camera (which may be moving) will periodically re-orient to point at the selected map position. If there is a contact within a designated number of yards (to be specified in pre-underway setup of the system) of the map position indicated, the timer shall retrieve the updated position of that tactical element (e.g., contact) prior to issuing the command to re-orient the nearest camera.
Performance Requirements The Map Interface shall operate as continually updated, real-time display of sensor, contact and map data. The Map Interface shall handle up to 50 contacts (50 is expected to be a testable value based on a heavily trafficked waterway such as the Thames River in CT).
Logical Database Requirements The Map Interface shall use the Smiths Detection API to manage real-time database requirements.
Design Constraints Software language, design, and API selections shall be compatible with Smith Detection API and software modules.
Software System Attributes
Reliability The Map Interface shall operate for the duration of the escort operation (up to 6 hours) provided that the system is not interrupted due to power failure, hardware failure, computer shutdown or reboot, or other factor outside the control of the Sonalysts provided software.
F-13
Availability The user-functions provided by the Map Interface shall be available at all times while the system is operating (image processing and display creating will occur in a background process and will not interfere with the user interactions or functions).
Security Not applicable.
Maintainability Not applicable.
Portability Not applicable.
Change Management Process All changes to this document are under the control of the Sonalysts Configuration Control Board. See the change log at the beginning of this document
Document Approvals All approvals will be documented in the change log at the beginning of this document.
Supporting Information The following text was extracted from the original Request for Quotation (Request No. N00189-09-T-G207). It is provided here for reference purposes.
F-14
Dispatch Weather System Software Display Minimum Requirements: 1. Proven software with the ability to manage and display geo-referenced, real-time data from multiple sensor inputs 2. Provide a kiosk-style interface including: a. Implemented user interactions and buttons b. Digital artwork and icons to represent own-ship, high-value unit, contact locations and sensor locations c. Presenting high-resolution digital nautical charts able to be viewed in day-light and low-light conditions d. Display outputs that accommodate the marine environment 3. Ability to interface with existing Government software, which is written in Java-based code a. Integration/ query with the on-board sensor integration system database which includes ARPA Radar and AIS contact correlated positions b. Integration with video streams from Government installed visual/ IR cameras to allow for user selection of desired feeds and tracking data c. Integration with Differential GPS currently installed on US Coast Guard boats d. Integration with contact data in GCS WGS 1984 Coordinate system (D_WGS_1984 Datum) 4. Install software on Government (US Navy) supplied multi-touch or standard touch screen
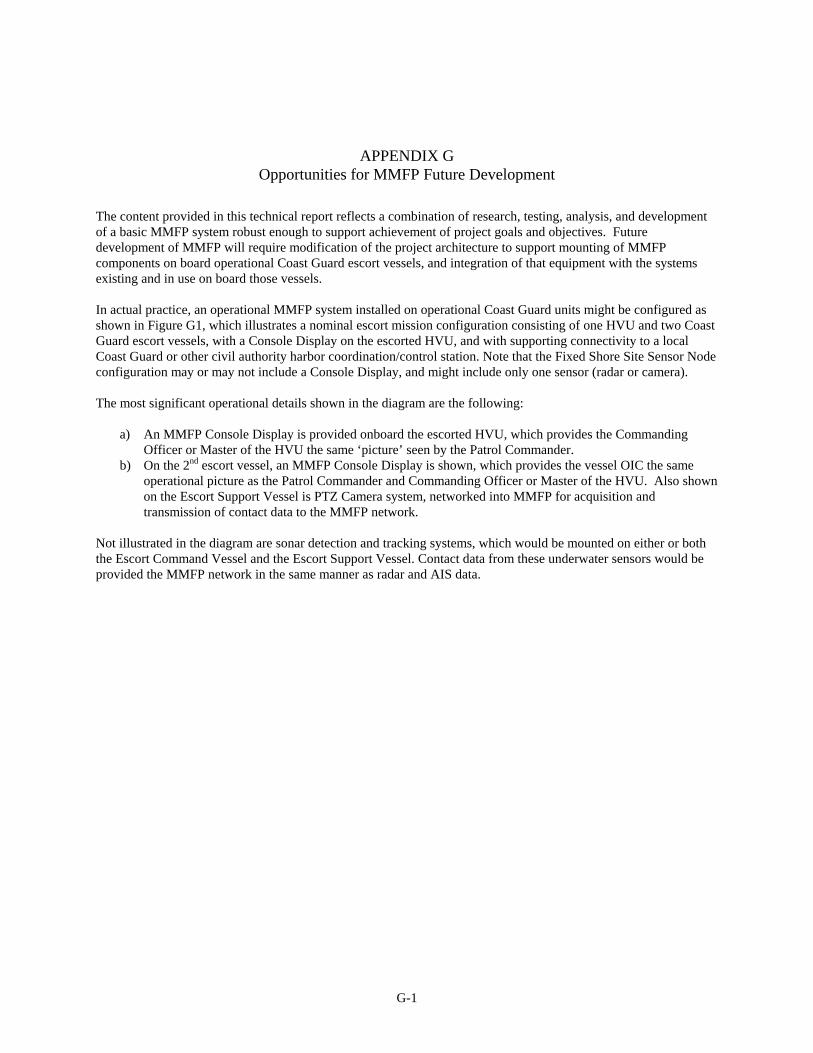
G-1
APPENDIX G Opportunities for MMFP Future Development
The content provided in this technical report reflects a combination of research, testing, analysis, and development of a basic MMFP system robust enough to support achievement of project goals and objectives. Future development of MMFP will require modification of the project architecture to support mounting of MMFP components on board operational Coast Guard escort vessels, and integration of that equipment with the systems existing and in use on board those vessels. In actual practice, an operational MMFP system installed on operational Coast Guard units might be configured as shown in Figure G1, which illustrates a nominal escort mission configuration consisting of one HVU and two Coast Guard escort vessels, with a Console Display on the escorted HVU, and with supporting connectivity to a local Coast Guard or other civil authority harbor coordination/control station. Note that the Fixed Shore Site Sensor Node configuration may or may not include a Console Display, and might include only one sensor (radar or camera). The most significant operational details shown in the diagram are the following:
a) An MMFP Console Display is provided onboard the escorted HVU, which provides the Commanding Officer or Master of the HVU the same ‘picture’ seen by the Patrol Commander.
b) On the 2nd escort vessel, an MMFP Console Display is shown, which provides the vessel OIC the same operational picture as the Patrol Commander and Commanding Officer or Master of the HVU. Also shown on the Escort Support Vessel is PTZ Camera system, networked into MMFP for acquisition and transmission of contact data to the MMFP network.
Not illustrated in the diagram are sonar detection and tracking systems, which would be mounted on either or both the Escort Command Vessel and the Escort Support Vessel. Contact data from these underwater sensors would be provided the MMFP network in the same manner as radar and AIS data.
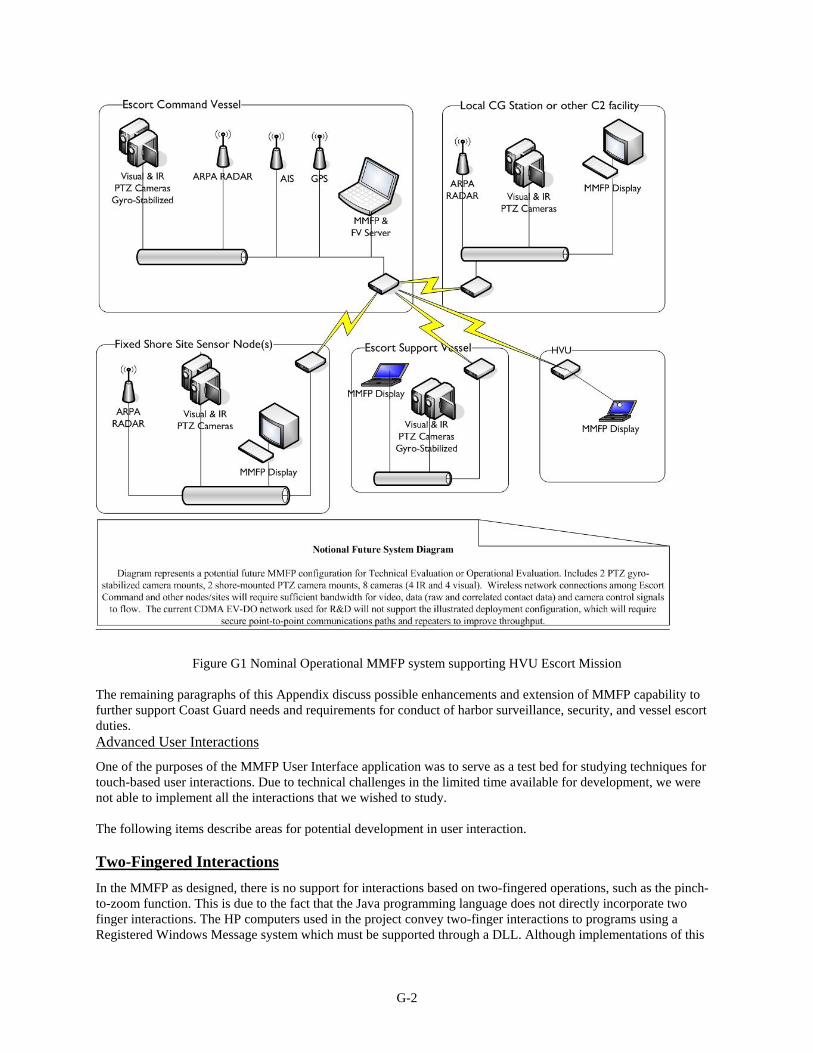
G-2
Figure G1 Nominal Operational MMFP system supporting HVU Escort Mission
The remaining paragraphs of this Appendix discuss possible enhancements and extension of MMFP capability to further support Coast Guard needs and requirements for conduct of harbor surveillance, security, and vessel escort duties. Advanced User Interactions
One of the purposes of the MMFP User Interface application was to serve as a test bed for studying techniques for touch-based user interactions. Due to technical challenges in the limited time available for development, we were not able to implement all the interactions that we wished to study. The following items describe areas for potential development in user interaction. Two-Fingered Interactions
In the MMFP as designed, there is no support for interactions based on two-fingered operations, such as the pinch-to-zoom function. This is due to the fact that the Java programming language does not directly incorporate two finger interactions. The HP computers used in the project convey two-finger interactions to programs using a Registered Windows Message system which must be supported through a DLL. Although implementations of this
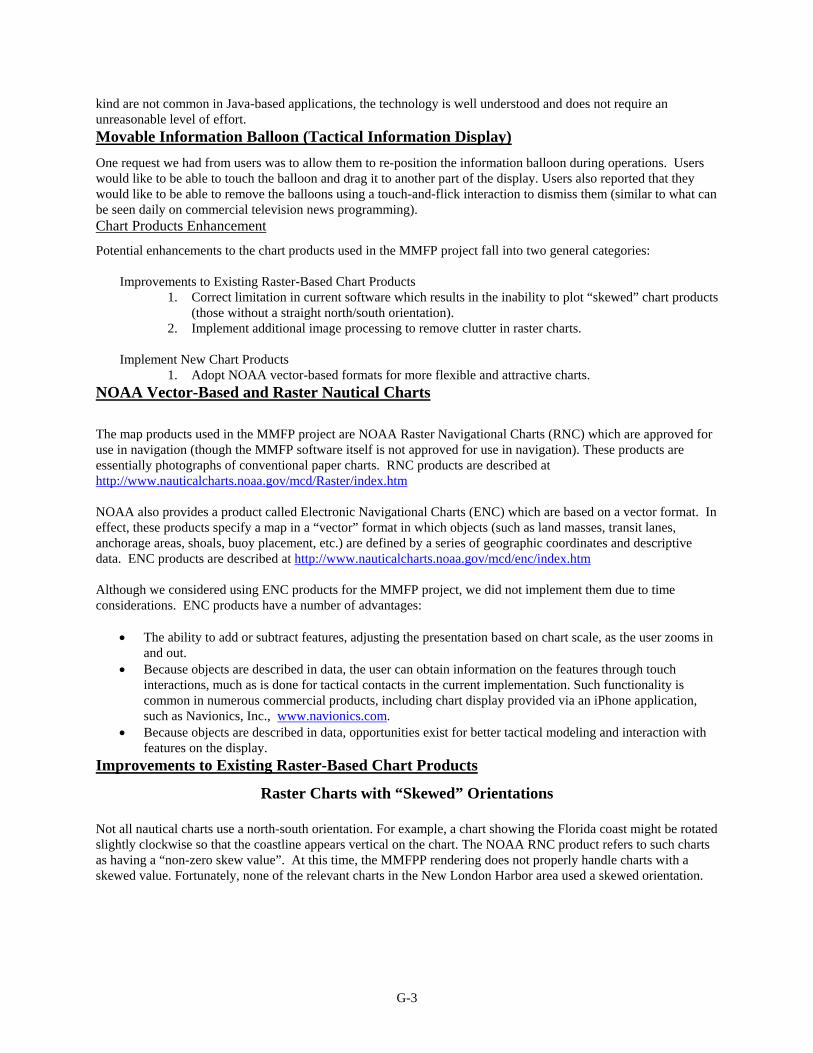
G-3
kind are not common in Java-based applications, the technology is well understood and does not require an unreasonable level of effort. Movable Information Balloon (Tactical Information Display)
One request we had from users was to allow them to re-position the information balloon during operations. Users would like to be able to touch the balloon and drag it to another part of the display. Users also reported that they would like to be able to remove the balloons using a touch-and-flick interaction to dismiss them (similar to what can be seen daily on commercial television news programming). Chart Products Enhancement
Potential enhancements to the chart products used in the MMFP project fall into two general categories:
Improvements to Existing Raster-Based Chart Products 1. Correct limitation in current software which results in the inability to plot “skewed” chart products
(those without a straight north/south orientation). 2. Implement additional image processing to remove clutter in raster charts.
Implement New Chart Products 1. Adopt NOAA vector-based formats for more flexible and attractive charts.
NOAA Vector-Based and Raster Nautical Charts
The map products used in the MMFP project are NOAA Raster Navigational Charts (RNC) which are approved for use in navigation (though the MMFP software itself is not approved for use in navigation). These products are essentially photographs of conventional paper charts. RNC products are described at http://www.nauticalcharts.noaa.gov/mcd/Raster/index.htm NOAA also provides a product called Electronic Navigational Charts (ENC) which are based on a vector format. In effect, these products specify a map in a “vector” format in which objects (such as land masses, transit lanes, anchorage areas, shoals, buoy placement, etc.) are defined by a series of geographic coordinates and descriptive data. ENC products are described at http://www.nauticalcharts.noaa.gov/mcd/enc/index.htm Although we considered using ENC products for the MMFP project, we did not implement them due to time considerations. ENC products have a number of advantages:
The ability to add or subtract features, adjusting the presentation based on chart scale, as the user zooms in and out.
Because objects are described in data, the user can obtain information on the features through touch interactions, much as is done for tactical contacts in the current implementation. Such functionality is common in numerous commercial products, including chart display provided via an iPhone application, such as Navionics, Inc., www.navionics.com.
Because objects are described in data, opportunities exist for better tactical modeling and interaction with features on the display.
Improvements to Existing Raster-Based Chart Products
Raster Charts with “Skewed” Orientations
Not all nautical charts use a north-south orientation. For example, a chart showing the Florida coast might be rotated slightly clockwise so that the coastline appears vertical on the chart. The NOAA RNC product refers to such charts as having a “non-zero skew value”. At this time, the MMFPP rendering does not properly handle charts with a skewed value. Fortunately, none of the relevant charts in the New London Harbor area used a skewed orientation.
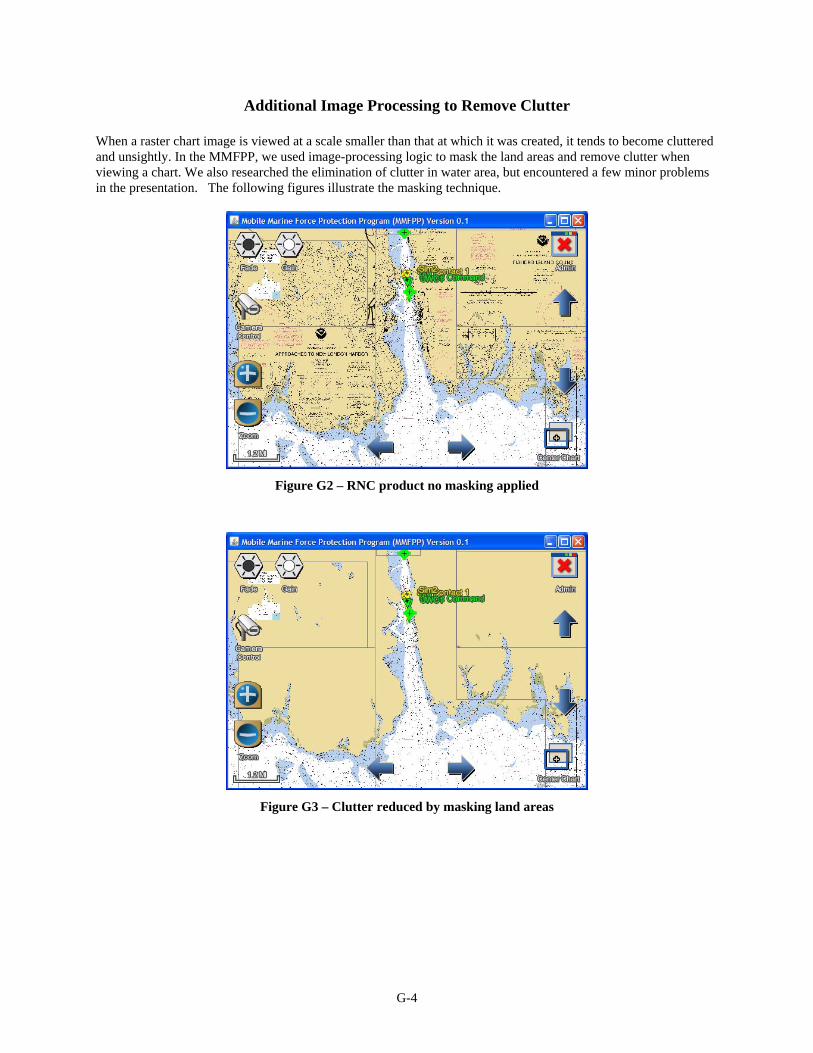
G-4
Additional Image Processing to Remove Clutter
When a raster chart image is viewed at a scale smaller than that at which it was created, it tends to become cluttered and unsightly. In the MMFPP, we used image-processing logic to mask the land areas and remove clutter when viewing a chart. We also researched the elimination of clutter in water area, but encountered a few minor problems in the presentation. The following figures illustrate the masking technique.
Figure G2 – RNC product no masking applied
Figure G3 – Clutter reduced by masking land areas
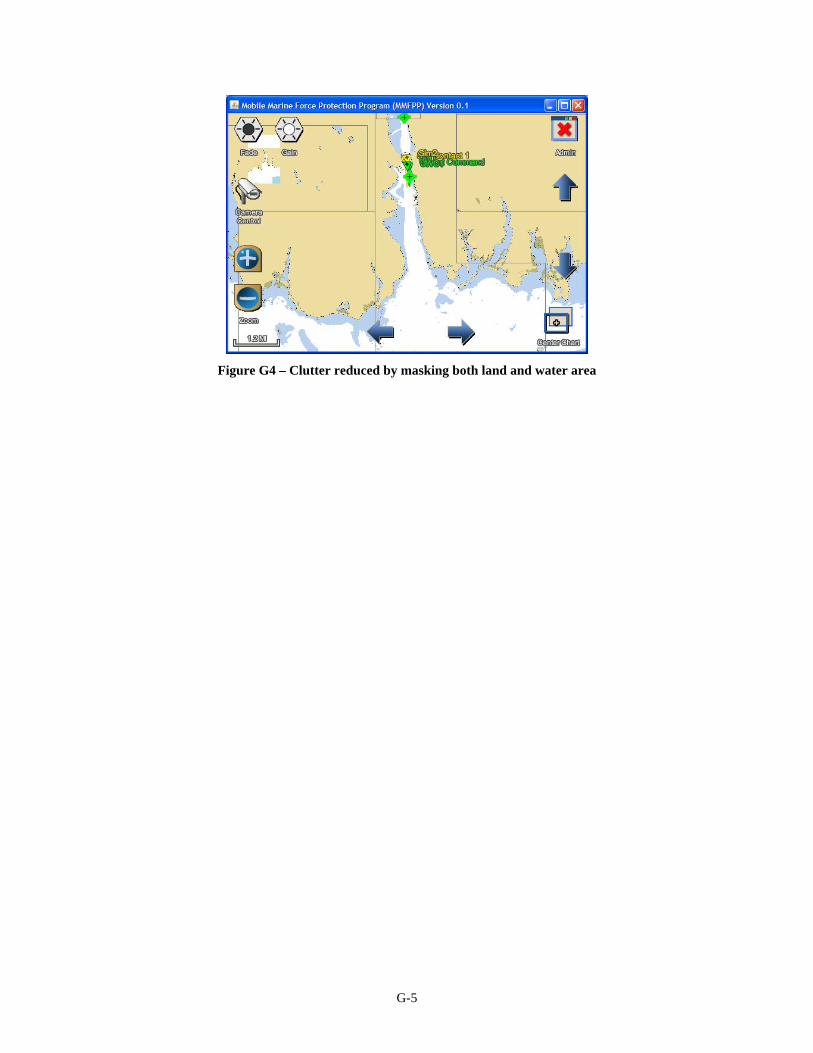
G-5
Figure G4 – Clutter reduced by masking both land and water area