Embed Size (px)
Citation preview
UNIVERSIDADE DE LISBOA
Faculdade de Ciências
Departamento de Biologia Animal
THE EFFECTS OF MACRONUTRIENT COMPOSITION OF
THE LARVAL DIET ON LIFE HISTORY TRAITS AND
PIGMENTATION IN DROSOPHILA VIRILIS
Marisa Almeida Rodrigues
DISSERTAÇÃO
MESTRADO EM BIOLOGIA EVOLUTIVA E DO DESENVOLVIMENTO
2014

UNIVERSIDADE DE LISBOA
Faculdade de Ciências
Departamento de Biologia Animal
THE EFFECTS OF MACRONUTRIENT COMPOSITION OF
THE LARVAL DIET ON LIFE HISTORY TRAITS AND
PIGMENTATION IN DROSOPHILA VIRILIS
Marisa Almeida Rodrigues
Dissertação orientada por:
Professor Doutor José Élio Sucena (DBA/FCUL)
Doutora Christen Kerry Mirth (IGC)
MESTRADO EM BIOLOGIA EVOLUTIVA E DO DESENVOLVIMENTO
2014

Acknowledgements
I want to thank to my advisors Élio Sucena and Christen Mirth, who left me work on
this project. Especially to Christen, who is an amazing Bossinha, who supported me in
(almost) all my crazy ideas and for everything I have learned with her. Who always
supported and helped me in the last years.
To all DEE lab members, Claudia, Maria, Nuno and Andreia, for all the ideas, help
and support. To Takashi Koyama for all the crazy moments and Marisa Oliveira, who
taught me the wonders of a good break and how to do real schedules. Thank you for all the
support and help!
To all the people from Instituto Gulbenkian de Ciência, the nice girls from fly facility,
Nelson Martins (Evolution and Development Lab), Elvira Lafuente (Variation:
Development and Selection Lab) and will Filipa Alves (Biophysics and Genetics of
Morphogenesis).
To my family and all my friends who understood my absences in this last year.
Á Telma Laurentino, for all the support she gave me, for her friendship and sincerity.
Finally but not least, to Fábio Santos for being always there, in good and bad times,
for his big patience and support.
Without you it would not have been so remarkable!


A ti avó... que criaste em mim o amor pela Biologia.
Fazes-me falta...

i
ii
Abstract
One of the main contributions for an animal’s life success is an optimal nutrition.
Macronutrients, such as proteins and carbohydrates, are essential for organism
development, determining for example, the size of the body and or reproductive
capacity. Different animals use macronutrients differently. To achieve the necessary
requirements, generalist species use a wide range of substrates, whereas specialist
species are specialised in one type of substrate. In general, animals balance their food
intake to achieve nutritional optima, referred as intake target. Uncovering an animal’s
intake target requires solving the problem of balancing multiple and changing nutrient
needs in a variable nutritional environment. To address this we can study the nutritional
geometry framework of an animal. Foraging decisions can then be described within this
nutrient space, however these decisions may bring consequences for the animals’
development. In this thesis, we measured the influence of unbalanced larval diets on life
history traits, such as survival, developmental time, body size, ovariole number and
pupal case pigmentation. We also addressed this by analysing the consequences on
foraging behaviour. We found that Drosophila virilis maximises life history traits at a
high protein to carbohydrate ratio and pupal pigmentation changes by increasing the
content of protein on larval diet. However, larvae do not regulate their intake to
maximise any trait responses.
Since intake target changes over developmental time and evolutionary time, we
expected to see differences between generalists and specialists species. We used our
previous data from Drosophila melanogaster, a generalist species, to compare with the
results from this thesis. We saw differences, whereas D. virilis seem to be more tolerant
to high proteins than D. melanogaster but less tolerant to high carbohydrates content.
Depending on their feeding strategies, species will always differ in nutritional
requirements and foraging strategies in unbalance nutritional environments.
Keywords: nutritional geometry, intake target, life history traits, foraging behaviour,
pigmentation.

iii

iv
Resumo
A qualidade nutricional da comida é essencial ao desenvolvimento dos organismos.
Sabemos que os macronutrientes, entre eles as proteínas e os hidratos de carbono, são
importantes para formação e manutenção de tecidos ou fornece uma das principais
fontes de energia aos processos metabólicos, respectivamente. A alimentação é o único
meio pelo qual os organismos conseguem adquirir os nutrientes de que necessitam,
sendo que as suas necessidades não são sempre as mesmas. Dependendo da espécie,
cada nutriente é necessário em quantidades distintas, assim como a relação entre
nutrientes é variável..
Os animais regulam e tomam decisões relativamente à comida ingerida. Estratégias
de comportamento relativas à alimentação foram desenvolvidas consoante as
necessidades de cada espécie. Dois grupos podem ser definidos, relativamente a estas
estratégias: espécies generalistas, que são espécies que usam uma gama variada de
substratos para satisfazer as suas necessidades nutricionais; e espécies especialistas que
satisfazem as suas necessidades nutricionais utilizando um número muito restrito de
substratos. Os substratos sofrem alterações nutricionais ao longo do tempo. Embora o
ambiente seja responsável por parte dessas alterações, microrganismos desempenham
um papel fundamental e, por isso, nem sempre existe um substrato com a composição
nutricional ideal que se mantenha por muito tempo. Devido ao carácter nutricional
instável de cada substrato, os animais ponderam quais as escolhas possíveis de forma a
atingir os valores nutricionais ótimos para o seu desenvolvimento, que se define como
alvo nutricional.
O alvo nutricional pode ser encontrado usando o método desenvolvido por Steve J.
Simpson e David Raubenheimer em 1990, o modelo de geometria nutricional. Este
método permite criar um espaço nutricional com base num gradiente de concentrações
de dois nutrientes e avaliar as decisões dos animais nesse espaço. Este método permite-
nos descrever como os animais se comportam em três cenários diferentes. Primeiro, têm
à sua disposição uma dieta equilibrada, e comem até atingirem os níveis nutricionais
ótimos. Segundo, podem ter à disposição duas dietas, ambas desequilibradas, o que
resulta numa ingestão alternada de ambas as dietas para que se possa atingir os níveis
nutricionais ideias. Terceiro, apenas está disponível uma única dieta, que é
desequilibrada. Neste caso, existem duas decisões possíveis para que os animais
atingirem os níveis ótimos. Uma alternativa é que um dos nutrientes se revela mais
importante, e a quantidade ingerida é regulada de forma e atingir os níveis ótimos
apenas para essa nutriente, ingerindo o segundo em excesso ou em défice. A outra
alternativa é a ingestão de níveis intermédios para ambos os nutrientes. Para descobrir o
alvo nutricional é necessário explorar como é que os animais tomam estas decisões,
como é que preenchem as suas necessidades nutricionais num ambiente
nutricionalmente variável. Este método já deu provas do seu potencial, desde de

v
mamíferos, como humanos e ratos, a invertebrados, como gafanhotos, escaravelhos,
aranhas e moscas, onde foi verificado que todos estes animais regulam a ingestão de
nutrientes (Simpson and Raubenheimer, 2005; Mayntx et al., 2005).
O mesmo alvo nutricional pode não ser mantido ao longo da vida do animal,
sofrendo mudanças dependendo da espécie. No entanto, também se altera consoante o
estado fisiológico e estadio do ciclo de vida. Por exemplo, quando a mosca da fruta,
Ceratitis capitata está perto da metamorfose, o seu alvo nutricional deixa de ser
maioritariamente proteico e passa a conter alto teor de hidratos de carbono, que irão
providenciar energia para a fase que precede a metamorfose (Zucoloto, 1987). O alvo
nutricional também se altera quando as fêmeas de Drosophila melanogaster acasalam
(Ribeiro and Dickson, 2010). Após acasalarem, a produção de ovos é estimulada e as
fêmeas passam a consumir uma dieta mais rica em proteínas do que as que ainda são
virgens. O consumo de dietas proteínas em gafanhotos é alterado para um menor
consumo de proteína quando deixa de haver crescimento de tecidos (Raubenheimer and
Simpson 1999).
As espécies generalistas e as especialistas podem ter o mesmo alvo nutricional mas
desenvolveram diferentes estratégias para o atingir. As suas necessidades nutricionais
podem ser diferentes, como é o caso da Schistocerca gergaria, uma espécie
generalistas, que mostra maior tolerância a elevados níveis de proteína do que a espécie
especialista, Locusta migratoria (Raubenheimer and Simpson, 2003). A mesma situação
foi encontrada em espécies de Lepidoptera generalistas e especialistas (Lee et al., 2002
and 2003).
Nesta tese, decidimos primeiro avaliar com este método como as características
que têm um papel na fitness dos animais é afetada pelos macronutrientes, proteínas e
hidratos de carbono, na espécie especialista, Drosophila virilis. Esta espécie tem como
principal fonte de alimento a seiva das árvores. Por fim, comparamos a resposta de uma
espécie generalista (D. melanogaster), descrita anteriormente e da espécie especialista
(D. virilis) descrita nesta tese.
As características avaliadas são conhecidas por serem influenciadas por diferentes
ambientes nutricionais. O tempo de desenvolvimento da fase larval é afectado pela
nutrição, tal como a sobrevivência. Também estudámos a influência de dietas
desequilibradas no tamanho do corpo de adulto, pesando as pupas antes do adulto
emergir. Observámos que quanto mais pobre em proteína é a dieta mais pequenos são os
indivíduos. O número de filamentos que constituem os ovários, chamados de ovaríolos,
está diretamente relacionado com o número de ovos que uma fêmea irá pôr, ao longo da
vida, e varia com a qualidade da dieta. Sendo Drosophila um organismo holometábolo,
ou seja, sofre uma total metamorfose antes da fase adulta. Uma vez que é nesta fase que
todos os tecidos e órgão se preparam para dar origem às estruturas e órgãos do adulto,
todas as características descritas neste estudo são analisadas na fase larval. Depois da
metamorfose os indivíduos param o seu crescimento, ou seja o tamanho do adulto é
definido na fase de larva. Também o número de ovaríolos é determinado na fase de
larva.

vi
Para conseguirmos desvendar a influência dos macronutrientes, fornecemos aos
indivíduos, várias dietas que diferiam entre si pelo rácio entre proteínas e hidratos de
carbono (rácio P:C) e também no seu teor calórico. Com o nosso espaço nutricional
definido, analisámos quando indivíduos formaram pupa, quando tempo demoraram até
formarem pupa, qual o seu peso antes do adulto emergir e o no caso das fêmeas quantos
ovaríolos têm em ambos os ovários.
Os nossos resultados mostraram que é nas dietas com um rácio entre proteínas e
hidratos de carbono elevado que os indivíduos maximizaram a sua sobrevivência,
tamanho do corpo e número de ovaríolos, e minimizam o tempo de desenvolvimento.
Enquanto que no caso de D. melanogaster, as diferentes características foram
maximizadas por diferentes dietas.
Decidimos em seguida analisar o como as larvas de D. virilis reagem quando
confrontadas com um ambiente de duas dietas desequilibradas. Que decisões irão
tomar? Esta parte do processo baseou-se em analisarmos o comportamentos tanto das
larvas como das fêmeas adultas.
No caso das larvas, analisámos as decisões que estes indivíduos tomaram para
satisfazerem os seus requisitos nutricionais. O nosso procedimento passou por usar
larvas no terceiro estádio larvar e dar-lhes duas opções de dietas. Verificámos que, de
facto, as larvas regulam a quantidade de ambas as dietas ingeridas de modo a alcançar
valores específicos de proteína e hidratos de carbono, no entanto estes não
correspondem aos valores que optimizam as características acima referidas. Quando
comparado com os dados de D. Melanogaster, as larvas regularam a ingestão dos
nutrientes de forma a minimizar o tempo de desenvolvimento.
Relativamente ás fêmeas adultas, analisámos tanto o seu comportamento de
alimentação, como na escolha de local para oviposição. Quando as fêmeas chegaram ao
pico de fertilidade, fornecíamos a machos e fêmeas três dietas nutricionalmente
desequilibradas. Fizemos contagem de quantas fêmeas comeram de cada dieta e do
número de ovos postos em cada dieta. Os nosso resultados mostraram que as fêmeas
não fizeram nenhuma escolha sobre qual das dietas ingerir. Adicionalmente, não
encontramos nenhuma escolha de preferência para pôr os ovos. O oposto tinha sido
visto em D. melanogaster, onde as fêmeas fizeram escolhas sob qual a dieta a ingerir,
elevado teor de proteína, e em qual colocar os ovos, elevado teor de hidratos de
carbono.
Durante o protocolo do modelo de geometria nutricional, deparamo-nos com
diferenças na pigmentação dos casulos de pupa. Fizemos, então, novamente este
protocolo, de forma a quantificar as diferenças de pigmentação de acordo com as
diferentes dietas. As larvas desenvolveram-se nas mesmas dietas usadas anteriormente,
e após o adulto emergir as pupas vazia eram retiradas e fotografadas. Utilizando
Mathematica, calculámos um valor RGB da coloração de cada pupa. Os nossos
resultados mostram um gradiente de pigmentação que varia com a quantidade de
proteína na dieta. Quanto mais proteína, mais escuras são as pupas.

vii
Podemos assim concluir que os macronutrientes, de facto, influenciam tanto o
desenvolvimento dos animais como o seu comportamento. Também podemos observar
que os macronutrientes afetam de forma variada cada espécie.
Palavras-chave: modelo de geometria nutricional, alvo nutricional, nutrição,
comportamento, pigmentação.
viii
TABLE OF CONTENTS 1. INTRODUCTION ........................................................................................................... 1
1.1 STRATEGIES TO COPE WITH COMPLEX NUTRITIONAL ENVIRONMENTS ..................... 1
1.2 CHANGING TARGETS IN DEVELOPMENT AND EVOLUTION ......................................... 4
1.3 NUTRITION AND ITS IMPACTS ON DEVELOPMENT AND LIFE HISTORY TRAITS .......... 7
1.4 THE BIOLOGY OF DROSOPHILA VIRILIS ...................................................................... 11
2. METHODS .................................................................................................................... 13
2.1 DROSOPHILA SPECIES ............................................................................................... 13
2.2 PERFORMANCE OF EIGHT DROSOPHILA SPECIES ...................................................... 13
2.3 NUTRITIONAL GEOMETRY ASSAY FOR LIFE HISTORY TRAITS IN DROSOPHILA VIRILIS
................................................................................................................................................ 14
2.4 NUTRITIONAL GEOMETRY ASSAY FOR PUPAL PIGMENTATION IN DROSOPHILA VIRILIS
................................................................................................................................................ 16
2.5 STATISTICAL ANALYSES FOR NUTRITIONAL GEOMETRY EXPERIMENTS ................. 17
2.6 LARVAL INTAKE TARGET IN DROSOPHILA VIRILIS .................................................... 17
2.7 ADULT FEMALE FOOD AND OVIPOSITION SITE PREFERENCE IN DROSOPHILA VIRILIS
................................................................................................................................................ 18
2.8 STATISTICAL ANALYSES FOR FOOD AND OVIPOSITION PREFERENCE IN LARVAE AND
ADULT FEMALES ..................................................................................................................... 19
3. RESULTS ...................................................................................................................... 21
3.1 PERFORMANCE OF DROSOPHILA SPECIES IN DRY YEAST FOOD ............................... 21
3.2 NUTRITIONAL GEOMETRY OF SURVIVAL IN DROSOPHILA MOJAVENSIS SONORENSIS 21
3.3 NUTRITIONAL GEOMETRY OF DROSOPHILA VIRILIS................................................... 23
3.3.1 Survival.............................................................................................................. 23
3.3.2 Developmental Time .......................................................................................... 24
3.3.3 Pharate Weight .................................................................................................. 24
3.3.4 Ovariole Number ............................................................................................... 24
3.3.5 Comparison Between Life History Traits .......................................................... 24
3.4 NUTRITIONAL GEOMETRY FOR PUPAE PIGMENTATION ............................................ 27
3.5 FORAGING BEHAVIOUR ............................................................................................. 29
3.5.1 Larval Choice .................................................................................................... 29
3.5.2 Female Choices ................................................................................................. 31
4. DISCUSSION ................................................................................................................ 33
4.1 DROSOPHILA MOJAVENSIS SONORENSIS ...................................................................... 33
ix
4.2 DROSOPHILA VIRILIS .................................................................................................. 34
4.2.1 Survival.............................................................................................................. 34
4.2.2 Developmental Time .......................................................................................... 34
4.2.3 Body Size ........................................................................................................... 35
4.2.4 Ovariole Number ............................................................................................... 35
4.4 FORAGING BEHAVIOUR ............................................................................................. 38
4.4.1 Larval Choices .................................................................................................. 38
4.4.2 Female Choices ................................................................................................. 39
CONCLUSION ................................................................................................................. 40
BIBLIOGRAPHY ............................................................................................................. 41
SUPPLEMENTARY INFORMATION .......................................................................... 49
1
1. INTRODUCTION The nutritional environment of an organism has profound impacts on its
development, life history, behaviour and evolution. Species are adapted to different
nutritional niches, which change with time, season and with interactions with
microorganisms. Generalist species use a wider range of food sources, whereas
specialist species are more adept at using a specific, preferred substrate. Their
adaptation to different substrate breadths cause generalist and specialist species to differ
in their developmental characters, life history traits and foraging patterns.
In a previous study conducted in a generalist species of fruit fly, the common
laboratory species Drosophila melanogaster, we explored how life history characters
respond to variation in larval diet. Here, we extend this previous work to understand
how life history traits, morphological characters and foraging strategies respond to
variation in larval nutrition in a species that specializes in feeding on tree sap,
Drosophila virilis.
To these ends, we examined the responses of four life history characters and a
developmental trait, the pigmentation of the pupal case, to the protein, carbohydrate and
caloric content of the larval diet. In addition, we examined how larval and adult feeding
and oviposition choices relate to the developmental and life history responses to larval
diet. Our aim was to qualitatively compare the responses in these characters between
Drosophila species to assess how the nutritional biology of the organism changes with
differences in niche breadth.
1.1 STRATEGIES TO COPE WITH COMPLEX NUTRITIONAL
ENVIRONMENTS
Food is the only channel through which animals can get the nutrients that they
cannot themselves produce. The macronutrients, vitamins and minerals found in food
are crucial for an organism’s development and survival, but they also differ in their
functions. For example, while proteins are essential for tissue formation and
maintenance during development, reproduction and somatic maintenance, carbohydrates
and lipids provide essential sources of energy for metabolic processes in addition to
their structural functions in the cell. Thus, rather than serving simply as fuel in the form
of calories, the correct balance of macronutrients from food is necessary to ensure
correct cellular functions.
Animals balance their food intake to reach their desired combination of
macronutrients, their so-called intake target (Simpson and Raubenheimer, 1993).
Uncovering an animal’s intake target requires exploring how an animal solves the
problem of balancing multiple and changing nutrient needs in a variable nutritional
environment. In practical terms, this can be found using the nutritional geometry
framework, a method developed by Steve J. Simpson and David Raubenheimer in early
1990’s that co-varies the concentration of two nutrients across a range of values to
generate a nutrient space and assessing how animals make foraging decisions within
2
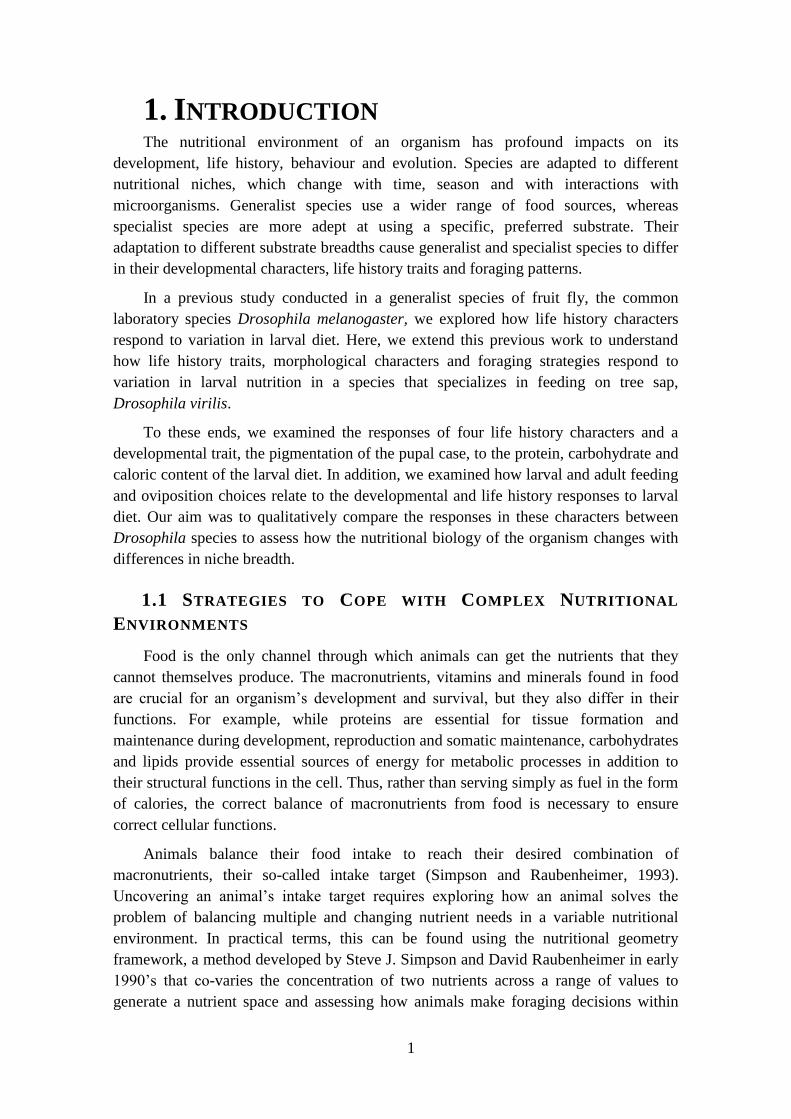
this space. The nutritional geometry framework describes how animals make foraging
decisions using three different scenarios.
Scenario 1 – Nutrient regulation on a balanced substrate. In this case the animal
has available a source of food already containing its desired balance of macronutrients.
To reach its intake target, the animal only needs to regulate the amount of food it
consumes (Figure 1.1-A) (Raubenheimer and Simpson 1999).
Scenario 2 – Nutrient regulation on an unbalanced substrate. Here, the substrate
available is nutritionally unbalanced (Figure 1.1-B). In this case by eating this substrate
the animal will never reach its intake target, and is forced to make decisions about how
to trade-off between paucity versus excess of the two nutrients.
Scenario 3 – Nutrient regulation between two unbalanced foods. In this scenario,
animals can choose between two nutritionally-unbalanced substrates (Figure 1.1-C).
Here the animal can reach its intake target by alternately ingesting both substrates.
Figure 1.1 – Representation of the nutrient space and the balance of nutrient is described by a linear
trajectory. (A) When animals feed on balance food and reach the intake target. (B) When animals can
only feed on an unbalance food, consequently animals do not reaching the intake target. (C) When exists
two unbalance food available, switching between both foods, animals can reach the intake target. Figure
redrawn from Raubenheimer and Simpson, 1999.
Exploring foraging strategies using these three scenarios provides substantial
information about how animals make foraging decisions. Either balanced or
complementary diets can be used to uncover the animal’s target intake. In unbalanced
diets, we can explore the rules of compromise when the intake target cannot be reached.
If nutrient 1 is more important, animals will regulate their ingestion to reach that
optimal amount, even if it means that they have to ingest an excessive amount of the
nutrient 2. Alternatively, animals can choose to minimize the excess and deficit, or
nutritional error, of both nutrients (Simpson and Raubenheimer, 1993).
We can obtain limited information regarding the rules of compromise for a single
unbalanced food. A complete exploration of these rules implies observing intake
strategies over several unbalanced diets. In this way, we can represent the foraging
strategy an animal uses by the shape of its intake array relative to the animal’s actual
3
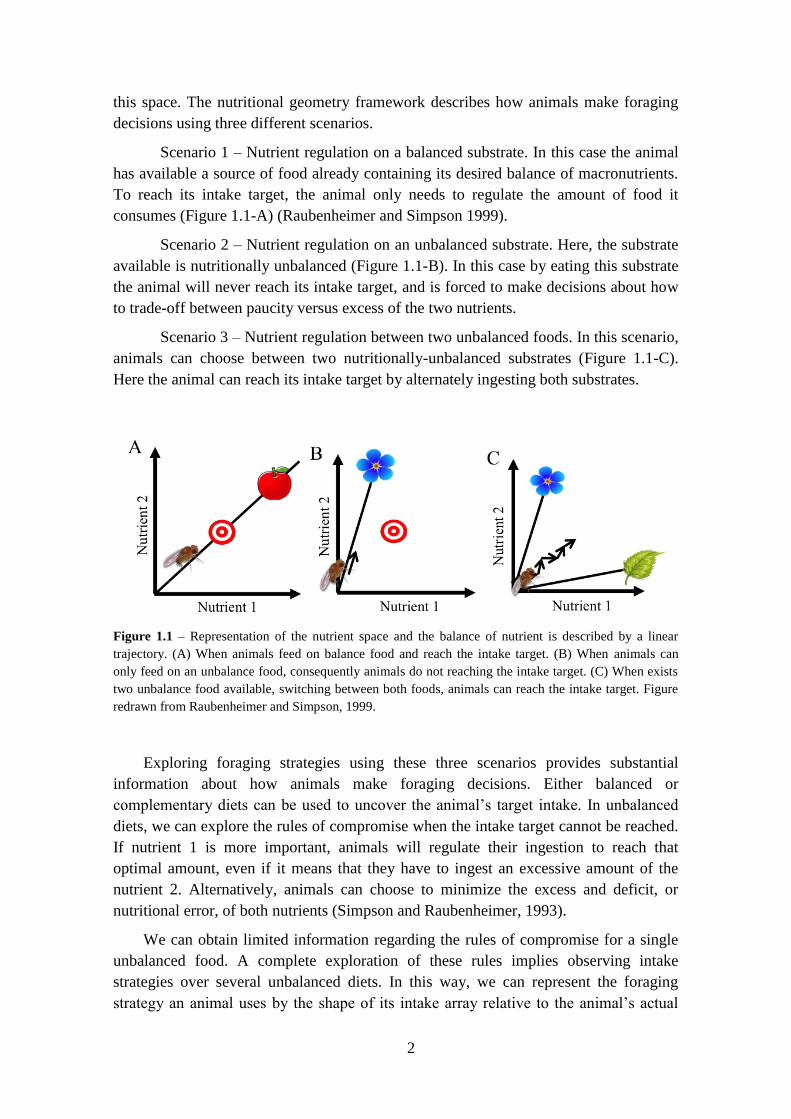
intake target (Simpson and Raubenheimer, 2012.). Based on simple decisions like the
above, animals will follow different rules, dependently of what is more important for
them:
1. They can eat the same volume of food without regulating for nutrient intake;
2. They eat to reach intake target levels for one of the nutrients, without regulating
the intake of the second nutrient;
3. They can try to reach the intake target for both nutrients, even if this means that
one nutrient is ingested in excess (Figure 1.2-A);
4. They eat until they reach the target levels for one of the nutrients, then they will
stop eating, which will result in a under consumption of the other nutrient;
5. They eat until the sum of both nutrients ingested is equal to their sum at the
intake target (Figure 1.2-B);
6.They eat until they reach the closest geometrical point to the intake target,
thereby minimizing nutritional error (Figure 1.2-C).
Figure 1.2 – Rules of Compromise. Three examples of rules of compromise, when animals try to reach
the intake target for both nutrients, and consequently ingest the other nutrient in excess (A); when animals
regulate to ingest a total of booth nutrients that is equal to the intake target (B) and when they ingest till
they reach the closest geometric point to the intake target (C). Adapted from Simpson and Raubenheimer,
2012.
Intake target is described as the nutritional point that gives the best nutritional
conditions for animals. However, we do not understand completely what are the
physiologic consequences for animals due to the over or under consumptions of
nutrients.
All types of animals have been shown to actively regulate their nutrient intake, not
just in terms of calories but to balance the proportion and quantities of macronutrients,
vitamins and salts (Trumper and Simpson, 1993). For humans, body weight is correlated
with many aspects of health. Simpson and co-workers, in 2003, showed that humans
balance their nutrient intake by prioritizing the acquisition of protein over that of
carbohydrate. When faced with a high protein – low carbohydrates diet they over eat
proteins in a smaller percentage then they under eat carbohydrates, whereas in a low
protein – high carbohydrates diet they over eat carbohydrates to be able to maintain the
optimal levels of protein (Simpson et al., 2003). This means that when offered food
4
high in carbohydrates but low in protein, humans will over-consume carbohydrates to
reach their protein target. Further, diets high in protein result in weight loss, since
humans will not over-consume protein to reach their carbohydrate target and thus ingest
fewer calories overall (Simpson and Raubenheimer, 2005). In mice were also found that
when faced with low protein food, their carbohydrates intake also increases (Huang et
al., 2013).
The ability to regulate macronutrient intake also extends to invertebrates. Many
species of arthropods, like beetles, fruit flies and spiders, regulate their nutrient intake
(Mayntz et al., 2005) although they do this using a variety of strategies. The ground
beetle (Agonum dorsale) selects their prey with respect to its nutritional composition,
whereas wolf spiders (Pardosa prativaga) adjust the intake of a single prey depending
on their own requirements. The web-building spider Stegodyphus lineatus extracts from
the prey only the required nutrients. Not only do they regulate their nutrient intake, they
evaluate which prey would be more suitable to satisfy their nutritional requirements at
the time.
Taken together, these studies highlight the power of the nutritional geometry
framework in understanding the foraging strategies animals use while foraging.
Although exploring intake targets and rules of compromise provide important
information regarding how animals make foraging decisions, they do not tell us why
they make these decisions. This requires a different approach, using nutritional
geometry to explore the effects on developmental and life history related traits.
1.2 CHANGING TARGETS IN DEVELOPMENT AND EVOLUTION
Nutritional intake targets change over developmental and evolutionary time
(Simpson and Raubenheimer, 1993). In the Mediterranean fruit fly, Ceratitis capitata,
2-day old larvae show preference for protein, important for development, whereas at 6
days they tend to prefer carbohydrates, an energy source for the wandering stage
(Zucoloto, 1987). Adults also change their intake target; after five days of feeding,
female Locusta migratoria decrease the amount of protein ingested relative to
carbohydrates (Raubenheimer and Simpson, 1999). This change corresponds to the time
when tissue growth declines. After mating, the physiological conditions of females
change and, coupled to that, the nutritional requirements also change. In D.
melanogaster mated females show preference for yeast after three days of yeast
deprivation. Virgin females kept under the same conditions prefer sugar to yeast
(Ribeiro and Dickson, 2010). After mating, females increase egg production. Their
preference for yeast is related to the fact that yeast is an important protein source to
sustain egg development (Drummond-Barbosa and Spradling, 2001). Thus, alterations
in developmental or metabolic programs throughout the animal’s life shifts the
combination of macronutrients required.
In addition to stage-specific nutrient requirements, species that occupy different
trophic levels differ in the particular balance of macronutrients they require. As the
trophic levels ascend, the range of macronutrient concentrations available become more

5
narrow. Further, intake targets increase in protein concentration with increased trophic
level. Herbivores (trophic level 2), due to their wider range of macronutrient
compositions in their diet tend to prioritize protein acquisition more than predators
(trophic level 3). On the other hand, the protein-rich diet of predators cause them to
prioritize lipid consumption over protein consumption. Thus, intake target and the
foraging strategies used to attain these targets are partly determined by the trophic level
an animal occupies.
Within their trophic levels, animals can be grouped into one of two different
foraging strategies. Some are able to use a wide variety of substrates (generalists),
whereas others are specialists that use a limited range of substrates. Generalist and
specialist species differ not only in their breadth of substrates used, but also tend to
differ in their tolerance to macronutrient concentrations (Figure 1.3). Due to their
greater resource availability, which increases the quantity of available food, generalists
tend to achieve the correct balance of nutrients by complementing their diets with a
variety of substrates (Bernays and Minkenberg, 1997). Further, when restricted to an
unbalanced food generalist species can tolerate ingesting larger quantities of the nutrient
in excess to compensate for the scarce nutrient. Specialist species are more prone to
nutrient toxicity (Raubenheimer and Jones, 2006).
This difference in diet range has been demonstrated in the generalist, Schistocerca
gergaria, and the specialist, Locusta migratoria, in ad libitum conditions on balanced
diets the generalist specie ingests more protein than carbohydrates, contrary to the
specialist. When are both species fed on unbalanced diets, they both minimize their
nutritional error, however generalist ingests a higher excess of protein compared with
the specialist. This suggests that the generalist species, S. gregaria, is better suited to
tolerate excess protein than the specialist (Raubenheimer and Simpson, 2003).
Similarly, comparisons between two closely-related caterpillars, Spodoptera littoralis, a
generalist species, and Spodoptera exempta, a specialist species, showed similar results.
The intake target of S. littoralis sits at a higher P:C ratio than that of S. exempta. When
faced with unbalanced diets, the generalist over-consumes more protein than the
specialist (Lee et al., 2002; Lee et al., 2003).
Even within a species, animals can show plasticity in their foraging strategies.
Schistocerca gergaria can be gregarious or solitarious depending on population density.
These two phases differ in their nutrient regulation. Since the gregarious form is more
mobile, it encounters a wider range of food sources. Thus, it presents a nutrient
regulation pattern similar to generalist species, being able to over eat protein in the
presence of unbalanced diet. The solitarious morph consumes less excess protein than
the gregarious morph (Simpson et al., 2002).
6
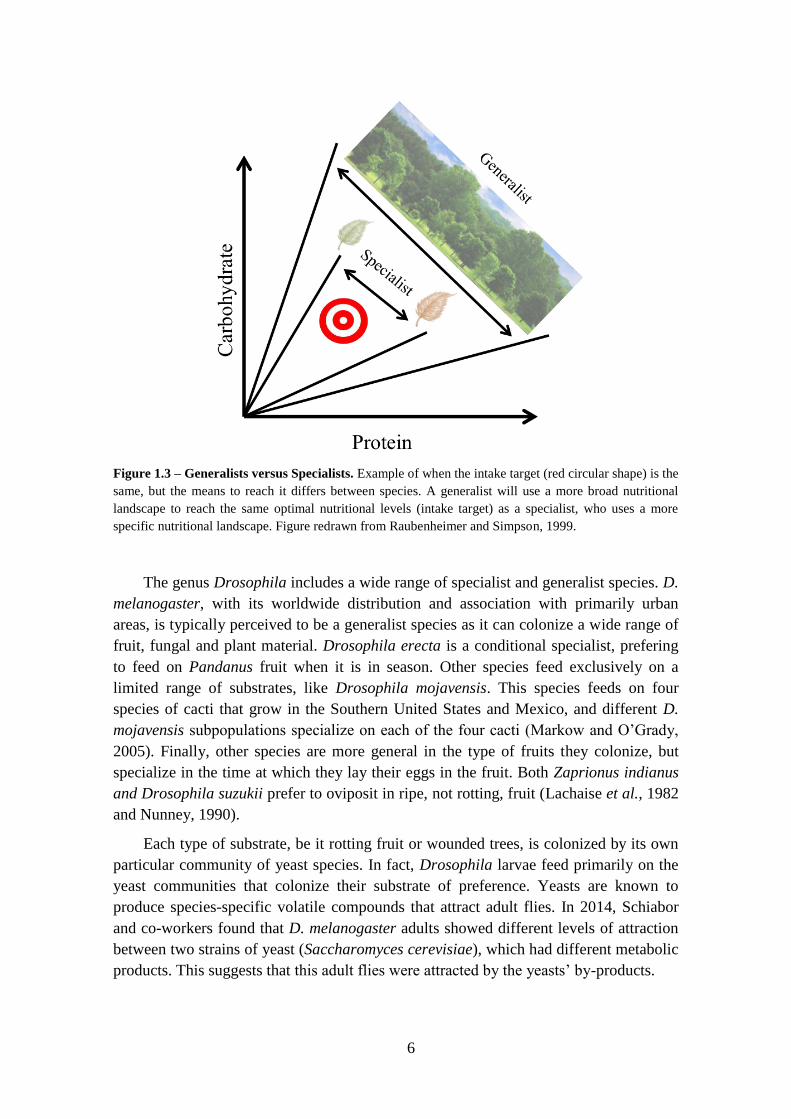
Figure 1.3 – Generalists versus Specialists. Example of when the intake target (red circular shape) is the
same, but the means to reach it differs between species. A generalist will use a more broad nutritional
landscape to reach the same optimal nutritional levels (intake target) as a specialist, who uses a more
specific nutritional landscape. Figure redrawn from Raubenheimer and Simpson, 1999.
The genus Drosophila includes a wide range of specialist and generalist species. D.
melanogaster, with its worldwide distribution and association with primarily urban
areas, is typically perceived to be a generalist species as it can colonize a wide range of
fruit, fungal and plant material. Drosophila erecta is a conditional specialist, prefering
to feed on Pandanus fruit when it is in season. Other species feed exclusively on a
limited range of substrates, like Drosophila mojavensis. This species feeds on four
species of cacti that grow in the Southern United States and Mexico, and different D.
mojavensis subpopulations specialize on each of the four cacti (Markow and O’Grady,
2005). Finally, other species are more general in the type of fruits they colonize, but
specialize in the time at which they lay their eggs in the fruit. Both Zaprionus indianus
and Drosophila suzukii prefer to oviposit in ripe, not rotting, fruit (Lachaise et al., 1982
and Nunney, 1990).
Each type of substrate, be it rotting fruit or wounded trees, is colonized by its own
particular community of yeast species. In fact, Drosophila larvae feed primarily on the
yeast communities that colonize their substrate of preference. Yeasts are known to
produce species-specific volatile compounds that attract adult flies. In 2014, Schiabor
and co-workers found that D. melanogaster adults showed different levels of attraction
between two strains of yeast (Saccharomyces cerevisiae), which had different metabolic
products. This suggests that this adult flies were attracted by the yeasts’ by-products.

7
In each of these cases, the substrates Drosophila use, have different macronutrient
compositions, mainly because of the nature of the substrates but also because of the
microorganisms that colonize them. Because different Drosophila species colonise
different substrates, we expect their nutritional requirements to be adapted to their
substrate of preference. Species that feed on ripe fruit may need or tolerate higher levels
of simple sugars, since ripe fruit is richer in sugars. These differences in nutritional
requirements would certainly be reflected in the response of their development and life
history traits to the macronutrient composition of their diet, but also in their foraging
strategies.
1.3 NUTRITION AND ITS IMPACTS ON DEVELOPMENT AND LIFE
HISTORY TRAITS
The effects of nutrition on life history traits has been widely studied, especially in
the context of longevity and life span (Anagnostou et al., 2010; Baldal et al., 2005;
Burger et al., 2010; Fanson and Taylor, 2012; Ja et al., 2009; Lee et al., 2008; Matzkin
et al., 2011; Min et al., 2007; Partridge et al., 2005; and others). Many of these studies
have explored the role of caloric restriction in longevity, fecundity, body size and other
trait. However the quality of food ingested also affects other traits and differs from
species to species.
The nutritional geometry framework can be used both to assess how animals
balance their macronutrient intake, but also assess how life history traits respond across
a broad nutrient space (Fanson et al., 2009). This method implies providing animals
with an array of single-choice diets varying in their macronutrient and caloric content.
This allows us to map the response of our traits of choice across nutrient space. In
Figure 1.4, we present four hypothetical examples of how unbalanced diets composed
by a range of protein and carbohydrate concentrations could affect life history traits,
such as body size or fecundity. In this example, we use twenty-four different diets that
vary in their protein, carbohydrate and caloric contents. The twenty-four diets are
represented by black dots. The diets can be grouped as being calorically equivalent
(where the sum of carbohydrate and protein is equivalent between diets), or of
containing the same (P:C) ratio of protein (dashed lines). In the first example (Figure
1.4-A), the trait responds only to carbohydrates (Figure 1.4-A), where isoclines of the
response surfaces increase or decrease with carbohydrate concentration. In the second
example, the trait changes with the caloric content of the food (Figure 1.4-B). In the
third scenario, the trait correlates only with concentration of protein (Figures 1.4-C),
and thus the isoclines follow protein amount and in the final example the trait changes
with the P:C ratio (Figure 1.4-D). Of course, the response of any trait can correlate with
all four components, protein concentration, carbohydrate concentration, caloric content
and P:C ratio.

8
FIGURE 1.4 – Example of how to measure the influence of two nutrients, protein and
carbohydrates on life history traits using nutritional geometry framework. In all plots each black dot
represents a food type, colours represent the response of the life history trait to the diet and diagonal
dashed lines represents the different ratios between protein and carbohydrate (P:C ratios). (A) When
carbohydrates are the principal condition that influences the response, the colour gradient varies
vertically. (B) Here we show plots that would illustrate the effects on life history traits if they were
regulated by calories. In this case, the colour gradient varies diagonally with food types of the same
caloric values. (C) When proteins are affecting life history trait response the colour gradient varies
horizontally. (D) When the P:C ratio regulates life history trait response the colour gradient varies
diagonally with ratio lines.
Nutritional geometry has proven to be a valuable tool for understanding how
nutrition regulates life history traits. In 2008, Lee and co-workers applied this
framework to a laboratory strain of D. melanogaster to explore the effects of protein
and carbohydrate composition on longevity, rate of egg production and lifetime egg
production. They found that a P:C ratio of 1:4 maximized lifetime reproductive output.
On the other hand, longevity was maximized at 1:32 and egg production rate at 1:2.
They next offered the flies complementary diets to assess their intake targets and found
that flies regulate their intake of protein and carbohydrate toward this 1:4 ratio. Thus, D.
melanogaster females make foraging decisions to optimize lifetime reproductive
success. Similarly, the queensland fruit fly (Bactrocera tryoni) shows maximum
lifetime egg production at 1:4 P:C ratio, maximum lifespan at 1:32 and maximum egg
production rate at 1:1 (Fanson and Taylor, 2012). These females also regulate their
intake towards the 1:4 ratio.
The nutritional decisions an animal makes effects not only their fate, but also the
fate of their offspring fate. Jaenike, in 1978, concluded that D. melanogaster females
maximize offspring survival by choosing oviposition sites where larvae will perform
9
best, termed the oviposition preference – offspring performance hypothesis. Since
larvae are not very mobile in the first larval stage, females need to choose oviposition
sites considering that the substrate might change with time (Dweck et al., 2013). In fact,
females have an innate attraction to lay their eggs in sugary substrates, however they
only choose high sugar for oviposition when there is a protein concentration gradient
strong enough to first instar larvae follow. In the absence of this gradient, they avoid
laying their eggs in sugar (Schwartz et al., 2012).
Many important life history traits are determined in the juvenile stages. During the
larval stage, adult body and organ size is determined. The body mass gain during larval
stage, which depends on nutritional composition of the food (Sang, 1956), determines
adult body size, since growth stops at the onset of metamorphosis. Ovariole number,
which is positively correlated with female fertility (Boulétreau-Merle et al., 1982;
Klepsatel et al., 2013), is a plastic trait that also varies with nutrition (Fitt, 1990;
Kambysellis and Heed, 1971; Leather et al., 1988) and is determined during larval stage
(Kerkis, 1931; King, 1970). The many developmental processes that occur during the
larval stages are carefully coordinated, and interfering with these processes results in
altered developmental time. Because the larval stage is vulnerable to predation,
parasitism and competition in a finite food source, larvae are thought to try to minimize
their developmental time. Several studies show that larval developmental time is highly
affected by food supply (Sokoloft, 1966). By increasing the protein content of the food,
developmental time decreases (Anagnostou, 2010).
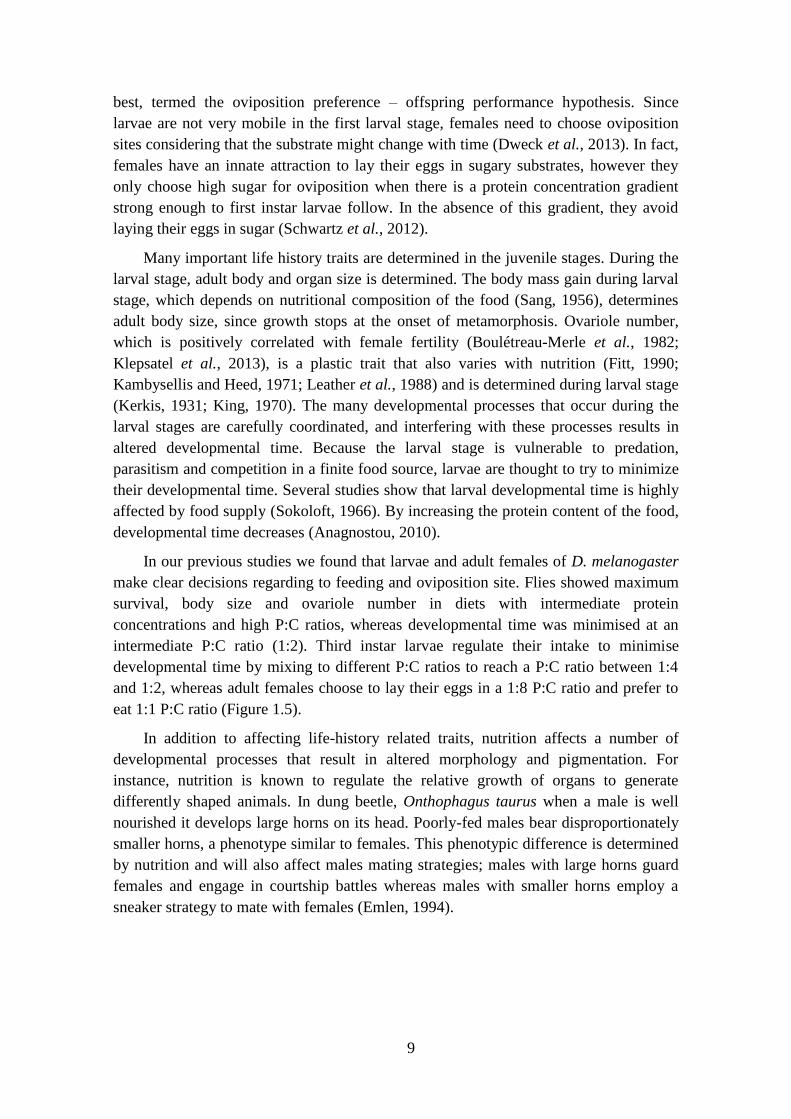
In our previous studies we found that larvae and adult females of D. melanogaster
make clear decisions regarding to feeding and oviposition site. Flies showed maximum
survival, body size and ovariole number in diets with intermediate protein
concentrations and high P:C ratios, whereas developmental time was minimised at an
intermediate P:C ratio (1:2). Third instar larvae regulate their intake to minimise
developmental time by mixing to different P:C ratios to reach a P:C ratio between 1:4
and 1:2, whereas adult females choose to lay their eggs in a 1:8 P:C ratio and prefer to
eat 1:1 P:C ratio (Figure 1.5).
In addition to affecting life-history related traits, nutrition affects a number of
developmental processes that result in altered morphology and pigmentation. For
instance, nutrition is known to regulate the relative growth of organs to generate
differently shaped animals. In dung beetle, Onthophagus taurus when a male is well
nourished it develops large horns on its head. Poorly-fed males bear disproportionately
smaller horns, a phenotype similar to females. This phenotypic difference is determined
by nutrition and will also affect males mating strategies; males with large horns guard
females and engage in courtship battles whereas males with smaller horns employ a
sneaker strategy to mate with females (Emlen, 1994).
10
Figure 1.5 – Diagram of how protein and carbohydrates affect life history traits and foraging
behaviour of Drosophila melanogaster larvae and adults female (Rodrigues et al., in review).
Similary in the butterfly Papilio machaon, pupal colour depends on whether
animals pupate on the on cadge, resulting in brown pupae, or on the stalks of the
cabbages, generating green pupae (Gardiner, 1974). When Pieris brassicae grow in long
day conditions produce brown pupae, whereas when they grow in short day conditions
the resulting pupae are green. This species also shows variation in pupal colour
correlated with diet; when caterpillars feed on green cabbage the pupae are gold in
colour but if they feed on white cabbage the pupae are blue/white (Gardiner, 1974).
These two species provide good examples of environmentally-induced changes in pupal
pigmentation. In the first case, pupal colour appears to be adapted for camouflage. In
Pieris brassicae, pupal colour variation results from physiological changes in response
to environmental cues like photoperiod and nutrition.
Adult cuticle pigmentation in Drosophila is widely studied. Although the process is
not completely understood, we do know that adult pigmentation changes with
temperature and diet. At cold temperatures posterior segments of the abdomen in female
are darker than at warmer temperatures (Gibert et al., 2007). Also, during larval stages
copper is required in the diet for pigmentation in D. melanogaster adults (Zhou et al.,
2003). Finally, nutrient sensing through the Insulin/Target of Rapamycin (TOR)
pathway has been shown to affect pigmentation of the pupal case in D. melanogaster
(Shakhmantsir et al., 2014). Because pupal pigmentation is expected to play a role in
thermoregulation, desiccation tolerance, mimicry and camouflage (Kronforst et al.,
2012), its regulation might bear important impacts on the performance of the animal.
11
1.4 THE BIOLOGY OF DROSOPHILA VIRILIS
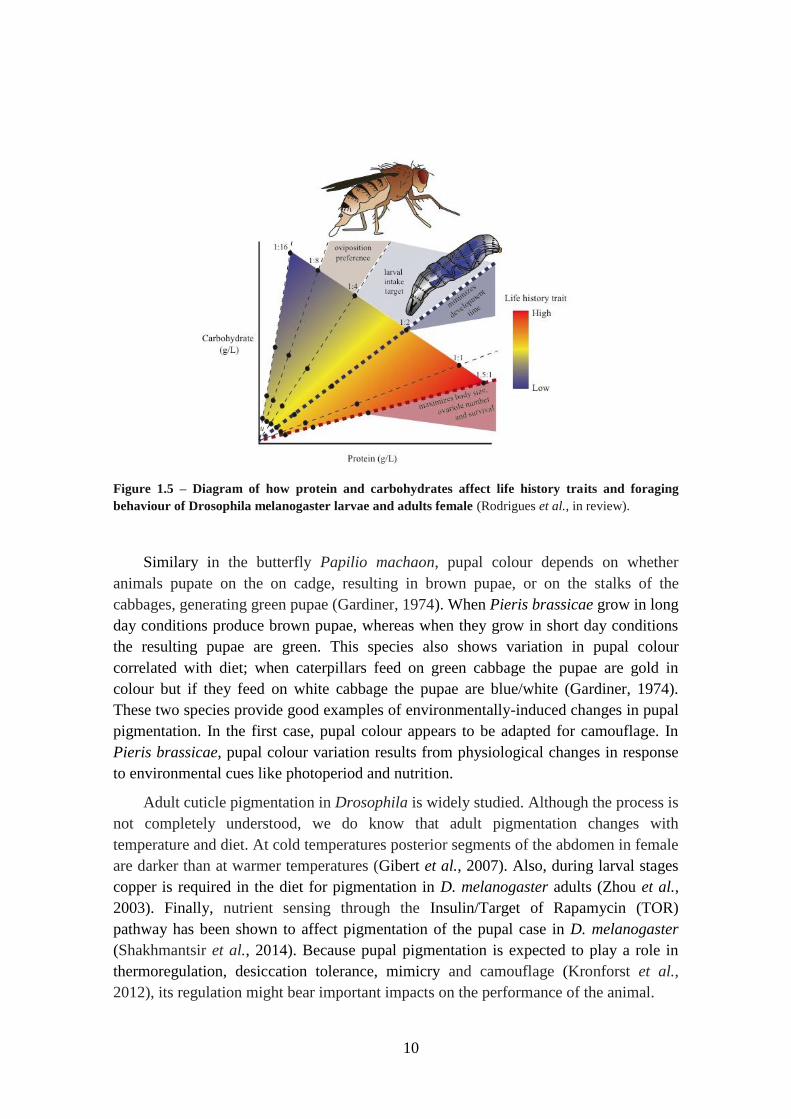
The fruit fly, D. melanogaster, has been widely used in nutritional studies. With a
fully sequenced genome and a wide array of genetic tools, it is a powerful tool for
understanding biological processes at the genetic level. Besides being easy to maintain
in the laboratory, its life cycle (Figure 1.6) is very quick taking 10 days from egg to
adult take at room temperature. In the last years, other Drosophila species have been
brought into the labs and are being widely used for comparative and evolutionary
studies. Here, we focus on how larval nutrition affects life history traits in D. virilis.
Compared to D. melanogaster, D. virilis have larger body sizes and are darker in colour.
Their life cycle is approximately 12 days at room temperature and is easy to maintain in
laboratory conditions.
Figure 1.6 – Drosophila life stages. L1 corresponds to the first instar larva, after they hatch. They will
moult two more times, second instar (L2) and third instar (L3). The last period of the third instar is the
wandering phase, where they stop eating. Pre-pupa (PP) is the begging of metamorphosis stage, pupae are
still white and eventually they became darker (P). After metamorphosis is complete adult eclose.
Further, D. virilis is a specialist, feeding primarily on sap flux in the wild. Virilis
group probably originated in warm climates in Asia (Throckmorton, 1977). The
ancestral population fragmented into two groups, virilis and montana, as supported by
enzyme and chromosomal data (Stone et al., 1960; Throckmorton 1977). The montana
phylad occupies cool temperatures regions, whereas the virilis phylad lives in warm to
temperate regions (Spieth, 1979). D. virilis inhabits the holarctic region. In the wild, it is
mainly found in the fluxes of willows and other decaying parts of trees (Throckmorton,
1982). However, sometimes it may be found in fruits in urban regions.
We aimed to understand how macronutrients, including protein and carbohydrate,
differentially affect life history traits and developmental processes in generalist versus
specialist species. Our previous work uncovered the responses of protein, carbohydrates
and caloric content of the larval diet in the generalist species, D. melanogaster. Here we
compare, in a qualitative manner, our results in D. melanogaster to our recent findings
in the specialist species D. virilis.

12
13
2. METHODS
2.1 DROSOPHILA SPECIES
The main focus species of this study is Drosophila virilis. This wild-type
population came from HHMI's Janelia Farm Research Campus (no stock number
assigned). At room temperature life cycle duration is between 12 to 13 days. Like in
Drosophila melanogaster, males and females body sizes are different and total ovariole
number (counting both ovaries) is around 35.
Strains of the following species came from the Drosophila Species Stock Center, and
include: Drosophila mojavensis sonorensis (15081.1352.32), Drosophila erecta
(14021‑ 0224.01), Drosophila pseuoobscura (14011‑ 0121.150), Drosophila tropicalis
00 (14030‑ 0801.00) and Drosophila tropicalis 01 (14030‑ 0801.01). Drosophila willistoni
and Drosophila nebulosa strains were provided by Dr. John Jaenike (University of
Rochester). All species were adapted to laboratory conditions for several years.
At the Instituto Gulbenkian de Ciência these species are maintained at room
temperature on cornmeal molasses food containing 45 g of molasses, 75 g of sucrose,
70 g of cornmeal, 10 g of agar, 1100 ml of water and 25 ml of a 10% Nipagin solution
per litre of fly food.
2.2 PERFORMANCE OF EIGHT DROSOPHILA SPECIES
Initially, we planned to compare the response surfaces of life history traits to the
macronutrient in the larval diet between several specialist species. We conducted a pilot
test using eight Drosophila specialist species to see if they would survival on the
sucrose/yeast medium used in our nutritional geometry assays.
To accomplish this, we choose a diet which showed high survival in our previous
studies of D. melanogaster, of 0.72 Kcal/mL and 1:2 a protein to carbohydrate ratio
(P:C ratio). Ratios were made up by mixing a 180 g/L solution of Saf-instante dry yeast
(Lesaffre, France) and 0.5% agar and a 180 g/L solution of sucrose (Sidul, Santa iria de
Azóia, Portugal) and 0.5% agar. Food was autoclaved and we added a 1:50 dilution of
propionic acid (Acros organics, Geel, Belgium) and of 10% Nipagen (10% p-hydroxy
benzoic acid methyl ester in 95% ethanol, Apex BioResearch Products).
We allowed females of each species to laid eggs for 4-6 hours and 30 eggs were
transferred onto a piece of autoclaved paper, which was then placed into vials
containing larval diet. We let them develop until adult stage, at constant temperature
(25°C) and humidity (60-70%).
Our measurements were, survival from egg to pupa (percentage of larvae that reach
pupariation stage) and survival from pupa do adult (percentage of adults that eclose
from the animals that pupariated). For these, we counted the number of pupae, every 24
hours, and how many adults emerge from those pupae. We performed 1-10 replicates,
depending on the species as for some strains it was difficult to obtain eggs.

14
2.3 NUTRITIONAL GEOMETRY ASSAY FOR LIFE HISTORY
TRAITS IN DROSOPHILA VIRILIS
For nutritional geometry assay, we measured the effects of protein, carbohydrate
and caloric content of the larval diet on life history traits in D. virilis and D. mojavensis
sonorensis, by changing the quality and quantity of food (see Table 2.1). To accomplish
this we made 24 food types, 4 caloric groups (0.18, 0.36, 0.72 and 1.44 Kcal/mL) and
for each caloric group 6 P:C ratios (1:16, 1:8, 1:4, 1:2, 1:1 and 1.5:1). These larval diets
are made from sucrose and dry yeast solutions, as mentioned above. After all larval
diets autoclaved, we added propionic acid and nipagin (1ml/L) to prevent bacteria and
fungal growth. This assay was repeated in 4 replicates, 2 replicates at a time.
Similar to pilot test, females were left to lay eggs for 4-6 hours. Eggs were
transferred, using a piece of autoclaved paper, into a vial containing the larval diet.
Because larval density affects developmental time and body size (Anagnostou et al.,
2010), we transferred 30 eggs into each vial. We then let larvae develop at constant
temperature (25°C) and humidity (60-70%). We measured survival for Drosophila
mojavensis sonorensis and survival, developmental time, pharate weight and ovariole
number for Drosophila virilis.
Measurements:
Survival from egg to pupa: number of individuals that initiate metamorphosis
(prepupa).
Larval developmental time: the interval of time from egg until pupariation. For this
measure we counted the number of pupae from the vials, twice a day, at 9 am and 5 pm,
until all had larvae pupate or died.
Adult body size: a simple proxy for adult body size is to weigh pharate adult pupae
(last day of metamorphose). We weigh each pharate adult individually using a Sartorius
SE2 ultramicrobalance. We could not distinguish males from females throught the pupal
case, and so the two sexes are grouped together.
Adults were transferred together into fresh food vials after eclosion from the pupal
case, because this condition stimulates female egg production.
Female Fecundity: ovariole number is a good proxy for female fecundity, as it is
correlated with the number of eggs that a female will lay in her lifetime. After 5 days in
fresh food with males, females start to produce eggs. In the day of highest egg
production, the 6th
day after eclosion, we dissected females and counted the number of
ovarioles in each ovary.
15
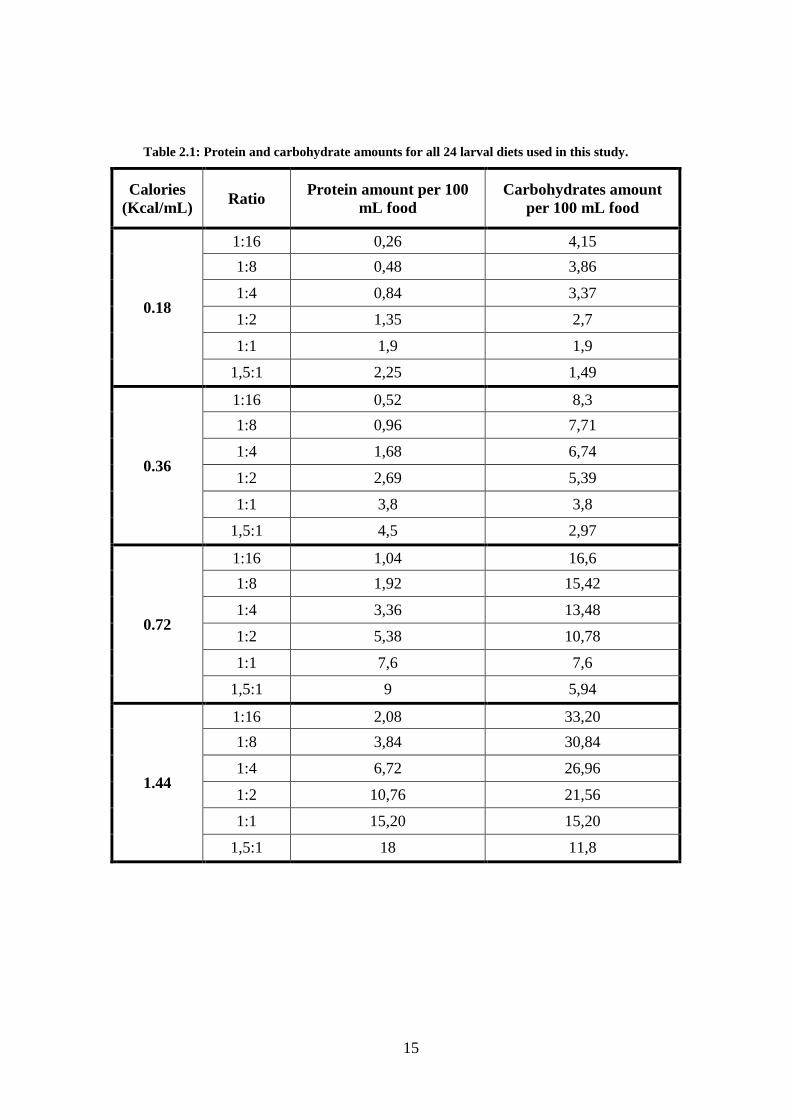
Table 2.1: Protein and carbohydrate amounts for all 24 larval diets used in this study.
Calories
(Kcal/mL) Ratio
Protein amount per 100
mL food
Carbohydrates amount
per 100 mL food
0.18
1:16 0,26 4,15
1:8 0,48 3,86
1:4 0,84 3,37
1:2 1,35 2,7
1:1 1,9 1,9
1,5:1 2,25 1,49
0.36
1:16 0,52 8,3
1:8 0,96 7,71
1:4 1,68 6,74
1:2 2,69 5,39
1:1 3,8 3,8
1,5:1 4,5 2,97
0.72
1:16 1,04 16,6
1:8 1,92 15,42
1:4 3,36 13,48
1:2 5,38 10,78
1:1 7,6 7,6
1,5:1 9 5,94
1.44
1:16 2,08 33,20
1:8 3,84 30,84
1:4 6,72 26,96
1:2 10,76 21,56
1:1 15,20 15,20
1,5:1 18 11,8
16
2.4 NUTRITIONAL GEOMETRY ASSAY FOR PUPAL
PIGMENTATION IN DROSOPHILA VIRILIS
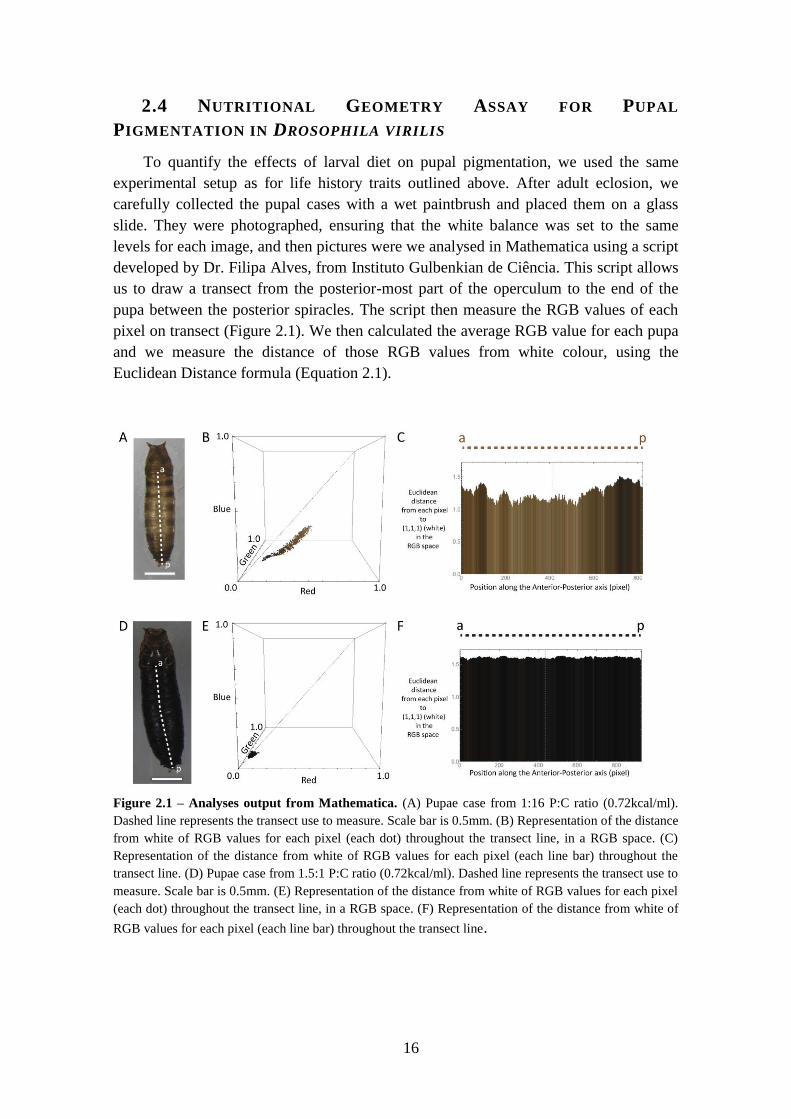
To quantify the effects of larval diet on pupal pigmentation, we used the same
experimental setup as for life history traits outlined above. After adult eclosion, we
carefully collected the pupal cases with a wet paintbrush and placed them on a glass
slide. They were photographed, ensuring that the white balance was set to the same
levels for each image, and then pictures were we analysed in Mathematica using a script
developed by Dr. Filipa Alves, from Instituto Gulbenkian de Ciência. This script allows
us to draw a transect from the posterior-most part of the operculum to the end of the
pupa between the posterior spiracles. The script then measure the RGB values of each
pixel on transect (Figure 2.1). We then calculated the average RGB value for each pupa
and we measure the distance of those RGB values from white colour, using the
Euclidean Distance formula (Equation 2.1).
Figure 2.1 – Analyses output from Mathematica. (A) Pupae case from 1:16 P:C ratio (0.72kcal/ml).
Dashed line represents the transect use to measure. Scale bar is 0.5mm. (B) Representation of the distance
from white of RGB values for each pixel (each dot) throughout the transect line, in a RGB space. (C)
Representation of the distance from white of RGB values for each pixel (each line bar) throughout the
transect line. (D) Pupae case from 1.5:1 P:C ratio (0.72kcal/ml). Dashed line represents the transect use to
measure. Scale bar is 0.5mm. (E) Representation of the distance from white of RGB values for each pixel
(each dot) throughout the transect line, in a RGB space. (F) Representation of the distance from white of
RGB values for each pixel (each line bar) throughout the transect line.

17
Equation 2.1 – Euclidean distance formula used to calculate the distance from white in pupae
pigmentation. In this case we are working in a 3 dimensional space. We have three coordinates that
codifies a colour for each pupae, p = (p1, p2, p3) and the measure how far these colour are from white,
which have the coordinates, w = (w1, w2, w3).
2.5 STATISTICAL ANALYSES FOR NUTRITIONAL GEOMETRY
EXPERIMENTS
All statistical analyses were performed in R (http://cran.r-project.org/) using the
nlme, lme4, lmmfit, stats and fields packages and scripts provided by Dr. Nelson
Martins (Instituto Gulbenkian de Ciência). All measurements were plotted over a
nutrient array defined by protein and carbohydrate concentrations, using thin plate
splines.
We estimated the response for developmental time, female and male weight,
ovariole number, and distance to white, by fitting a linear mixed effects models,
including replictaes as the random effect. For survival, we fit the data with generalized
linear model assuming a quasibinomial distribution, to accommodate for the
overdispersion of the data, and a logit link function.
2.6 LARVAL INTAKE TARGET IN DROSOPHILA VIRILIS
Larvae were reared on diet that contained a 1:1 P:C ratio and 0.72 kcal/ml until 3rd
instar larvae. Larval diet was prepared in the same manner as for the nutritional
geometry assay, but instead of vials we used 60 mm petri dishes. After 4-6 hours egg
lay, eggs were transferred to the 1:1 P:C ratios (0.72Kcal/mL) larval diet. Larvae will
develop with controlled density (200 eggs per plate), at constant temperature (25°C) and
humidity (60-70%).
Within the first 24 h of the L3 stage, we subjected ten larvae to two-choice assays.
For this choice assay, we offered larvae the choice between two diets of the same
caloric value (0.72 kcal/ml) but differing in P:C ratio. The choices were either between
1:8 and 1:1 or 1:4 and 1.5:1.
To make the assay plate, we fixed 10 lids of 0.5 ml eppendorf tubes into a 60 mm
petri dish. Then the plate was filled with a 5% agar solution until the agar solution
reached the edge of the lids. We dyed each of the choices either red or blue using 4.5%
food colouring (Rayner). The colours will be switched to control for larval colour
preference (Figure 2.2).

18
Figure 2.2– Two-way Choice assay plate. Example of an assay plate used for larvae two choice assay.
Each color represents one food type, which are inside of 0.5 ml eppendorf lids. Those are fixed with 5%
agar solution, filling all the plate.
We left larvae on the assay plate to choose for 1.5, 3 and 6 hours at constant
temperature (25°C) and humidity (60-70%). After that, we collected them by flooding
the plate with 20% sucrose solution. We then assessed food choice and amount of food,
ingested by larvae by spectrophotometer as outlined below.
Food choice: since larvae are transparent and food is coulored, we can distinguish
which food each larvae chose by eye. We first counted how many larvae ate each food,
or a mixture of both foods (purple color in the gut).
Amount of food ingested: we quantified the amount of food ingested using a
spectrophotometer. We processed larvae from each assay immediately after being
scored for food choice.
Spectrophotometer protocol: place larvae into a 1.5 ml tube with 80 µl of
ice-cold methanol. Then homogenize larvae and centrifuge at 13 g for 10
minutes at 4°C. Transfer the supernatant to a new 1.5 ml tube and centrifuge at
13 g for 5 minutes at 4°C. Transfer to a 96 well plate 70 µl and measure the
absorbance in the spectrophotometer. We used 450 nm absorbance to to quantify
red and 600 nm absorbance for blue.
This protocol was repeated at least 20 times for each two-choice assay.
2.7 ADULT FEMALE FOOD AND OVIPOSITION SITE PREFERENCE
IN DROSOPHILA VIRILIS
The experimental setup for this assay was similar to that of the larval intake target
assay, except that we used a three-choice design to address female food choice and
oviposition site preference. We reared animals from egg to adult in 1:1, 0.72 Kcal/mL
diet. Females were left to lay eggs for 4-6 hours, and then 30 eggs were transferred onto
autoclaved paper then into the vials with larval diet. After emergence, we transferred all
adults to a fresh food vial (the same food where they were reared). When females
19
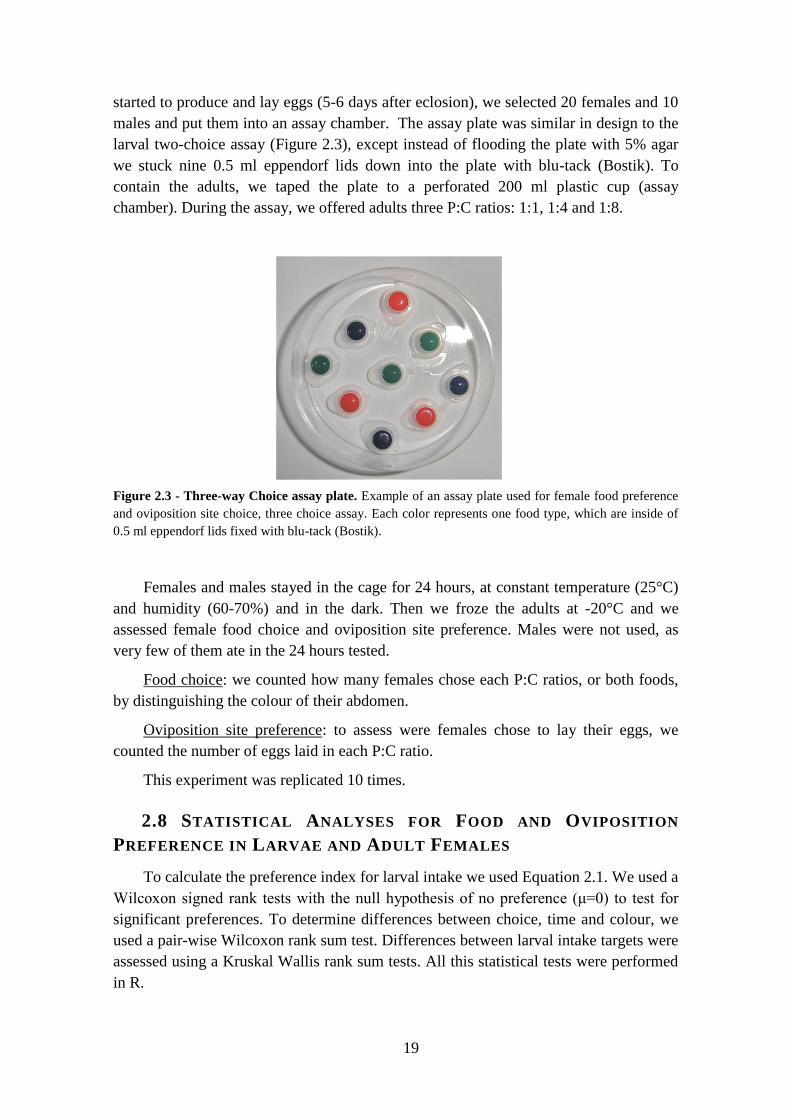
started to produce and lay eggs (5-6 days after eclosion), we selected 20 females and 10
males and put them into an assay chamber. The assay plate was similar in design to the
larval two-choice assay (Figure 2.3), except instead of flooding the plate with 5% agar
we stuck nine 0.5 ml eppendorf lids down into the plate with blu-tack (Bostik). To
contain the adults, we taped the plate to a perforated 200 ml plastic cup (assay
chamber). During the assay, we offered adults three P:C ratios: 1:1, 1:4 and 1:8.
Figure 2.3 - Three-way Choice assay plate. Example of an assay plate used for female food preference
and oviposition site choice, three choice assay. Each color represents one food type, which are inside of
0.5 ml eppendorf lids fixed with blu-tack (Bostik).
Females and males stayed in the cage for 24 hours, at constant temperature (25°C)
and humidity (60-70%) and in the dark. Then we froze the adults at -20°C and we
assessed female food choice and oviposition site preference. Males were not used, as
very few of them ate in the 24 hours tested.
Food choice: we counted how many females chose each P:C ratios, or both foods,
by distinguishing the colour of their abdomen.
Oviposition site preference: to assess were females chose to lay their eggs, we
counted the number of eggs laid in each P:C ratio.
This experiment was replicated 10 times.
2.8 STATISTICAL ANALYSES FOR FOOD AND OVIPOSITION
PREFERENCE IN LARVAE AND ADULT FEMALES
To calculate the preference index for larval intake we used Equation 2.1. We used a
Wilcoxon signed rank tests with the null hypothesis of no preference (μ=0) to test for
significant preferences. To determine differences between choice, time and colour, we
used a pair-wise Wilcoxon rank sum test. Differences between larval intake targets were
assessed using a Kruskal Wallis rank sum tests. All this statistical tests were performed
in R.

20
For food and oviposition preference in adult females, we calculated the preference
index by the Equation 2.2. We tested for significant preferences using a Wilcoxon
signed rank tests with the null hypothesis of no preference (μ=-0.33).
To determine differences between choice, time and colour, we used a pair-wise
Wilcoxon rank sum test.
All this statistical tests were performed in R software.
Equation 2.2 – Preference index formula. Eq. 2.1 is the formula for larvae
preference for food 1, between two-way choice (non choice is 0 value). Eq. 2.2 is the
formula for females food preference or oviposition site preference, between three-way
choice (non choice is -0.33).
21
3. RESULTS
3.1 PERFORMANCE OF DROSOPHILA SPECIES IN DRY YEAST
FOOD
Initially, we had hoped to compare response surfaces to the macronutrient content
of the larval diet between species that use different substrates as breeding sites. To do
this, we first conducted a pilot study to identify species that would show reasonable
survivorship on the simple sucrose/yeast medium that we use for nutritional geometry
studies. We selected eight species of Drosophila known to differ in their substrate
preference. We reared each of these species at 0.72kcal/ml diet at 1:2 P:C ratio, selected
as it conferred high survivorship in Drosophila melanogaster (Rodrigues et al., in
review). We measured the survival from egg to pupa (percentage of larvae that reach the
pupariation stage) and survival of pupae (percentage of adults that eclosed from the
animals that pupariated).
Our test showed variation in survivorship between species on the sucrose/yeast
medium (Figure 3.1). Drosophila mojavensis sonorensis and Drosophila erecta larvae
had a survival of 42% ± 15.3 and 40% ± 13.7, respectively, and of the larvae that
reached pupariation 1.8% ± 3 and 4.2% ± 5.8, respectively, eclosed as adults. For
Drosophila willistoni, 36% ± 7.7 of the larvae pupariated, whereas 71% ± 7.2 of the
pupae eclosed as adults. Drosophila nebulosa survival showed the opposite pattern to
that of Drosophila willistoni, 83% ± 6 of the larvae reach pupariation but only 41% ±
11.6 of the pupae reach the adult stage. Finally, the two species with the highest
survival were Drosophila virilis and Drosophila tropicalis 01, a high percentage of
larvae reach pupariation stage (96% ± 1.9 and 85% ± 7 respectively) and also a high
percentage of the pupae reach to adult stage (99% ± 1.9 and 73 % ± 10.9 respectively).
3.2 NUTRITIONAL GEOMETRY OF SURVIVAL IN DROSOPHILA
MOJAVENSIS SONORENSIS
Although many species showed low survival in the pilot study, we reasoned that
this might be because either the food was too concentrated or the P:C ratio was too high.
To test whether changing the protein or carbohydrate content of the food altered
survival, we reared a cactofilic species, Drosophila mojavensis sonorensis, on the full
panel of diets, which include 24 different media differing in protein, carbohydrate and
caloric content.
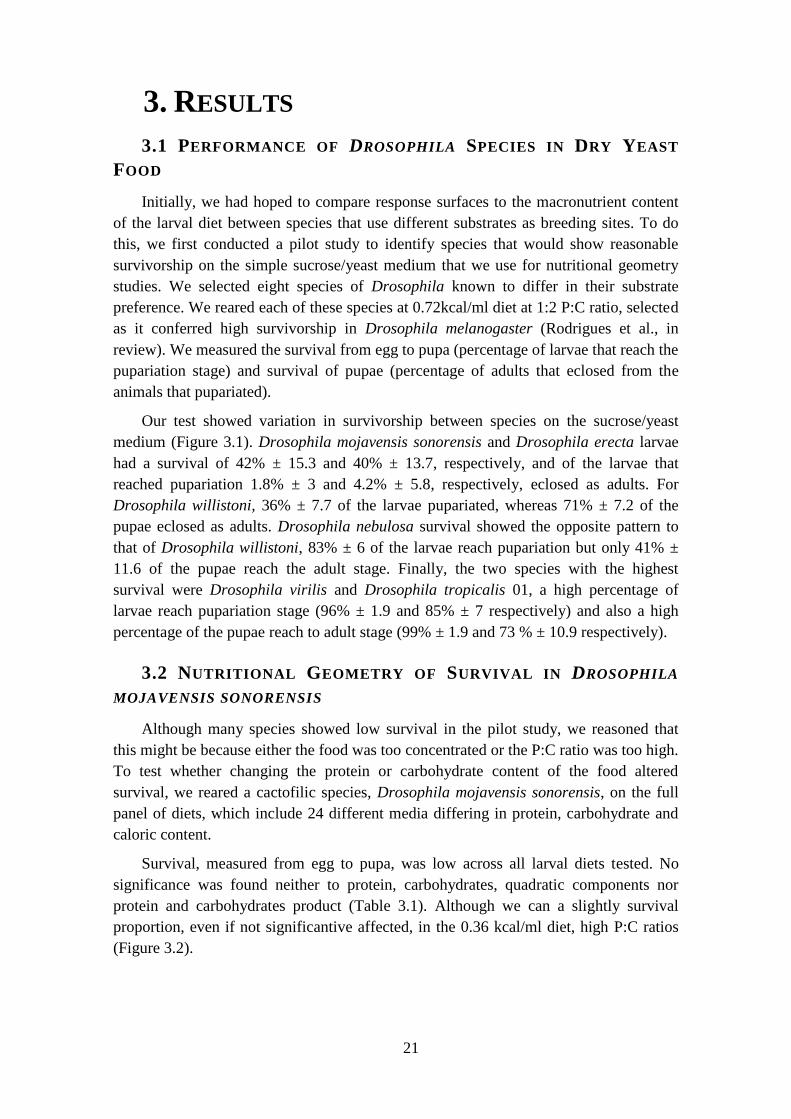
Survival, measured from egg to pupa, was low across all larval diets tested. No
significance was found neither to protein, carbohydrates, quadratic components nor
protein and carbohydrates product (Table 3.1). Although we can a slightly survival
proportion, even if not significantive affected, in the 0.36 kcal/ml diet, high P:C ratios
(Figure 3.2).

22
Since only a small percentage of larvae reached the pupariation stage and of those,
more than half did not eclose, we could not measure more life history traits for
Drosophila mojavensis sonorensis.
Figure 3.1 – Survival of eight Drosophila species in food with sucrose/yeast medium. Eight
Drosophila species were tested in food with a concentration of 0.72 kcal/ml and a protein to carbohydrate
(P:C) ratio of 1:2. Blue bars indicate the percentage of eggs that reached pupariation (Survival L-P),
orange bars represent the percentage of pupae that eclosed to adult (Survival P-A). Error bars represent
standard deviation of the means. The names of the tested species are in the x-axis and the number below
each name indicates the number of replicates per species/strain.
Table 3.1 - Effects of carbohydrate and protein on survival from egg to prepupae in Drosophila
mojavensis sonorensis. The data was analysed in R by a generalized linear mixed-effects model,
assuming a quasibinomial distribution of survival probabilities and a logit link. Significant coefficients
are highlighted in bold (*p<0.05, **p<0.01, ***p<0.001).
Life History
Trait C P C
2 P
2 C x P
Survival -0.007 0.930 -0.006 -0.092 -0.012
t value 0.000 0.032 -0.007 -0.031 -0.004
23
Figure 3.2 – Effects of protein, carbohydrate and caloric content of the larval diet on survival in
Drosophila mojavensis sonorensis. The coloured area in the plot represents the proportion of animals
surviving from eggs to prepupae for the different food types. The proportion varies from blue (the lowest,
0) to red (the highest, 1). Each black dot corresponds to one of 24 larval diets, dashed lines represent
protein to carbohydrate ratios (1.5:1, 1:1, 1:2, 1:4, 1:8 and 1:16) and the black lines are isoclines of the
response surface.
As showed above Drosophila virilis had the best survival, in both life stages, larvae
and adults, to unbalance diet on the pilot test. However, this is not the only reason to
choose it. This specie is a sap flux specialist, which is very different than the usual
rotting fruits. Which makes this a interesting species to look at.
3.3 NUTRITIONAL GEOMETRY OF DROSOPHILA VIRILIS
3.3.1 SURVIVAL
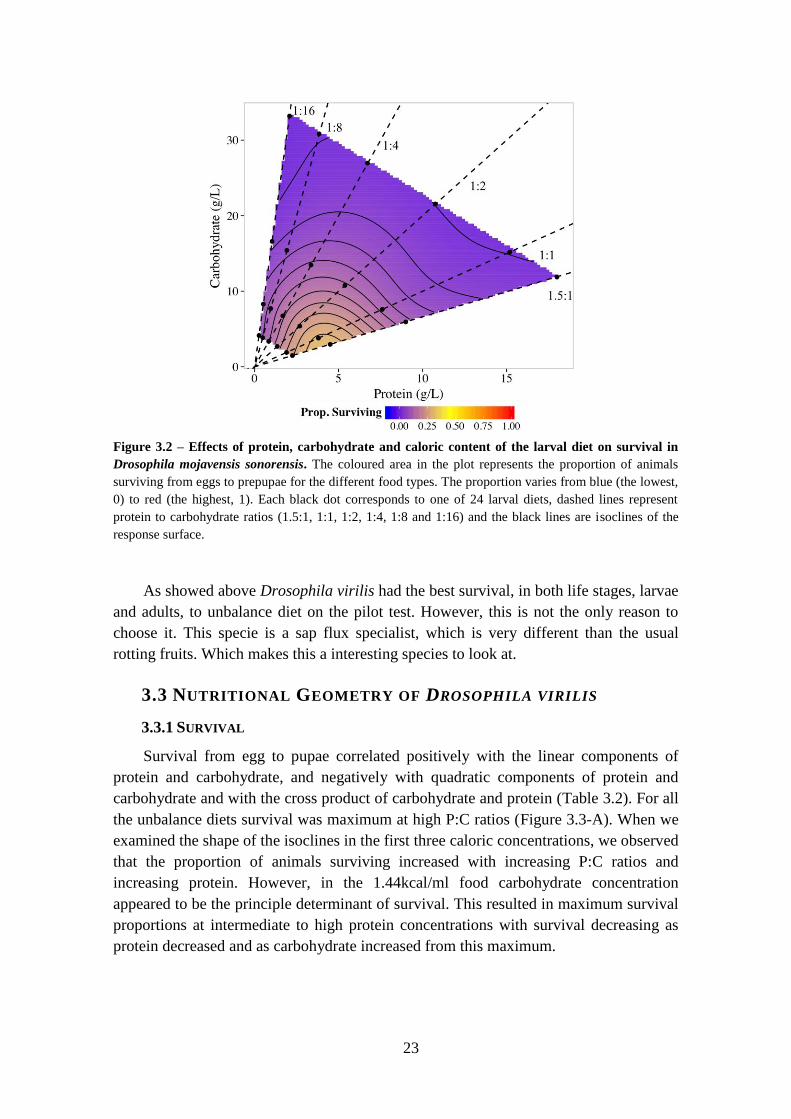
Survival from egg to pupae correlated positively with the linear components of
protein and carbohydrate, and negatively with quadratic components of protein and
carbohydrate and with the cross product of carbohydrate and protein (Table 3.2). For all
the unbalance diets survival was maximum at high P:C ratios (Figure 3.3-A). When we
examined the shape of the isoclines in the first three caloric concentrations, we observed
that the proportion of animals surviving increased with increasing P:C ratios and
increasing protein. However, in the 1.44kcal/ml food carbohydrate concentration
appeared to be the principle determinant of survival. This resulted in maximum survival
proportions at intermediate to high protein concentrations with survival decreasing as
protein decreased and as carbohydrate increased from this maximum.

24
Since the survival for three out of six P:C ratios in 1.44 kcal/ml food was almost
zero, we excluded this caloric concentration from the remaining analyses of
developmental time, body size and ovariole number.
3.3.2 DEVELOPMENTAL TIME
The faster larvae develop to entre in metamorphosis, the faster they leave the
vulnerable stage, larval stage. This is important due to the fact that larvae are expose to
predation and resource changes (Krijger et al., 2001). We found a significant negative
correlation with linear component of protein and positive correlation with quadratic
component of protein (Table 3.2). Overall, the minimum developmental time from egg
to pupa was obtained in diets high in protein and intermediate to low in carbohydrates
(Figures 3.3-B). The model, including the linear and quadratic components of
carbohydrates and protein and their cross product, explained 63,4% of developmental
time variation.
3.3.3 PHARATE WEIGHT
In insects, adults do not grow. Because all growth occurs during larval stages larval
nutrition is an important determinant of final adult size. Here we measured pharate adult
weight as proxy for adult body size (Mirth et al., 2005). In most species, males and
females differ in body sizes. However, in this study it was not possible to distinguish the
sexes as pharate adults, and we analysed male and female weight together.
We found a significant negative correlation with linear components of
carbohydrates and a positive correlation with the quadratic components of
carbohydrates (Table 3.2). Further, we found a significant positive correlation with the
linear component of protein and a negative correlation with the quadratic component of
protein. This resulted in maximum pharate adult weight at the highest protein
concentration and highest P:C ratio (Figure 3.3-C). The model explained 61% of the
variation in pharate weight.
3.3.4 OVARIOLE NUMBER
During larval development, ovaries start to form and develop the structures that will
give rise to the ovarioles in adult females. The number of ovarioles in each ovary
correlates with the number of eggs a female lays, and is determined at least in part by
larval nutrition (Kerkis, 1931; King, 1970).
Total ovariole number (from both ovaries) correlated positively with the linear
component of protein, and negatively with its quadratic component (Table 3.2). Thus,
ovariole number is maximized at the highest protein concentrations and the highest P:C
ratios (Figure 3.3-D). 23% of the variation in ovariole number can be explained by the
model.
3.3.5 COMPARISON BETWEEN LIFE HISTORY TRAITS
We compared the shape of the response surfaces between traits by standardizing
each trait to a mean of zero and to unit standard deviations. In addition, because

25
development time is minimized with increasing protein, we inverted the response
surface for developmental time to compare to the remaining traits.
The inverse developmental time surface response differed in shape from the
response surfaces for both survival and pharate adult weight (Table 3.3). Inverse
development time was smallest at the highest carbohydrate concentrations and lowest
P:C ratio, whereas proportion surviving and pharate adult weight showed minimums
around low to intermediate carbohydrate concentrations in the lowest P:C ratio.
Furthermore, inverse development time increased more steeply with the increase in P:C
ratios between 1:16 to 1:4, and showed a broader maximum range. In addition, the
response surface for ovariole number differed to pharate weight. The diet with the
highest carbohydrate concentration and the lowest P:C ratio resulted in females with the
lowest ovariole number. For pharate weight, low to intermediate carbohydrate
concentrations in the lowest P:C ratio resulted in the smallest animals. Thus, even
though all traits showed maximum values at high protein concentrations and high P:C
ratios, the shapes of their response surfaces differed in the conditions that resulted in
minimum values.
Table 3.2 - Effects of carbohydrate (C) and protein (P) on four life history traits in Drosophila
virilis. All traits except survival were analysed in R, by a linear mixed-effects model fitted by maximum
likelihood. Survival was analysed by a generalized linear mixed-effects model, assuming a quasibinomial
distribution of survival probabilities and a logit link. The significant interactions are highlighted in bold
(*p<0.05, **p<0.01, ***p<0.001).
Life History
Trait C P C
2 P
2 C x P R
2
Survival 1.819e-02 4.407e-02 -1.090e-04 -1.154e-04 -1.206e-04
t value 0.005 **
2.37e-06
*** 0.002 ** 0.017 * 0.062
Developmental
Time
6.759 - 74.737 0.405 6.743 - 1.535
0.634 t value 1.278
- 9.169
*** 1.597 10.185 *** - 2.069
Pharate
Weight
- 0.067 0.290 0.003 - 0.020 0.003
0.610 t value - 2.637 * 7.376 *** 2.069 *
- 6.325
*** 0.969
Ovariole
Number - 0.031 2.714 - 0.026 - 0.225 0.043
0.231 t value - 0.213 3.037 ** - 0.551 - 3.161 ** 0.511

26
Figure 3.3 - Effects of protein, carbohydrate and caloric content of the larval diet on life history
traits in Drosophila virilis. In all plots, the coloured area represents the response of a trait to a food type,
black dots represent the 24 larval diets, dashed lines represent the protein to carbohydrate ratios (1.5:1,
1:1, 1:2, 1:4, 1:8 and 1:16) and the continuous lines are the isoclines generated using thin plate splines.
(A) survival from egg to pupa (proportion of individuals that pupariated), for each food type; (B) the time
that individuals spent to develop from egg to pupariation, in hours, for each food type; (C) weight (mg) of
individuals at the pharate adult stage, for each food type, and is used as a proxy for adult body size; (D)
ovariole number is a proxy for female fertility, for each food type.
27
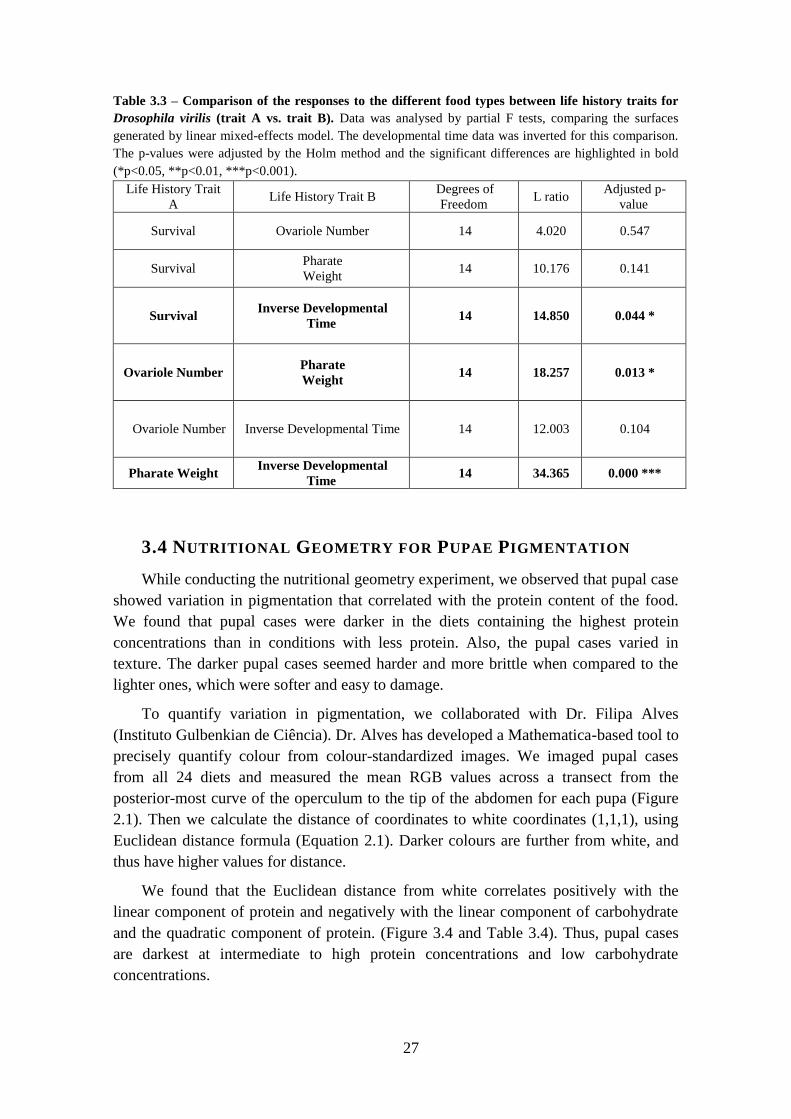
Table 3.3 – Comparison of the responses to the different food types between life history traits for
Drosophila virilis (trait A vs. trait B). Data was analysed by partial F tests, comparing the surfaces
generated by linear mixed-effects model. The developmental time data was inverted for this comparison.
The p-values were adjusted by the Holm method and the significant differences are highlighted in bold
(*p<0.05, **p<0.01, ***p<0.001).
Life History Trait
A Life History Trait B
Degrees of
Freedom L ratio
Adjusted p-
value
Survival Ovariole Number 14 4.020 0.547
Survival Pharate
Weight 14 10.176 0.141
Survival Inverse Developmental
Time 14 14.850 0.044 *
Ovariole Number Pharate
Weight 14 18.257 0.013 *
Ovariole Number Inverse Developmental Time 14 12.003 0.104
Pharate Weight Inverse Developmental
Time 14 34.365 0.000 ***
3.4 NUTRITIONAL GEOMETRY FOR PUPAE PIGMENTATION
While conducting the nutritional geometry experiment, we observed that pupal case
showed variation in pigmentation that correlated with the protein content of the food.
We found that pupal cases were darker in the diets containing the highest protein
concentrations than in conditions with less protein. Also, the pupal cases varied in
texture. The darker pupal cases seemed harder and more brittle when compared to the
lighter ones, which were softer and easy to damage.
To quantify variation in pigmentation, we collaborated with Dr. Filipa Alves
(Instituto Gulbenkian de Ciência). Dr. Alves has developed a Mathematica-based tool to
precisely quantify colour from colour-standardized images. We imaged pupal cases
from all 24 diets and measured the mean RGB values across a transect from the
posterior-most curve of the operculum to the tip of the abdomen for each pupa (Figure
2.1). Then we calculate the distance of coordinates to white coordinates (1,1,1), using
Euclidean distance formula (Equation 2.1). Darker colours are further from white, and
thus have higher values for distance.
We found that the Euclidean distance from white correlates positively with the
linear component of protein and negatively with the linear component of carbohydrate
and the quadratic component of protein. (Figure 3.4 and Table 3.4). Thus, pupal cases
are darkest at intermediate to high protein concentrations and low carbohydrate
concentrations.
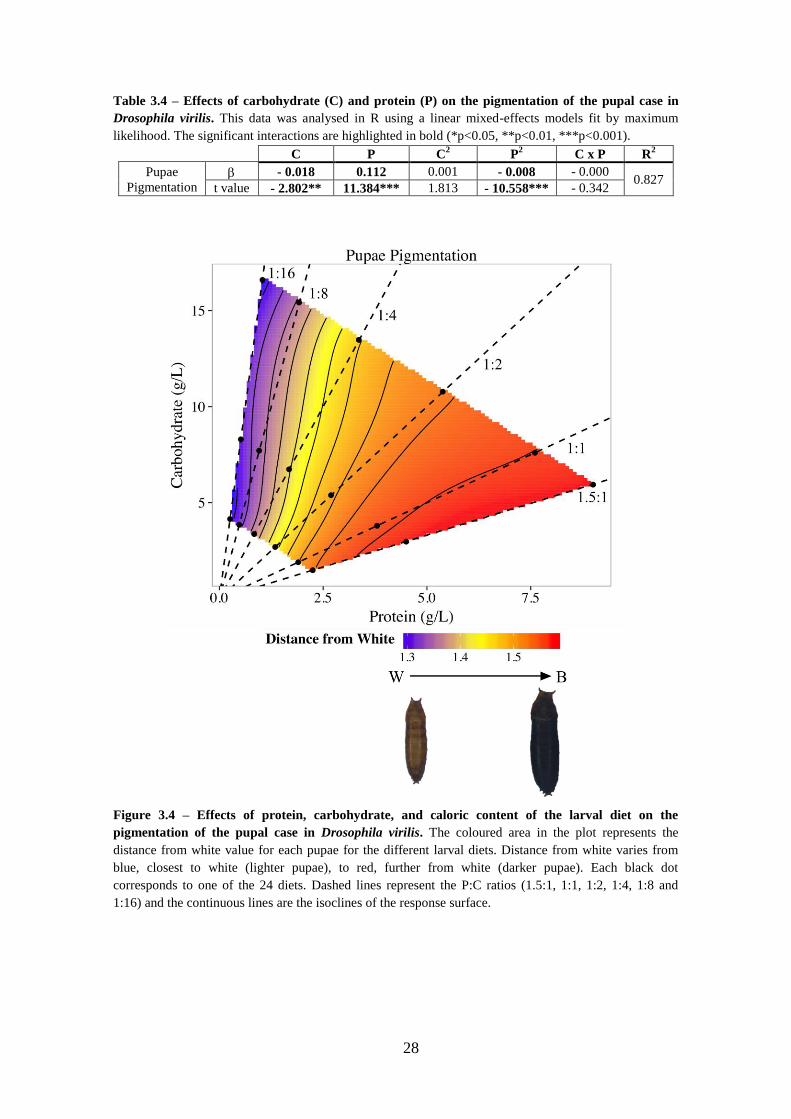
28
Table 3.4 – Effects of carbohydrate (C) and protein (P) on the pigmentation of the pupal case in
Drosophila virilis. This data was analysed in R using a linear mixed-effects models fit by maximum
likelihood. The significant interactions are highlighted in bold (*p<0.05, **p<0.01, ***p<0.001).
C P C2 P
2 C x P R
2
Pupae
Pigmentation - 0.018 0.112 0.001 - 0.008 - 0.000
0.827 t value - 2.802** 11.384*** 1.813 - 10.558*** - 0.342
Figure 3.4 – Effects of protein, carbohydrate, and caloric content of the larval diet on the
pigmentation of the pupal case in Drosophila virilis. The coloured area in the plot represents the
distance from white value for each pupae for the different larval diets. Distance from white varies from
blue, closest to white (lighter pupae), to red, further from white (darker pupae). Each black dot
corresponds to one of the 24 diets. Dashed lines represent the P:C ratios (1.5:1, 1:1, 1:2, 1:4, 1:8 and
1:16) and the continuous lines are the isoclines of the response surface.

29
3.5 FORAGING BEHAVIOUR
3.5.1 LARVAL CHOICE
To understand how life history traits might drive foraging decisions, we next
assessed whether larvae chose food that optimize their development. We did a 2-way
choice assay with day one, 3rd
instar larvae, offering them a choice between foods of
two different P:C ratios (1:1 versus 1:8 and 1.5:1 versus 1:4) but of the same caloric
content (0.72 kcal/ml). Because larval food preference could change over time, we
analysed larval choice at three times points, 1.5, 3 and 6 hours. Finally, to control for
potential colour preference, we alternated the colour of the food in each choice.
Although there was no significant colour preference in the 1.5:1 versus 1:4 choice, we
observed a significant preference for red in the 1:1 versus 1:8 choice (Figure S1),
Wilcoxon signed rank test V=609 and p-value=0.02451).
In both choices, larvae seem to regulate their nutrient intake. Once the range of
intake for both nutrients is so narrow, indicates that larvae tightly regulated intake of
protein and carbohydrate (Figure 3.5). Thus, resulting in an intake between 1:1 and 1:2
P:C ratios. Especially for the choice 1:1 versus 1:8, larvae regulated carbohydrates
intake very carefully. Larvae consumed different amounts of protein, carbohydrates and
P:C ratio depending on the choice offered (Table 3.5). Interestingly, larvae offered the
choice with the highest protein content (1.5:1 versus 1:4) ingested more protein and
more carbohydrate than larvae offered the lower protein combination.
In 1:1 versus 1:8 we found that the amount of protein ingested and the P:C ratio
was significantly different over time. However, the amount of carbohydrates ingested
did not differ with time (Table 3.6). In the other choice, 1.5:1 versus 1:4 only the
amount of protein was significantly different over time (Table 3.6).
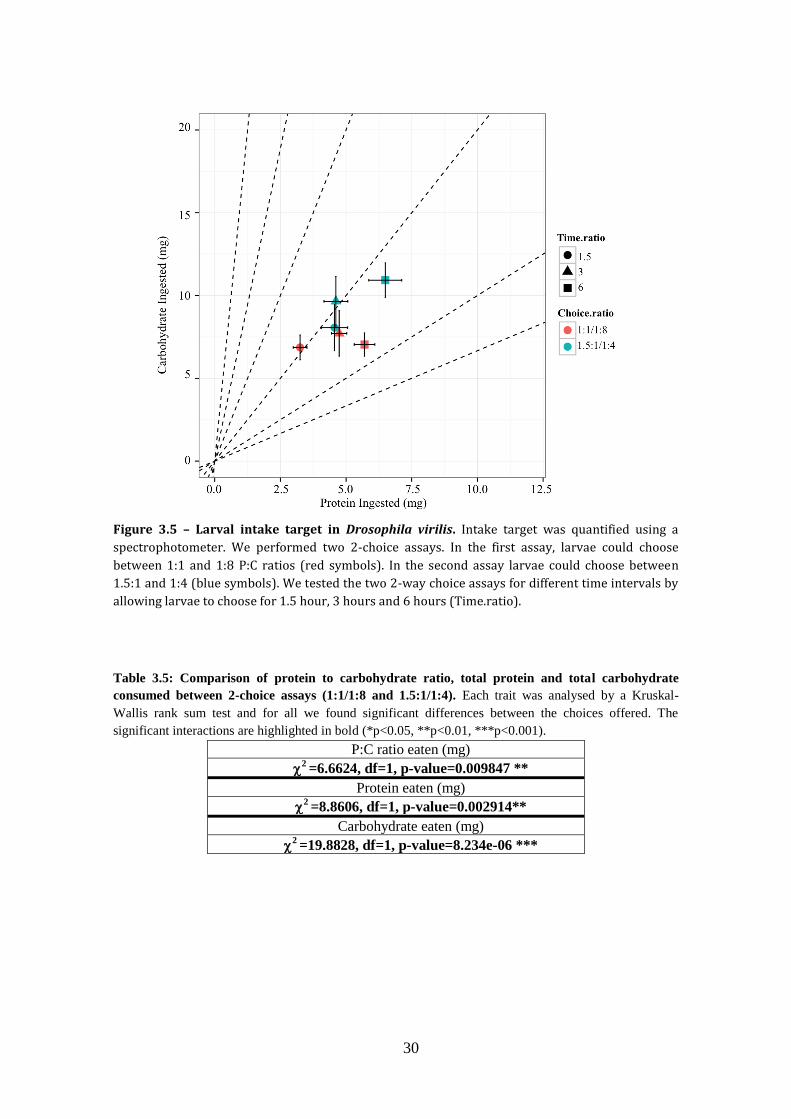
30
Figure 3.5 – Larval intake target in Drosophila virilis. Intake target was quantified using a
spectrophotometer. We performed two 2-choice assays. In the first assay, larvae could choose
between 1:1 and 1:8 P:C ratios (red symbols). In the second assay larvae could choose between
1.5:1 and 1:4 (blue symbols). We tested the two 2-way choice assays for different time intervals by
allowing larvae to choose for 1.5 hour, 3 hours and 6 hours (Time.ratio).
Table 3.5: Comparison of protein to carbohydrate ratio, total protein and total carbohydrate
consumed between 2-choice assays (1:1/1:8 and 1.5:1/1:4). Each trait was analysed by a Kruskal-
Wallis rank sum test and for all we found significant differences between the choices offered. The
significant interactions are highlighted in bold (*p<0.05, **p<0.01, ***p<0.001).
P:C ratio eaten (mg)
2 =6.6624, df=1, p-value=0.009847 **
Protein eaten (mg)
2 =8.8606, df=1, p-value=0.002914**
Carbohydrate eaten (mg)
2 =19.8828, df=1, p-value=8.234e-06 ***

31
Table 3.6 – Comparisons of the protein to carbohydrate ratio, total protein and total carbohydrate
consumed between the three time intervals (1.5, 3 and 6 hours) for each 2- choice assay (1:1/1:8 or
1.5:1/1:4). For each trait, we did a Kruskal-Wallis rank sum test and a Wilcoxon rank sum pair-wise
comparison between each pair of time intervals. The significant interactions are highlighted in bold
(*p<0.05, **p<0.01, ***p<0.001).
Choice offered Protein eaten (mg)
1:1/1:8
Time (h) 1.5 3
3 3.9e-07
6 1.3e-10 0.0048
2 =40.9911, df=2, p-value=1.256e-09 ***
Carbohydrates eaten (mg)
Time (h) 1.5 3
3 1
6 1 1
2 =0.071, df=2, p-value=0.9651
P:C ratio eaten (mg)
Time (h) 1.5 3
3 0.043
6 6.1e-05 0.252
2 =16.5652, df=2, p-value=0.0002529 ***
1.5:1/1:4
Protein eaten (mg)
Time (h) 1.5 3
3 0.015
6 1.3e-06 1.3e-06
2 =31.6958, df=2, p-value=1.31e-07 ***
Carbohydrates eaten (mg)
Time (h) 1.5 3
3 0.344
6 0.052 0.344
2 =5.7129, df=2, p-value=0.05747
P:C ratio eaten (mg)
Time (h) 1.5 3
3 0.52
6 0.63 0.46
2 =2.4186, df=2, p-value=0.2984
3.5.2 FEMALE CHOICES
So far we found that inverse developmental time, survival, body size and female
fecundity are all maximised at the highest P:C ratios. In contrast, L3 larvae regulate the
food ingestion to intermediate P:C ratios. This raises the question, do females choose to
lay their eggs in P:C ratios that are advantageous for larval development?
In this study, D. virilis females were allow to choose, for 24 hours, between three
P:C ratios, 1:1, 1:4 and 1:8. We examined the colour of the guts by eye to estimate
female food choice and counted the number of eggs in each food to assess oviposition
site choice. To account for colour preference, we alternated the colour of each P:C ratio
between the three dyes. For food choice, females avoided blue (Figure S2 and Table
S1). They showed no preference for the green or red (Figure S2 and Table S2). Females
also did not show any preference for colour for oviposition (Figure S2 and Table S2).
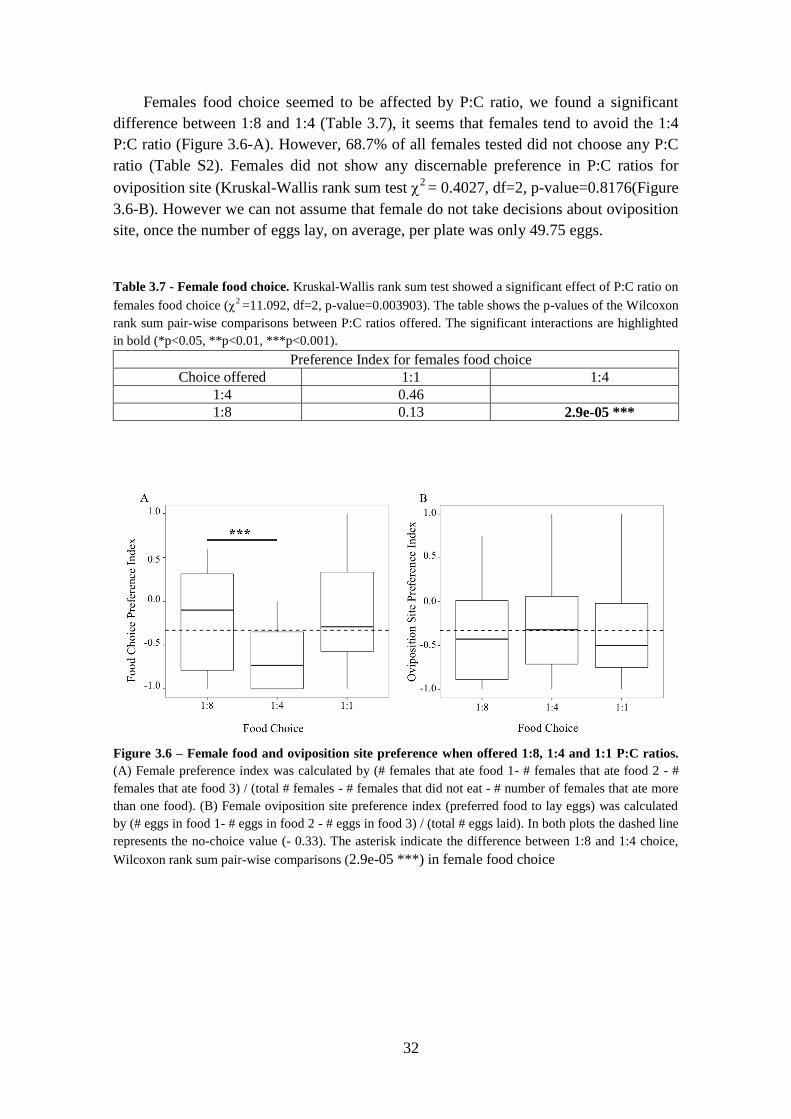
32
Females food choice seemed to be affected by P:C ratio, we found a significant
difference between 1:8 and 1:4 (Table 3.7), it seems that females tend to avoid the 1:4
P:C ratio (Figure 3.6-A). However, 68.7% of all females tested did not choose any P:C
ratio (Table S2). Females did not show any discernable preference in P:C ratios for
oviposition site (Kruskal-Wallis rank sum test 2 = 0.4027, df=2, p-value=0.8176(Figure
3.6-B). However we can not assume that female do not take decisions about oviposition
site, once the number of eggs lay, on average, per plate was only 49.75 eggs.
Table 3.7 - Female food choice. Kruskal-Wallis rank sum test showed a significant effect of P:C ratio on
females food choice (2 =11.092, df=2, p-value=0.003903). The table shows the p-values of the Wilcoxon
rank sum pair-wise comparisons between P:C ratios offered. The significant interactions are highlighted
in bold (*p<0.05, **p<0.01, ***p<0.001).
Preference Index for females food choice
Choice offered 1:1 1:4
1:4 0.46
1:8 0.13 2.9e-05 ***
Figure 3.6 – Female food and oviposition site preference when offered 1:8, 1:4 and 1:1 P:C ratios.
(A) Female preference index was calculated by (# females that ate food 1- # females that ate food 2 - #
females that ate food 3) / (total # females - # females that did not eat - # number of females that ate more
than one food). (B) Female oviposition site preference index (preferred food to lay eggs) was calculated
by (# eggs in food 1- # eggs in food 2 - # eggs in food 3) / (total # eggs laid). In both plots the dashed line
represents the no-choice value (- 0.33). The asterisk indicate the difference between 1:8 and 1:4 choice,
Wilcoxon rank sum pair-wise comparisons (2.9e-05 ***) in female food choice

33
4. DISCUSSION In this study, we sought to better understand how macronutrient in the diet
influence life history traits, developmental processes and foraging decisions in specialist
species. To accomplish this, we measured the importance of proteins and carbohydrates
on life history traits, pupal pigmentation and foraging behaviour in larvae and adult
females of the tree flux feeder, D. virilis. For this specialist species all the traits were
maximised at high P:C ratio, although larvae do not regulate intake target to maximise
any of those traits. With D. melanogaster previous data, we can increase our knowledge
about differences between generalist and specialist species.
4.1 DROSOPHILA MOJAVENSIS SONORENSIS
D. mojavensis sonorensis, is a substrate specialist, which feeds on fermented cactus
tissue (Fellows and Heed, 1972). The host cactus of this species is the Stenocereus
thurberi (Pfeiler, 2009), commonly named the organ pipe cactus.
D. mojavensis sonorensis showed low survival on all diets differing in protein and
carbohydrate content and calories. Neither proteins nor carbohydrates played any role
on this trait. This suggests that the simple sucrose/yeast medium lacks a critical
component necessary for their development and growth.
It is known that cacti contain species-specific allelochemical compositions
(Fogleman and Danielson, 2001). Drosophila species that use these cacti are thought to
be adapted to the allelochemical composition of their host (Etdges and Heed, 1987). For
example, Drosophila pachea specializes on senita cactus (Lophocereus schottii). Unlike
most Drosophila species D. pachea cannot biosynthesize the steroid hormone ecdysone
from cholesterol, a hormone important for regulating development and molting. This is
because D. pachae lacks a key enzyme, Neverland, that converts the cholesterol
metabolites to lathosterol. This species is an obligate senita cactus feeder, as the senita
cactus provides a source of lathosterol necessary for its development (Lang et al., 2012).
D. mojavensis sonorensis is a subspecies from D. mojavensis group. This
subspecies, originated due a specialization on different yeast species that colonizes
different cacti. Although this species has been in the laboratory for several years, and it
is easy to maintain with Saccharomyces cerevisiae, the yeast species used in lab food.
Since, yeast is the major source of sterols for Drosophila (Carvalho et al., 2010), in
unlikely that our results are due to a lack of sterols. However, we do know that some
component is missing. To over come this problem, we suggest to use unbalance diets
with ingredients used in lab food for a nutritional geometry framework to analyse the
effects on life history characters. It would also be interesting, with the same method to
analyse a variety of yeast species. This way, we might identify a yeast species that
confers better survival.

34
4.2 DROSOPHILA VIRILIS
Since D. virilis lays its eggs primarily in tree wounds and/or sap flux, we expected
that this species would show a different response to the macronutrient composition of its
diet than the widely studied generalist species, D. melanogaster. D. virilis can only
colonize sap flux when this is exposed to the outside were it can be colonised by yeast.
Since plant flux is relatively nutrient-poor, with cactus flux showing lower nitrogen and
phosphorus content than fruit, we would expect D. to be more tolerant to low nutrient
media (Jaenike and Markow, 2003; Markow et al., 1999).
4.2.1 SURVIVAL
Our data showed that both, the protein and carbohydrate content of the larval diet
play an important role in survival in D. virilis. Survival was maximum at high P:C
ratios, independent of the caloric content of the diet. However diets with high caloric
(1.44 Kcal/ml) content and low P:C ratios (1:4, 1:8, and 1:16), survival was low. This
suggests that high concentration of carbohydrate in larval diet is lethal for D. virilis.
This contrasts with what has been previously described regarding the effect of
macronutrients in the larval diet on life history traits D. melanogaster. Anagnostou and
co-workers (2010) showed that initial yeast cell mass, which is equivalent to food
quantity, in the larval diet does not affect D. melanogaster survival. Using a different
approach, Schwarz and co-workers (2014) measured the effects of adding sucrose to
standard food in D. melanogaster survival. They found no significant difference
between standard food and standard food with sucrose on egg to adult survival. In our
previous study with D. melanogaster, we found that survival from egg to pupa was
maximized at high P:C ratios (1.5:1 and 1:1). As a matter of fact, high content calorie
diet do not showed such a drastic effect on survival (Rodrigues et al., in review). As
expected, the specialist specie D. virilis response to a wide range of unbalance food
differs form the generalist D. melanogaster, showing that D. virilis seems to be more
sensitive to high nutrient variations on diets.
4.2.2 DEVELOPMENTAL TIME
We found that developmental time is minimised at high P:C ratios and increases
drastically in diets with low P:C and high carbohydrate contents. Larvae are vulnerable
to predation and development can be compromised due to changes in food source. For
instance, in D. mojavensis developmental time increases with the ageing of the necrotic
cactus tissue (Etges and Heed, 1987). Thus, faster developmental time is thought to be
advantageous in several situations, as in competitive ability (Krijger et al., 2001).
D. melanogaster larvae develop faster in a standard food diet supplied with sucrose
that in a standard food diet without sucrose (Schwarz et al., 2014). This outcome was
also found in our previous study, whereas D. melanogaster larvae minimized they
developmental time at 1:2, an intermediate P:C ratio (Rodrigues et al., in review). In the
present study, D. virilis larvae develop faster at extreme high protein content diet. Thus,
35
suggesting that high-protein content diet is better for our specialist species, whereas for
the generalist, D. melanogaster, a more balance P:C ratio is better.
4.2.3 BODY SIZE
Several studies have reported, in D. melanogaster, that protein diets are essential
for a proper larval development (Mirth and Riddiford, 2007; Mirth and Shingleton,
2012 and Koyama et al., 2013). Increasing protein content in D. melanogaster diet
would increase adult body size (Mirth and Shingleton, 2012). The importance of body
size is because is related to a reproductive success (Lefranc and Bundgaard 2000;
Partridge et al., 1987; Partridge and Farquhar 1983).
In our study, we found that body size is maximised at high P:C ratios in D. virilis.
Actually, body size increases with increasing protein concentration. Carbohydrates also
play a role, although of small effect on body size. In D. melanogaster, maximum body
size was accomplished in high protein diets. However, in other insects, such as
Spodoptera exempta, dry pupal mass increases by increasing carbohydrates content in
the diet (Lee et al., 2003 and Lee et al., 2004). The Lepidoptera, Spodoptera exempta
and D. virilis are both specialist species and yet both species respond differently to
macronutrients.
4.2.4 OVARIOLE NUMBER
Ovariole number is positively correlated with the number of eggs that a female will
produce (Boulétreau-Merle et al., 1982; Klepsatel et al., 2013) and is determined during
larval stage (Kerkis, 1931; King, 1970). For D. virilis ovariole number maximised at
high P:C ratios, whereas in our previous study for D. melanogaster ovariole number is
maximised at high P:C ratio (1.5:1) but for intermediate protein content. We believe that
protein is playing an important role, which is expected since ovariole formation during
larval stage requires cell division, proliferation and differentiation (Godt and Laski,
1995; Sahut-Barnola et al., 1995; Sahut-Barnola et al., 1996). Carbohydrates seem to
not affect ovariole number, except for very high content.
In generally, for the traits above, protein seems to be a key nutrient. High content
of carbohydrates also affected some traits, such as, survival and body size in a negative
way.
In our previous study, we were focus only in an outbred population of D.
melanogaster. When we compared the response between both species, we found clear
differences between them. The most obviously differences are regarding survival and
developmental time. In D. melanogaster survival was maximum at intermediate protein
content, but high P:C ratios, whereas in D. virilis we found higher survival at high P:C
ratios. Developmental time in D. melanogaster was minimized at intermediate P:C
ratios, whereas in D. virilis developmental time was minimized at high P:C ratios. Body
size and ovariole number in both D. melanogaster and D. virilis were maximized at
high P:C ratios (Figure 4.1).

36
Figure 4.1 – Summary figures for macronutrients effect on life history traits and foraging
behaviour. (A) Drosophila melanogaster, maximizes body size, ovariole number and survival at 1.5:1
P:C ratio and minimises developmental time ate 1:2 P:C ratio. Larvae regulate the intake target to 1:2/1:4
and females lay eggs on 1:8 P:C ratio (Rodrigues et al., in review). (B) Drosophila virilis all traits were
optimised at 1.5:1 P:C ratios, whereas larvae regulate intake target to 1:1/1:2 P:C ratio. Females did not
show any preference.
4.3 PUPAL PIGMENTATION
During nutritional geometry assay we found that the pupal cuticle showed variation
in its pigmentation with increasing protein concentration in the diet. The darkest pupae
were found at the highest P:C ratios, whereas the lightest pupae occurred at low P:C
ratios. In al larval diets, prepupae are white and then start to became darker. It would be
interesting to explore the dynamics of pupal pigmentation to see whether the darker
pupae undergo a longer pigmentation phase or if they pigment faster than the lighter
pupae. Furthermore, we noted a difference in the hardness of the pupal cases. The
darkest pupal cases were more brittle while the lightest cases were deformable. It would
be interesting to investigate if variation in pupal pigmentation correlated with
differences in the thickness of their pupal case.
In addition to its developmental dynamics, it would be interesting to explore the
potential advantages this variation in pigmentation might provide. D. virilis is a
holarctic species, occurring across a range of temperatures and forest types.
Pigmentation is known to play a role in thermoregulation and desiccation tolerance in
several species of Drosophila (Kronforst et al., 2012). Pigmentation in adult D.
melanogaster shows temperature plasticity, with flies reared in colder environments
being darker than those reared at warmer temperatures (Gibert et al., 2007; Kennell et
al., 2012). Potentially, darker pupal cases could be in cold climate and against
desiccation, or lighter pupae in warm climates. Although this appears to be a plausible
argument for temperature-induced plasticity, this does not explain the nutritional
plasticity in pupal pigmentation. We can also consider that this might work as a
camouflage. Another interesting possibility is whether this pigmentation differences
would, actually, be related with different thickness of pupal case in terms of giving
protection against parasitoid wasps. In this case, we speculate that a thicker pupal case
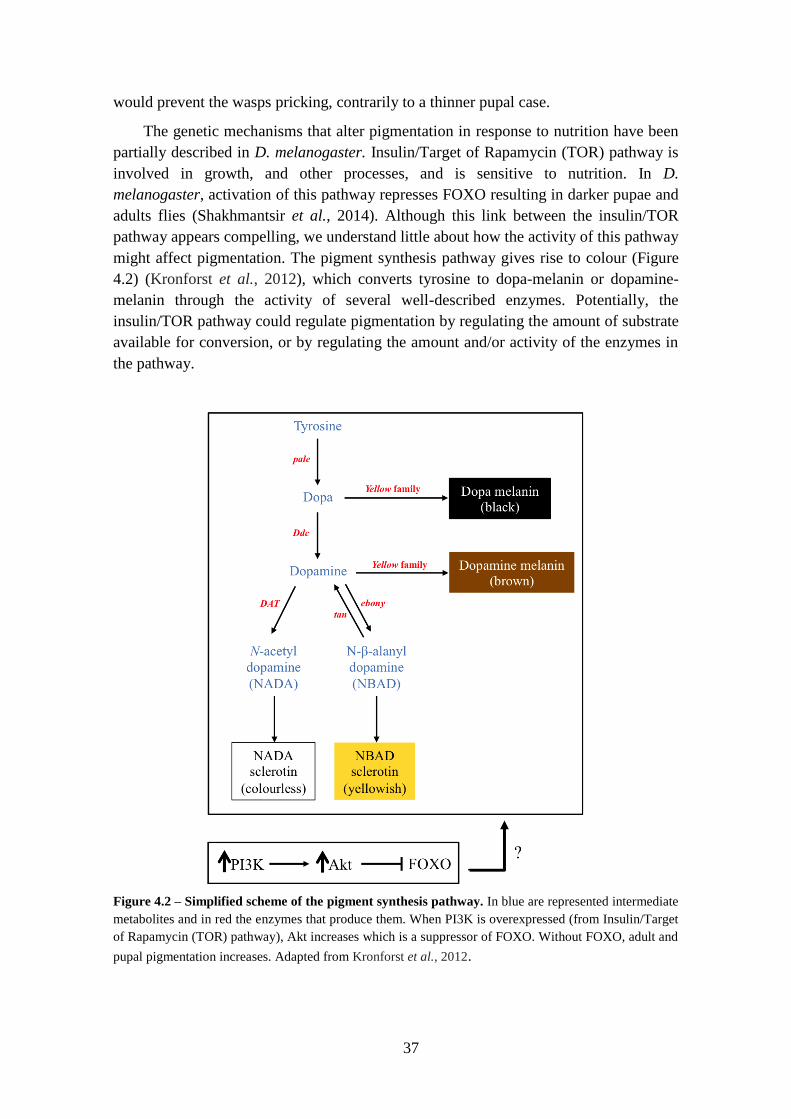
37
would prevent the wasps pricking, contrarily to a thinner pupal case.
The genetic mechanisms that alter pigmentation in response to nutrition have been
partially described in D. melanogaster. Insulin/Target of Rapamycin (TOR) pathway is
involved in growth, and other processes, and is sensitive to nutrition. In D.
melanogaster, activation of this pathway represses FOXO resulting in darker pupae and
adults flies (Shakhmantsir et al., 2014). Although this link between the insulin/TOR
pathway appears compelling, we understand little about how the activity of this pathway
might affect pigmentation. The pigment synthesis pathway gives rise to colour (Figure
4.2) (Kronforst et al., 2012), which converts tyrosine to dopa-melanin or dopamine-
melanin through the activity of several well-described enzymes. Potentially, the
insulin/TOR pathway could regulate pigmentation by regulating the amount of substrate
available for conversion, or by regulating the amount and/or activity of the enzymes in
the pathway.
Figure 4.2 – Simplified scheme of the pigment synthesis pathway. In blue are represented intermediate
metabolites and in red the enzymes that produce them. When PI3K is overexpressed (from Insulin/Target
of Rapamycin (TOR) pathway), Akt increases which is a suppressor of FOXO. Without FOXO, adult and
pupal pigmentation increases. Adapted from Kronforst et al., 2012.

38
4.4 FORAGING BEHAVIOUR
4.4.1 LARVAL CHOICES
When we offered 3rd
instar larvae to two unbalanced diets, they regulated their
intake towards a specific intake target. Our data showed that these larvae regulated their
intake for both protein and carbohydrate (Figure 3.5) within a tight range. This suggests
that D. virilis larvae avoid eating excessive amount of these macronutrients. In contrast,
our results from D. melanogaster suggest they tightly regulate their protein intake, but
show greater variation in their carbohydrate intake (Figure 4.1-A).
Interestingly, larvae regulate their intake towards a P:C ratio between 1:2 and 1:1.
In our nutritional geometry assay, all the traits were maximised at high P:C ratios. The
maxima tended to occupy a broad range of P:C ratios, and often overlapped with the 1:2
P:C ratio. The fact that larvae did not target their intake to the highest ratios, 1:1 and
1.5:1, suggests that there could be additional trade-offs of consuming the highest P:C
ratios that we did not measure. Alternatively, in foraging choice assays we used 3rd
instar larvae, whereas in nutritional geometry experiments we measured the
consequences of a particular diet provided throughout all larval stages on life history
traits. In previous studies, nutritional requirements have been shown to change with
developmental stage. Potentially, in earlier stages larvae opt for higher P:C ratios than
in the 3rd
instar. Finally, target intake can also change with time, a phenomenon known
as a moving target. For both of our choices assays, both the amount of protein eaten and
the P:C ratio ingested changed with time. In Ceratitis capitata, before wandering stage
their intake change to a more carbohydrates consumption (Zucoloto, 1987). Here we
found a possible moving intake target, in both choices, mainly for protein. Thus,
suggesting that over time their protein consumption may increase. Regarding
carbohydrates consumption we did not find any clue for a moving target. Are
carbohydrates more important, leading to a very thigh consumption regulation?
An interesting experiment would be to let D. virilis larvae feed freely on one single
unbalanced diet, for a specific amount of time and then measure how much did they eat.
If larvae try to maximise survival or pharate weight traits, then we expect to see a
regulation for proteins without regulate carbohydrates consumption, resulting in over or
under intake of carbohydrates (Figure 4.3 – A). However, if larvae decide to minimise
for developmental time and maximise ovariole number, then we will see a carefully
regulation for both nutrients (Figure 4.3 – B). The hypotheses are based on nutritional
geometry results, since for survival and pharate weight carbohydrates seem to have a
small effect, whereas for developmental time and ovariole number high content of
carbohydrates had negative effects.

39
Figure 4.3 – Two hypothetical larvae intake response. For both plots dashed lines represents P:C
ratios, whereas black dots represents larvae intake. (A) Representation of when larvae feeding ad-libitum
throughout a P:C ratio would regulate consumption for only one of the nutrients, protein in this case,
maximising survival and pharate weight. (B) Here we hypothesis that larvae would regulate for both
nutrients, proteins and carbohydrates, minimising developmental time and maximising ovariole number.
4.4.2 FEMALE CHOICES
Several studies have showed that females decide to lay their eggs depending on the
nutritional composition of the substrate and near food sources. In D. melanogaster,
females showed an obvious preference between P:C ratios for oviposition site choice.
When offered three different P:C ratios, 1:1, 1:4 and 1:8 (0.72 kcal/ml), females laid a
greater proportion of their eggs in 1:8 food and ate almost exclusively the 1:1 diet. This
seems to go against the Jaenike hypothesis, oviposition preference – offspring
performance, whereas females will choose to lay their egg in a substrate that would give
the best conditions for larval develop (Jaenike, 1978), however since substrates are
nutritionally dynamic females may predict those changes throughout larvae
development.
When we offered D. virilis females a choice between three P:C ratios, 1:1, 1:4 and
1:8 at 0.72Kcal/mL, they showed a no preference for food choice and oviposition site.
In terms of food choice, this could be because very few females ate during the duration
of our assay, with 68.7% of them not eating any diet. Also, females showed no
preference between P:C ratios in terms of oviposition. This may indicate that in D.
virilis, females do not use the P:C ratio of the substrate to make oviposition choices, but
rather rely on other cues.
Regarding feeding choice, we believe in two statements, or this result is due to a
deficiency in experimental set or D. virilis females do not make any decision.
In our experimental set, we used 0.5 mL eppendorf lids in the assay plate (Figure
4.3 - A), which has small amounts of food. Within the 24 hours of assay there is a big
probability of dehydration of food, which may affect the quality of food and
consequently females decision. An alternative to that is to use a whole food plate like
the drawn from Figure 4.3 - B.
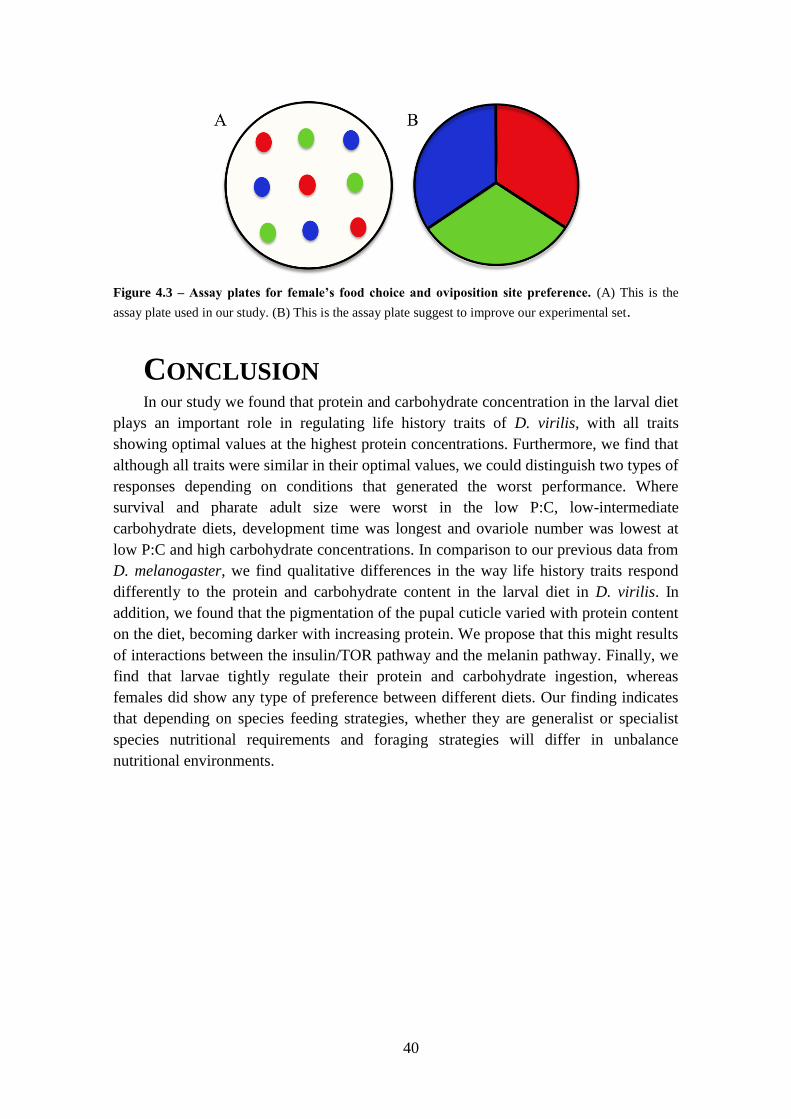
40
Figure 4.3 – Assay plates for female’s food choice and oviposition site preference. (A) This is the
assay plate used in our study. (B) This is the assay plate suggest to improve our experimental set.
CONCLUSION In our study we found that protein and carbohydrate concentration in the larval diet
plays an important role in regulating life history traits of D. virilis, with all traits
showing optimal values at the highest protein concentrations. Furthermore, we find that
although all traits were similar in their optimal values, we could distinguish two types of
responses depending on conditions that generated the worst performance. Where
survival and pharate adult size were worst in the low P:C, low-intermediate
carbohydrate diets, development time was longest and ovariole number was lowest at
low P:C and high carbohydrate concentrations. In comparison to our previous data from
D. melanogaster, we find qualitative differences in the way life history traits respond
differently to the protein and carbohydrate content in the larval diet in D. virilis. In
addition, we found that the pigmentation of the pupal cuticle varied with protein content
on the diet, becoming darker with increasing protein. We propose that this might results
of interactions between the insulin/TOR pathway and the melanin pathway. Finally, we
find that larvae tightly regulate their protein and carbohydrate ingestion, whereas
females did show any type of preference between different diets. Our finding indicates
that depending on species feeding strategies, whether they are generalist or specialist
species nutritional requirements and foraging strategies will differ in unbalance
nutritional environments.
41
BIBLIOGRAPHY
Anagnostou, C., Dorsch, M., & Rohlfs, M. (2010). Influence of dietary yeasts on
Drosophila melanogaster life-history traits. Entomologia Experimentalis et
Applicata, 136(1), 1–11. doi:10.1111/j.1570-7458.2010.00997
Baldal, E. a, van der Linde, K., van Alphen, J. J. M., Brakefield, P. M., & Zwaan, B. J.
(2005). The effects of larval density on adult life-history traits in three species of
Drosophila. Mechanisms of Ageing and Development, 126(3), 407–16.
doi:10.1016/j.mad.2004.09.035
Bernays, E. A., & Minkenberg, O. P. J. M. (1997). INSECT HERBIVORES:
DIFFERENT REASONS FOR BEING A GENERALIST. Ecology, 78(4), 1157–
1169. doi:10.1890/0012-9658
Boulétreau-Merle, J., Allemand, R., Cohet, Y., & David, J. R. (1982). Reproductive
strategy in Drosophila melanogaster: Significance of a genetic divergence between
temperate and tropical populations. Oecologia, 53(3), 323–329.
doi:10.1007/BF00389008
Burger, J. M. S., Buechel, S. D., & Kawecki, T. J. (2010). Dietary restriction affects
lifespan but not cognitive aging in Drosophila melanogaster. Aging Cell, 9(3),
327–35. doi:10.1111/j.1474-9726.2010.00560
Carvalho, M., Schwudke, D., Sampaio, J. L., Palm, W., Riezman, I., Dey, G., … Eaton,
S. (2010). Survival strategies of a sterol auxotroph. Development (Cambridge,
England), 137(21), 3675–85. doi:10.1242/dev.044560
Drummond-Barbosa, D., & Spradling, a C. (2001). Stem cells and their progeny
respond to nutritional changes during Drosophila oogenesis. Developmental
Biology, 231(1), 265–78. doi:10.1006/dbio.2000.0135
Dweck, H. K. M., Ebrahim, S. a M., Kromann, S., Bown, D., Hillbur, Y., Sachse, S., …
Stensmyr, M. C. (2013). Olfactory preference for egg laying on citrus substrates in
Drosophila. Current Biology : CB, 23(24), 2472–80.
doi:10.1016/j.cub.2013.10.047
Emlen, D. J. (1994). Environmental Control of Horn Length Dimorphism in the Beetle
Onthophagus acuminatus (Coleoptera: Scarabaeidae). Proceedings of the Royal
Society of London. Series B: Biological Sciences , 256 (1346 ), 131–136.
doi:10.1098/rspb.1994.0060
Etges, W. J., & Heed, W. B. (1987). Sensitivity to larval density in populations of
Drosophila mojavensis: Influences of host plant variation on components of
fitness. Oecologia, 71(3), 375–381. doi:10.1007/BF00378710
42
Fanson, B. G., & Taylor, P. W. (2012). Protein:carbohydrate ratios explain life span
patterns found in Queensland fruit fly on diets varying in yeast:sugar ratios. Age
(Dordrecht, Netherlands), 34(6), 1361–8. doi:10.1007/s11357-011-9308-3
Fanson, B. G., Weldon, C. W., Pérez-Staples, D., Simpson, S. J., & Taylor, P. W.
(2009). Nutrients, not caloric restriction, extend lifespan in Queensland fruit flies
(Bactrocera tryoni). Aging Cell, 8(5), 514–23. doi:10.1111/j.1474-
9726.2009.00497
Fellows, D. P., & Heed, W. B. (1972). Factors Affecting Host Plant Selection in Desert-
Adapted Cactiphilic Drosophila. Ecology, 53(5), 850–858. doi:10.2307/1934300
FITT, G. P. (1990). Variation in ovariole number and egg size of species of Dacus
(Diptera; Tephritidae) and their relation to host specialization. Ecological
Entomology, 15(3), 255–264. doi:10.1111/j.1365-2311.1990.tb00807
Fogleman, J. C., & Danielson, P. B. (2001). Chemical interactions in the cactus-
microorganism-Drosophila model system of the Sonoran Desert. American
Zoologist, 41(4), 877–889.
Gardiner, B. C. (1974). Observations on green pupae in Papilio machaon L. and Pieris
brassicae L. Wilhelm Roux’ Archiv Für Entwicklungsmechanik Der Organismen,
176(1), 13–22. doi:10.1007/BF00577829
Gibert, J.-M., Peronnet, F., & Schlötterer, C. (2007). Phenotypic plasticity in Drosophila
pigmentation caused by temperature sensitivity of a chromatin regulator network.
PLoS Genetics, 3(2), e30. doi:10.1371/journal.pgen.0030030
Godt, D., & Laski, F. a. (1995). Mechanisms of cell rearrangement and cell recruitment
in Drosophila ovary morphogenesis and the requirement of bric à brac.
Development (Cambridge, England), 121(1), 173–87.
Huang, X., Hancock, D. P., Gosby, A. K., McMahon, A. C., Solon, S. M. C., Le
Couteur, D. G., … Simpson, S. J. (2013). Effects of dietary protein to carbohydrate
balance on energy intake, fat storage, and heat production in mice. Obesity (Silver
Spring, Md.), 21(1), 85–92. doi:10.1002/oby.20007
Ja, W. W., Carvalho, G. B., Zid, B. M., Mak, E. M., Brummel, T., & Benzer, S. (2009).
Water- and nutrient-dependent effects of dietary restriction on Drosophila lifespan.
Proceedings of the National Academy of Sciences of the United States of America,
106(44), 18633–7. doi:10.1073/pnas.0908016106
Jaenike, J. (1978). On optimal oviposition behavior in phytophagous insects.
Theoretical Population Biology, 14(3), 350–356. doi:10.1016/0040-
5809(78)90012-6
43
Jaenike, J., & Markow, T. a. (2003). Comparative elemental stoichiometry of
ecologically diverse Drosophila. Functional Ecology, 17(1), 115–120.
doi:10.1046/j.1365-2435.2003.00701.x
Kambysellis MP, Heed WB. 1971 Studies of oogenesis in natural populations of
Drosophilidae. I. Relation of ovarian development and ecological habitats of the
Hawaiian species. Am. Nat. 941, 31 – 49. doi:10.1086/282700
Kennell, J. a, Cadigan, K. M., Shakhmantsir, I., & Waldron, E. J. (2012). The
microRNA miR-8 is a positive regulator of pigmentation and eclosion in
Drosophila. Developmental Dynamics : An Official Publication of the American
Association of Anatomists, 241(1), 161–8. doi:10.1002/dvdy.23705
Kerkis, J. (1931). The Growth of the Gonads in DROSOPHILA MELANOGASTER.
Genetics, 16(3), 212–224.
King, R. C. (1970). Ovarian Development in Drosophila melanogaster. (227pp).
Klepsatel, P., Gáliková, M., De Maio, N., Ricci, S., Schlötterer, C., & Flatt, T. (2013).
Reproductive and post-reproductive life history of wild-caught Drosophila
melanogaster under laboratory conditions. Journal of Evolutionary Biology, 26(7),
1508–1520. doi:10.1111/jeb.12155
Koyama, T., Mendes, C. C., & Mirth, C. K. (2013). Mechanisms regulating nutrition-
dependent developmental plasticity through organ-specific effects in insects.
Frontiers in Physiology, 4(September), 263. doi:10.3389/fphys.2013.00263
Krijger, C. L., Peters, Y. C., & Sevenster, J. G. (2001). Competitive ability of
neotropical Drosophila predicted from larval development times. Oikos, 92(2),
325–332. doi:10.1034/j.1600-0706.2001.920215.x
Kronforst, M. R., Barsh, G. S., Kopp, A., Mallet, J., Monteiro, A., Mullen, S. P., …
Hoekstra, H. E. (2012). Unraveling the thread of nature’s tapestry: the genetics of
diversity and convergence in animal pigmentation. Pigment Cell & Melanoma
Research, 25(4), 411–33. doi:10.1111/j.1755-148X.2012.01014.x
Lachaise, D., Tsacas, L. & Couturier, G. (1982) The Drosophilidae associated with
tropical African figs. Evolution 36, 141-151
Lang, M., Murat, S., Clark, A. G., Gouppil, G., Blais, C., Matzkin, L. M., … Orgogozo,
V. (2012). Mutations in the neverland gene turned Drosophila pachea into an
obligate specialist species. Science (New York, N.Y.), 337(6102), 1658–61.
doi:10.1126/science.1224829

44
Leather, S. R., Wellings, P. W., & Walters, K. F. A. (1988). Variation in ovariole
number within the Aphidoidea. Journal of Natural History, 22(2), 381–393.
doi:10.1080/00222938800770271
Lee, K. P., Behmer, S. T., Simpson, S. J., & Raubenheimer, D. (2002). A geometric
analysis of nutrient regulation in the generalist caterpillar Spodoptera littoralis
(Boisduval). Journal of Insect Physiology, 48(6), 655–665.
Lee, K. P., Raubenheimer, D., Behmer, S. T., & Simpson, S. J. (2003). A correlation
between macronutrient balancing and insect host-plant range: evidence from the
specialist caterpillar Spodoptera exempta (Walker). Journal of Insect Physiology,
49(12), 1161–1171. doi:10.1016/j.jinsphys.2003.08.013
Lee, K. P., Simpson, S. J., Clissold, F. J., Brooks, R., Ballard, J. W. O., Taylor, P. W.,
… Raubenheimer, D. (2008). Lifespan and reproduction in Drosophila: New
insights from nutritional geometry. Proceedings of the National Academy of
Sciences of the United States of America, 105(7), 2498–503.
doi:10.1073/pnas.0710787105
Lee, K. P., Simpson, S. J., & Raubenheimer, D. (2004). A comparison of nutrient
regulation between solitarious and gregarious phases of the specialist caterpillar,
Spodoptera exempta (Walker). Journal of Insect Physiology, 50(12), 1171–80.
doi:10.1016/j.jinsphys.2004.10.009
Lefranc A, Bundgaard J (2000) The influence of male and female body size on
copulation duration and fecundity in Drosophila melanogaster. Hereditas 132:243–
247
Markow, T. A., & O’Grady, P. M. (2005). EVOLUTIONARY GENETICS OF
REPRODUCTIVE BEHAVIOR IN DROSOPHILA: Connecting the Dots. Annual
Review of Genetics, 39(1), 263–291. doi:10.1146/annurev.genet.
39.073003.112454
Markow, T. a., Raphael, B., Dobberfuhl, D., Breitmeyer, C. M., Elser, J. J., & Pfeiler, E.
(1999). Elemental stoichiometry of Drosophila and their hosts. Functional
Ecology, 13(1), 78–84. doi:10.1046/j.1365-2435.1999.00285.x
Matzkin, L. M., Johnson, S., Paight, C., Bozinovic, G., & Markow, T. a. (2011). Dietary
protein and sugar differentially affect development and metabolic pools in
ecologically diverse Drosophila. The Journal of Nutrition, 141(6), 1127–33.
doi:10.3945/jn.111.138438
Mayntz, D., Raubenheimer, D., Salomon, M., Toft, S., & Simpson, S. J. (2005).
Nutrient-specific foraging in invertebrate predators. Science (New York, N.Y.),
307(5706), 111–3. doi:10.1126/science.1105493

45
Min, K.-J., Flatt, T., Kulaots, I., & Tatar, M. (2007). Counting calories in Drosophila
diet restriction. Experimental Gerontology, 42(3), 247–51. doi:10.1016/j.exger
.2006.10.009
Mirth, C. K., & Riddiford, L. M. (2007). Size assessment and growth control: how adult
size is determined in insects. BioEssays : News and Reviews in Molecular, Cellular
and Developmental Biology, 29(4), 344–55. doi:10.1002/bies.20552
Mirth, C. K., & Shingleton, A. W. (2012). Integrating body and organ size in
Drosophila: recent advances and outstanding problems. Frontiers in
Endocrinology, 3(April), 49. doi:10.3389/fendo.2012.00049
Mirth, C., Truman, J. W., & Riddiford, L. M. (2005). The role of the prothoracic gland
in determining critical weight for metamorphosis in Drosophila melanogaster.
Current Biology : CB, 15(20), 1796–807. doi:10.1016/j.cub.2005.09.017
Nunney, L. (1990). Drosophila on Oranges: Colonization, Competition, and
Coexistence. Ecology, 71(5), 1904–1915. doi:10.2307/1937598
Partridge, L., Ewing, A., & Chandler, A. (1987). Male size and mating success in
Drosophila melanogaster: the roles of male and female behaviour. Animal
Behaviour, 35(2), 555–562. doi:10.1016/S0003-3472(87)80281-6
Partridge, L., & Farquhar, M. (1983). Lifetime mating success of male fruitflies
(Drosophila melanogaster) is related to their size. Animal Behaviour, 31(3), 871–
877. doi:10.1016/S0003-3472(83)80242-5
Partridge, L., Piper, M. D. W., & Mair, W. (2005). Dietary restriction in Drosophila.
Mechanisms of Ageing and Development, 126(9), 938–50.
doi:10.1016/j.mad.2005.03.023
Raubenheimer, D., & Simpson, S. J. (2003). Nutrient balancing in grasshoppers:
behavioural and physiological correlates of dietary breadth. Journal of
Experimental Biology, 206(10), 1669–1681. doi:10.1242/jeb.00336
Raubenheimer, D., & Jones, S. a. (2006). Nutritional imbalance in an extreme generalist
omnivore: tolerance and recovery through complementary food selection. Animal
Behaviour, 71(6), 1253–1262. doi:10.1016/j.anbehav.2005.07.024
Raubenheimer, D., & Simpson, S. J. (1999). Integrating nutrition: a geometrical
approach. Entomologia Experimentalis et Applicata, 91(1), 67–82.
doi:10.1046/j.1570-7458.1999.00467.x
46
Ribeiro, C., & Dickson, B. J. (2010). Sex peptide receptor and neuronal TOR/S6K
signaling modulate nutrient balancing in Drosophila. Current Biology : CB, 20(11),
1000–5. doi:10.1016/j.cub.2010.03.061
Rodrigues, M.A., Martins, N.E., Balancé, L.F., Broom, L.N., Dias, A.J.S., Fernandes,
A.S.D., Rodrigues, F., Sucena, E., and Mirth, C.K.. Drosophila melanogaster
larvae make foraging choices to minimize developmental time. In review.
Sahut-Barnola, I., Dastugue, B., & Couderc, J. L. (1996). Terminal filament cell
organization in the larval ovary of Drosophila melanogaster: Ultrastructural
observations and pattern of divisions. Roux’s Archives of Developmental Biology,
205(7-8), 356–363.
Sahut-Barnola, I., Godt, D., Laski, F. A., & Couderc, J. L. (1995). Drosophila ovary
morphogenesis: analysis of terminal filament formation and identification of a
gene required for this process. Developmental Biology, 170(1), 127–35.
doi:10.1006/dbio.1995.1201
Schiabor Allison S Eisen, Michael, K. M. Q. (2014). Non-respiratory functions of
Saccharomyces cerevisiae mitochondria are required for optimal attractiveness to
Drosophila melanogaster. bioRxiv.
Schwartz, N. U., Zhong, L., Bellemer, A., & Tracey, W. D. (2012). Egg laying
decisions in Drosophila are consistent with foraging costs of larval progeny. PloS
One, 7(5), e37910. doi:10.1371/journal.pone.0037910
Schwarz, S., Durisko, Z., & Dukas, R. (2014). Food selection in larval fruit flies:
dynamics and effects on larval development. Die Naturwissenschaften, 101(1), 61–
8. doi:10.1007/s00114-013-1129-z
Shakhmantsir, I., Massad, N. L., & Kennell, J. a. (2014). Regulation of cuticle
pigmentation in drosophila by the nutrient sensing insulin and TOR signaling
pathways. Developmental Dynamics : An Official Publication of the American
Association of Anatomists, 243(3), 393–401. doi:10.1002/dvdy.24080
Simpson, S. J., Batley, R., & Raubenheimer∗ , D. (2003). Geometric analysis of
macronutrient intake in humans: the power of protein? Appetite, 41(2), 123–140.
doi:10.1016/S0195-6663(03)00049-7
Simpson, S. J., & Raubenheimer, D. (1993). A Multi-Level Analysis of Feeding
Behaviour: The Geometry of Nutritional Decisions. Philosophical Transactions of
the Royal Society B: Biological Sciences, 342(1302), 381–402.
doi:10.1098/rstb.1993.0166
47
Simpson, S. J., & Raubenheimer, D. (2005). Obesity: the protein leverage hypothesis.
Obesity Reviews : An Official Journal of the International Association for the
Study of Obesity, 6(2), 133–42. doi:10.1111/j.1467-789X.2005.00178.x
Simpson, S. J., and Raubenheimer, D. (2012). ‘The Nature of Nutrition: a Unifying
Framework from Animal Adaptation to Human Obesity. (Princeton University
Press: Princeton, NJ.)
Simpson, S. J., Raubenheimer, D., Behmer, S. T., Whitworth, a, & Wright, G. a. (2002).
A comparison of nutritional regulation in solitarious- and gregarious-phase nymphs
of the desert locust Schistocerca gregaria. The Journal of Experimental Biology,
205(Pt 1), 121–9.
Sokoloff, A. (1966). Morphological Variation in Natural and Experimental Populations
of Drosophila pseudoobscura and Drosophila persimilis. Evolution, 20(1), 49–71.
Spieth, H. T. (1979). The Virilis Group of Drosophila and the Beaver Castor. The
America Naturalist, 114(2), 312–316.
Stone, W. S., Guest, W. C., & Wilson, F. D. (1960). . THE EVOLUTIONARY
IMPLICATIONS OF THE CYTOLOGICAL POLYMORPHISM AND
PHYLOGENY OF THE VIRILIS GROUP OF DROSOPHILA. Proceedings of the
National Academy of Sciences, 46(3), 350–361. doi:10.1073/pnas.46.3.350
Throckmorton, L. H. (1977). Drosophila Systematics and Biochemical Evolution.
Annual Review of Ecology and Systematics, 8(1), 235–254.
doi:10.1146/annurev.es.08.110177.001315
Throckmorton, L.H. (1982) The virilis species group. In The Genetics and Biology of
Drosophila, Vol. 3b (Ashburner, M., Carson, H.L. and Thompson, J.N. Jr., eds),
pp. 227–296. Academic Press, London
Trumper, S., & Simpson, S. J. (1993). Regulation of salt intake by nymphs of Locusta
migratoria. Journal of Insect Physiology, 39(10), 857–864. doi:10.1016/0022-
1910(93)90118-B
Zhou, H., Cadigan, K. M., & Thiele, D. J. (2003). A copper-regulated transporter
required for copper acquisition, pigmentation, and specific stages of development
in Drosophila melanogaster. The Journal of Biological Chemistry, 278(48), 48210–
8. doi:10.1074/jbc.M309820200
Zucoloto, F. S. (1987). Feeding habits of Ceratitis capitata (Diptera: Tephritidae): Can
larvae recognize a nutritionally effective diet? Journal of Insect Physiology, 33(5),
349–353. doi:10.1016/0022-1910(87)90123-5

48

49
SUPPLEMENTARY INFORMATION
Figure S1 – Larvae show a preference for red when offered a choice between 1:1 and 1:8 but do not
have a colour preference in the 1.5:1 and 1:4 choice. As a control for possible colour preference, we
quantified the total percentage of each dye (red and blue) ingested by larvae for each food choice offered
by spectrophotometer. Asterisks represents the Wilcoxon signed rank test V=609 and p-value=0.02451
for red colour preference (*p<0.05, **p<0.01, ***p<0.001).
Figure S2 – Female Colour choice for food and oviposition preference. (A) Female preference index
when offered Blue, Green and Red colours. Preference index was calculated by (# females that ate Blue -
# females that ate Green - # females that ate Red) / (total # females - # females that did not eat - # number
of females that ate more than one colour). (B) Female oviposition colour preference index (preferred
colour to lay their eggs) when offered Blue, Green and Red colours. Preference index for oviposition
colour site was calculated by (# eggs in Blue - # eggs in Green - # eggs in Red) / (total # eggs laid). In
both plots the dashed line represents the no-choice value (- 0.33). The asterisks indicate significant
difference to the no-choice value (-0.33).

50
Table S1: Female food and oviposition colour choice. The table represents a Wilcoxon signed rank test
for each colour offered. Significant values are shown in bold. The significant interactions are highlighted
in bold (*p<0.05, **p<0.01, ***p<0.001).
Female Colour Choice
Blue Green Red
V 48 158 148
p-value 0.01087 * 0.3134 0.4945
Oviposition Colour Choice
Blue Green Red
V 131 124 88
p-value 0.8967 0.9482 0.2172
Table S2 – Percentage and absolute number of females analysed (Total Females), females that did not
choose any P:C ratio (No Choice), females that ate more than one P:C ratio(Mix Choice) and females that
actually chose one of the P:C ratios offered (Choice). Only the females that chose one of the P:C ratios
offered were used for the food choice preference index.
Total Females No Choice Mix Choice Choice
473 325 3 145
100% 68.7% 0.6% 30.7%