Embed Size (px)
Citation preview
CH2M HILL
2485 Natomas Park Drive
Suite 600
Sacramento, CA 95833-2397
Tel 916.920.0300
Fax 916.920.8463
April 25, 2011 Ms. Christine Stora Compliance Project Manager 01-AFC-19C California Energy Commission 1516 Ninth Street Sacramento, CA 95814 Subject: Cosumnes Power Plant Project (01-AFC-19C) Petition for Post-certification
License Amendment for Fuel Supply Modifications and Revisions to Conditions of Certification AQ-17, AQ-18, AQ-19, AQ-24 and WATER RES-1 Response to CEC Staff Data Requests # 1–11
Dear Ms. Stora:
Please find attached a copy of the Cosumnes Power Plant Project data responses. The data responses were prepared in response to California Energy Commission Staff Data Requests 1 through 11 for the Petition for Post-certification License Amendment for Fuel Supply Modifications and Revisions to Conditions of Certification AQ-17, AQ-18, AQ-19, AQ-24 and WATER RES-1 (01-AFC-19C), dated March 25, 2011. If you have any questions, please contact me at (916) 286-0221. Sincerely, CH2M HILL
Keith McGregor Project Manager Attachment Cc: Brad Jones, Sacramento Municipal Utility District
DATE APR 25 2011
RECD. APR 25 2011
DOCKET01-AFC-19C
Cosumnes Power Plant Petition for Post-certification
License Amendment (01-AFC-19C)
Data Responses, Set 1 (Response to Data Requests Nos. 1 to 11)
Submitted to California Energy Commission
Submitted by Sacramento Municipal Utility District Financing Authority
With Assistance from
2485 Natomas Park Drive
Suite 600 Sacramento, CA 95833
April 2011
SAC/408620/111150004 (CPP DR SET 1_APR11) iii
Contents
Section Page Introduction .......................................................................................................................................... 1
Air Quality (1-4) ................................................................................................................................... 3
Soils and Water Resources (5-9) ............................................................................................ DR3-1-1
Waste Management (10-11) .................................................................................................... DR6-1-1
Table
DR4-1 Ambient Air Quality Impacts
Attachments
DR3-1 Support of Equations for Converting Liquid Droplet Size to Corresponding Solid Particle Size
DR5-1 Raw Water Head Loss Calculations DR6-1 CPP Water Use Summary DR10-1 Cosumnes Power Plant Waste Management Plan
SAC/408620/111150004 (CPP_PTA_DATA_RESPONSES.DOCX) 1
Introduction
Attached are Sacramento Municipal Utility District Financing Authority’s (SFA’s) responses to the California Energy Commission (CEC) Staff data request numbers 1 through 11 for the Cosumnes Power Plant (CPP) Petition for Post-certification License Amendment (01-AFC-19C). The data requests were prepared by the CEC Staff on March 25, 2011.
The responses are grouped by individual discipline or topic area. Within each discipline area, the responses are presented in the same order as the CEC presented them and are keyed to the Data Request numbers (1 through 11). New graphics or tables are numbered in reference to the Data Request number. For example, the first table used in response to Data Request 6 would be numbered Table DR6-1. The first figure used in response to Data Request 10 would be Figure DR10-1, and so on.
Additional tables, figures, or documents submitted in response to a data request (e.g., supporting data, stand-alone documents such as plans, and folding graphics) are found at the end of each discipline-specific section and are not sequentially page-numbered consistently with the remainder of the document, although they may have their own internal page numbering system.
SAC/408620/111150004 (CPP_PTA_DATA_RESPONSES.DOCX) 3
Air Quality (1-4)
Background: Fuel Use The proposed petition to amend would allow the Cosumnes Power Plant Project (CPP) to incorporate digester gas into its fuel supply that would otherwise be burned at the Carson Ice-Gen. The incorporation of digester gas could enhance SMUD's renewable energy portfolio by using the fuel in a more efficient way. However, the proposed project would result in an increase of sulfur dioxide (SOx) emissions and an increase in the gas volume flow at CPP to maintain the rated turbine output.
Data Requests 1. What type of fuel would be used at the Carson Ice-Gen to displace the
digester gas being redirected to the CPP?
Response:
The Carson Energy Ice-Gen facility, also known as the Central Valley Financing Authority (CFVA) Cogeneration plant, will burn natural gas to displace the digester gas being redirected to Cosumnes Power Plant (CPP) project.
2. Would there be a decrease in emissions of SOx at the Carson Ice-Gen equal to, or greater than, the increase proposed at the CPP?
Response:
There will be a decrease in SOx emissions at the Carson Ice-Gen facility that will be equal to or greater than the SOx emission increase proposed at the CPP because of redirecting the digester gas from the Carson Ice-Gen facility to CPP. However, the CVFA requires the operational flexibility to burn the digester gas at the Carson Ice-Gen facility in the event that the gas cannot be sent to CPP because of equipment upset/malfunction or scheduled outage (e.g., a temporary shutdown of the gas turbines at CPP). Therefore, the SFA does not propose a condition of certification mandating this reduction in SOx emissions at the Carson Ice-Gen facility.
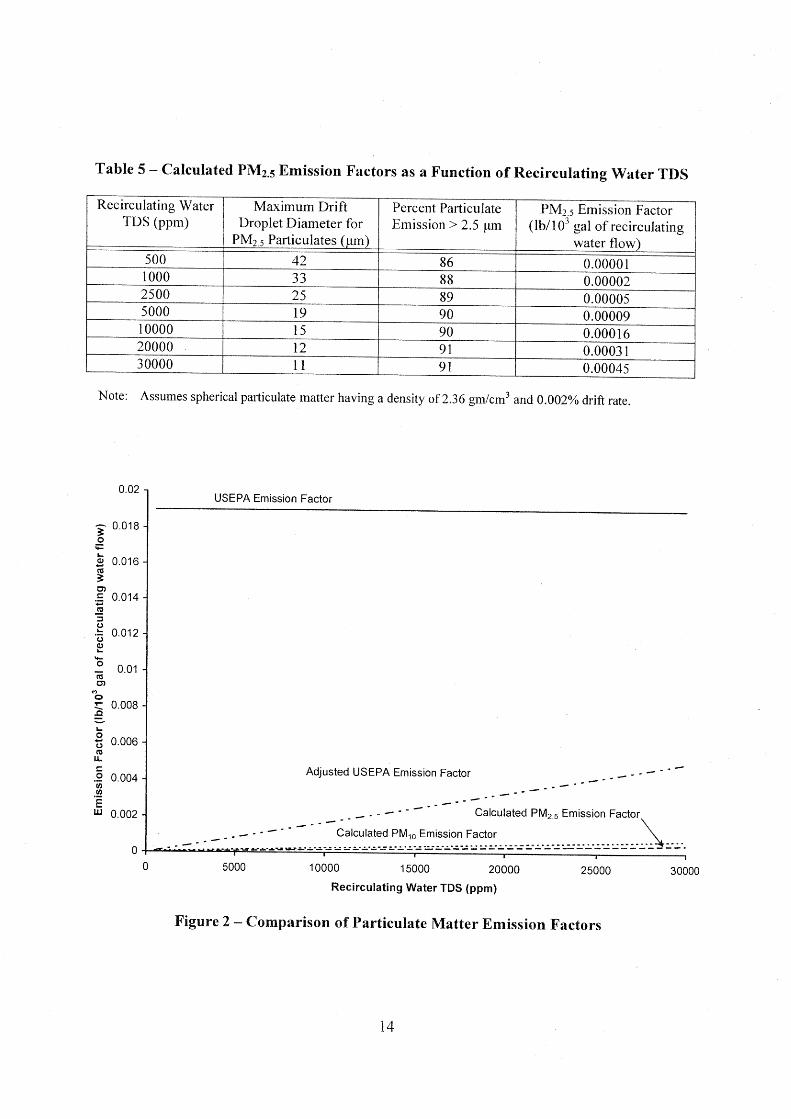
Background: Cooling Tower The proposed petition to amend would increase the allowable total dissolved solids (TDS) level in the cooling tower recirculation water from 800 ppmw to 1,500 ppmw, measured over 3-hour averaging period. The higher TDS levels would potentially result in higher emissions of particulate matter less than 10 micrometers in aerodynamic diameter (PM10) from the CPP cooling tower. CPP has requested the use of a correction factor of approximately 67%, when quantifying PM10 emissions from the cooling tower. The request is in light of a recent study that suggests a single particle will form when a single water droplet evaporates. From this, predicted mass distribution of drift droplet sizes for this project estimates that approximately 67% of the emissions would be PM10. Staff does not necessarily agree with this assumption, based on a lack of evidence.
AIR QUALITY (1-4)
4 SAC/408620/111150004 (CPP_PTA_DATA_RESPONSES.DOCX)
The cooling tower was analyzed in 2003 during the licensing certification, and then again in 2007 during an amendment with the conservative assumption that 100% of the emissions are PM10. Staff has the obligation to ensure mitigation for the worst case scenario. The inability to accurately quantify emissions from these types of sources requires staff to conservatively assume that 100% of the emissions are PM10, unless proven otherwise.
Data Request 3. If the 67 percent correction factor is used, can CPP identify source testing
methods that would confirm that PM10 emissions from the cooling tower are below 0.39 Ib/hr (or that 67 percent of the emissions are PM10) and commit to a condition of certification that would require this as verification to ensure that all project emissions are appropriately mitigated?
Response:
SFA has reviewed U.S. Environmental Protection Agency (EPA)-approved particulate compliance test methods and is unable to identify a method that will account for the two-step process that forms the basis for the cooling tower PM10 emissions calculated in the CPP Petition to Amend. However, Step 1 in this cooling tower PM10 emission calculation is determining the size distribution of the water droplets in the drift exhausted from the CPP cooling tower. As discussed in the Petition to Amend, the water droplet size distribution of the CPP cooling tower drift was based on information provided by the manufacturer of the CPP cooling tower drift eliminator.1 Step 2 involves calculating the resulting solid particulate diameter after the water droplets evaporate in the atmosphere. When a water droplet containing solids evaporates, the dissolved solids contained in the water droplet form a solid particle, which remains suspended in the air. The basis for step 2 was also discussed in the amendment petition and is based on the physical properties of aerosols. The amendment petition also included references to the studies/papers that supported the equations used in the amendment petition to convert the liquid droplet size to the corresponding solid particle size. Included in Attachment DR3-1 are copies of these studies/papers referenced in the amendment petition.
SFA also contacted three well-known stack testing firms—Airkinetics, Avogadro Group, and Broadbent and Associates—and learned that while these firms could take EPA-approved stack testing equipment/procedures and adapt them to sample the exhaust from wet cooling towers, this type of particulate testing has a number of significant issues that will affect the accuracy of the PM10 emission test results. These issues include sampling problems resulting from cyclonic flow of exhaust from the wet cooling tower fan vents and problems with using particulate size cut methods (e.g., cyclones) in the front part of the sampling probe so that only PM10 particles are captured by the sampling equipment.
In addition, as discussed in the petition to amend, the proposed approach to calculating PM10 emissions from a wet cooling tower was also used and approved by the CEC for the Elk Hills Power Plant. Based on a review of the CEC Conditions of Certification for the Elk Hills Power Plant, this facility is not required to perform a cooling tower PM10 compliance test to confirm the calculated PM10 emissions. In addition, based on a review of CEC
1 Petition for Post Certification License to Amend, Appendix C, December 2010.
AIR QUALITY (1-4)
SAC/408620/111150004 (CPP_PTA_DATA_RESPONSES.DOCX) 5
approvals of combined cycle power plants over the past several years, PM10 emission compliance testing of wet cooling towers is generally not required.
Because the SFA is concerned that the existing wet cooling tower test methods cannot replicate the two-step process in the PM10 calculation methodology and because of the above issues that affect the accuracy of PM10 emission testing methods adapted to sample wet cooling towers, the SFA does not believe a condition of cooling tower testing program for the proposed CPP amendment is appropriate.
Background: Mitigation During the original licensing of the CPP, 158,984 Ib/year of PM10 emission reduction credits (ERC) were provided to mitigate the facility impacts. During the 2007 amendment, another 1,411 Ib/year of PM10 ERC's were provided to mitigate the change in operating parameters for the cooling tower. The ERC's provided were a combination of PM10/2.5 ERG's and inter-pollutant trading of SOx ERC's at a determined ratio. All ERC's provided were also adjusted with an appropriate distance ratio as required by the district. The current petition to amend would require mitigation for PM10 and SOx. The CPP has identified that PM10 ERC's would be required by the District and that SOx ERC's would be required by CEQA to mitigate secondary particulate formation. The CPP has requested using the surplus emissions provided in 2003, as required by the District's distance ratio, to offset the increase in Sox emissions. Although staff does agree that the surplus would adequately mitigate the increase in SOx emissions under CEQA, staff does not agree that the surplus of ERC's provided in 2003 would adequately mitigate for the current proposed emission changes from the facility as required by CEQA and analyzed in this petition to amend.
Data Request 4. Can evidence be provided to show that the effect of these old ERCs have not
yet been included in the background PM10 concentrations that are being used in the current petition to amend to evaluate compliance with ambient air quality standards?
Response:
Included in the petition to amend were the estimated revised ambient sulfur dioxide (SO2), PM10, and PM2.5 impacts associated with the proposed changes at the CPP. This analysis is based on 2007 to 2009 background ambient air quality data representative of the CPP project area. The ERCs retired as PM10 mitigation during the original licensing of the CPP project represented emission reductions that occurred contemporaneous with or prior to issuance of the CEC license in 2003. Because these emission reductions occurred prior to the 2007 to 2009 background ambient air quality data used in the petition to amend, these emission reductions are reflected in the current background ambient air quality data.
However, when considering whether the amended CPP project will result in significant ambient air quality impacts, it is important to note that the ambient impacts shown in the petition to amend (see Table 1 of petition) are below the EPA-developed Significant Impact Levels (SILs) for SO2, PM10, and PM2.5. The primary purpose of the EPA SILs is to identify a level of ambient impact that is sufficiently low relative to ambient air quality standards such that the impact can be considered trivial or de minimis. Therefore, the EPA considers a
AIR QUALITY (1-4)
6 SAC/408620/111150004 (CPP_PTA_DATA_RESPONSES.DOCX)
source whose individual impact falls below a SIL to have a de minimis impact on background ambient air quality concentrations that already exist. Accordingly, if a project demonstrates that its ambient impact does not exceed a SIL for a pollutant, then the impact is not considered significant and is not considered to cause or contribute to a violation of the ambient air quality standard for that pollutant.
Furthermore, ERCs based on emission reductions that occurred years before emission increases from a new or modified stationary source are typically considered valid by the SMAQMD for purposes of complying with New Source Review (NSR) regulatory offset requirements and for CEQA mitigation purposes. Consequently, the SFA’s proposal to use excess PM10 ERCs provided during the original 2003 CPP licensing to mitigate proposed emission increases is not unusual compared with typical NSR and CEQA mitigation practices for projects.
TABLE DR4-1 Ambient Air Quality Impacts CPP Amendment
Pollutant Ambient Impact (μg/m3)a
SIL (μg/m3)
SO2 (1-hour) 0.74 7.8b
SO2 (24-hour) 0.28 5
SO2 (annual) 0.03 1
PM10 (24-hour) 0.223 5
PM10 (annual) 0.025 1
PM2.5 (24-hour) 0.086 1.2
PM2.5 (annual) 0.0096 0.3
aPetition to Amend, Table 3.1-6, December 2010. bEPA has not yet defined a significance level for 1-hour SO2 impacts. However, EPA has suggested that until the 1-hr SO2 SIL is promulgated, an interim value of 3 ppb (7.8 µg/m3) for SO2 be used
Notes: µg/m3 = microgram(s) per cubic meter ppb = part(s) per billion
Source: EPA guidance memo from OAQPS to Regional Air Division Directors, June 29, 2010.
Attachment DR3-1 Support of Equations for Converting
Liquid Droplet Size to Corresponding Solid Particle Size
VICTORVILLE 2 HYBRID POWER PROJECT (07-AFC-01) CEC STAFF DATA REQUEST NUMBERS 1-9
Technical Area: Air Quality Response Date: July 23, 2007
VV2 Project AQ-7 Air Quality
Data Request 5: Please provide evidence and analysis to support the AFC assumption that no more than 50 percent of the cooling tower TSP emissions are PM10.
Response:
The background discussion to this data request states that “In all past siting cases, staff has assumed that 100 percent of the TSP emissions from the cooling tower are PM10.” Actually, there have been several past siting cases where the analyses of cooling tower PM10 emissions have been based on less than 100 percent. Examples include the High Desert Power Project, which assumed 50 percent, and the Blythe Energy Project, which assumed 15 percent. Both of these projects are located in the Mojave Desert Air Quality Management District’s jurisdiction. The Elk Hills Power Project, in the San Joaquin Valley Air Pollution Control District’s jurisdiction, is also based on less than 100 percent. In a response to a CEC comment on the Palomar Energy Center, the San Diego Air Pollution Control District stated “There is evidence to indicate a 50% assumption for PM10 is reasonable: not the least of which is acceptance of such on prior projects. Therefore the District will report the facility PM10 in the FDOC assuming 50% of the cooling tower water TDS is converted into PM10 .”
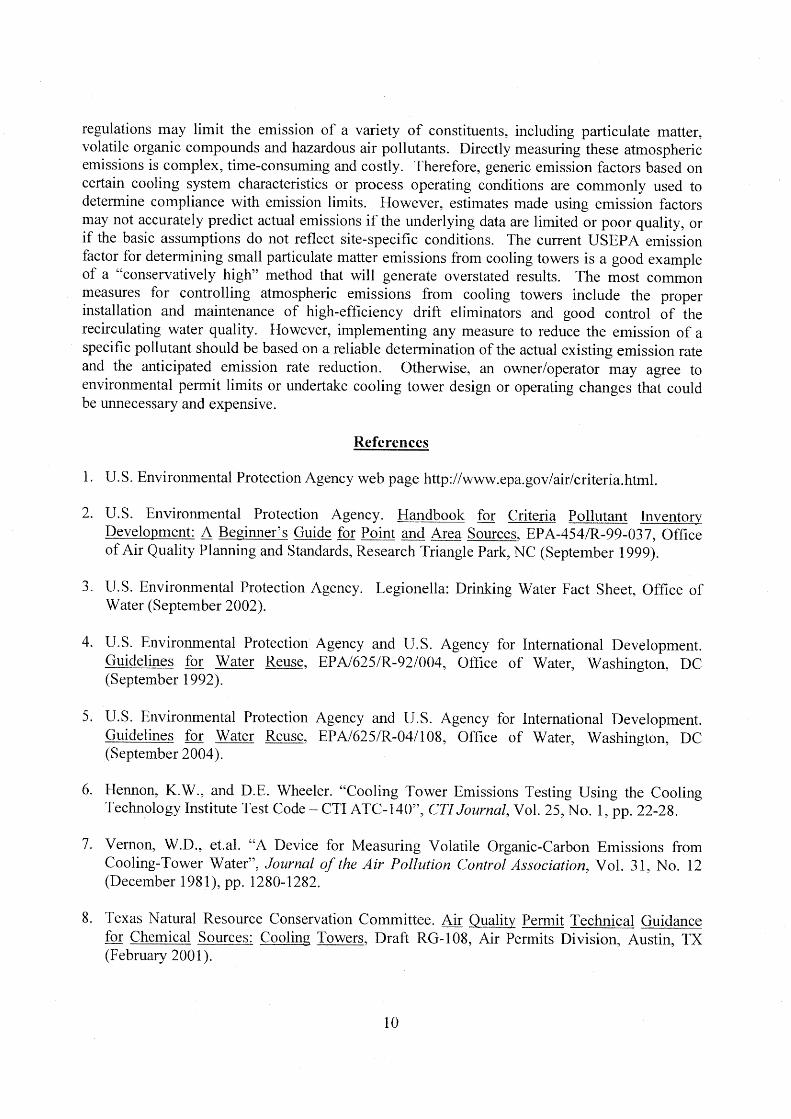
As described in AP-42, because wet cooling towers provide direct contact between the cooling water and air passing through the tower, some of the water may be entrained in the air stream and carried out of the tower as drift. AP-42 also states that large drift droplets settle out of the tower exhaust stream and deposit near the tower. Other drift droplets may evaporate before being deposited in the area surrounding the tower and can produce PM10 emissions. AP-42 states that a “conservatively high” PM10 emission rate can be developed by assuming that all the drift forms PM10.
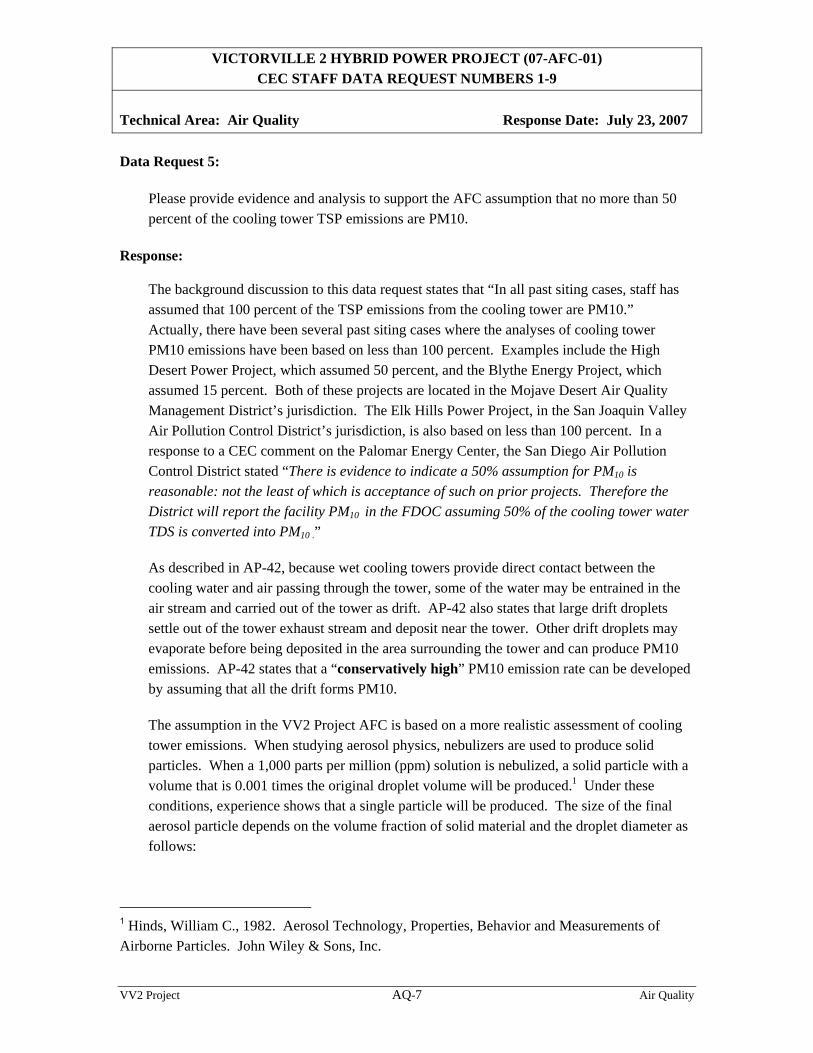
The assumption in the VV2 Project AFC is based on a more realistic assessment of cooling tower emissions. When studying aerosol physics, nebulizers are used to produce solid particles. When a 1,000 parts per million (ppm) solution is nebulized, a solid particle with a volume that is 0.001 times the original droplet volume will be produced.1 Under these conditions, experience shows that a single particle will be produced. The size of the final aerosol particle depends on the volume fraction of solid material and the droplet diameter as follows:
1 Hinds, William C., 1982. Aerosol Technology, Properties, Behavior and Measurements of Airborne Particles. John Wiley & Sons, Inc.
VICTORVILLE 2 HYBRID POWER PROJECT (07-AFC-01) CEC STAFF DATA REQUEST NUMBERS 1-9
Technical Area: Air Quality Response Date: July 23, 2007
VV2 Project AQ-8 Air Quality
Ds = Dd x (Fv)1/3
Where: Ds = diameter of solid particle
Dd = diameter of liquid droplet Fv = volume fraction of solid material
This equation can be converted to calculate the resulting particle diameter for a cooling tower by accounting for the density of the particle. This equation is presented below:
Ds = Dd x (ρd/ρs x TDS /1,000,000)1/3
Where: Ds = diameter of solid particle
Dd = diameter of liquid droplet ρd = density of droplet = 1 g/cm3 ρs = density of solid particle = 2.2 g/cm3 for sodium chloride TDS = total dissolved solids, ppm
The above equation predicts the physical diameter of a particle formed from a cooling tower droplet. This equation assumes that a single particle will be formed when a droplet evaporates, because there is no evidence that multiple particles will be formed. In order to calculate PM10 emission, the aerodynamic diameter must be calculated as follows:2 Da = Ds x (ρs)
0.5
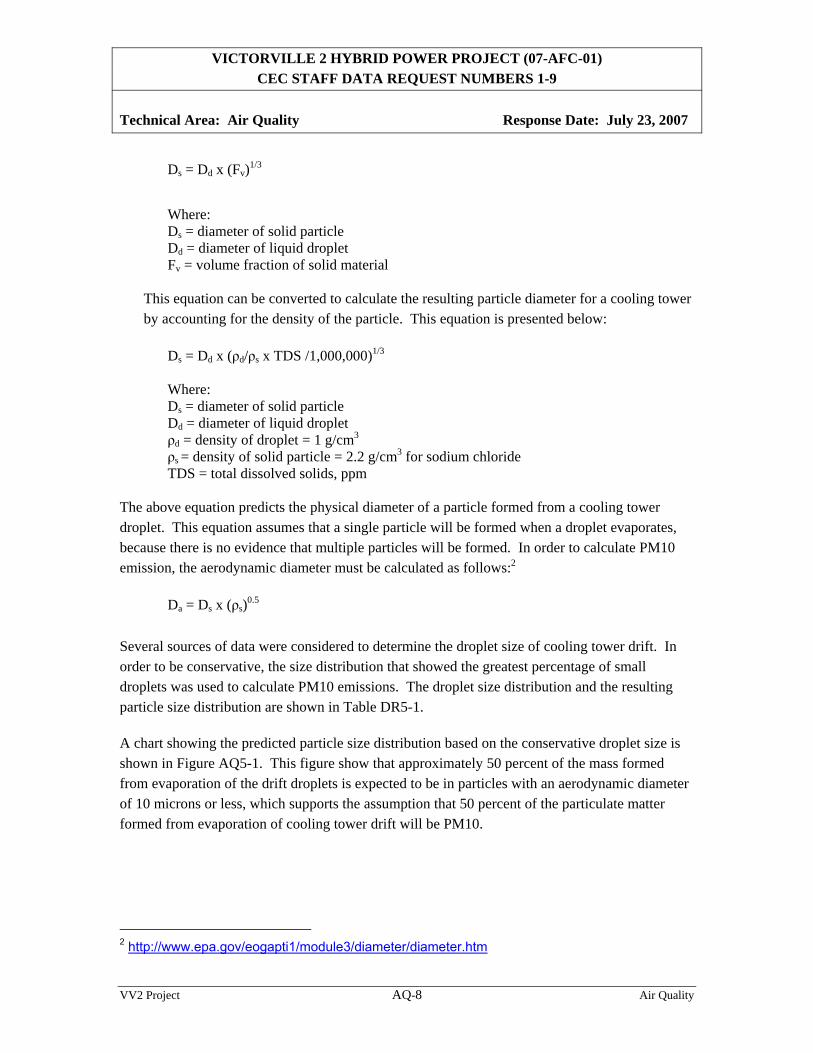
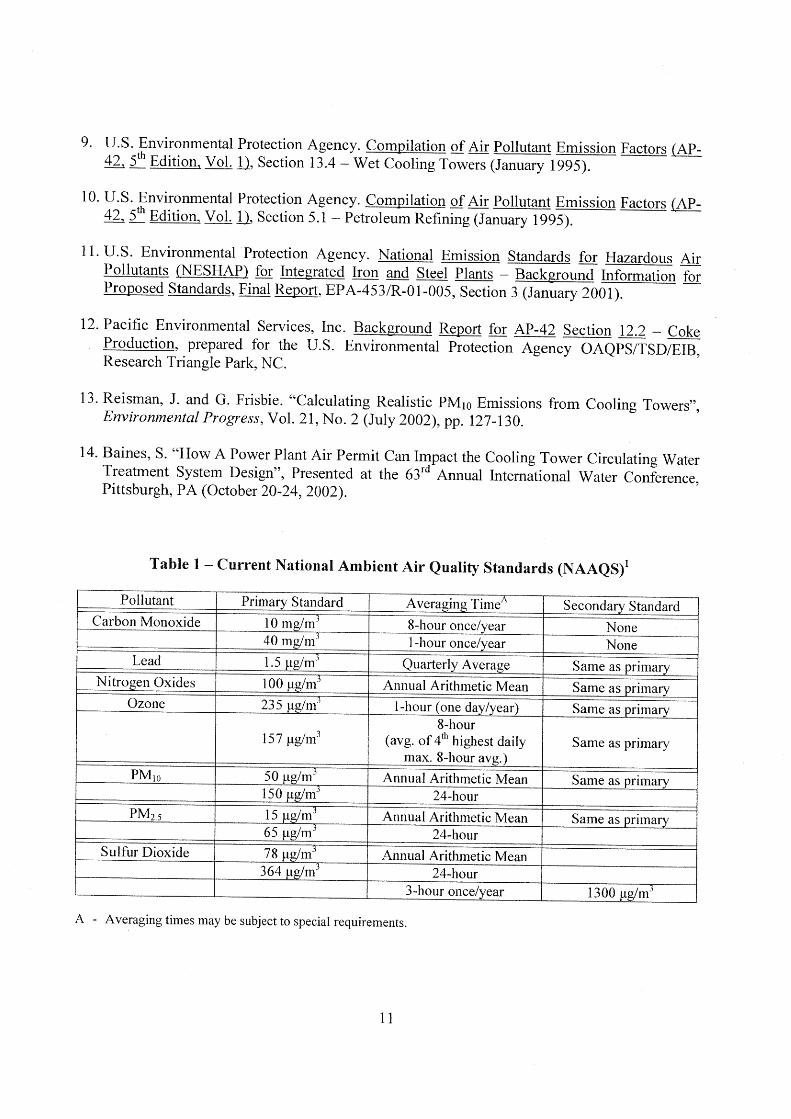
Several sources of data were considered to determine the droplet size of cooling tower drift. In order to be conservative, the size distribution that showed the greatest percentage of small droplets was used to calculate PM10 emissions. The droplet size distribution and the resulting particle size distribution are shown in Table DR5-1.
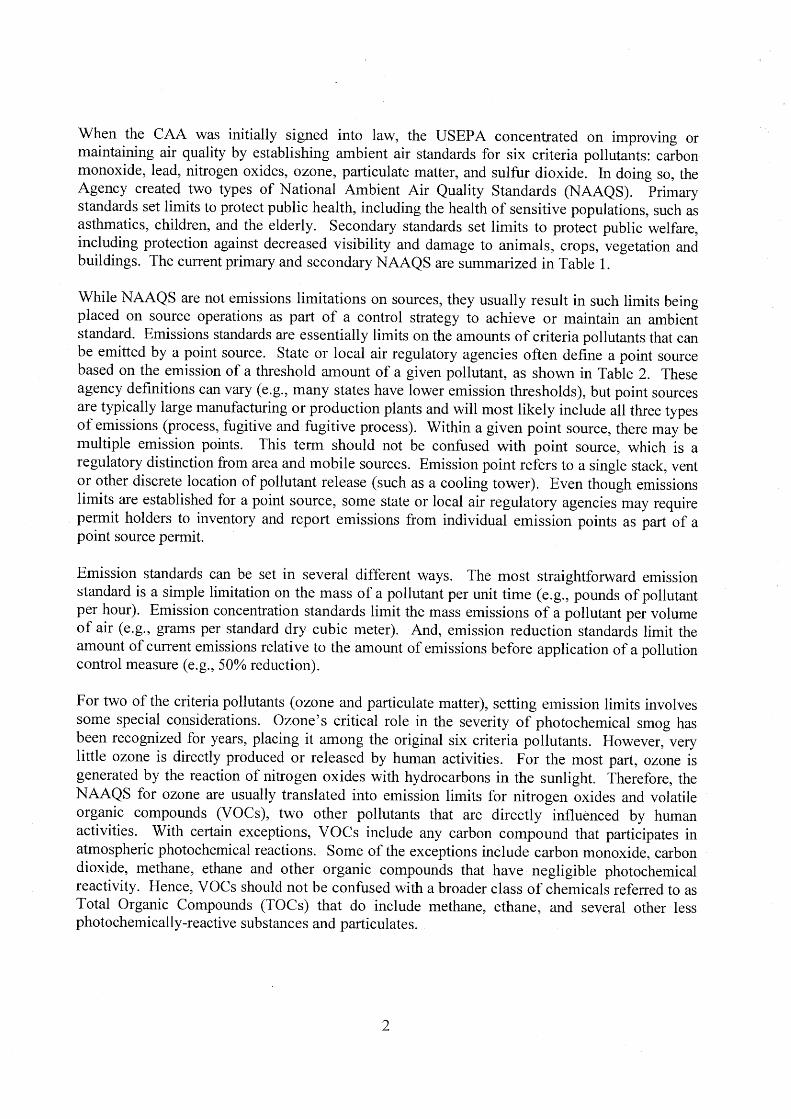
A chart showing the predicted particle size distribution based on the conservative droplet size is shown in Figure AQ5-1. This figure show that approximately 50 percent of the mass formed from evaporation of the drift droplets is expected to be in particles with an aerodynamic diameter of 10 microns or less, which supports the assumption that 50 percent of the particulate matter formed from evaporation of cooling tower drift will be PM10.
2 http://www.epa.gov/eogapti1/module3/diameter/diameter.htm
VICTORVILLE 2 HYBRID POWER PROJECT (07-AFC-01) CEC STAFF DATA REQUEST NUMBERS 1-9
Technical Area: Air Quality Response Date: July 23, 2007
VV2 Project AQ-9 Air Quality
Table DR5-1 Droplet Size Distribution and Calculated Solid Particle Size Distribution
Dry Particle Diameter(b) Droplet Size(a)
microns
Percent Mass Less Than Droplet
Size(a) Physical microns
Aerodynamic microns
15 20.0 2.0 2.9 35 40.0 4.6 6.8 65 60.0 8.5 12.7
115 80.0 15.1 22.4 170 90.0 22.4 33.2 230 95.0 30.2 44.9 275 98.0 36.2 53.6 525 99.5 69.0 102.4 700 100.0 92.0 136.5
(a) web.ead.anl.gov/bajatermoeis/documents/docs/BPPWG_AttachC_2003wet-dry_cooling_paper.pdf (b) TDS = 5,000 ppm, particle density = 2.2 g/cm3
Figure AQ5-1 Calculated Soild Particle SIze Distribution
0
10
20
30
40
50
60
70
80
90
100
0 10 20 30 40 50 60 70 80 90 100
Aerodynamic Diameter, microns
% o
f Mas
s <I
ndic
ated
Dia
met
er
1
Calculating Realistic PM10 Emissions from Cooling Towers
Abstract No. 216 Session No. AM-1b Joel Reisman and Gordon Frisbie Greystone Environmental Consultants, Inc., 650 University Avenue, Suite 100, Sacramento, California 95825 ABSTRACT Particulate matter less than 10 micrometers in diameter (PM10) emissions from wet cooling towers may be calculated using the methodology presented in EPA’s AP-421 , which assumes that all total dissolved solids (TDS) emitted in “drift” particles (liquid water entrained in the air stream and carried out of the tower through the induced draft fan stack.) are PM10. However, for wet cooling towers with medium to high TDS levels, this method is overly conservative, and predicts significantly higher PM10 emissions than would actually occur, even for towers equipped with very high efficiency drift eliminators (e.g., 0.0006% drift rate). Such over-prediction may result in unrealistically high PM10 modeled concentrations and/or the need to purchase expensive Emission Reduction Credits (ERCs) in PM10 non-attainment areas. Since these towers have fairly low emission points (10 to 15 m above ground), over-predicting PM10 emission rates can easily result in exceeding federal Prevention of Significant Deterioration (PSD) significance levels at a project’s fenceline. This paper presents a method for computing realistic PM10 emissions from cooling towers with medium to high TDS levels. INTRODUCTION Cooling towers are heat exchangers that are used to dissipate large heat loads to the atmosphere. Wet, or evaporative, cooling towers rely on the latent heat of water evaporation to exchange heat between the process and the air passing through the cooling tower. The cooling water may be an integral part of the process or may provide cooling via heat exchangers, for example, steam condensers. Wet cooling towers provide direct contact between the cooling water and air passing through the tower, and as part of normal operation, a very small amount of the circulating water may be entrained in the air stream and be carried out of the tower as “drift” droplets. Because the drift droplets contain the same chemical impurities as the water circulating through the tower, the particulate matter constituent of the drift droplets may be classified as an emission. The magnitude of the drift loss is influenced by the number and size of droplets produced within the tower, which are determined by the tower fill design, tower design, the air and water patterns, and design of the drift eliminators. AP-42 METHOD OF CALCULATING DRIFT PARTICULATE EPA’s AP-421 provides available particulate emission factors for wet cooling towers, however, these values only have an emission factor rating of “E” (the lowest level of confidence acceptable). They are also rather high, compared to typical present-day manufacturers’ guaranteed drift rates, which are on the order of 0.0006%. (Drift emissions are typically
2
expressed as a percentage of the cooling tower water circulation rate). AP-42 states that “a conservatively high PM10 emission factor can be obtained by (a) multiplying the total liquid drift factor by the TDS fraction in the circulating water, and (b) assuming that once the water evaporates, all remaining solid particles are within the PM10 range.” (Italics per EPA). If TDS data for the cooling tower are not available, a source-specific TDS content can be estimated by obtaining the TDS for the make-up water and multiplying it by the cooling tower cycles of concentration. [The cycles of concentration is the ratio of a measured parameter for the cooling tower water (such as conductivity, calcium, chlorides, or phosphate) to that parameter for the make-up water.] Using AP-42 guidance, the total particulate emissions (PM) (after the pure water has evaporated) can be expressed as:
PM = Water Circulation Rate x Drift Rate x TDS [1] For example, for a typical power plant wet cooling tower with a water circulation rate of 146,000 gallons per minute (gpm), drift rate of 0.0006%, and TDS of 7,700 parts per million by weight (ppmw):
PM = 146,000 gpm x 8.34 lb water/gal x 0.0006/100 x 7,700 lb solids/106 lb water x 60 min/hr = 3.38 lb/hr
On an annual basis, this is equivalent to almost 15 tons per year (tpy). Even for a state-of-the-art drift eliminator system, this is not a small number, especially if assumed to all be equal to PM10, a regulated criteria pollutant. However, as the following analysis demonstrates, only a very small fraction is actually PM10. COMPUTING THE PM10 FRACTION Based on a representative drift droplet size distribution and TDS in the water, the amount of solid mass in each drop size can be calculated. That is, for a given initial droplet size, assuming that the mass of dissolved solids condenses to a spherical particle after all the water evaporates, and assuming the density of the TDS is equivalent to a representative salt (e.g., sodium chloride), the diameter of the final solid particle can be calculated. Thus, using the drift droplet size distribution, the percentage of drift mass containing particles small enough to produce PM10 can be calculated. This method is conservative as the final particle is assumed to be perfectly spherical; hence as small a particle as can exist. The droplet size distribution of the drift emitted from the tower is critical to performing the analysis. Brentwood Industries, a drift eliminator manufacturer, was contacted and agreed to provide drift eliminator test data from a test conducted by Environmental Systems Corporation (ESC) at the Electric Power Research Institute (EPRI) test facility in Houston, Texas in 1988 (Aull2, 1999). The data consist of water droplet size distributions for a drift eliminator that achieved a tested drift rate of 0.0003 percent. As we are using a 0.0006 percent drift rate, it is reasonable to expect that the 0.0003 percent drift rate would produce smaller droplets, therefore,
3
this size distribution data can be assumed to be conservative for predicting the fraction of PM10 in the total cooling tower PM emissions. In calculating PM10 emissions the following assumptions were made: �� Each water droplet was assumed to evaporate shortly after being emitted into ambient air,
into a single, solid, spherical particle.
�� Drift water droplets have a density ( ) .m/ 10 * 1.0or g/cm 1.0 water;of 3-63w µµρ g
�� The solid particles were assumed to have the same density ( )TDSρ as sodium chloride, (i.e., 2.2 g/cm3).
Using the formula for the volume of a sphere, 3/4 V 3rπ= , and the density of pure water, 3g/cm 1.0 =wρ , the following equations can be used to derive the solid particulate diameter, Dp,
as a function of the TDS, the density of the solids, and the initial drift droplet diameter, Dd :
Volume of drift droplet = 3d /2)(D(4/3)π [2]
Mass of solids in drift droplet = (TDS)( wρ )(Volume of drift droplet) [3]
substituting,
Mass of solids in drift = /2)(D(4/3) )(TDS)( 3dπρw [4]
Assuming the solids remain and coalesce after the water evaporates, the mass of solids can also be expressed as:
Mass of solids = ( )TDSρ (solid particle volume) = 3pTDS /2)(D)(4/3) ( πρ [5]
Equations [4] and [5] are equivalent: 3
d3
pTDS /2)(D)(4/3)TDS)((/2)(D)(4/3)( πρπρ w= [6]
Solving for Dp:
Dp = Dd 31)]/[(TDS)( TDSw ρρ [7]
Where,
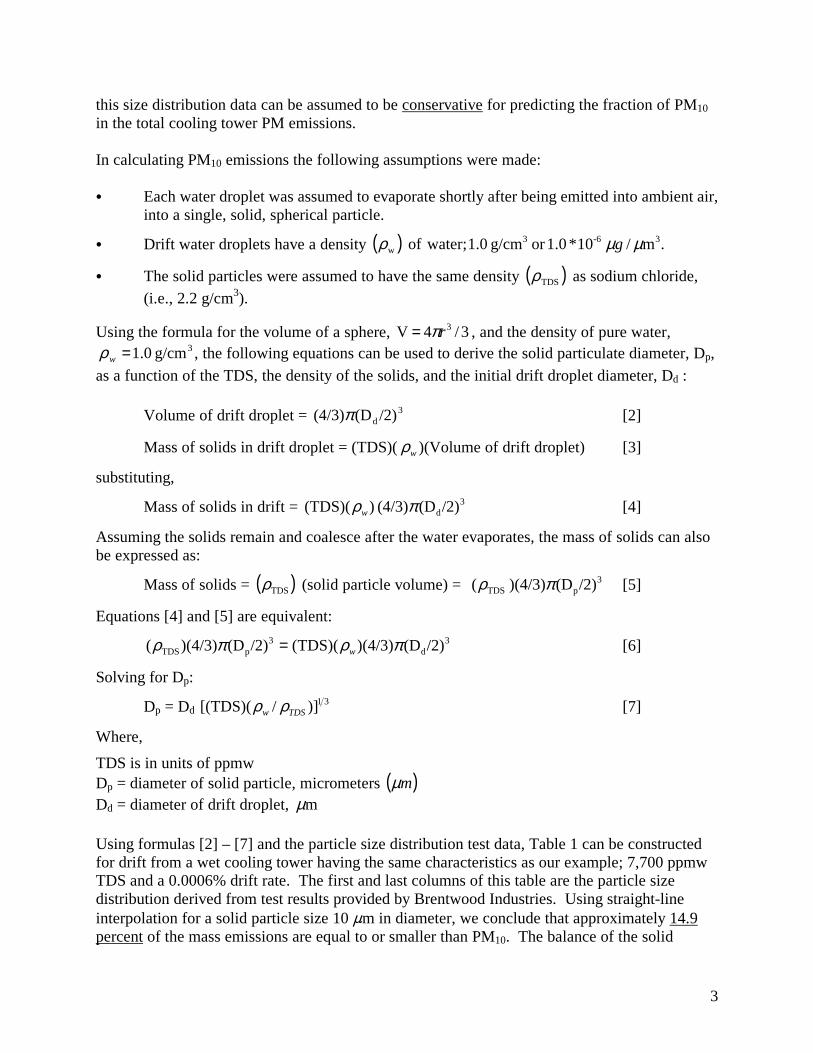
TDS is in units of ppmw Dp = diameter of solid particle, micrometers ( )mµ Dd = diameter of drift droplet, mµ Using formulas [2] – [7] and the particle size distribution test data, Table 1 can be constructed for drift from a wet cooling tower having the same characteristics as our example; 7,700 ppmw TDS and a 0.0006% drift rate. The first and last columns of this table are the particle size distribution derived from test results provided by Brentwood Industries. Using straight-line interpolation for a solid particle size 10 �m in diameter, we conclude that approximately 14.9 percent of the mass emissions are equal to or smaller than PM10. The balance of the solid
4
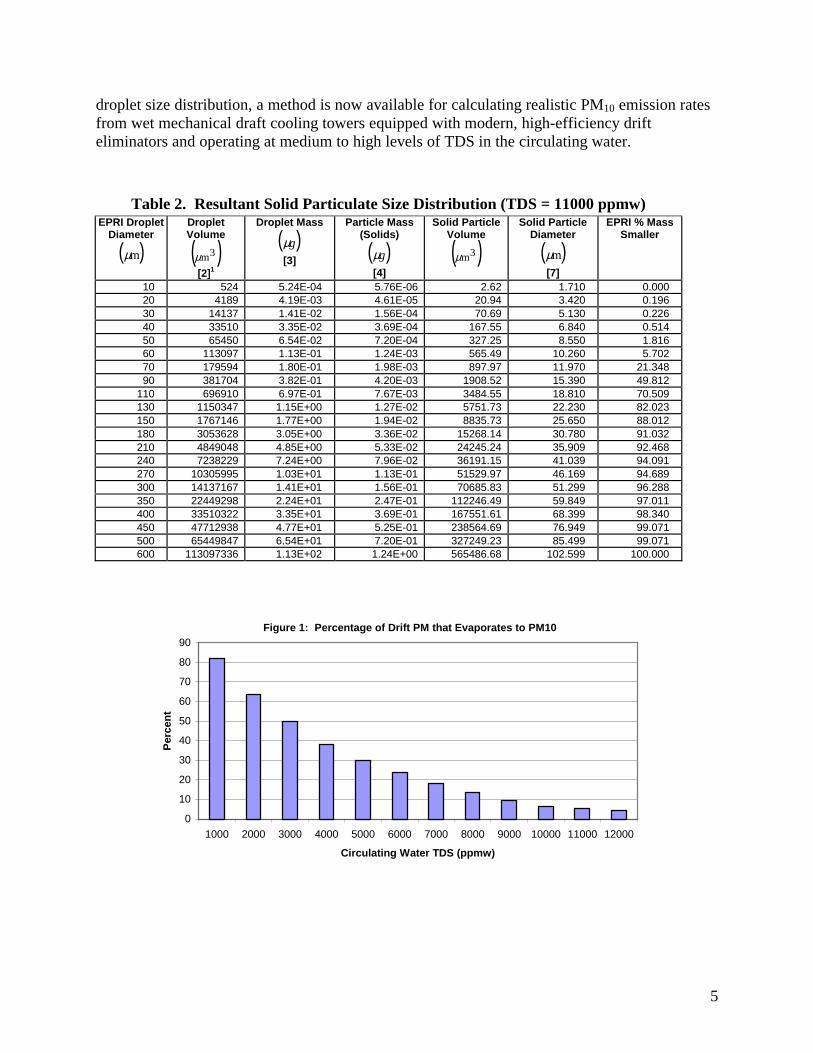
particulate are particulate greater than 10 mµ . Hence, PM10 emissions from this tower would be equal to PM emissions x 0.149, or 3.38 lb/hr x 0.149 = 0.50 lb/hr. The process is repeated in Table 2, with all parameters equal except that the TDS is 11,000 ppmw. The result is that approximately 5.11 percent are smaller at 11,000 ppm. Thus, while total PM emissions are larger by virtue of a higher TDS, overall PM10 emissions are actually lower, because more of the solid particles are larger than 10 mµ .
Table 1. Resultant Solid Particulate Size Distribution (TDS = 7700 ppmw) EPRI Droplet
Diameter
( )mµ
Droplet Volume
( )3mµ [2]1
Droplet Mass
( )gµ [3]
Particle Mass (Solids)
( )gµ [4]
Solid Particle Volume
( )3mµ
Solid Particle Diameter
( )mµ [7]
EPRI % Mass Smaller
10 524 5.24E-04 4.03E-06 1.83 1.518 0.000 20 4189 4.19E-03 3.23E-05 14.66 3.037 0.196 30 14137 1.41E-02 1.09E-04 49.48 4.555 0.226 40 33510 3.35E-02 2.58E-04 117.29 6.073 0.514 50 65450 6.54E-02 5.04E-04 229.07 7.591 1.816 60 113097 1.13E-01 8.71E-04 395.84 9.110 5.702 70 179594 1.80E-01 1.38E-03 628.58 10.628 21.348 90 381704 3.82E-01 2.94E-03 1335.96 13.665 49.812
110 696910 6.97E-01 5.37E-03 2439.18 16.701 70.509 130 1150347 1.15E+00 8.86E-03 4026.21 19.738 82.023 150 1767146 1.77E+00 1.36E-02 6185.01 22.774 88.012 180 3053628 3.05E+00 2.35E-02 10687.70 27.329 91.032 210 4849048 4.85E+00 3.73E-02 16971.67 31.884 92.468 240 7238229 7.24E+00 5.57E-02 25333.80 36.439 94.091 270 10305995 1.03E+01 7.94E-02 36070.98 40.994 94.689 300 14137167 1.41E+01 1.09E-01 49480.08 45.549 96.288 350 22449298 2.24E+01 1.73E-01 78572.54 53.140 97.011 400 33510322 3.35E+01 2.58E-01 117286.13 60.732 98.340 450 47712938 4.77E+01 3.67E-01 166995.28 68.323 99.071 500 65449847 6.54E+01 5.04E-01 229074.46 75.915 99.071 600 113097336 1.13E+02 8.71E-01 395840.67 91.098 100.000
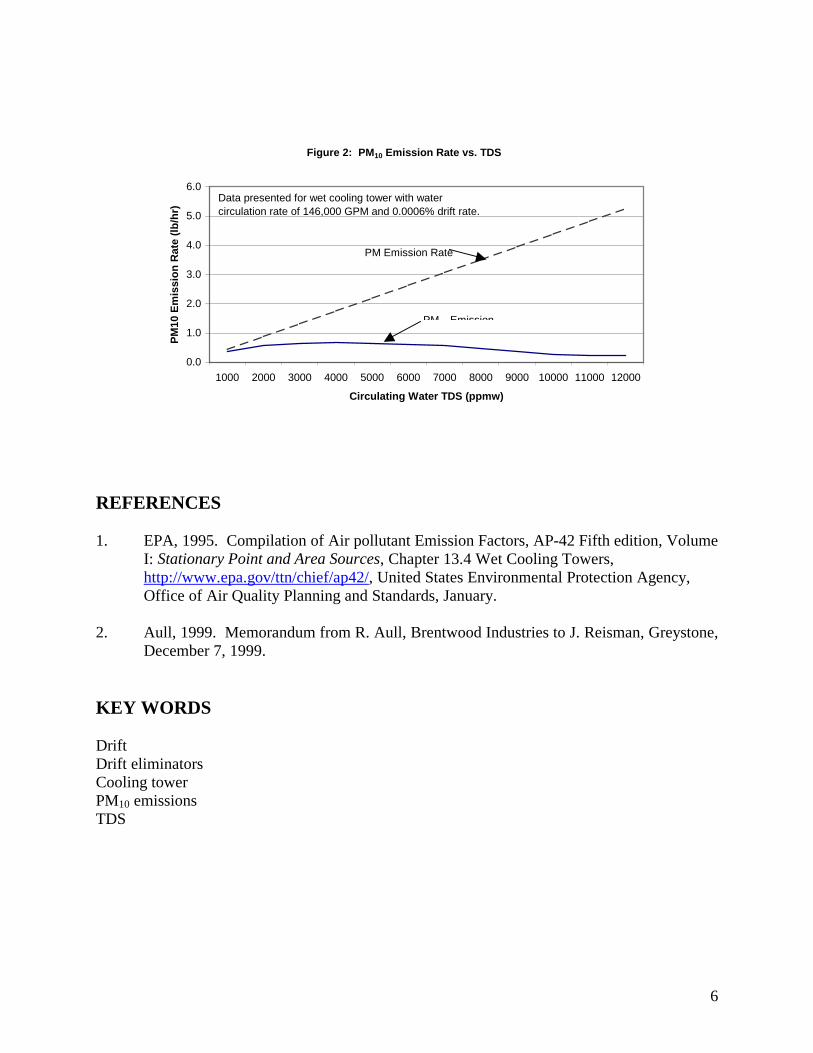
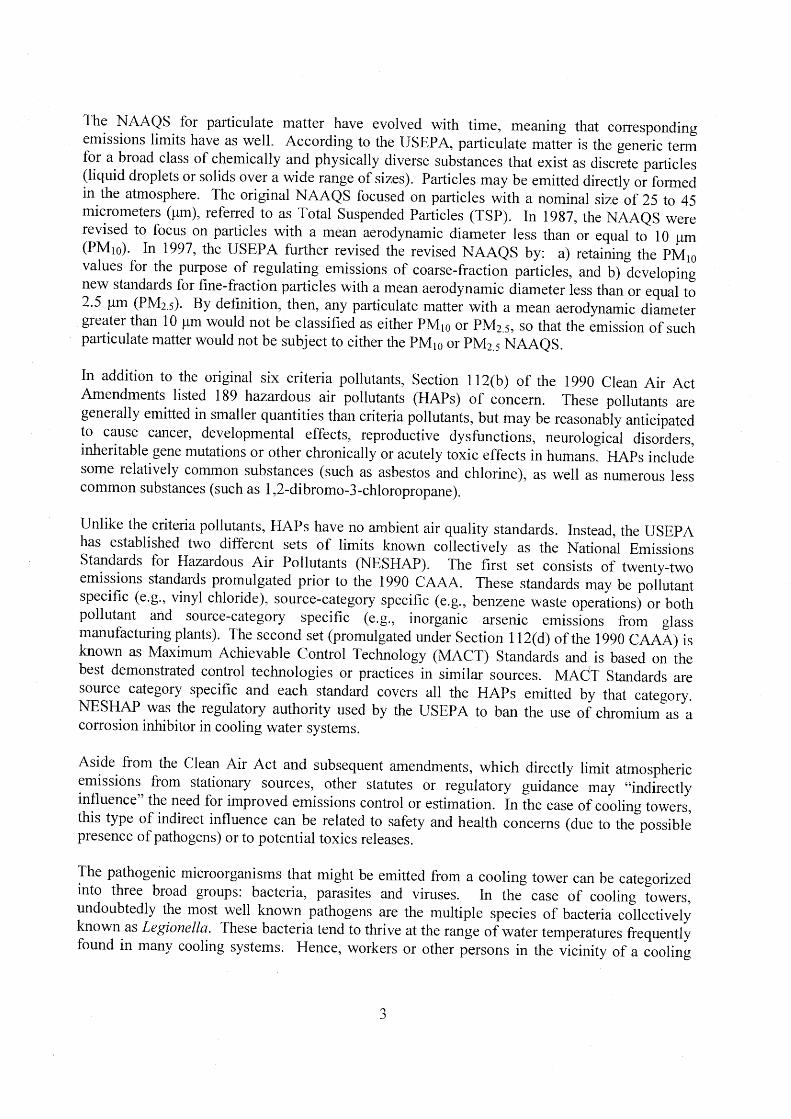
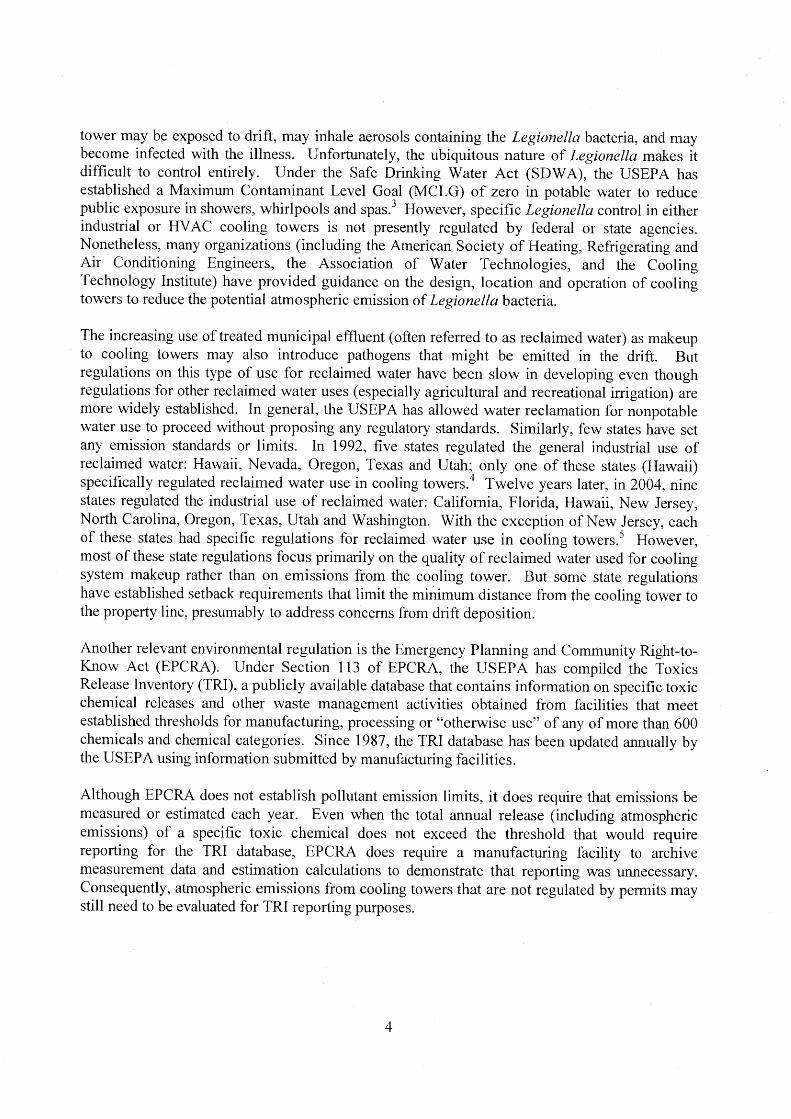
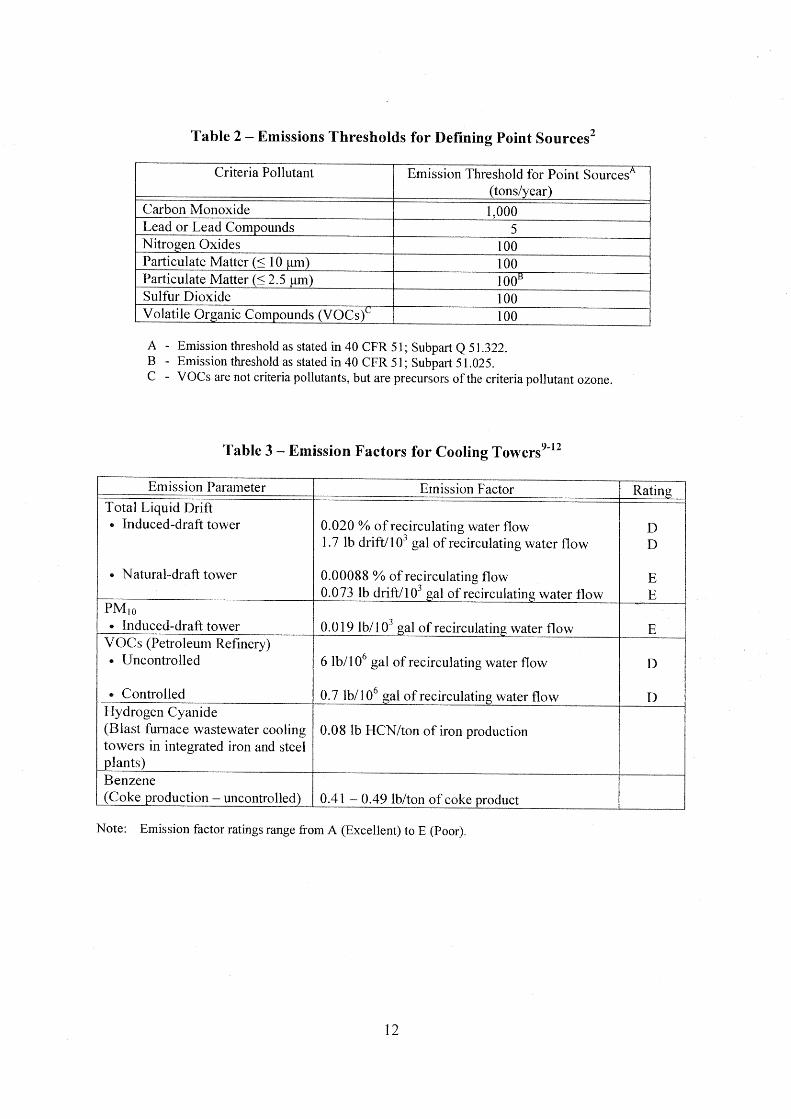
1 Bracketed numbers refer to equation number in text. The percentage of PM10/PM was calculated for cooling tower TDS values from 1000 to 12000 ppmw and the results are plotted in Figure 1. Using these data, Figure 2 presents predicted PM10 emission rates for the 146,000 gpm example tower. As shown in this figure, the PM emission rate increases in a straight line as TDS increases, however, the PM10 emission rate increases to a maximum at around a TDS of 4000 ppmw, and then begins to decline. The reason is that at higher TDS, the drift droplets contain more solids and therefore, upon evaporation, result in larger solid particles for any given initial droplet size. CONCLUSION The emission factors and methodology given in EPA’s AP-421 Chapter 13.4 Wet Cooling Towers, do not account for the droplet size distribution of the drift exiting the tower. This is a critical factor, as more than 85% of the mass of particulate in the drift from most cooling towers will result in solid particles larger than PM10 once the water has evaporated. Particles larger than PM10 are no longer a regulated air pollutant, because their impact on human health has been shown to be insignificant. Using reasonable, conservative assumptions and a realistic drift
5
droplet size distribution, a method is now available for calculating realistic PM10 emission rates from wet mechanical draft cooling towers equipped with modern, high-efficiency drift eliminators and operating at medium to high levels of TDS in the circulating water.
Figure 1: Percentage of Drift PM that Evaporates to PM10
0
10
20
30
40
50
60
70
80
90
1000 2000 3000 4000 5000 6000 7000 8000 9000 10000 11000 12000
Circulating Water TDS (ppmw)
Perc
ent
Table 2. Resultant Solid Particulate Size Distribution (TDS = 11000 ppmw) EPRI Droplet
Diameter
( )mµ
Droplet Volume
( )3mµ [2]1
Droplet Mass
( )gµ [3]
Particle Mass (Solids)
( )gµ [4]
Solid Particle Volume
( )3mµ
Solid Particle Diameter
( )mµ [7]
EPRI % Mass Smaller
10 524 5.24E-04 5.76E-06 2.62 1.710 0.000 20 4189 4.19E-03 4.61E-05 20.94 3.420 0.196 30 14137 1.41E-02 1.56E-04 70.69 5.130 0.226 40 33510 3.35E-02 3.69E-04 167.55 6.840 0.514 50 65450 6.54E-02 7.20E-04 327.25 8.550 1.816 60 113097 1.13E-01 1.24E-03 565.49 10.260 5.702 70 179594 1.80E-01 1.98E-03 897.97 11.970 21.348 90 381704 3.82E-01 4.20E-03 1908.52 15.390 49.812
110 696910 6.97E-01 7.67E-03 3484.55 18.810 70.509 130 1150347 1.15E+00 1.27E-02 5751.73 22.230 82.023 150 1767146 1.77E+00 1.94E-02 8835.73 25.650 88.012 180 3053628 3.05E+00 3.36E-02 15268.14 30.780 91.032 210 4849048 4.85E+00 5.33E-02 24245.24 35.909 92.468 240 7238229 7.24E+00 7.96E-02 36191.15 41.039 94.091 270 10305995 1.03E+01 1.13E-01 51529.97 46.169 94.689 300 14137167 1.41E+01 1.56E-01 70685.83 51.299 96.288 350 22449298 2.24E+01 2.47E-01 112246.49 59.849 97.011 400 33510322 3.35E+01 3.69E-01 167551.61 68.399 98.340 450 47712938 4.77E+01 5.25E-01 238564.69 76.949 99.071 500 65449847 6.54E+01 7.20E-01 327249.23 85.499 99.071 600 113097336 1.13E+02 1.24E+00 565486.68 102.599 100.000
6
Figure 2: PM10 Emission Rate vs. TDS
0.0
1.0
2.0
3.0
4.0
5.0
6.0
1000 2000 3000 4000 5000 6000 7000 8000 9000 10000 11000 12000
Circulating Water TDS (ppmw)
PM10
Em
issi
on R
ate
(lb/h
r)
Data presented for wet cooling tower with water circulation rate of 146,000 GPM and 0.0006% drift rate.
PM Emission Rate
PM Emission
REFERENCES 1. EPA, 1995. Compilation of Air pollutant Emission Factors, AP-42 Fifth edition, Volume
I: Stationary Point and Area Sources, Chapter 13.4 Wet Cooling Towers, http://www.epa.gov/ttn/chief/ap42/, United States Environmental Protection Agency, Office of Air Quality Planning and Standards, January.
2. Aull, 1999. Memorandum from R. Aull, Brentwood Industries to J. Reisman, Greystone,
December 7, 1999. KEY WORDS Drift Drift eliminators Cooling tower PM10 emissions TDS
SAC/408620/111150004 (CPP_PTA_DATA_RESPONSES.DOCX) DR3-1-1
Soils and Water Resources (5-9)
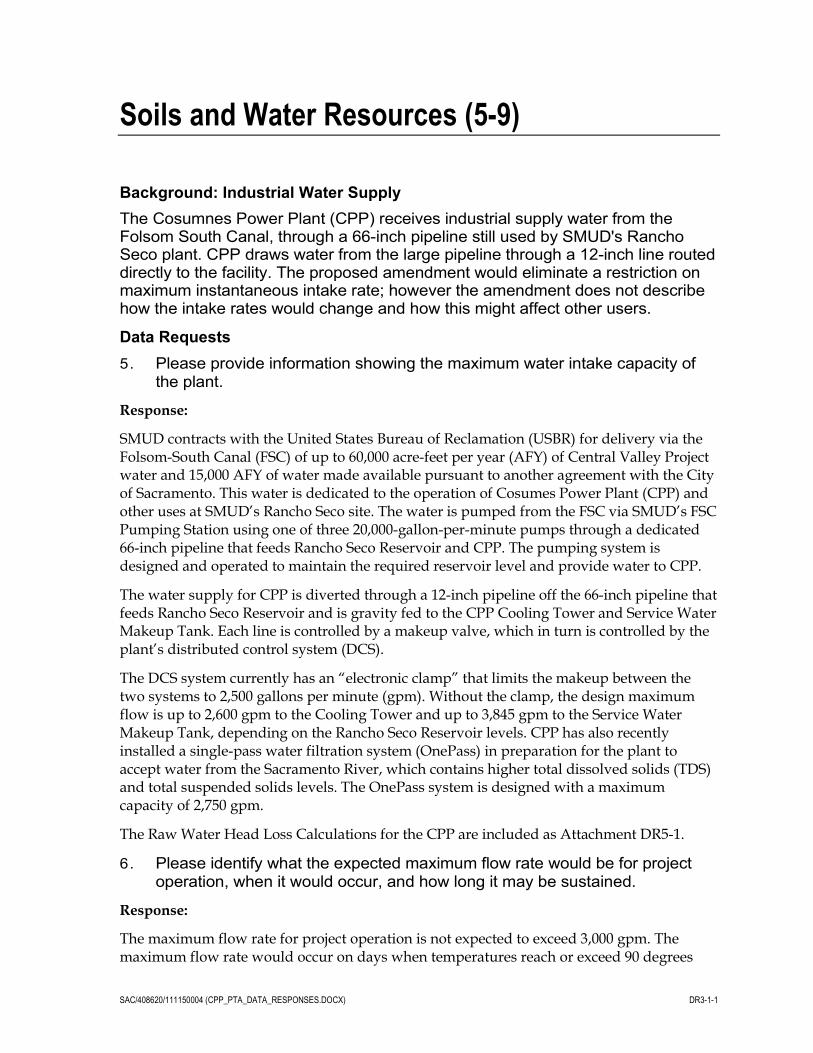
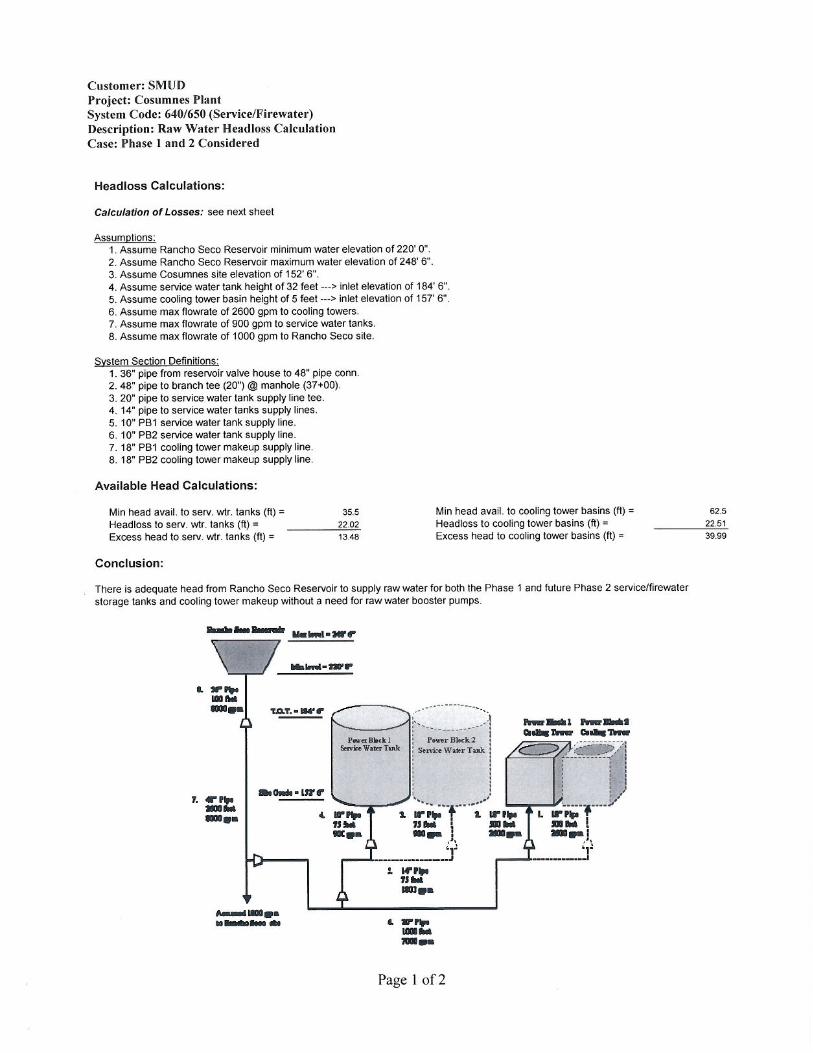
Background: Industrial Water Supply The Cosumnes Power Plant (CPP) receives industrial supply water from the Folsom South Canal, through a 66-inch pipeline still used by SMUD's Rancho Seco plant. CPP draws water from the large pipeline through a 12-inch line routed directly to the facility. The proposed amendment would eliminate a restriction on maximum instantaneous intake rate; however the amendment does not describe how the intake rates would change and how this might affect other users.
Data Requests 5. Please provide information showing the maximum water intake capacity of
the plant.
Response:
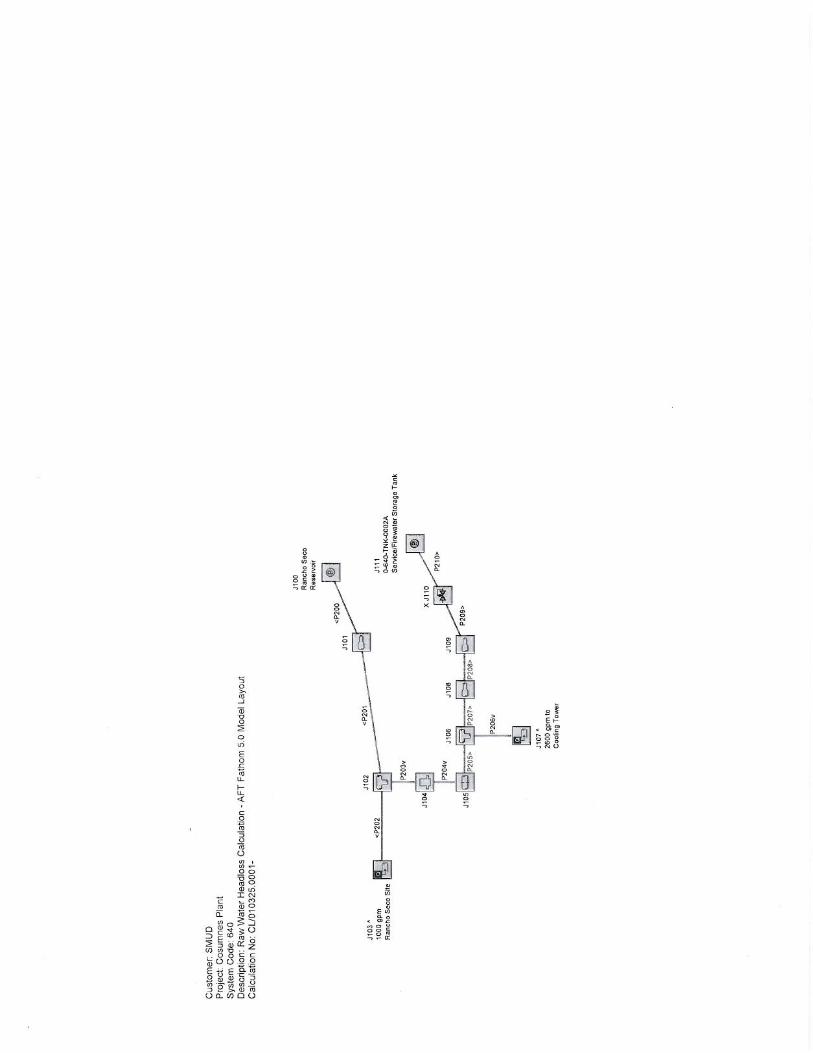
SMUD contracts with the United States Bureau of Reclamation (USBR) for delivery via the Folsom-South Canal (FSC) of up to 60,000 acre-feet per year (AFY) of Central Valley Project water and 15,000 AFY of water made available pursuant to another agreement with the City of Sacramento. This water is dedicated to the operation of Cosumes Power Plant (CPP) and other uses at SMUD’s Rancho Seco site. The water is pumped from the FSC via SMUD’s FSC Pumping Station using one of three 20,000-gallon-per-minute pumps through a dedicated 66-inch pipeline that feeds Rancho Seco Reservoir and CPP. The pumping system is designed and operated to maintain the required reservoir level and provide water to CPP.
The water supply for CPP is diverted through a 12-inch pipeline off the 66-inch pipeline that feeds Rancho Seco Reservoir and is gravity fed to the CPP Cooling Tower and Service Water Makeup Tank. Each line is controlled by a makeup valve, which in turn is controlled by the plant’s distributed control system (DCS).
The DCS system currently has an “electronic clamp” that limits the makeup between the two systems to 2,500 gallons per minute (gpm). Without the clamp, the design maximum flow is up to 2,600 gpm to the Cooling Tower and up to 3,845 gpm to the Service Water Makeup Tank, depending on the Rancho Seco Reservoir levels. CPP has also recently installed a single-pass water filtration system (OnePass) in preparation for the plant to accept water from the Sacramento River, which contains higher total dissolved solids (TDS) and total suspended solids levels. The OnePass system is designed with a maximum capacity of 2,750 gpm.
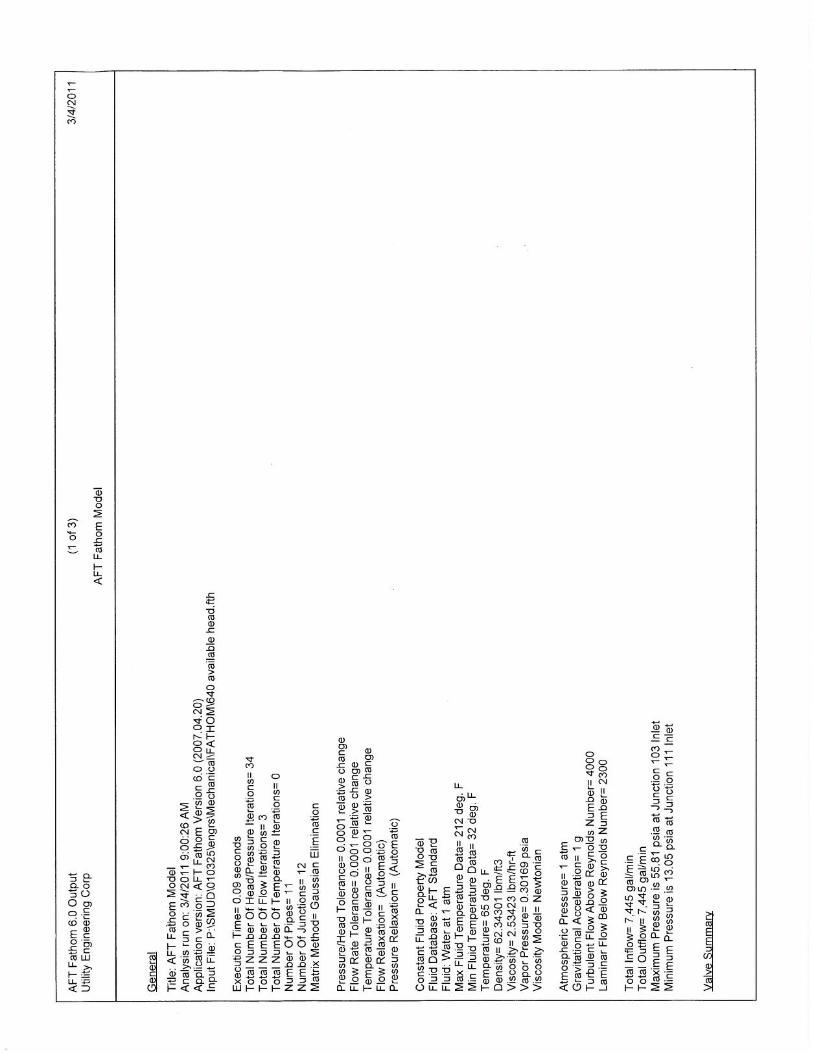
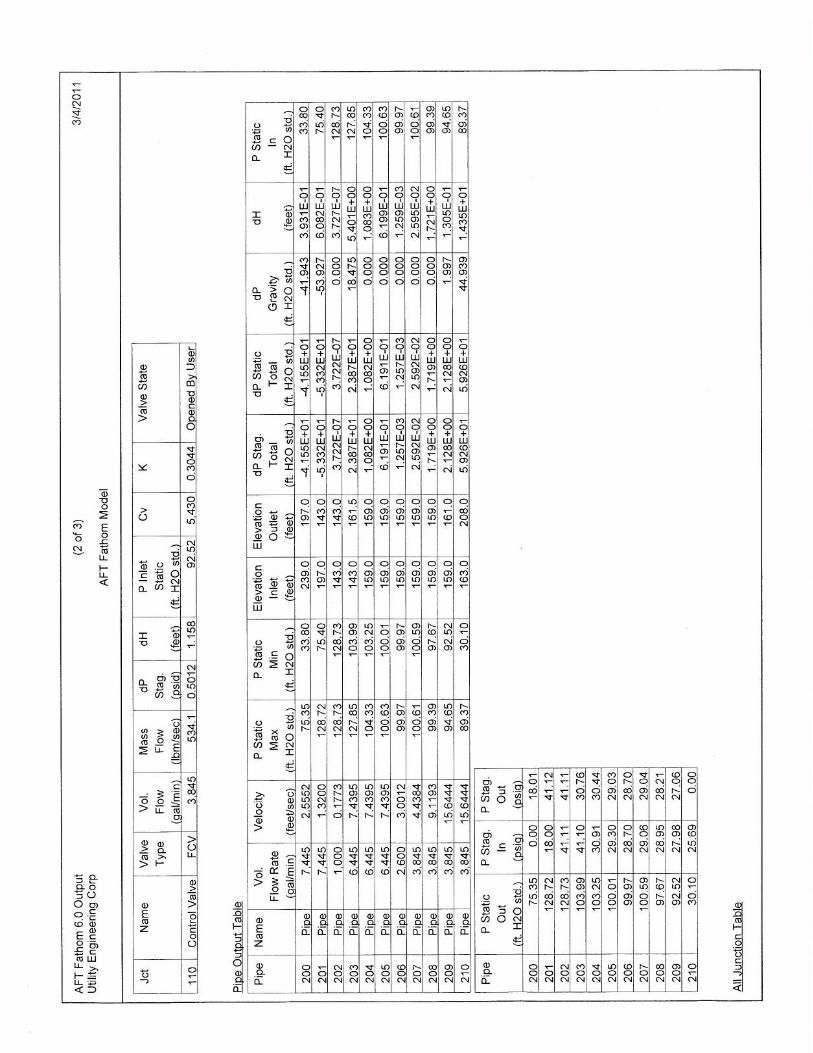
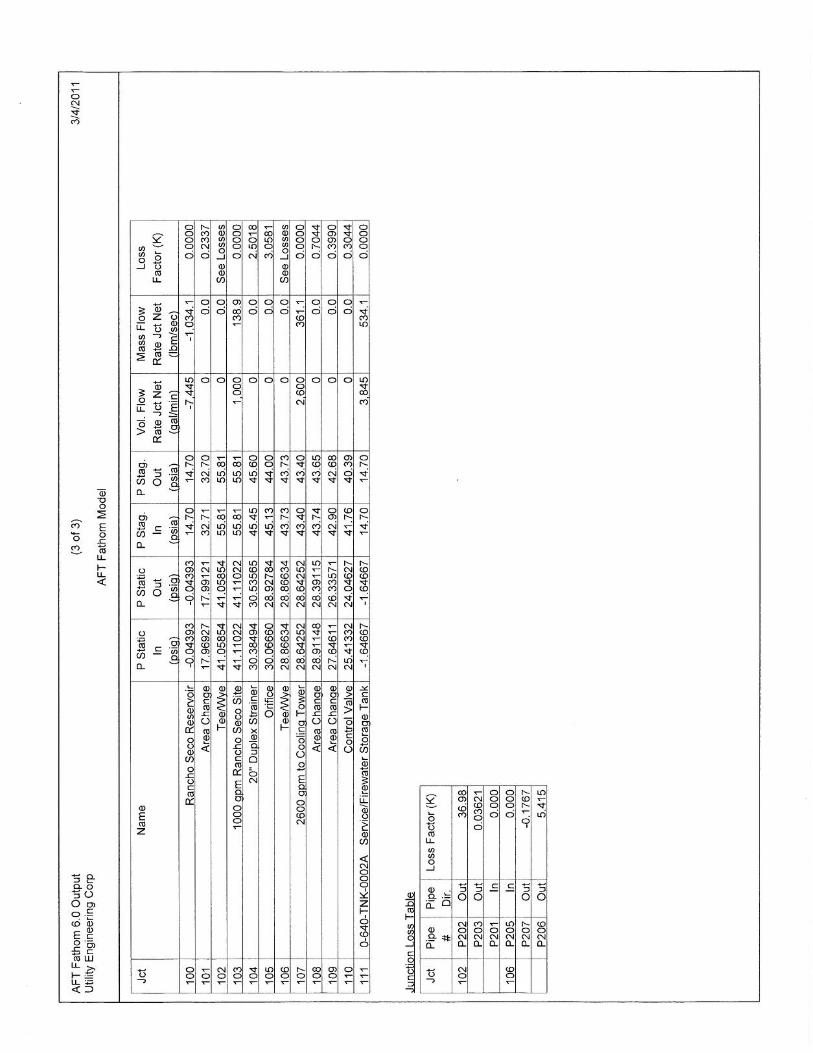
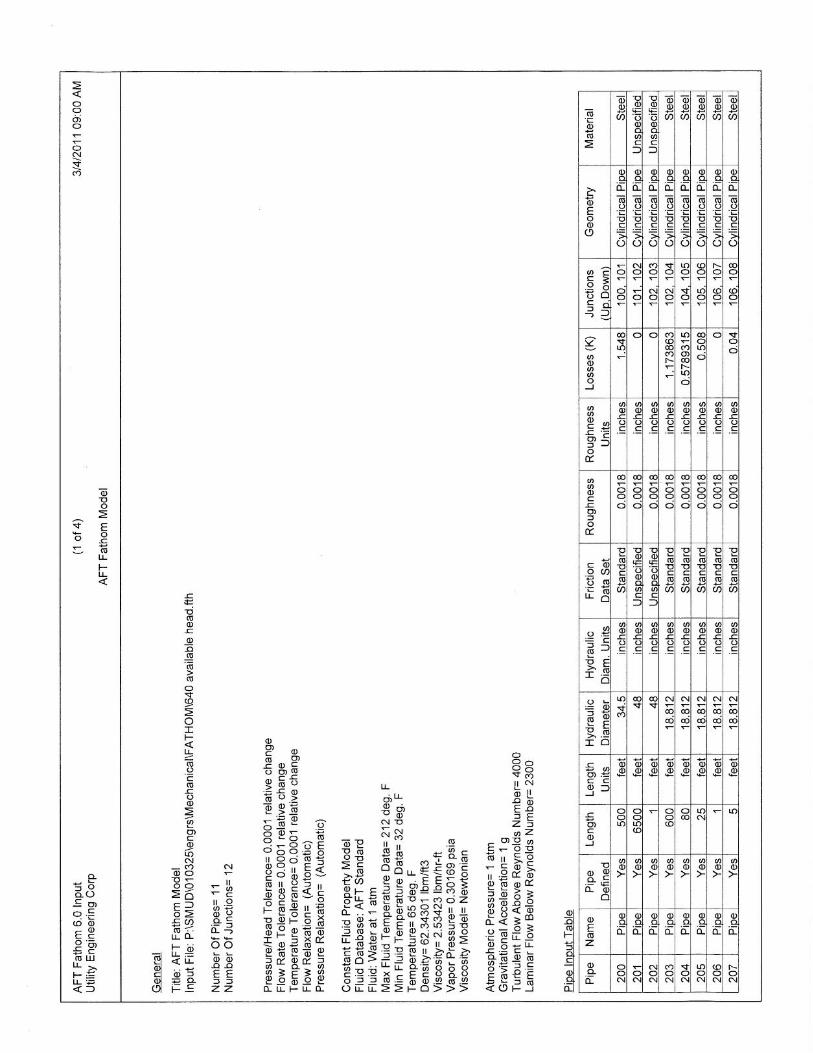
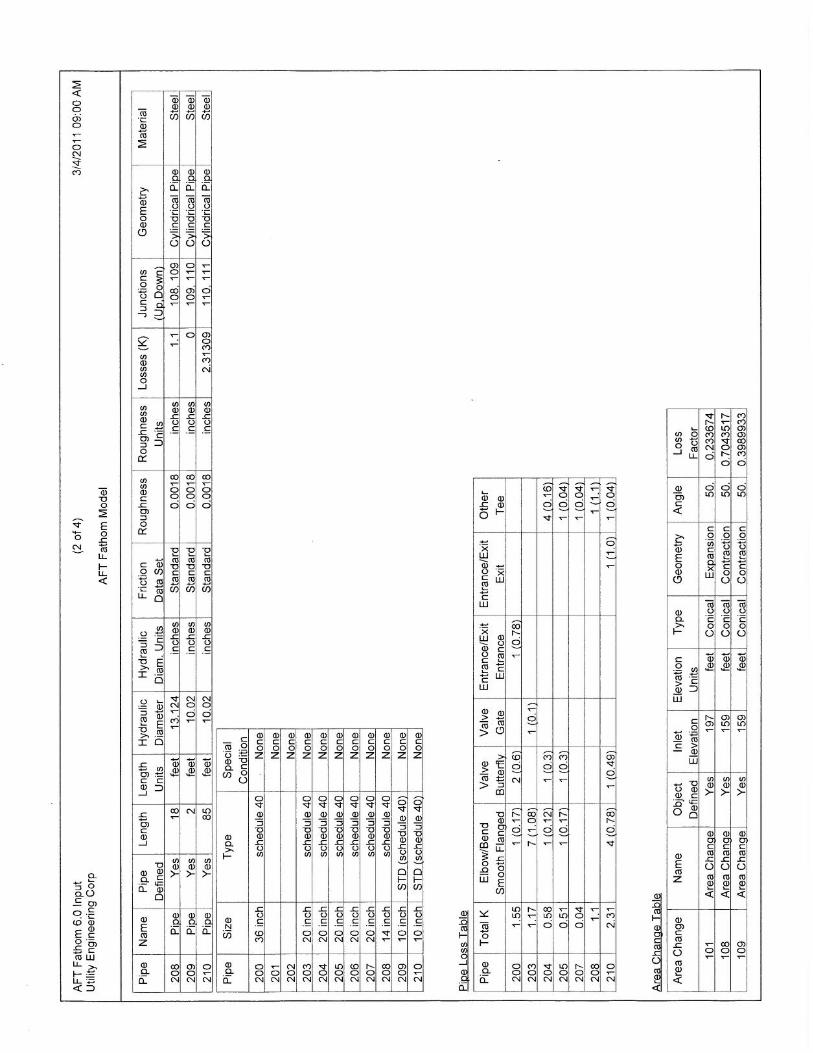
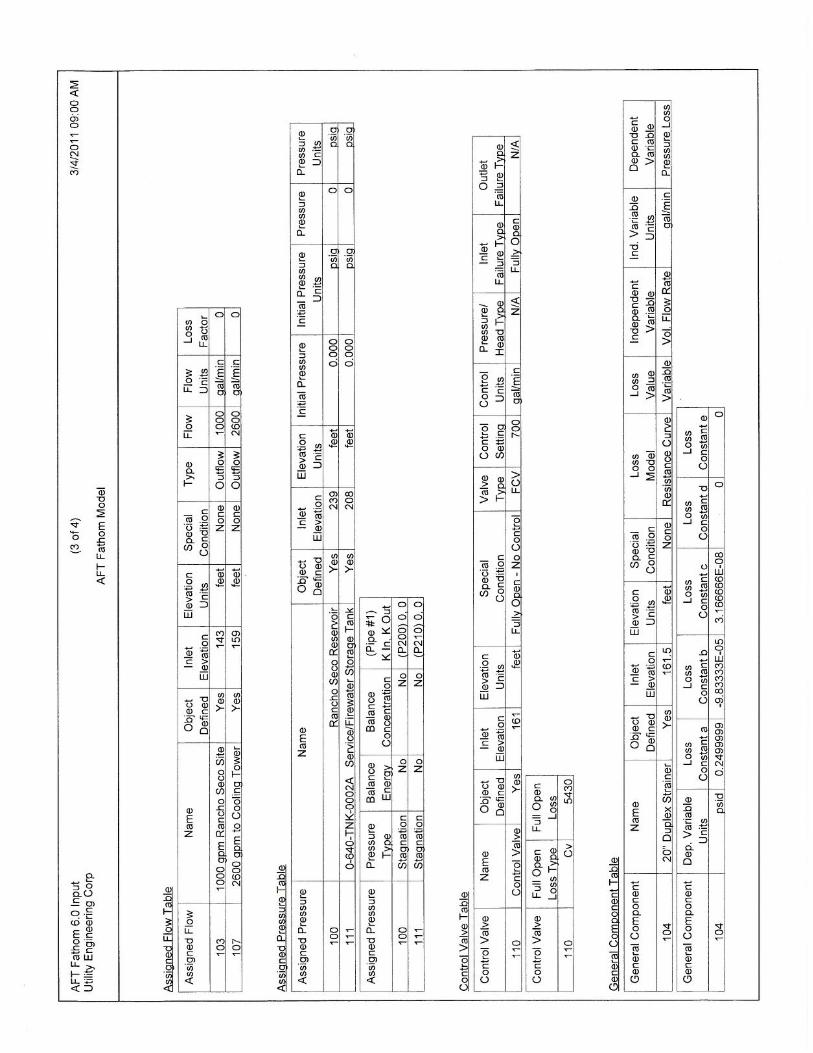
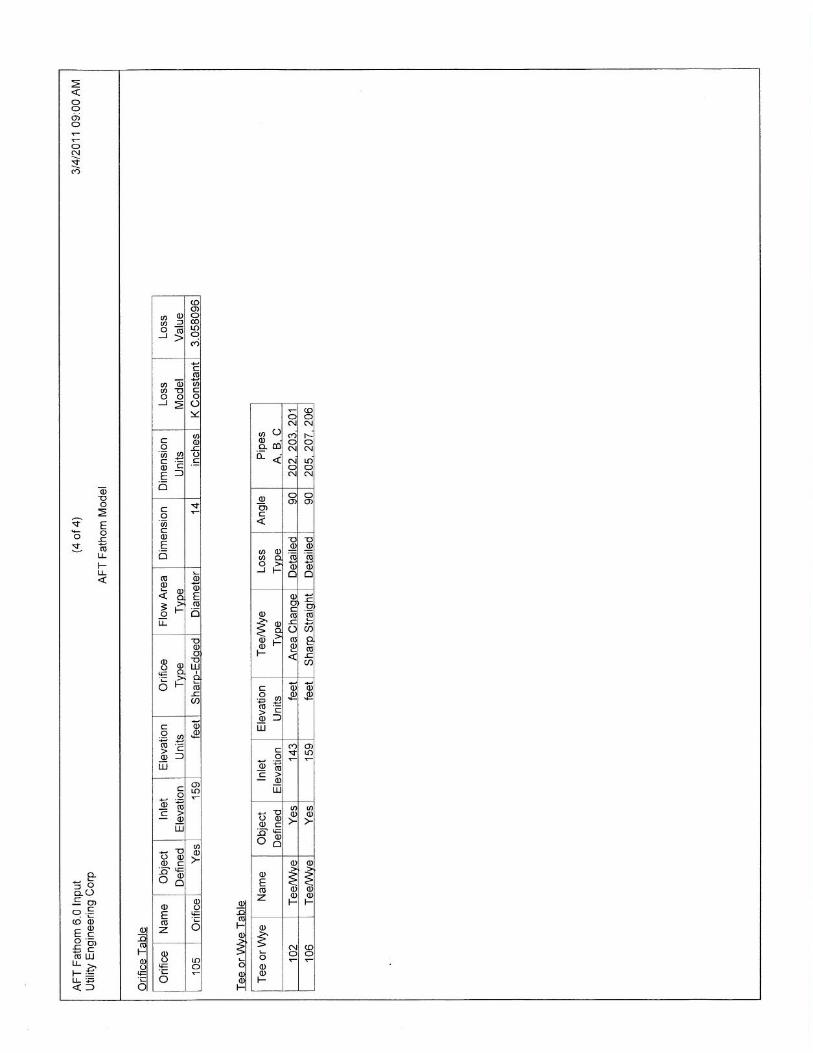
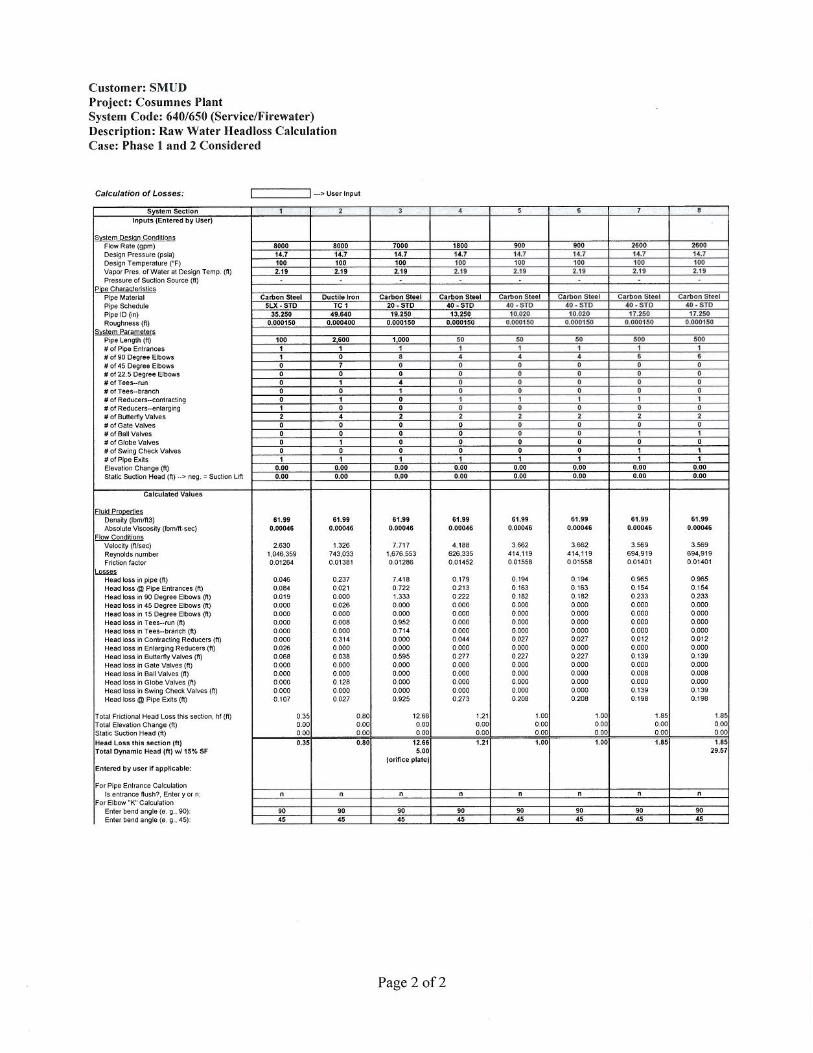
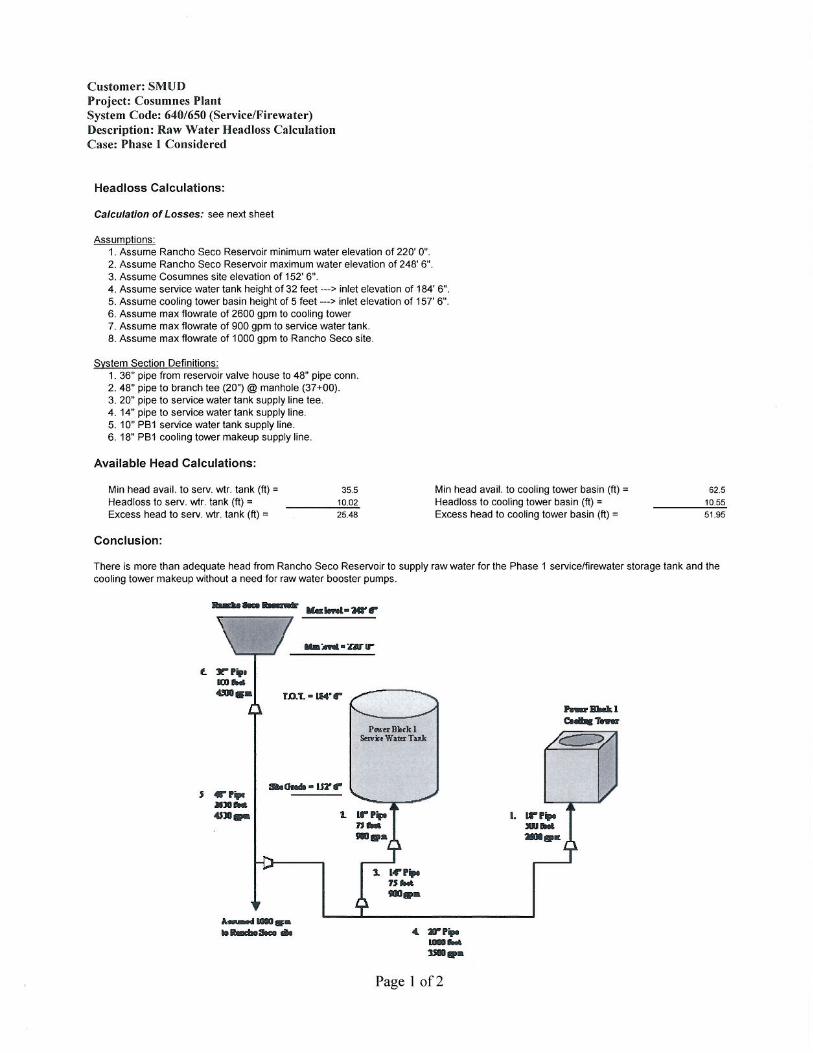
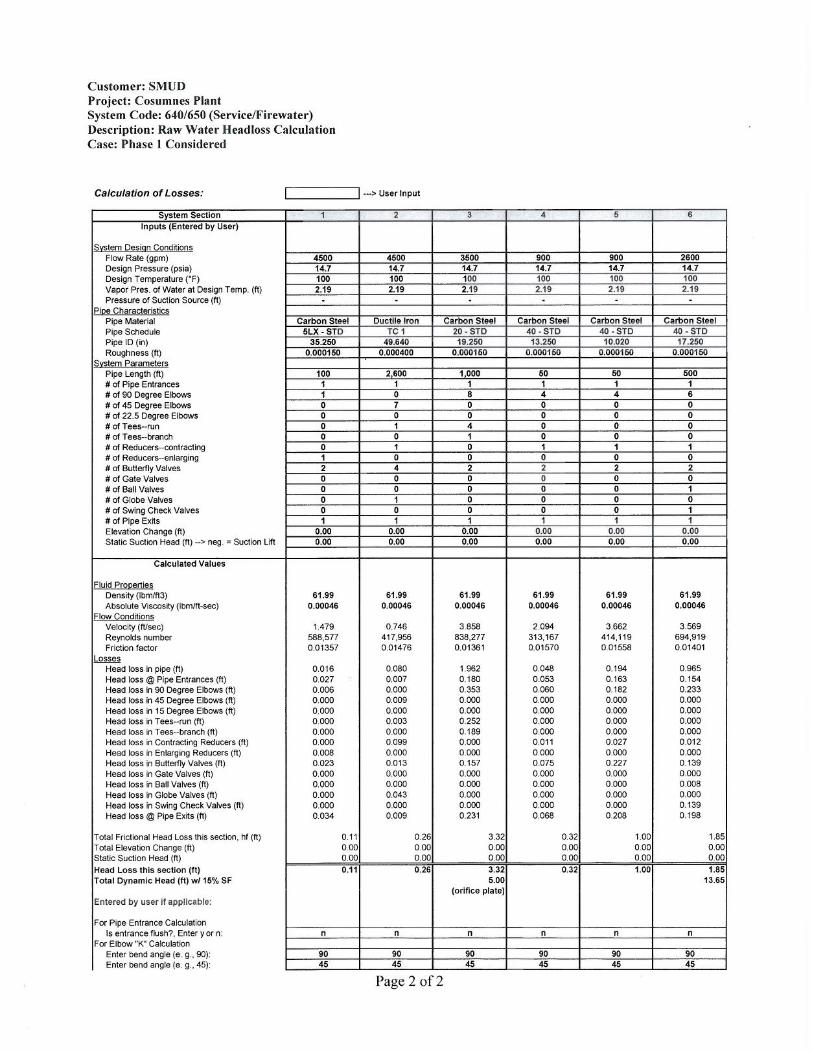
The Raw Water Head Loss Calculations for the CPP are included as Attachment DR5-1.
6. Please identify what the expected maximum flow rate would be for project operation, when it would occur, and how long it may be sustained.
Response:
The maximum flow rate for project operation is not expected to exceed 3,000 gpm. The maximum flow rate would occur on days when temperatures reach or exceed 90 degrees
SOILS AND WATER RESOURCES (5-9)
DR3-1-2 SAC/408620/111150004 (CPP_PTA_DATA_RESPONSES.DOCX)
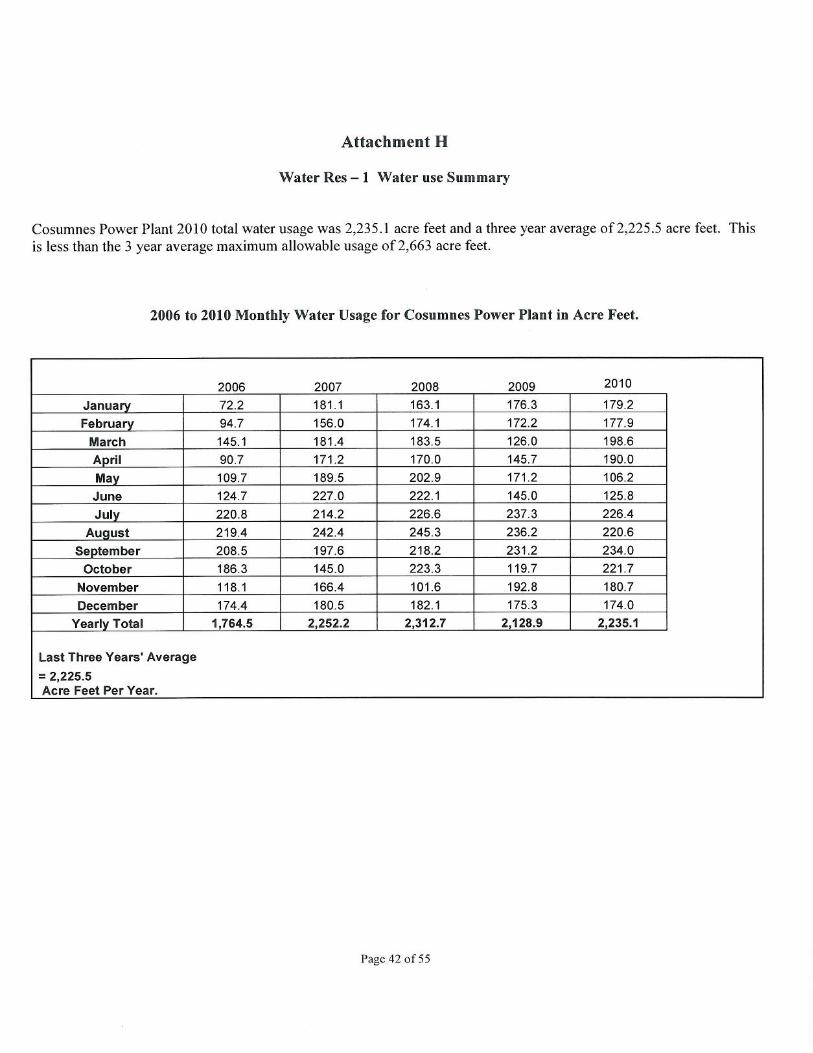
Fahrenheit, generally during the months of June through September. Removal of references to a maximum flow condition would eliminate the need to curtail power during these high-temperature days. Therefore, as stated in the CPP Petition for Post-certification License Amendment, SFA is only requesting to remove the 2,500 gpm instantaneous limit to maximize generation during critical peak demand periods on high-temperature days. However, the project will still retain its total annual use limit of 2,650 AFY. The water use table from our annual CEC report (Attachment DR6-1) provides a summary of water use at CPP throughout the past 5 years.
7. Please discuss whether other users connected to the Folsom South Canal conveyance system will be affected by project operation at the maximum flow rate.
Response:
Because the water conveyance system was originally designed to deliver the total contracted volume noted in DR-5, the volume of CPP water use represents a relatively small fraction of the conveyance system capacity. Therefore, the proposed removal of the peak flow rate is not expected to have an impact on the one down canal user from SMUD’s point of diversion.
8. Our original Staff Analysis indicates that SMUD has a water contract with the Bureau of Reclamation that expires in December 2012. Please discuss the status of the permit renewal and whether successful negotiation of this supply agreement would impact the proposed project water supply.
Response:
Municipal water service contractors like SMUD are entitled to renewal of their contracts by federal law. SMUD has executed a Binding Agreement to Renew its contract, and negotiations have occurred but are not yet complete. However, additional meetings are now being scheduled and both SMUD and the USBR intend to complete the negotiations timely. Please note that the document is a long-term contract rather than a permit.
9. Please discuss whether any of the current water supply agreements used for the project would limit the proposed maximum flow rate.
Response:
As discussed in DR-7, SMUD contracts with the USBR for delivery via the FSC of up to 60,000 AFY of Central Valley Project water and 15,000 AFY of water made available pursuant to another agreement with the City of Sacramento. No water rights conditions are included in these agreements that would require a limitation on the instantaneous flow rate.
Attachment DR5-1 Raw Water Head Loss Calculations
Attachment DR6-1 CPP Water Use Summary
SAC/408620/111150004 (CPP_PTA_DATA_RESPONSES.DOCX) DR6-1-1
Waste Management (10-11)
Background A One Pass Filtration System has been added to the project water supply system for removal of TSS from the lower quality water now being delivered to the plant. Information presented in the 2009 amendment shows the treatment system could generate up to 225 Ibs/hr. of waste. It is unclear how the project owner is managing this waste and whether the operation waste management plan has been updated to include this waste.
Data Requests 10. Please discuss whether the operation waste management plan has been
updated to include management of the OnePass Filter system waste.
Response:
The Cosumnes Power Plant Waste Management Plan was last updated in April 2011 and includes management of the OnePass system waste. A copy of the current Waste Management Plan is included as Attachment DR10-1.
11. Please discuss whether there have been impacts related to management of the OnePass filter system waste.
Response:
As stated in the Petition to Amend, the OnePass system was designed and intended to operate only when the lower quality water is introduced into the Folsom South Canal. Since the system was installed, it has operated for approximately three months to support testing and improvements. During this period, the system has generated 127 tons of non-hazardous waste that was transported to a designated landfill. The truck traffic to transport the new perlite media into the station and waste perlite to the landfill consists of 42 round trips.
Attachment DR10-1 Cosumnes Power Plant
Waste Management Plan
Cosumnes Power Plant Health, Safety, Environmental Procedure
Revision: 0
Issue Date: April 12, 2011
Waste Management Plan Review Cycle: NR
Proc. No.: HSE 10.10
This procedure is the property of Wood Group Power Plant Services (WGPPS) and associated companies, including Wood Group Power Operations, Inc. (WGPO), WGPO (West), WGPO (Freeport), and any other WGPO Business Unit. This procedure shall be implemented as written at facilities that implement a quality management system where WGPPS has executed Operations & Maintenance contracts providing full care, custody and control.
WOOD GROUP
POWER PLANT SERVICES Health, Safety, and Environmental Procedure
Waste Management Plan
Cosumnes Power Plant Health, Safety, and Environmental Procedure
Revision: 0
Issue Date: April 12, 2011
Waste Management Plan Review Cycle: NR
Proc. No.: HSE 10.10
Page 2 of 12 Procedure No. HSE 10.10, Rev. 0
Table of Contents
SECTION TITLE PAGE
TABLE OF CONTENTS
1.0 PURPOSE 3
2.0 SCOPE 3
3.0 REFERENCES 3
4.0 DEFINITIONS 3
5.0 RESPONSIBILTIES 4
6.0 LIMITS AND PRECAUTIONS 5
7.0 PROCEDURE 5
7.1 INTRODUCTION 5
7.2 WASTE DISPOSAL 5
7.3 WASTE MANAGEMENT 6
7.4 WASTE REDUCTION 6
7.5 WASTE GENERATED AT CPP SITE 7
7.6 WASTE STORAGE 10
7.7 EMERGENCY RESPONSE 11
7.8 RESOURCES 11
8.0 RECORDS 11
9.0 TRAINING REQUIREMENTS 12
10.0 ATTACHMENTS 12
Cosumnes Power Plant Health, Safety, and Environmental Procedure
Revision: 0
Issue Date: April 12, 2011
Waste Management Plan Review Cycle: NR
Proc. No.: HSE 10.10
Page 3 of 12 Procedure No. HSE 10.10, Rev. 0
1.0 PURPOSE
The purpose of this Waste Management Plan is to provide general and specific instructions for collecting, storing and preparing shipments of non-hazardous and hazardous waste material. Handling of normal office trash (cardboard boxes, garbage, etc.) generated during normal business activities is not addressed in this document. This procedure is not intended as a substitute for sound and responsible operational practices, intelligent thinking, or experience.
2.0 SCOPE
This procedure applies to waste generated at the Cosumnes Power Plant (CPP).
3.0 REFERENCES
3.1 Contractor Plan
Univar USA, INC., Emergency Contingency Plan, Revised April 2010
3.2 Regulatory Requirements
Title 22, California Code of Regulation (Hazard Waste Management) Accumulating Hazardous Waste at Generator Sites, California Environmental Protection Agency, Department of Toxic Substances Control, Fact Sheet, January 2002 California Energy Commission, Power Plant Certification Process, Laws, Ordinances, Regulations and Standards
3.3 Wood Group Power Plant Services - Health, Safety, and Environmental Guidelines:
1) ENV 3 Waste Management
2) ENV 4 Waste Minimization
3.4 Other Resources
Material Safety Data Sheets (MSDSs) applicable to the waste material. Performance Requirements Univar USA, Inc., [Guidelines for] Waste Management Plan.
4.0 DEFINITIONS
4.1 Conditionally Exempt Small Quantity Generator (CESQG) - Hazardous waste generated on site by a CESQG facility does not exceed 100 kilograms (kg), or 220 pounds (lbs), in a calendar month. Waste management will be optimized at the CPP site as to be listed as a Conditionally Exempt Small Quantity Generator.
4.2 “Cradle to grave” - When applied to hazardous waste, this term implies that the generator is responsible for its proper final disposition.
4.3 Filter Cake/Salt Cake - Solids removed from a solid/liquid mixture by filtration. The residue (“filter cake” or “salt cake”) remains on the filter and the filtrate passes through the filter.
Cosumnes Power Plant Health, Safety, and Environmental Procedure
Revision: 0
Issue Date: April 12, 2011
Waste Management Plan Review Cycle: NR
Proc. No.: HSE 10.10
Page 4 of 12 Procedure No. HSE 10.10, Rev. 0
4.4 Hazardous waste - Waste that is classified by the US EPA or by CA 14 CCR Chapter 3, Article 4, Section 17225.32 as hazardous, and requires special handling and disposal procedures.
4.5 Hazardous waste facility - A facility properly licensed and regulated to dispose of hazardous waste and meeting CA 14 CCR, Division, 7, Chapter 3, Article 5.7, Section 17367 requirements.
4.6 Hazardous waste generator - A facility that generates hazardous waste as part of it normal operation. CPP is a hazardous waste generator.
4.7 Hazardous waste hauler - A trucking or other transportation company licensed to transport hazardous waste material and meeting the requirements of Title 22 of the California Code of Regulations, Division 4.5, Chapter 13.
4.8 Large Quantity Generator (LQG) - A facility designated as an LQG generates more than 1000 kg (2200 lbs) of regulated hazardous waste or one kg (2.2 lbs) of acute hazardous waste per calendar month on site.
4.9 Non-hazardous waste - Waste that is not classified by the US EPA or by CA 14 CCR Chapter 3, Article 4, Section 17368 as hazardous and which has few or no restrictions when disposing.
4.10 One Pass Filter - A filter that removes suspended solids from the makeup water. The filter uses Perlite as the filter medium. Periodically the filter has to be backwashed, which washes the Perlite and suspended solids (perlite waste) off of the filter.
4.11 Paint - A broad category which includes oil-based and latex paints plus varnishes, lacquers and all other types of traditional finishes. It does not include thinners such as turpentine, ketones, mineral spirits, etc. Many local communities have very strict requirements for disposing of waste paints.
4.12 Satellite accumulation area - An area usually close to where the waste is generated and provided with properly labeled waste containers. CPP will not utilize satellite accumulation areas.
4.13 Small Quantity Generator (SQG) - To be designated a small quantity generator, the amount of regulated hazardous waste generated on site must not exceed 100 kg (220 lbs) or one kg (2.2 lbs) in a calendar month.
4.14 Waste storage area - An area that meets regulatory requirements for construction and location within the facility and where hazardous waste can be stored for the time allowed in accordance with regulatory guidelines. Section 7.1 gives some details of the storage site requirements.
5.0 RESPONSIBILITIES
5.1 The Facility Manager is responsible for the effective implementation of this procedure.
5.2 The O&M Manager is responsible for ensuring that plant personnel are properly trained and qualified, as required.
Cosumnes Power Plant Health, Safety, and Environmental Procedure
Revision: 0
Issue Date: April 12, 2011
Waste Management Plan Review Cycle: NR
Proc. No.: HSE 10.10
Page 5 of 12 Procedure No. HSE 10.10, Rev. 0
5.3 The Control Room Operator (CRO) is responsible for assigning a properly trained and qualified Operations and Maintenance Technician (OMT), as required.
5.4 All CPP employees are responsible to reduce waste as much as possible utilizing prudent purchasing, re-using products which have useful life and recycling.
6.0 LIMITS AND PRECAUTIONS
6.1 All waste/material handling should be done in accordance with the requirements found in the appropriate MSDS including use of recommended PPE and after discussion with your supervisor.
7.0 PROCEDURE
7.1 INTRODUCTION
The Cosumnes Power Plant (CPP) generates non-hazardous and hazardous waste during normal operations. Proper management of the waste generated is not only a regulatory requirement, it also emphasizes the value of Wood Group Power Operations philosophy of environmental stewardship.
All Wood Group-CPP team members shall read and understand this procedure and all other applicable training and operations material related to waste management. Information contained in this procedure will be updated periodically to ensure the information is current and applicable for its intended purpose.
The proper disposal of hazardous waste is the responsibility of the generator. If Wood Group-CPP contracts with a waste hauler or disposal facility and the contractor does not follow proper procedure, Wood Group-CPP could be liable for the negligence of the contractor. This concept is commonly referred to as “cradle to grave” responsibility and is part of the product’s life cycle assessment (LCA).
The largest constituent of waste generated at the CPP facility is the solid residue created from the pressure filter in the Zero Liquid Discharge (ZLD) System. The solids are mostly salts resulting from treating process water. Disposal of this residue (filter cake) is a component of Wood Group-CPP’s contract with Univar USA, Inc. Univar subcontracts with Ecology Control Industries (ECI) for waste hauling and emergency response services.
A “One Pass Filter” is used to remove suspended solids from the makeup water for the facility. The filter uses Perlite as the filter medium. Periodically the filter has to be backwashed, which washes the Perlite and suspended solids (perlite waste) off of the filter.
Proper waste management requires periodic inspection of the waste storage area and documentation of all inspections. The inspection log is an auditable legal document.
It is Wood Group Power Operation’s policy to conduct all of its business activities within all applicable regulations. Team members who willfully or through negligence violate any law, including laws pertaining to waste management, will be subject to disciplinary action.
Cosumnes Power Plant Health, Safety, and Environmental Procedure
Revision: 0
Issue Date: April 12, 2011
Waste Management Plan Review Cycle: NR
Proc. No.: HSE 10.10
Page 6 of 12 Procedure No. HSE 10.10, Rev. 0
7.2 WASTE DISPOSAL
Wood Group-CPP maintains a contract with Univar USA, Inc. for removal and disposal of hazardous and non-hazardous waste generated at the CPP facility. Frequency of disposal will be determined by the accumulated quantity and regulatory permitted storage time.
When a waste shipment is to be made, the containers will be sealed so that the no additional material can be added. The contracted waste handling vendor (Univar USA, Inc.) is then contacted for profiling of the waste and removal from site.
A qualified Wood Group-CPP team member will be present when the waste is transported from site. The Wood Group-CPP team member will carefully check the shipping manifest to ensure the proper items were loaded, and if qualified to do so, sign the manifest.
7.3 WASTE MANAGEMENT
Waste management is the process and application of procedures to handle hazardous and non-hazardous waste generate at the CPP property by Wood Group-CPP personnel and their contractors.
7.3.1 Waste Handling and Storage
Waste generated during the normal operation of the CPP facility must be stored in a designated area in approved and properly labeled containers.
The waste containers must be inspected weekly and the inspection documented. Inspection items will include:
Condition of drums and other storage containers. Bulging containers (indicating reactions inside the containers) must be corrected (by venting) immediately. Leaking containers must be over-packed.
Container labeling. All containers must be properly labeled. Special labels provided by the contracted waste handling vendor and showing the type of waste, the date placed in storage, the name of the waste generator and other required information must be clearly visible.
Conditions of storage area. The area must be absent of trash. Containers containing non-compatible material must be separated by the required distance.
7.3.2 Contractor Waste Handling
Contractors must obtain approval from Wood Group-CPP for all chemicals, paints and other hazardous and non-hazardous material that are brought on site for use. Any waste generated by contractors must be removed and properly disposed of in accordance with this procedure. Wood Group-CPP will verify all disposal plans.
Contractors on the plant site are required to follow the same policies as Wood Group-CPP personnel. Wood Group-CPP is responsible for the actions of contractors concerning waste management.
Cosumnes Power Plant Health, Safety, and Environmental Procedure
Revision: 0
Issue Date: April 12, 2011
Waste Management Plan Review Cycle: NR
Proc. No.: HSE 10.10
Page 7 of 12 Procedure No. HSE 10.10, Rev. 0
7.4 WASTE REDUCTION
Wood Group CPP endorses efforts to reduce waste as much as possible. When reducing waste, three principles apply: reduce, re-use, recycle.
7.4.1 Reduce
Reducing the amount of waste generated starts with a thorough review of purchasing policies. Only the amount of material needed for the intended job will be ordered. It may require reducing the inventory kept in the plant to lessen the chance material will become outdated and thereby creating waste.
Sometimes it is possible to change a process or operation so that less waste is generated. For example, switching from a mineral oil to synthetic oil may allow more time between oil changes and reduce the amount of waste generated.
7.4.2 Re-use
Getting the most use of material not only reduces waste, it also makes good economic sense. Items that are changed routinely should be evaluated to make sure the maximum useful life is being obtained. For example, disposable air filters that are changed once a month can be evaluated to see if they could be used longer.
7.4.3 Recycle
Whenever possible material should be recycled. Items no longer suitable for the purpose it was purchased for may have some other use.
Recycling material may require some planning and changes in policy. Innovative thinking may lead to switching from a single-use product to one that can be used more than once or can be used for a different purpose after it is no longer fit for its primary use.
7.5 WASTE GENERATED AT CPP SITE
The waste generated at CPP will be classified and properly segregated in compliance with all applicable laws.
It is expect that the following waste will be generated at the facility:
7.5.1 Pressure Filter Cake/Salt Cake
Pressure filter cake is generated at the ZLD as part of operations. It is expected that two 20-cubic yards containers of this waste will be generated weekly. Univar USA has been contracted to remove and dispose of the waste residue.
During normal operation, Wood Group-CPP personnel to will arrange for the collection of the filter cake, follow the proper procedure for vendors entering plant property, and properly complete CALTRANS/DOT manifests.
Cosumnes Power Plant Health, Safety, and Environmental Procedure
Revision: 0
Issue Date: April 12, 2011
Waste Management Plan Review Cycle: NR
Proc. No.: HSE 10.10
Page 8 of 12 Procedure No. HSE 10.10, Rev. 0
7.5.2 Paints
The amount of paint kept on site will be minimal and is expected to be of “touch-up” quantity. Only the amount needed for a particular job will be ordered. When paint is no longer useable, it should be clearly labeled for profiling and disposal by the contracted disposal vendor. Cans that are empty and dry can be disposed of in normal refuse bins
7.5.3 Petroleum Based Solvents
Examples of petroleum based solvents include mineral spirits, ketones, and kerosene. These will be collected in containers properly labeled for this particular waste profile. Only solvents with the same profile number will be mixed together. Profile numbers for this waste will be determined by the contracted disposal vendor.
7.5.4 Chlorinated Solvent
Chlorinated and petroleum based solvents will not be used as degreasers at the CPP facility. Wood Group-CPP will use only bio-degradable degreasers at the CPP facility. Disposal of the biodegradable solvent will be managed by the contracted disposal vendor (Univar USA, Inc.).
7.5.5 Synthetic Lubricating Oil
Synthetic oils are sometimes used for lubricating and hydraulic control purposes. The synthetic oils shall not be mixed with mineral oils since different chemicals are used as the base for synthetic oil. Waste synthetic oil will be disposed of based on the profile provided by the contracted disposal vendor.
7.5.6 Mineral Lubricating Oil
Mineral oils are also used for lubricating and hydraulic control purposes. For the purpose of this document, lubricating greases are included in the mineral lubricating oil category. Waste oil can be generated by routine oil changes in pumps, gearboxes and other equipment. Waste mineral coil can also be generated by leaks captured by drip pans or oil in cans or other containers inadvertent contaminated by water or debris.
At CPP, waste oil is a California regulated waste stream and will be managed through the contracted disposal vendor.
7.5.7 Oil Filters
Oil filters should be drained as much as possible into approved containers and stored as CA regulated waste. Sometimes this may require punching holes in the filter housing. Disposal of the filters will be managed through the contracted disposal vendor.
7.5.8 Aerosol Cans
Efforts should be made to use the entire contents of aerosol cans. Holding the can in the position recommended on the product label will help ensure enough propellant is available to completely empty the can of its product.
Cosumnes Power Plant Health, Safety, and Environmental Procedure
Revision: 0
Issue Date: April 12, 2011
Waste Management Plan Review Cycle: NR
Proc. No.: HSE 10.10
Page 9 of 12 Procedure No. HSE 10.10, Rev. 0
Empty aerosol cans will be disposed of in approved labeled containers only and managed through the contracted disposal vendor.
7.5.9 Batteries
Batteries of most types are environmental hazards. Lead-acid batteries used in vehicles and portable power equipment should always be exchanged when a new battery is purchase. If the old battery can not be exchanged at the time of the purchase, a proper “core authorization” should be obtained so that the old battery can be turned in later.
Nickel-cadmium and lithium batteries that have a low potential for leakage can be collected in a container appropriate for the collection area. When a sufficient quantity is collected the waste batteries will be profiled and disposed of through the contracted disposal vendor.
Alkaline batteries are the common batteries used in flashlights and battery-powered instruments. To avoid generating excessive waste, batteries should be used until there is noticeable decease in power. An important exception is seldom used critical instrument where leaking batteries could cause damage. In such cases, the batteries should be replaced at appropriate time intervals, based on the expected life of the batteries.
All used batteries will be collected in approved, labeled containers and disposed of through the contracted disposal vendor.
7.5.10 Ethylene Glycol
Ethylene glycol is added to the Closed Cooling Water System. Waste ethylene glycol can be generated by leaks collected in drip pans and small quantities left in containers.
Ethylene glycol, even diluted with water is very hazardous to animal life and should be stored in appropriate metal or plastic containers and held for disposal by the contracted waste handling vendor.
7.5.11 Contaminated Fuels
Contaminated fuels are gasoline, diesel fuel, and other liquid fuels that have been contaminated with water or other material. Waste fuel should be placed in a properly marked container and held for disposal by the contracted waste handling vendor.
7.5.12 Acids
Some waste acids may be generated through laboratory operations or other process activities. All acid waste, liquid or solid, shall be placed in properly marked containers and held for disposal by the waste handling vendor.
7.5.13 Alkalis
Caustic soda or sodium hydroxide (NaOH) and ammonium hydroxide (ammonia in water, NH4OH) are two strong alkalis used in the plant. Other alkalis may also be present in the plant. Alkaline waste, liquid or solid, will be placed in properly labeled containers and held for disposal by the contracted waste handler.
Cosumnes Power Plant Health, Safety, and Environmental Procedure
Revision: 0
Issue Date: April 12, 2011
Waste Management Plan Review Cycle: NR
Proc. No.: HSE 10.10
Page 10 of 12 Procedure No. HSE 10.10, Rev. 0
7.5.14 Empty Containers
Empty drums, buckets and other containers that were used to ship hazardous materials shall be held for disposal by the contracted waste handling vendor.
7.5.15 Lamps
Some lamps (light bulbs) require special disposal practices. These include metal vapors (low and high pressure sodium, mercury), halogen (metal halides), and fluorescent lamps.
Used lamps stored at the CPP facility will be stored in either their original containers or in approved disposal containers while being held for disposal by the contracted waste handling vendor.
7.5.16 Absorbent Material
Absorbent materials such as Pigs® and used spill cleanup kits are to be treated the same as the spilled material that was cleaned up. The used absorbents should be put in properly labeled containers, sealed and held for disposal in accordance with guidelines provided by the contracted waste disposal vendor.
Earth and aggregate removed as part of a spill clean up should be placed in 55 gallon drums and labeled properly. For larger spills where a contractor is involved, the containers must not leave the site without proper profiling and manifesting through the contracted waste disposal vendor.
7.5.17 Water Wash
Waste wash water from the Gas Turbine Generators (CTGs) is contaminated with detergent and oil and therefore can not be process in the plant. The waste water is collected in the gas turbine sumps, profiled, and removed from the site by the contracted waste handling contractor. The removal of waste wash water will require the contractor to provide a vacuum truck.
7.5.18 Oily Rags
Oily rags are generated by Wood Group-CPP and its contractors during maintenance activities. Oily rags are collected in properly labeled containers and routinely removed by a contractor for cleaning.
Oily rags are fire hazards and should be collected in metal drums with lids.
7.5.19 One Pass Filter Waste (Candle Filter)
The One Pass Filter is used to remove suspended solids from the makeup water for the facility. The filter uses Perlite as the filter medium. Periodically the filter has to be backwashed, which washes the Perlite and suspended solids (perlite waste) off of the filter.
Cosumnes Power Plant Health, Safety, and Environmental Procedure
Revision: 0
Issue Date: April 12, 2011
Waste Management Plan Review Cycle: NR
Proc. No.: HSE 10.10
Page 11 of 12 Procedure No. HSE 10.10, Rev. 0
The perlite waste is collected in a 20-yard roll-off. The 20-yard roll-off is designed to allow excess water to drain from the perlite waste. After the perlite waste is allowed to drain the majority of the liquid free material is then disposed of at a local landfill. CPP may in the future consider land application of the perlite waste. The perlite waste has been characterized as non-hazardous waste.
7.6 WASTE STORAGE
All hazardous and non-hazardous waste are stored in an approved central location. There are no satellite accumulation areas in the plant. Containers are provided for the storing the different types of waste expected to be generated at the CPP facility. Proper labeling is required for each container.
Regulations are specific about the type of containers than can be used. Drums with dents, excessive rust or peeling paint are not acceptable. For hazardous waste stored in drums, the drum must meet United Nations (UN) specification. Hazardous and non-hazardous waste containers will be provided by the contracted waste handling contractor (Univar USA).
7.7 EMERGENCY RESPONSE
In the event of a leak or spill that contaminates the ground or air, Wood Group-CPP will follow the procedure of the CPP Integrated Contingency Plan and immediately implement the Incident Control System.
Following rainstorms, the facility containments will be inspected for oil sheens and monitored for pH before dewatering. Based on the analysis, the water will be treated as rain water or properly profiled waste streams. A record will be maintained to indicate the rain event and the inspection of each containment.
7.8 RESOURCES
For information related to handling, storage and regulatory compliance of hazardous waste, Wood Group-CPP will defer to the contracted waste handling vendor, Univar USA. Univar personnel should be contacted in the following order:
Lynette Washington Sales, 323-837-7137 Steven Ojedia Technical Specialist, 408-307-7340 Lauran Goddard, Technical Specialist, 916-424-2134
8.0 RECORDS
8.1 Records generated as a result of this procedure shall be maintained in accordance with procedure QP-QCP-CQP, Control of Quality Records.
Cosumnes Power Plant Health, Safety, and Environmental Procedure
Revision: 0
Issue Date: April 12, 2011
Waste Management Plan Review Cycle: NR
Proc. No.: HSE 10.10
Page 12 of 12 Procedure No. HSE 10.10, Rev. 0
9.0 TRAINING REQUIREMENTS
9.1 Wood Group-CPP personnel that handle non-hazardous and hazardous waste will be properly trained including hazardous waste operator, DOT shipping manifest, and waste management awareness training. Some portions of the training must be repeated annually while others require only annual refresher courses. Some employees, because of their job duties, will receive more extensive training. Proper training documentation must be maintained as a regulatory requirement.
10.0 ATTACHMENT(S)
None


![Mariposa Democrat (Mariposa, Calif.) 1857-07-30 [p ]...Mariposa Brewery.—Messrs. Hornneber & Lcsman,proprietors ofthe Mariposa Brew-ery,appreciating ourexertionsthishot weath-erinthe](https://img.pdfslide.us/doc/110x75/612d6a161ecc515869422c8c/mariposa-democrat-mariposa-calif-1857-07-30-p-mariposa-breweryamessrs.jpg)