Embed Size (px)
Citation preview

Marion County Metricsfor Quality of Life and
Community Assessment

www.indyindicators.iupui.edu2

3www.indyindicators.iupui.edu
Legend
indicates the metric moved in a positive direction.
indicates the metric moved in a negative direction.
indicates the trend was unchanged.
Community AssessmentA community assessment is vital to understanding the context in which we live. It is a snapshot that allows commu-nities to evaluate the effectiveness of programs, determine strengths and challenges and potentially assist in the allo-cation of resources. While this report is not a set of recommendations, it can provide valuable measurements tothose who impact public policy and work to improve our communities. Using measures of demographics, health, theeconomy, and social and physical environments, a community assessment serves as a barometer determining ourquality of life.
Demographics Marion County and the Indianapolis MSA both experienced growth in population between the 2000 and 2010census. A growing population indicates a place where people want, and can afford, to live. This measure is particu-larly telling during a period when other major Midwest cities experienced population decline, such as Chicago andDetroit. Another positive measure is the continued diversification of Marion County. Although the population ofMarion County is more than 60 percent white, there has been growth in the black and Asian communities, and thosewho identify as Hispanic or Latino. Marion County also saw growth in foreign born populations. A communitythat can foster greater diversity stands to benefit from the cultural richness and educational opportunities diversitybrings.
HealthThere are numerous measures of health that are used throughout this assessment. Marion County has improved re-cently in the decrease in the percentage of people who smoke and an increase in the percentage of adults (50+)who have had a colorectal screening. These measures are important because they indicate residents are makinghealthy choices. However, Marion County still faces significant challenges in fighting obesity and diabetes ,both of which have risen steadily and have serious long-term cost.
EconomyThe recent recession has taken its toll on many communities in the United States; Marion County is no exception.Household incomes fell considerably from 2006-2010 and Marion County faces serious challenges in improvingeducational attainment. Still, Marion County experienced a reduction in cost-burdened homeowners with a mortgage and a reduction in the residential vacancy rate. Despite the severity of the recession, there was nochange in the percentage of household receiving food stamps/SNAP.
Social and Physical EnvironmentThe quality of the environment, both physical and civic, and the accessibility of amenities also can indicate quality oflife. Marion County has increased the number of licensed child care centers. Another measure of quality of life is themean travel time to work. Residents of Marion County experienced no change in their mean travel time to work.This measure indicates that while transportation conditions are not worsening, they are also not improving. Yet, Marion County faces a challenge in fostering civic engagement as voter turnout continues to decline. Withgreater civic engagement, residents are more invested in and responsible for their community.

4 www.indyindicators.iupui.edu
SponsorsThe primary sponsors of this project are the Marion CountyPublic Health Department and Indiana University Purdue University Indianapolis.
ProducersLeadership and support for this project is provided by thesethree IUPUI research centers:
Quality of LifeWe all want a good quality of life for ourselves and for our
communities. We each may have different perspectives on
what that means: good job, good schools, good health, dri-
vable roads, walkable cities. But how do we know if we "have
it”? How do we know if the quality of life in our communities,
is as good, or better, than other places? And if it isn't stacking
up, how would we know that?
The Indy Indicators project is all about measuring and engag-
ing people in the Quality of Life in Central Indiana. It uses the
nickname of the region's largest city, but it spans central Indi-
ana from Terre Haute to Richmond and from Bloomington to
Lafayette to Muncie. It focuses on KEY indicators – those indi-
cators that are deemed by many experts to be the ones that
make the difference in a community's quality of life.
This report focuses on Marion County. The first section pro-
vides basic demographic data and provides a baseline for
analysis. From there the emphasis shifts to the topics often
connected to quality of life: health, economics, physical and
social environments, and civic engagement. Within each of
these topics there are data for Marion County as well as data
for comparable geographies. Depending on the source of the
data, there will be data for the Indianapolis MSA, the State of
Indiana, Healthy People 2020 or peer counties nationwide.
Supporting indicators are also available and provide addi-
tional insight into conditions in Marion County and show if
conditions are changing over time.
The Indy Indicators project and this report would not be pos-
sible without the support of the Marion County Public Health
Department.
For additional information on the project please visit the Indy
Indicators website at http://indyindicators.iupui.edu

5www.indyindicators.iupui.edu
860,454 903,393
1,525,1041,756,241
2000 2010Marion County (Indianapolis) Indianapolis MSA
Source: U.S. Census Bureau 2000 and 2010 Census; Indiana Business Research Center
Source: U.S. Census Bureau, 2000 and 2010 Census
0%
5%
10%
15%
20%
25%
NaturalResources &
Mining
Construc�on Manufacturing Trade,Transporta�on,
& U�li�es
Informa�on FinancialAc�vi�es
Professional &BusinessServices
Educa�on &Health Services
Leisure &Hospitality
Other Services
Marion County United States
Popula�on Growth(2000-2010)
Diversity in Marion County(2000 & 2010)
Employment by Industry(2010)
Ethnicity in Marion County 2000 2010
White 70.5% 62.7%
African-American 24.2% 26.7%
American Indian/Alaskan Na�ve 0.3% 0.3%
Asian 1.4% 2.0%
Na�ve Hawaiian/ Pacific Islander 0.0% 0.1%
Two or more races 1.6% 2.8%
Iden�fy as Hispanic or La�no 3.9% 9.3%
Source: U.S. Bureau of Labor Sta�s�cs: Loca�on Quo�ent Calculator, 2010
To find the economic drivers in the local economy, we can compare employment in local industries and employmentat the national level. Compared to the national economy, Indianapolis has a larger share of its employed workers inmanufacturing (percentage of employed workers is 1.15 times that of the national economy); financial activities (1.11);professional and business services (1.08); and education and health services (1.05). Put simply, these industries thatemploy a greater share of the workforce than the national economy are likely to export goods and services and bringwealth into the community.1Indianapolis Metropolitan Statistical Area consists of: Brown, Boone, Hamilton, Hancock, Hendricks, Johnson, Marion, Putnam, and Shelby counties.
Marion County and the Indianapolis MSA1 have experi-enced healthy population growth during the last 10 years.Marion County is home to Indianapolis, which is the sec-ond largest city in the Midwest (after Chicago) and thesecond largest state capital (after Phoenix). In 2010, thepopulation of Marion County passed 900,000 and the In-dianapolis MSA population reached 1.76 million. Much ofthe recent growth is attributed to the sustained develop-ment in Hamilton County, particularly the city of Carmel,and Hendricks County.
As Marion County’s population grows, it cultivatesgreater diversity. Though still predominantly white, Mar-ion County experienced a decrease in the white popula-tion from 2000-2010, while black and Asian populationsincreased as proportions of the total population. Ameri-can Indian or Alaskan Native and Native Hawaiian or otherPacific Islander, while accounting for less than one per-cent of the population, either saw growth in populationor sustained numbers. The number of people who iden-tify as Hispanic or Latino increased significantly from 3.9percent in 2000 to 9.3 percent in 2010.
Demographics

6 www.indyindicators.iupui.edu
20%
22%
24%
26%
28%
30%
32%
34%
2006 2007 2008 2009 2010
Marion County (Indianapolis) Indianapolis MSA
Indiana United States
Source: Centers for Disease Control and Preven�on (CDC). Behavioral Risk Factor Surveillance System Survey Data, 2006-2010
Source: Centers for Disease Control and Preven�on (CDC). Behavioral Risk Factor Surveillance System Survey Data, 2006-2010
Source: Indiana State Department of Health. Hospital Discharge Data, 2010
Percent of Adults who are Obese(2006-2010)
Percent of Popula�on with Diabetes(2006-2010)
Hospitaliza�on Average Length of Stay (Days)(2010)
Geography Diabetes COPD Asthma
Marion County 5.7 4.2 2.9
Indianapolis MSA 5.7 4.2 2.9
Indiana 4.9 4.2 3.1
Na�onal 5.1 5.1 3.4
6%
7%
8%
9%
10%
11%
12%
2006 2007 2008 2009 2010
Marion County (Indianapolis) Indianapolis MSA
Indiana United States
Note: ICD-9-CM Codes usedDiabetes: 25000,25010,25022,25030,25040,25052,25060,25070,25080,25090Asthma: 49300,49301,49311,49320,49321,49390,49391COPD: 4911,49120,49121,4918,4919,4920,4928
The table above shows the average length of stay in the hospital per disease. Length of stay can serve as a proxymeasure for frequency and cost of hospital visits. Average days spent in the hospital for COPD and asthma weresimilar across geographies in Indiana. The noticeable difference is in average length of stay for diabetes. Patients,on average, spend nearly a day more in the hospital in Marion County and the MSA as compared to the state.Greater access to and concentration of specialized care in the metropolitan area may explain this difference. Thenational average is provided simply for comparison and may contain more ICD-9-CM codes than for the measuresacross Indiana.
The CDC defines a person who is obese as having a BodyMass Index (BMI) of 30 percent or higher. In 2010, theobesity rate for Marion County reached 32 percent, whilethe national rate was lower at 27.5 percent. Obesity alongwith smoking, physical inactivity and improper diet arerisk factors that contribute to type 2 diabetes.
Diabetes continues to be a challenge for Marion County.In the CDC’s Behavioral Risk Factor Surveillance Systemannual survey, the percentage of people diagnosed withdiabetes has steadily increased. In Marion County, from2006-2010, the percent of the population who had dia-betes increased from 9 to 11 percent while the nationalrate only increased from 8 to 9 percent.
Health
7www.indyindicators.iupui.edu
0%
2%
4%
6%
8%
10%
2007 2008 2009 2010
Marion County (Indianapolis) Indianapolis MSA
Indiana United States
20.6 21.214.5
45.5
26.6 24.616.3
69.6
Breast Cancer Prostate Colorectal Cancer Lung & BronchusCancer
Healthy People 2020 Marion County (Indianapolis)
Source: Centers for Disease Control and Preven�on (CDC). Behavioral Risk Factor Surveillance System Survey Data, 2007-2010
Source: 1 Centers for Disease Control and Preven�on: Na�onal Diabetes Surveillance System, 2008. 2Centers for Disease Control and Preven�on (CDC). Behavioral Risk Factor Surveillance System Survey Data, 2008-2010
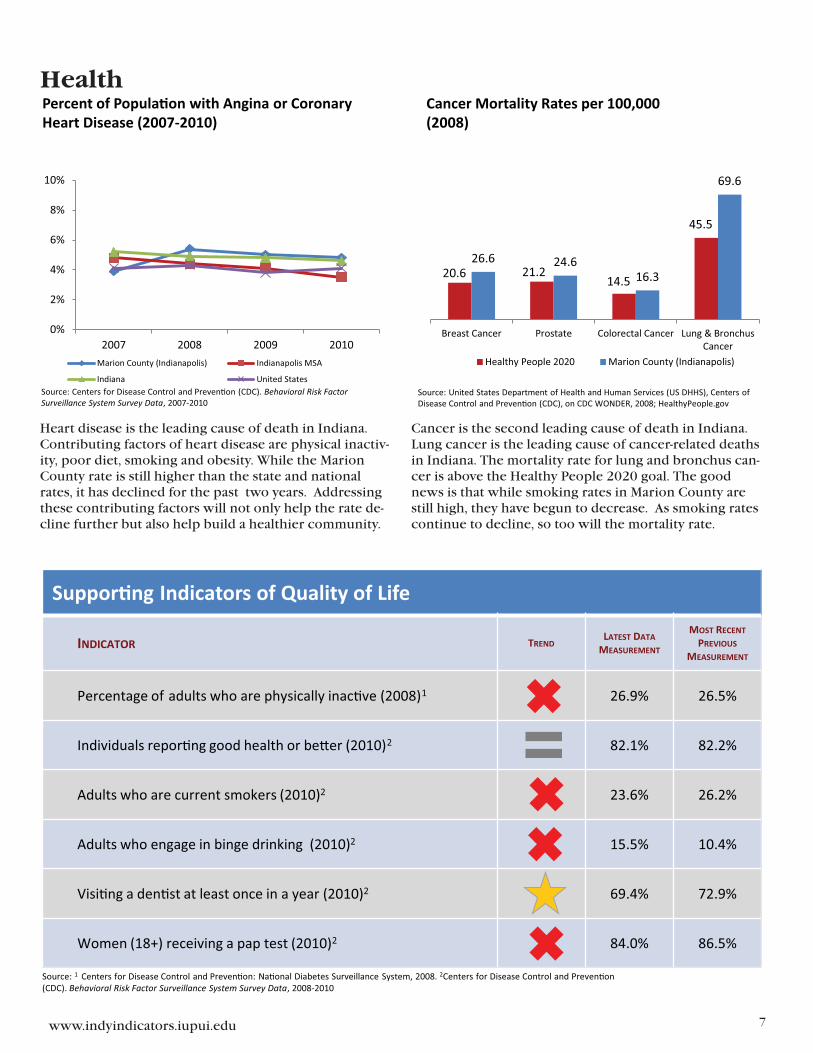
Percent of Popula�on with Angina or Coronary Heart Disease (2007-2010)
Cancer Mortality Rates per 100,000(2008)
Source: United States Department of Health and Human Services (US DHHS), Centers of Disease Control and Preven�on (CDC), on CDC WONDER, 2008; HealthyPeople.gov
Suppor�ng Indicators of Quality of Life
INDICATOR TRENDLATEST DATA
MEASUREMENT
MOST RECENT
PREVIOUS
MEASUREMENT
Percentage of adults who are physically inac�ve (2008)1 26.9% 26.5%
Individuals repor�ng good health or be�er (2010)2 82.1% 82.2%
Adults who are current smokers (2010)2 23.6% 26.2%
Adults who engage in binge drinking (2010)2 15.5% 10.4%
Visi�ng a den�st at least once in a year (2010)2 69.4% 72.9%
Women (18+) receiving a pap test (2010)2 84.0% 86.5%
Heart disease is the leading cause of death in Indiana.Contributing factors of heart disease are physical inactiv-ity, poor diet, smoking and obesity. While the MarionCounty rate is still higher than the state and nationalrates, it has declined for the past two years. Addressingthese contributing factors will not only help the rate de-cline further but also help build a healthier community.
Cancer is the second leading cause of death in Indiana.Lung cancer is the leading cause of cancer-related deathsin Indiana. The mortality rate for lung and bronchus can-cer is above the Healthy People 2020 goal. The goodnews is that while smoking rates in Marion County arestill high, they have begun to decrease. As smoking ratescontinue to decline, so too will the mortality rate.
Health

8 www.indyindicators.iupui.edu
81.9%83.8%
87.0%
81.8%
86.6% 87.7%
100%
Marion Co.,IN
Shelby Co.,TN
Franklin Co.,OH
DavidsonCo., TN
JeffersonCo., KY
HamiltonCo., OH
% with Health Coverage Healthy People 2020
0%
10%
20%
30%
40%
50%
60%
70%
80%
2002 2004 2006 2008 2010Marion County (Indianapolis) Indianapolis MSAIndiana United StatesHealthy People 2020
Source: U.S. Census Bureau, 2010 American Community SurveySource: Center for Disease Control and Preven�on (CDC). Behavioral Risk Factor Surveillance System Survey Data, 2002-2010; HealthyPeople.gov
Suppor�ng Indicators of Quality of Life
INDICATOR TRENDLATEST DATA
MEASUREMENT
MOST RECENT
PREVIOUS
MEASUREMENT
Children without health coverage (2010)1 9.5% 9.4%
Popula�on ea�ng five or more servings of fruits andvegetables per day (2009)2 24.5% 23.7%
Men (40+) who have had a prostate cancer screening (2010)2 56.3% 58.6%
Individuals with a disability (2010)1 12.4% 12.7%
Infant mortality rate (2008)3 8.2/1,000 9.1/1,000
Percent of expectant mothers receiving prenatal care (2007)4 * 60.6% 72.0%
Sources: 1U.S. Census Bureau, 2009-2010 American Community Survey; 2Centers for Disease Control and Preven�on (CDC). Behavioral Risk Factor Surveillance System Survey Data, 2007-2010 ; 3 United States Department of Health and Human Services (US DHHS), Centers of Disease Control and Preven�on (CDC), on CDC WONDER On-line Database 2007-2008; 4Indiana State Department of Health, HHOSC, Maternal and Child Health, and Children’s Special Health Care Services, 2006-2007
*Cannot defini�vely assign a direc�onal value due to change in data collec�on methods.
Percent of Popula�on with Health Coverage (2010)
Percent of Adults Age 50+ that have had a Colorectal Screening (2002-2010)
Access to health care is an important measure as thosewith coverage are more likely to seek medical attentionand preventative care. People without health insuranceare more likely to rely on more costly emergency roomservices for their health care. Marion County trails peercounties in other states and falls below the Healthy People2020 objective of 100 percent coverage.
Preventative screenings such as sigmoidoscopies andcolonoscopies are crucial to early detection and treat-ment of colorectal cancer. In 2010, Marion County sur-passed the Healthy People 2020 target for the percent ofadults age 50+ who have received sigmoidoscopies orcolonoscopies. This rate exceeds the MSA, state and na-tional rates and continues a positive upward trend.
Health

9www.indyindicators.iupui.edu
5%
10%
15%
20%
25%
2006 2007 2008 2009 2010
Marion County (Indianapolis) Indianapolis MSA
Indiana United States
7%
8%
9%
10%
11%
12%
13%
2006 2007 2008 2009 2010
Marion Co., IN Jefferson Co., KY Franklin Co., OH
Hamilton Co., OH Davidson Co., TN Shelby Co., TN
Source: U.S. Census Bureau, 2006-2010 American Community Survey Source: U.S. Census Bureau, 2006-2010 American Community Survey
Suppor�ng Indicators of Quality of Life
INDICATOR TRENDLATEST DATA
MEASUREMENT
MOST RECENT
PREVIOUS
MEASUREMENT
Family poverty rate (2010) 16.3% 15.4%
Children (under 18) below poverty level (2010) 30.8% 28.5%
Individuals receiving Supplemental Security Income (SSI) (2010) 4.7% 3.0%
Households receiving food stamps/SNAP assistance (2010) 14.3% 14.1%
Source: U.S. Census Bureau, 2009-2010 American Community Survey
Poverty Rate(2006-2010)
Percent Female Head of Household with Own Children Under 18 (2006-2010)
According to the 2010 American Community Survey, con-ducted by the U.S. Census Bureau, more than 15 percentof the U.S. population now lives below the poverty line.The poverty rates for the Indianapolis MSA and Indianahave risen with the national average; however, MarionCounty’s poverty rate continues to reach levels never be-fore seen. With more than 20 percent of the population(or 1 in 5 people) below the poverty line, the long-term ef-fects on neighborhoods, communities, and vulnerablegroups such as children are unknown.
During the last five years, Marion County has outpaced itspeer cities in growth among households with children ledsolely by a female householder (10 percent increase);among those same cities it is tied for the second highestrate of households led by a single female. Research showsthat these households are at higher risk of poverty thanhouseholds with two earners.
Economy

10 www.indyindicators.iupui.edu
Source: U.S. Census Bureau, 2010 American Community Survey Source: U.S. Census Bureau, 2006-2010 American Community Survey
Source: Indiana Department of Workforce Develop, 2010 Hoosiers by the Numbers
Educa�onal A�ainment(2010)
Change in Median Household Income(2010)
Marion County Labor Force and Unemployment Rates (2005-2010)
0%
2%
4%
6%
8%
10%
12%
445,000
450,000
455,000
460,000
465,000
470,000
2005 2006 2007 2008 2009 2010
Labor Force Unemployment Rate
26.6%
30.3%
34.9%
33.1%
34.5%
28.2%
84.1%
87.3%
89.5%
89.0%
84.3%
86.6%
Marion Co., IN
Jefferson Co., KY
Franklin Co., OH
Hamilton Co., OH
Davidson Co., TN
Shelby Co., TN
% Bachelors Degree or Higher % High School or Higher
-14.1%
-9.8%
-4.0% -4.3% -4.0%
-1.2%
MarionCo., IN
JeffersonCo., KY
FranklinCo., OH
HamiltonCo., OH
DavidsonCo., TN
ShelbyCo., TN
Marion County has room to improve in comparison to itspeer counties in terms of educational attainment. Of theeight counties included, Marion County is sixth in termsof percent with a Bachelor’s Degree or Higher (26.6 per-cent) and is last in percent with a High School Degree orHigher. While Marion County is experiencing challengesin comparison to its peer counties, educational attainmentfor the Indianapolis MSA (not shown) exceeds both thestate and nation on both metrics.
Marion County has seen a substantial decrease in realearnings during the past five years. While all of its peercounties lost income, the drop in Marion County from$45,371 to $38,959 (2010 dollars) represented the great-est drop among peer counties. Some of the decrease inmedian household income can be attributed to the na-tional recession; however, the rate of decrease in MarionCounty when compared to other counties is cause forconcern.
Economics
The annual unemployment rate has in-creased considerably during the past sixyears. This local trend mirrors a nationaltrend; however, it has been somewhat morepronounced locally as Marion County wasin a better position than its peer counties in2005. Perhaps of greater concern is the sig-nificant shrinkage of the labor force in Mar-ion County; the downsizing of the labormarket could suggest that a substantialnumber of residents have given up lookingfor work during the poor economy, whichmeans the actual rate of unemploymentcould be much greater than what is shown.

11www.indyindicators.iupui.edu
Source: U.S. Census Bureau, 2005-2009 American Community Survey; TRF Policy Map Source: U.S. Census Bureau, 2005-2009 American Community Survey; TRF Policy Map
Cost-Burdened Homeowners (2009)
Cost-Burdened Renters (2009)
9.1%
8.7%
9.0%
9.7%
10.5%
13.3%
26.0%
24.0%
27.4%
26.7%
28.8%
31.7%
Marion Co., IN
Jefferson Co., KY
Franklin Co., OH
Hamilton Co., OH
Davidson Co., TN
Shelby Co., TN
Extremely Cost Burdened Homeowners Cost Burdended Homeowners
Suppor�ng Indicators of Quality of Life
INDICATOR TRENDLATEST DATA
MEASUREMENT
MOST RECENT
PREVIOUS
MEASUREMENT
Per capita income (2010)1 $22,170 $23,207
Students eligible for free/reduced lunch (2010)(public, non-charter schools)2 60.7% 58.8%
Cost-burdened homeowners (with a mortgage) 1 30.3% 31.8%
Median housing value (owner-occupied) (2010)1 $118,200 $120,900
Residen�al vacancy rate (2010)1 15.0% 15.3%
Sources: 1U.S. Census Bureau, 2009-2010 American Community Survey; 2 Indiana Youth Ins�tute, Indiana Department of Educa�on, Free and Reduced Lunch, 2010
24.1%
23.4%
22.7%
24.8%
21.5%
27.7%
47.5%
44.4%
44.4%
45.6%
45.4%
51.5%
Extremely Cost Burdened Renters Cost Burdened Renters
Marion Co., IN
Jefferson Co., KY
Franklin Co., OH
Hamilton Co., OH
Davidson Co., TN
Shelby Co., TN
A little more than one in four (26 percent) homeownersin Marion County is considered to be cost burdened withhousing costs in excess of 30 percent of household in-come. Nearly one in 11 (nine percent) are extremely costburdened with housing costs in excess of 50 percent ofhousehold income. On both of these measures, MarionCounty fares well in comparison to peer counties on thecounty’s low cost of living, supply of available housingunits and diverse economic base. These likely contributeto its relatively low level of cost burdened households.
Nearly one in two renters in Marion County are paying alease that is considered to be a cost burden to their house-hold, and nearly one in four are extremely cost burdened.While these figures are not substantially different fromMarion County’s peer counties, there is cause for concernwith regard to the burden that housing costs are posing toMarion County renters. The cost burden of housing mayprevent families from moving up the ladder of economicself-sufficiency as it decreases a household’s ability to saveor invest in its future through education or entrepreneurship.
Economics

12 www.indyindicators.iupui.edu
Source: Indiana State Police Automated Repor�ng Informa�on Exchange System (ARIES), as of March 1, 2011. Prepared by the IU Public Policy Institute.
County Total Crashes Total Fatali�es Alcohol Crashes Alcohol Fatali�es Speed Crashes Speed Fatali�es
Boone County 1,802 7 45 3 194 1
Brown County 517 2 12 0 70 0
Hamilton County 6,671 19 139 5 400 7
Hancock County 1,441 8 37 0 122 2
Hendricks County 3,476 11 76 0 372 3
Johnson County 2,986 9 75 0 276 1
Marion County 27,519 73 591 25 2,208 16
Morgan County 1,532 3 24 0 124 0
Putnam County 832 2 16 0 70 0
Shelby County 1,112 16 20 0 183 4
Age of Housing Stock: Lead in Household(2010)
Traffic Crashes Indianapolis MSA Coun�es(2010)
58.9%
67.7%
49.6%
69.0%
42.2%
45.8%
Shelby Co., TN
Davidson Co., TN
Hamilton Co., OH
Franklin Co., OH
Jefferson Co., KY
Marion Co., IN
Percent of Days When Air Quality was Good(2010)
33.6%
31.7%
40.2%
20.3%
42.9%
42.0%
66.4%
68.3%
59.8%
79.7%
57.1%
58.0%
Marion Co., IN
Jefferson Co., KY
Franklin Co., OH
Hamilton Co., OH
Davidson Co., TN
Shelby Co., TN
Built A�er 1980 Built Prior to 1980
Source: Environmental Protec�on Agency (EPA), 2010 Air Quality Index Report Source: U.S. Census Bureau, 2010 American Community Survey
Air quality is a critical environmental measure that affectseveryone. According to the World Health Organization,some of the health concerns associated with poor air qual-ity are respiratory infections, heart disease, and lung can-cer. Poor air quality is particularly harmful to children.Marion County falls near the bottom of similar countiesfor days when the air quality was good. Air quality is apublic health concern because it impacts other factorscontributing to overall health, such as frequency of exercise.
Housing stock built prior to 1980 is a common measureused to assess the likelihood of lead paint in households(EPA). Units built after 1980 are presumed to be lead-freedue to the ban on the sale of lead paint in 1978. Someunits built prior to 1980 will have had any lead paint con-cerns remediated, but the age of housing stock offers aconvenient proxy for the scale of the issue of lead inhomes. Marion County ranks in the middle of its peercounties however, with 66.4 percent of its housing unitsbuilt prior to 1980, lead in households could continue tobe an issue.
Social and Physical Environment
Traffic accidents are costly both in terms of the damage to vehicles and property and in terms of injuries to individualpersons and lost wages. A closer look at the types and frequencies of crashes in the Indianapolis MSA in 2010, showsthat the largest volume of crashes occur in Marion County, which is not unexpected.

13www.indyindicators.iupui.edu
0
10
20
30
40
50
60
2004 2005 2006 2007 2008 2009
Avg
. Hou
rs S
erve
d in
a Y
ear
Indianapolis Indiana United States
Source: Volunteering in America, 2004-2009 Source: City of Indianapolis, Office of the Clerk, Elec�on Informa�on: 1991-2010.
Source: 1Indiana State Police (ARIES), as of March 1, 2011. Prepared by the IU Public Policy Ins�tute.;2U.S. Census Bureau, 2009-2010 American Community Survey;
3Indiana Department of Family and Social Services, Division of Family Resources, Marion County Monthly Management Report: February, 2012.
Volunteer Hours Per Resident(2004-2009)
Marion County Voter Turnout(1991-2010)
0%
10%
20%
30%
40%
50%
60%
70%
80%
1991-1994 1995-1998 1999-2002 2003-2006 2007-2010
General (Presiden�al) General (Non-Presiden�al)
Municipal
Suppor�ng Indicators of Quality of Life
INDICATOR TRENDLATEST DATA
MEASUREMENT
MOST RECENT
PREVIOUS
MEASUREMENT
Traffic crashes (2010)1 27,519 26,434
Driving alone to work (2010)2 83.0% 82.6%
Mean travel �me to work (2010)2 22.2 minutes
22.5minutes
Number of licensed child care centers (2012)3 123 113
Foreign born popula�on (2010)2 8.9% 7.6%
Data from the Corporation for National & CommunityService show that Indianapolis residents (the nearestproxy for Marion County as a whole) are giving their timefor the provision of the social good. In 2009, Indianapolisresidents averaged more than 41 hours per resident in vol-unteering, compared with only 34.2 nationally. For thefirst time in four years, Indianapolis surpassed the state inaverage hours spent volunteering. However, the hoursspent volunteering are down approximately 10 percentfrom the 2005 high.
A healthy community is one that is civically engaged andpromotes participation in the electoral process. Voterturnout is an important measure because it shows thewillingness of the population to collectively make choicesfor the well-being of the community. Marion County hasseen a decline in voter turnout for the general election(presidential and non-presidential) and the municipalelections. Down from a high of 70 percent in the early1990s, recent voter participation only exceeds 50 percentfor the general presidential elections.
Social and Physical Environment

14 www.indyindicators.iupui.edu
Food Deserts
Percent of Population in Marion County Food Desert Census Tracts Having Both Low Income and Low Access to Full Service Grocery Stores
0 2 4 6 81Miles
Percent of PopulationLess than 20%
20% - 40%
Greater than 40%
Created by: IU Public Policy Institute, 2012. Source: U.S. Department of Agriculture,Economic Research Service, 2011.
Access to fresh fruits and vegetables is important to maintaining a healthy diet and lifestyle. As the map below showsthere are several areas in Marion County that do not have full service grocery stores nearby. Food Deserts are defined aslow income census tracts where a substantial percentage of residents have low access to a supermarket or a large gro-cery store. A low income census tract has a poverty rate of at least 20 percent. People living more than 1 mile from afull service grocery store are defined as having low access.

15
Source:1Center for Disease Control and Preven�on (CDC). Behavioral Risk Factor Surveillance System Survey Data, 2008-2010;
2 United States Department of Health and Human Services (US DHHS), Centers of Disease Control and Preven�on (CDC), on CDC WONDER, 2007-2008. 3Indiana State Department of Health, Maternal and Child Health, 2006-2007; 4U.S. Census Bureau, 2009-2010 American Community Survey.
Healthy People 2020 Indicators
INDICATORHP 2020
GOAL
MARION
COUNTY
PREVIOUS DATA
MEASUREMENTSTATUS
Adults who are current smokers1 12.0%23.6% (2010)
26.2% (2009) Target Not Met
Adults engaging in binge drinking during past 30 days1 24.3%
15.5% (2010)
10.4% (2009) Target Met
Infant deaths (within one year)26.0 per
1,000 live births
8.2 per 1,000 live
births (2008)
9.1 per 1,000 live births
(2007)Target Not Met
Preterm births3 11.4% 9.4% (2007) 11.6% (2006) Target Met
Adults who receive a colorectal screening1 70.5%
71.2% (2010)
67.1% (2008) Target Met
Woman 40+ receiving mammograms1 81.1%72.5% (2010)
77.1% (2008) Target Not Met
Uninten�onal Injury Deaths2 36.0 per 100,000
36.2 per 100,000 (2008)
31.5 per 100,000 (2007)
Target Not Met
Homicides2 5.5 per 100,000
12.7 per 100,000 (2008)
13.0 per 100,000 (2007)
Target Not Met
Motor vehicle crash related deaths 212.4 per 100,000
12.8 per 100,000 (2008)
10.9 per 100,000 (2006)
Target Not Met
Reduce the diabetes death rate2 65.8 per 100,000
16.7 per 100,000 (2008)
21.7 per 100,000 (2007)
Target Met
Reduce overall cancer death rate2 160.6 per 100,000
203.5 per100,000 (2008)
202.8 per 1000,000 (2007)
Target Not Met
Reduce lung cancer death rate2 45.5 per 100,000
69.6 per 100,000
71.2 per 100,000 (2007)
Target Not Met
Reduce the breast cancer death rate (Females)2
20.6 per 100,000
26.6 per 100,000 (2008)
28.2 per 100,000 (2007)
Target Not Met
Healthy People was developed by the Center for Disease Control and Prevention (CDC) as a national initiative of bench-marks and objectives. Healthy People 1990 was the nation’s first set of health objectives. Since then, the report has con-tinued on a decennial basis with the latest version, Healthy People 2020, containing almost 600 objectives and 1,200measures aimed at improving health in the United States. Included are thirteen indicators for Marion County showingcurrent measures and recent trends.
www.indyindicators.iupui.edu

16
County Health Rankings (Marion County, IN)
Factors 2011 Rank 2010 Rank Indicator
Health outcomes 77 80
Health factors 89 87
Smoking 57 58
Diet & exercise 66 24
Alcohol use 19 31
Unsafe sex 92 92
Access to care 13 8
Quality of care 35 21
Educa�on 80 58
Employment 22 29
Income 82 87
Family & social support 90 92
Community safety 91 91
Air quality 92 92
Built environment 14 56
Source: County Health Rankings. 2010-2011 Indiana data.
County Health Rankings is the major focus of a collaborative research project developed by The Robert Wood JohnsonFoundation and the University of Wisconsin Population Health Institute. The Mobilizing Action Toward CommunityHealth (MATCH) project is a way to motivate and assist state and local health departments to “develop broad-based so-lutions with others in their community so all resident can be healthy.” The rankings measure health outcomes andhealth factors for counties in each of the 50 states.
In Indiana, Marion County ranks as high as #13 (Access to Care) and as low as #92 (Air Quality). Of the 15 factors meas-ured, Marion County’s ranking improved in seven of the measures while remaining unchanged in three. While thesemeasures do indicate some success in improving public health, they also highlight significant challenges. Still, theserankings provide a valuable benchmark for progress that can help focus attention to particular public health chal-lenges.
www.indyindicators.iupui.edu