Embed Size (px)
Citation preview
Workshops on End-to-End models and Mediterranean models
November 15-19, Barcelona
Istituto Nazionale di Oceanografia e di Geofisica Sperimentale – OGS(National Institute of Oceanography and Experimental Geophysics – OGS)Trieste, Italy
Simone Libralato
Marine trophodynamic models:From theoretical developments to tools for
supporting marine policy
2015 Euromarine General Assembly meeting 24-25 February 2015 Stazione Zoologica Anton Dohrn, Naples, Italy
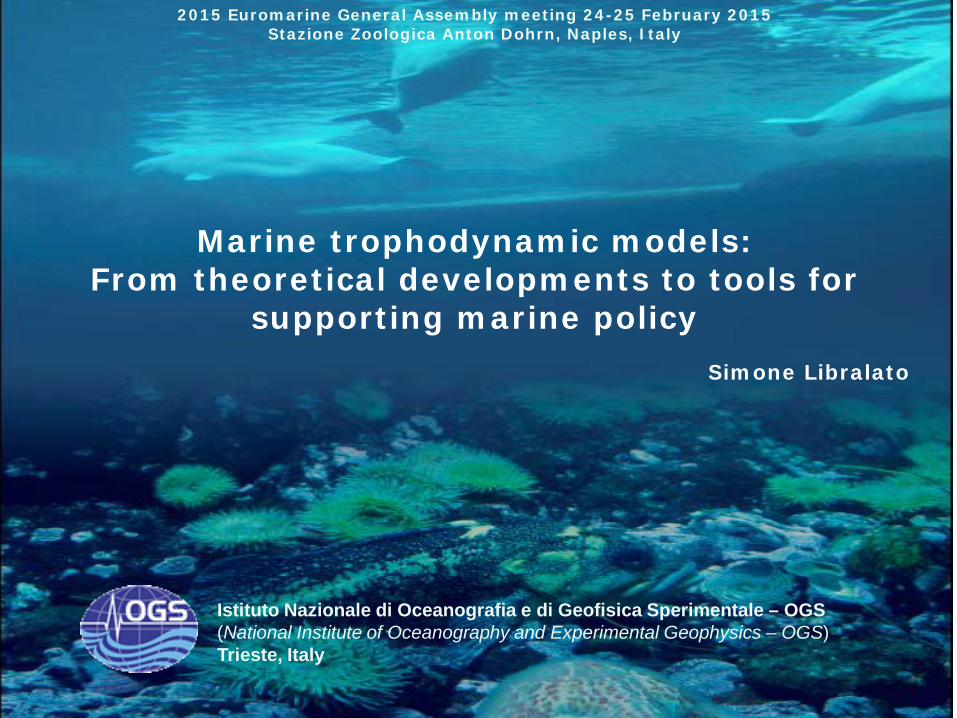
Marine ecosystem:complex, several drivers (goods & services)
Feedbacks between ecosystem components Interactions between stressors
Climatic changes
Fisheries and aquaculture
Pollutants Invasive/exoticspecies
Nutrient inputs
Protected areas
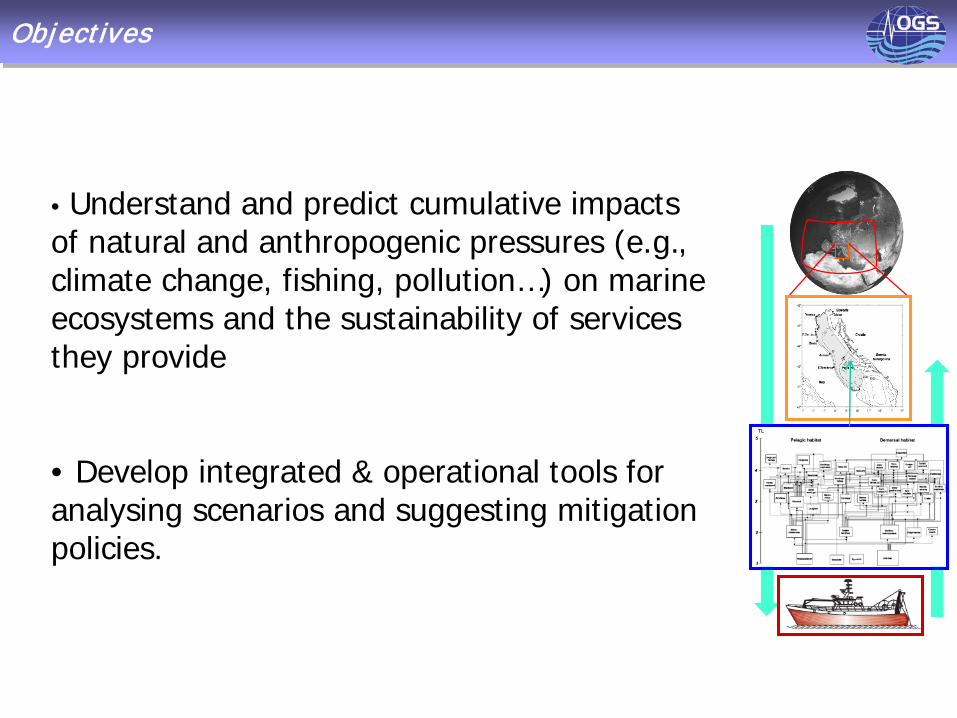
• Understand and predict cumulative impacts of natural and anthropogenic pressures (e.g., climate change, fishing, pollution…) on marine ecosystems and the sustainability of services they provide
• Develop integrated & operational tools for analysing scenarios and suggesting mitigation policies.
Objectives
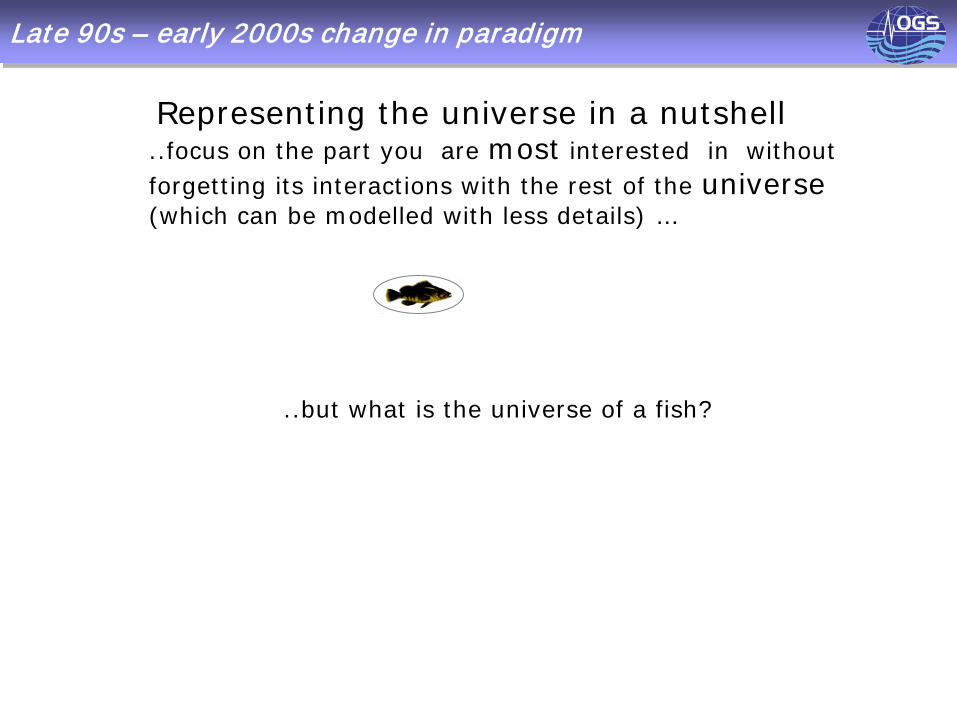
..focus on the part you are most interested in without forgetting its interactions with the rest of the universe(which can be modelled with less details) …
Representing the universe in a nutshell
..but what is the universe of a fish?
Late 90s – early 2000s change in paradigm
..focus on the part you are most interested in without forgetting its interactions with the rest of the universe(which can be modelled with less details) …
Representing the universe in a nutshell
..but what is the universe of a fish?
Late 90s – early 2000s change in paradigm
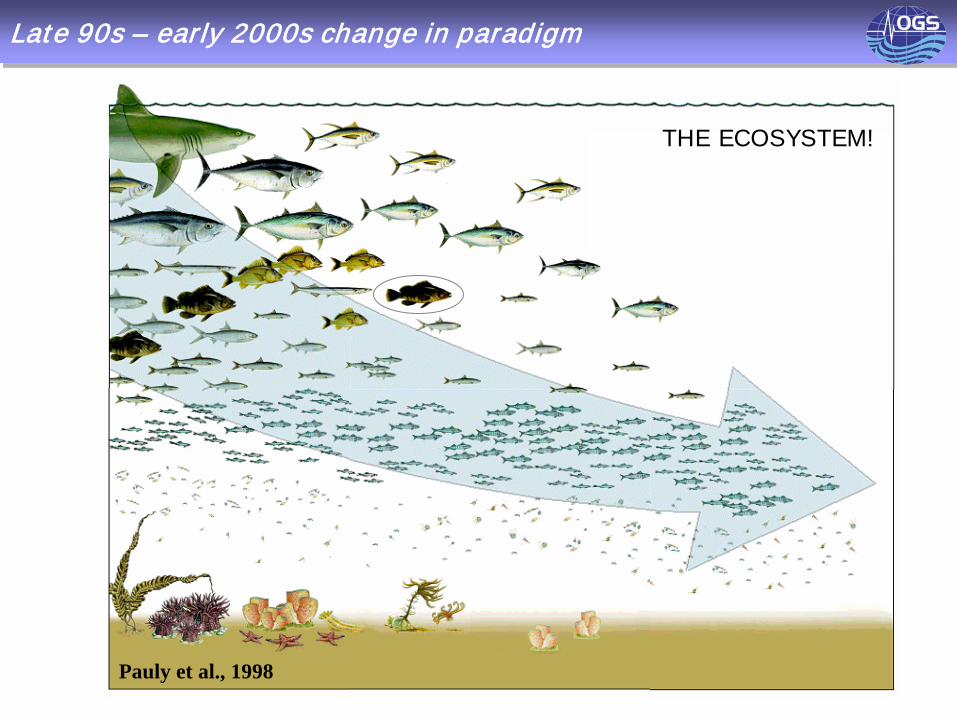
Pauly et al., 1998
THE ECOSYSTEM!
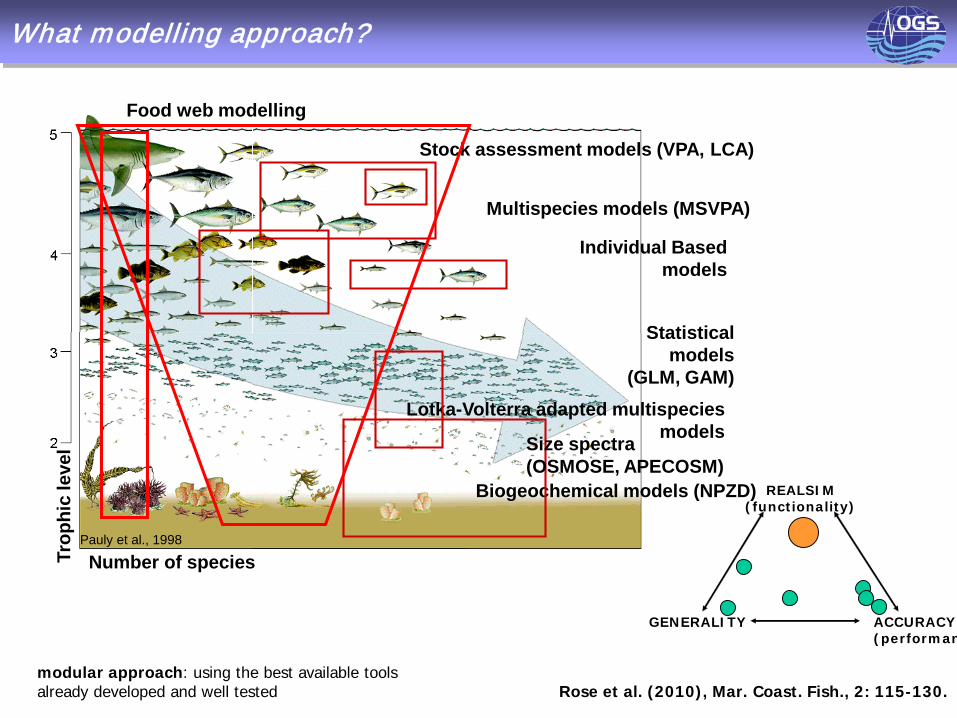
What modelling approach?Tr
ophi
c le
vel
Pauly et al., 1998
Number of species
Stock assessment models (VPA, LCA)
Multispecies models (MSVPA)
Individual Based models
Statistical models
(GLM, GAM)Lotka-Volterra adapted multispecies
models
Biogeochemical models (NPZD)
Food web modelling
Size spectra (OSMOSE, APECOSM)
GENERALITY ACCURACY(performan
REALSIM(functionality)
modular approach: using the best available tools already developed and well tested Rose et al. (2010), Mar. Coast. Fish., 2: 115-130.
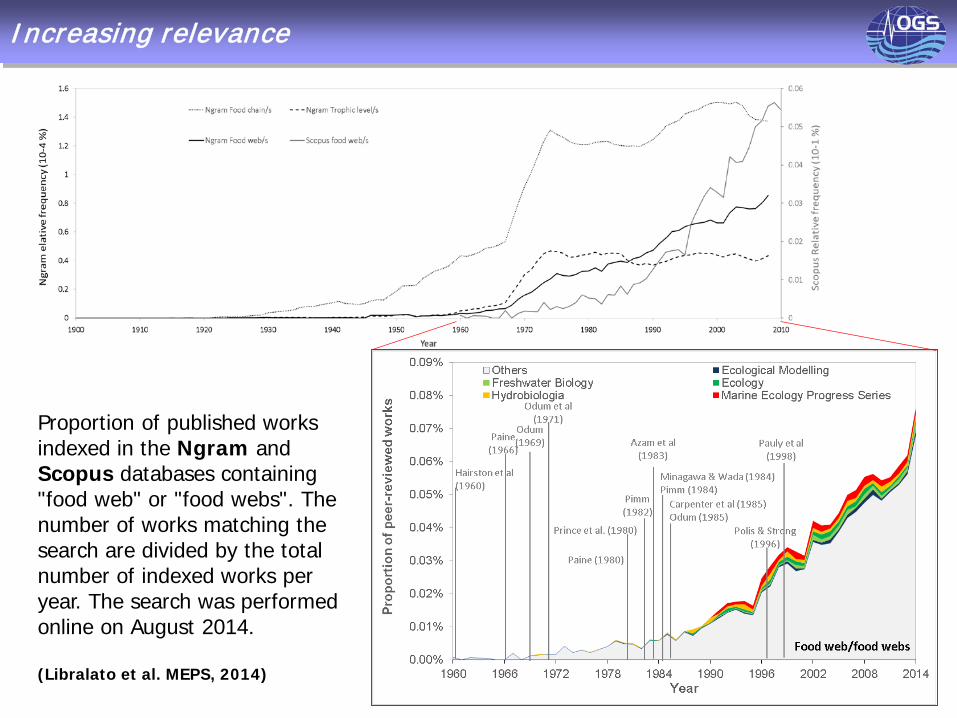
Increasing relevance
Proportion of published works indexed in the Ngram and Scopus databases containing "food web" or "food webs". The number of works matching the search are divided by the total number of indexed works per year. The search was performed online on August 2014.
(Libralato et al. MEPS, 2014)
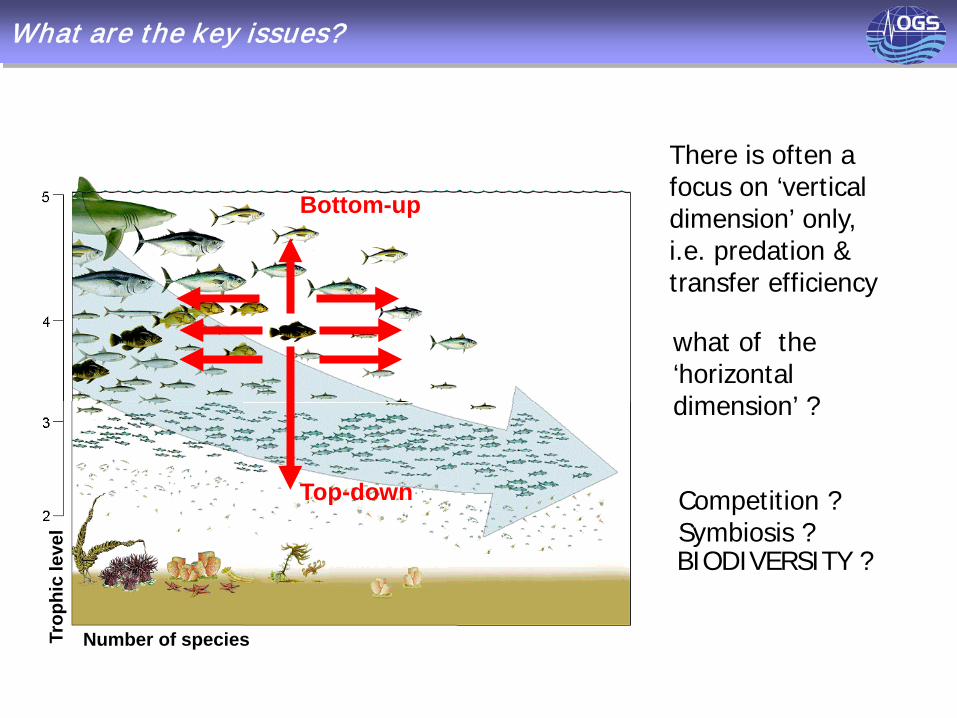
What are the key issues?Tr
ophi
c le
vel
Number of species
Bottom-up
Top-down
There is often a focus on ‘vertical dimension’ only,i.e. predation & transfer efficiency
what of the ‘horizontal dimension’ ?
Competition ? Symbiosis ? BIODIVERSITY ?
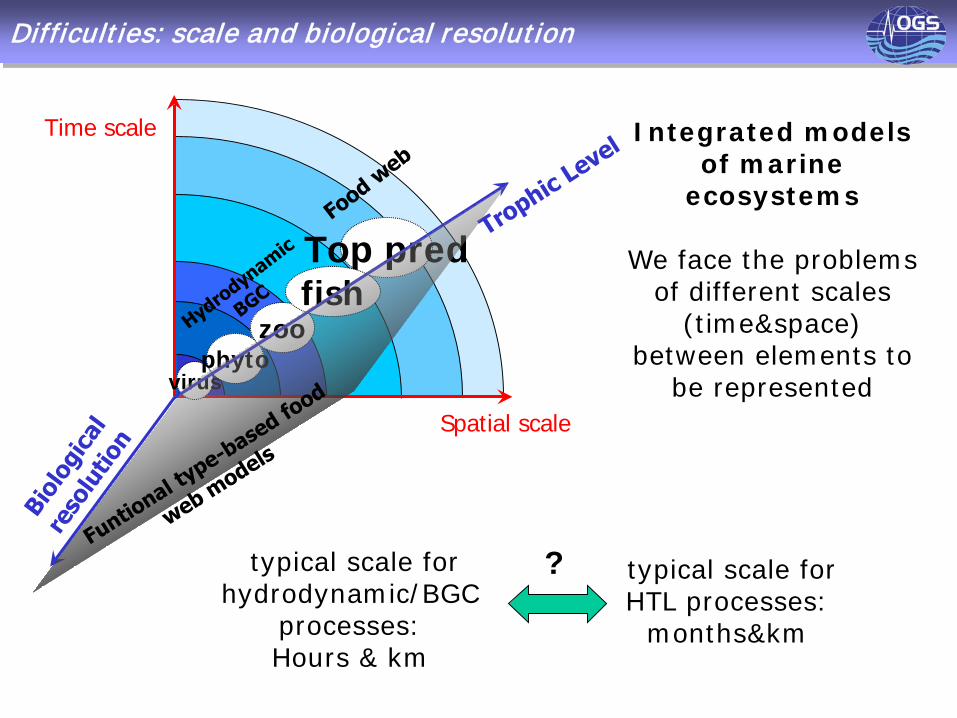
Difficulties: scale and biological resolution
Spatial scale
Time scale
virus
Top pred
phytozoo
fish
Integrated models of marine
ecosystems
We face the problems of different scales
(time&space) between elements to
be represented
typical scale for hydrodynamic/BGC
processes:Hours & km
typical scale for HTL processes:
months&km
?
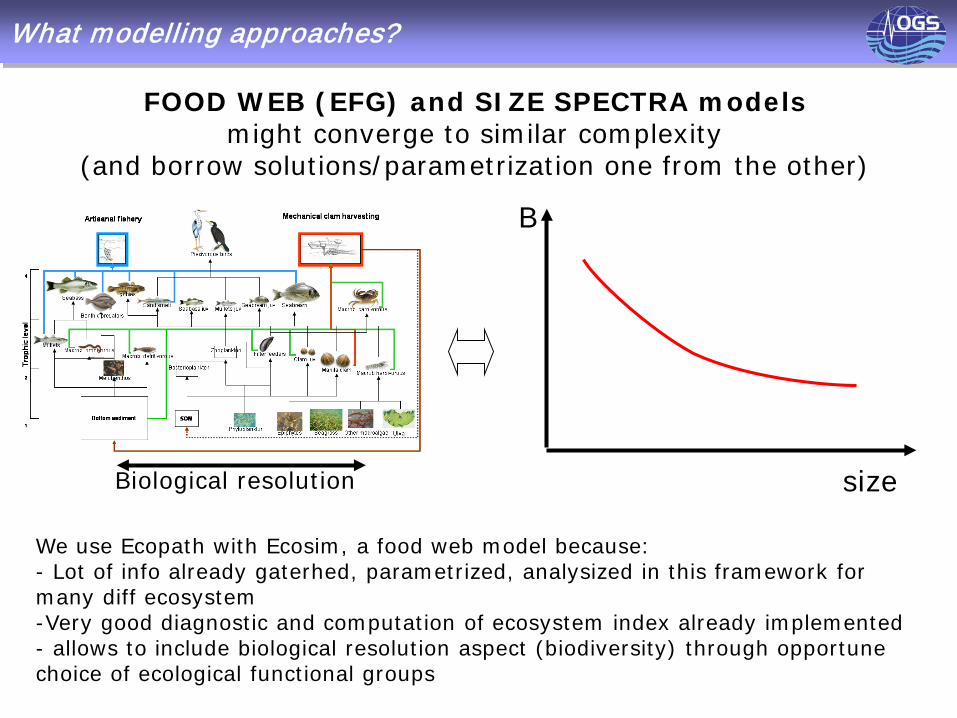
What modelling approaches?
FOOD WEB (EFG) and SIZE SPECTRA modelsmight converge to similar complexity
(and borrow solutions/parametrization one from the other)
size
B
We use Ecopath with Ecosim, a food web model because:- Lot of info already gaterhed, parametrized, analysized in this framework for many diff ecosystem-Very good diagnostic and computation of ecosystem index already implemented- allows to include biological resolution aspect (biodiversity) through opportune choice of ecological functional groups
Biological resolution
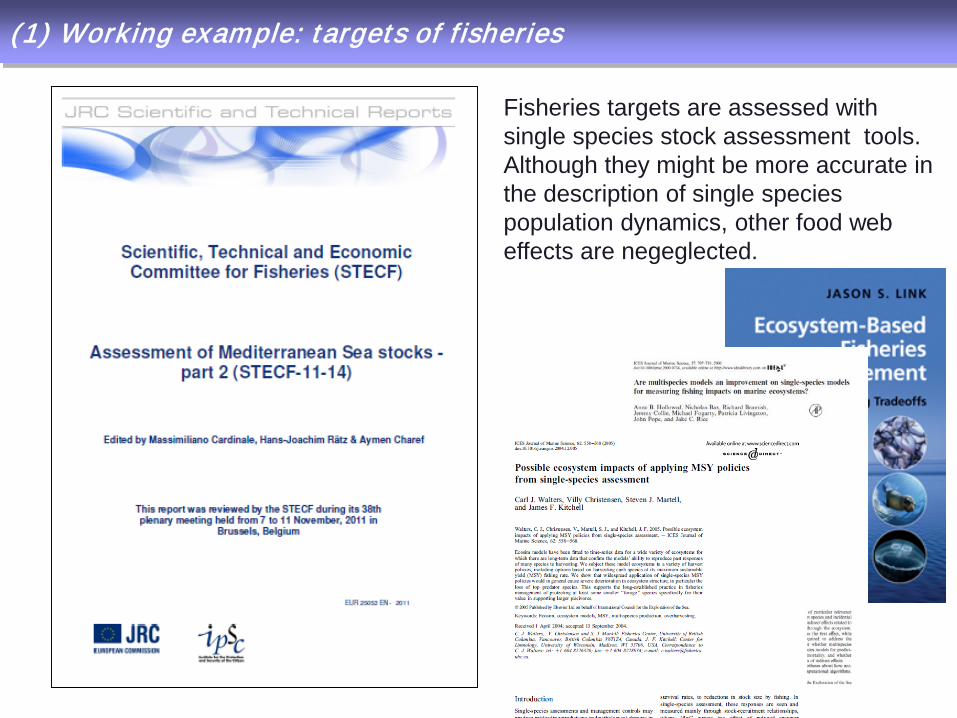
(1) Working example: targets of fisheries
Fisheries targets are assessed with single species stock assessment tools.Although they might be more accurate in the description of single species population dynamics, other food web effects are negeglected.
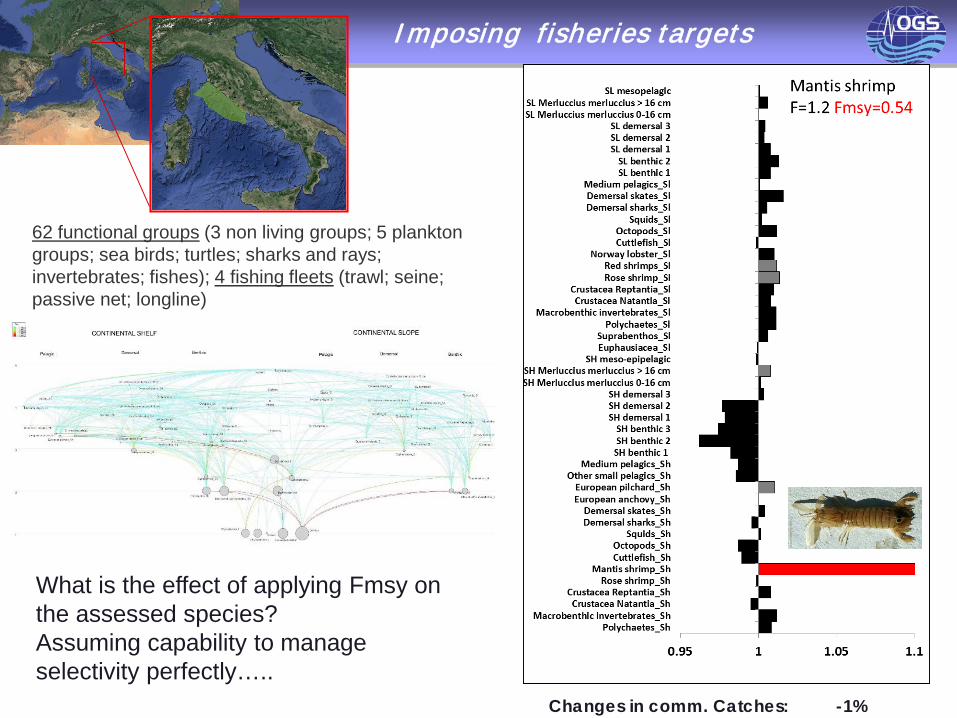
Imposing fisheries targetsTyrrheninan Sea
What is the effect of applying Fmsy on the assessed species? Assuming capability to manage selectivity perfectly…..
62 functional groups (3 non living groups; 5 plankton groups; sea birds; turtles; sharks and rays; invertebrates; fishes); 4 fishing fleets (trawl; seine; passive net; longline)
Changes in comm. Catches: -1%
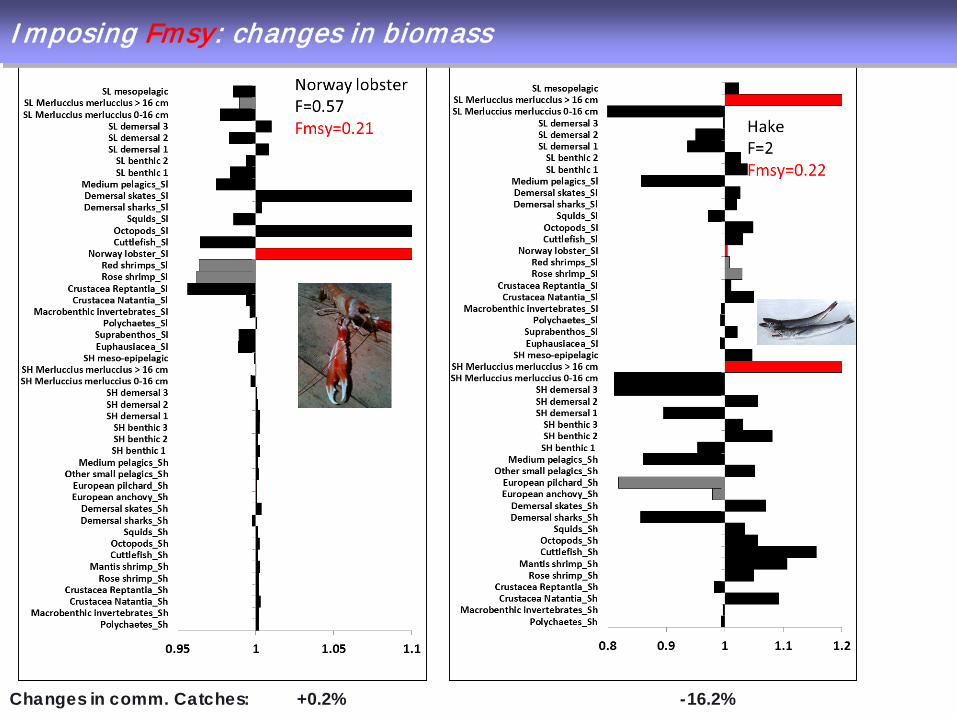
Imposing Fmsy: changes in biomass
Changes in comm. Catches: +0.2% -16.2%
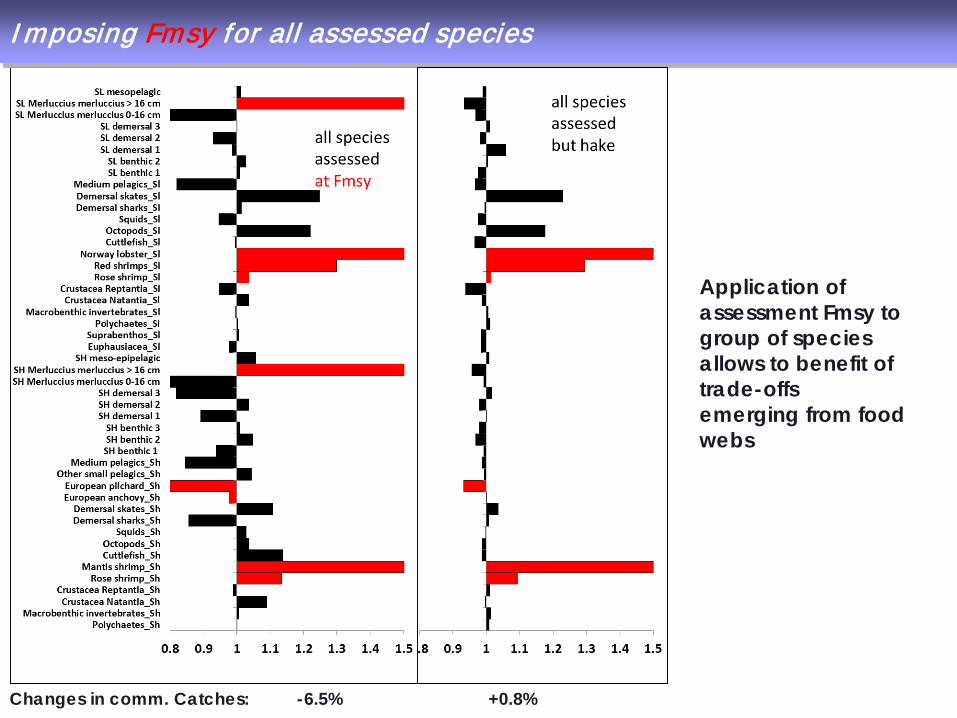
Imposing Fmsy for all assessed species
Changes in comm. Catches: -6.5% +0.8%
Application of assessment Fmsy to group of species allows to benefit of trade-offsemerging from food webs
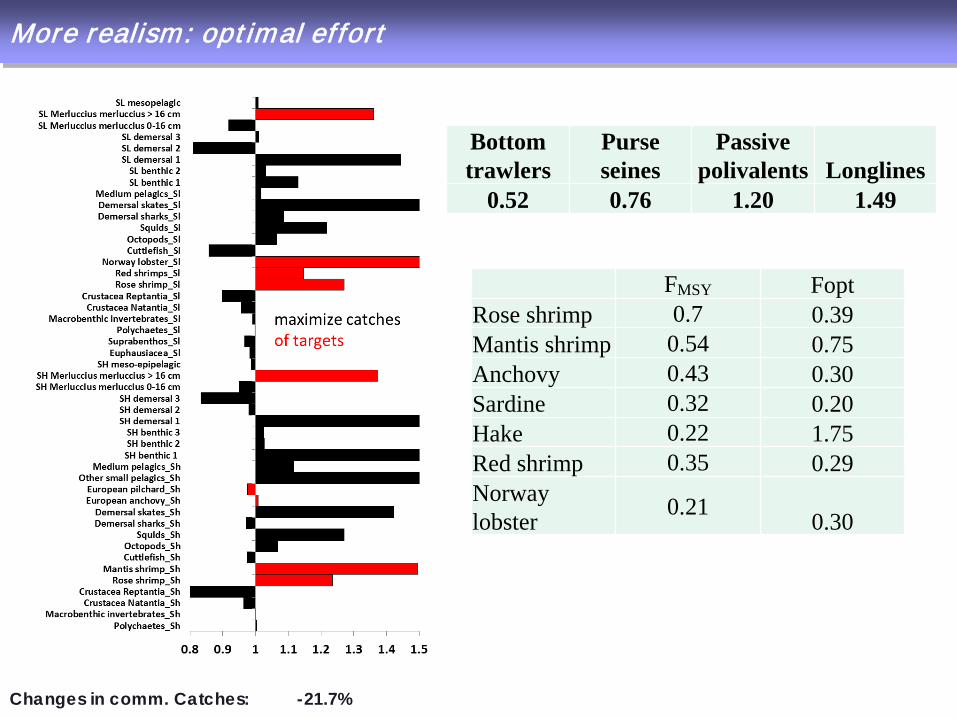
More realism: optimal effort
Changes in comm. Catches: -21.7%
Bottom trawlers
Purseseines
Passive polivalents Longlines
0.52 0.76 1.20 1.49
FMSY FoptRose shrimp 0.7 0.39Mantis shrimp 0.54 0.75Anchovy 0.43 0.30Sardine 0.32 0.20Hake 0.22 1.75Red shrimp 0.35 0.29Norway lobster 0.21 0.30
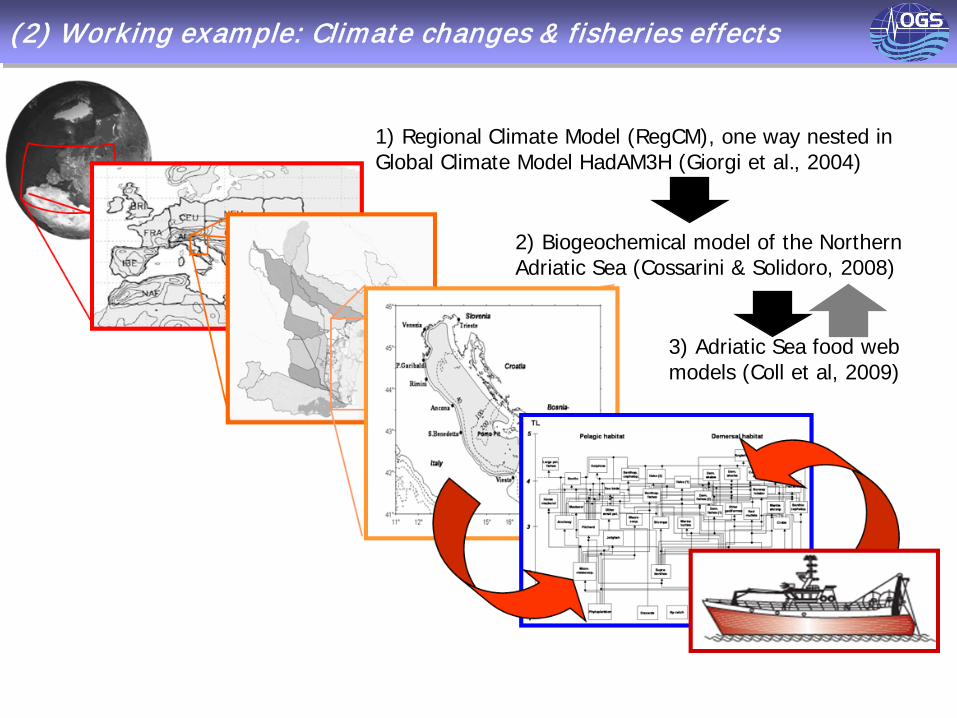
(2) Working example: Climate changes & fisheries effects
1) Regional Climate Model (RegCM), one way nested in Global Climate Model HadAM3H (Giorgi et al., 2004)
2) Biogeochemical model of the Northern Adriatic Sea (Cossarini & Solidoro, 2008)
3) Adriatic Sea food web models (Coll et al, 2009)
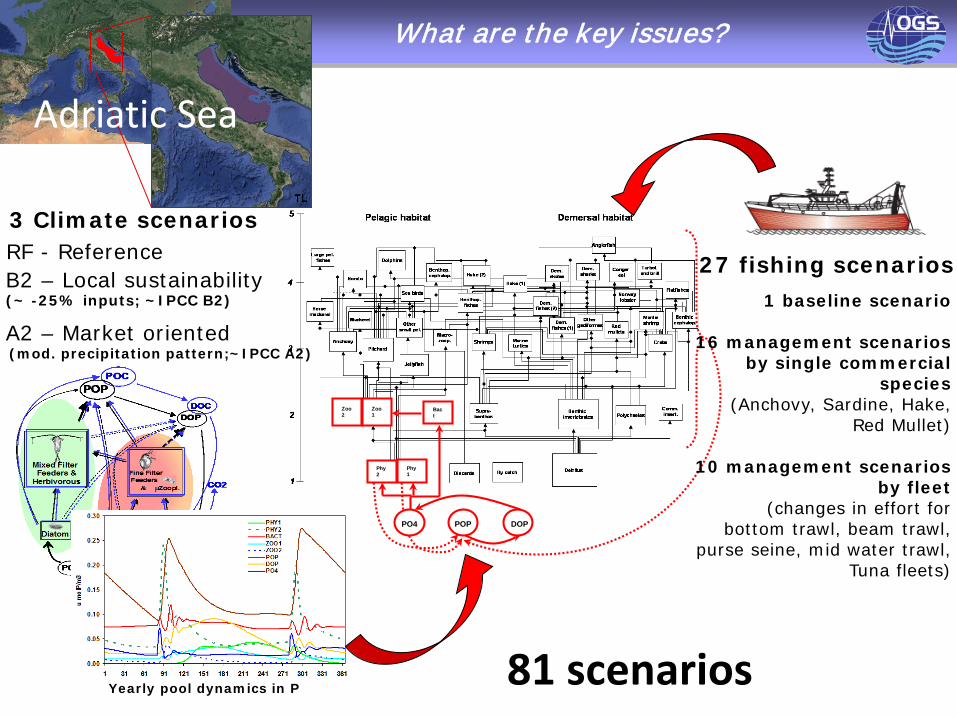
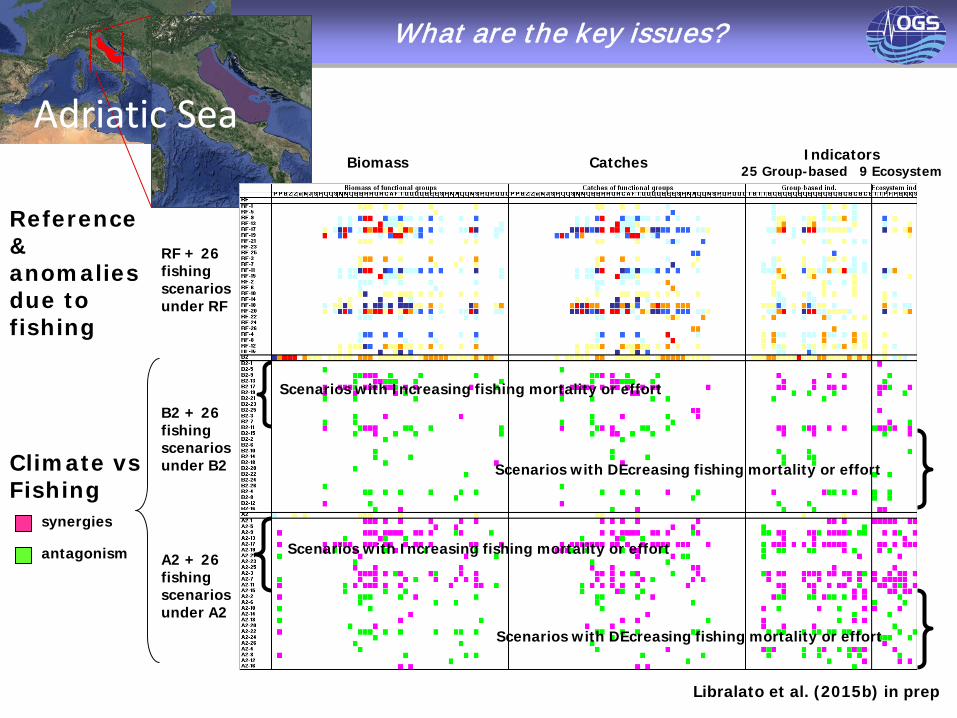
What are the key issues?
Adriatic Sea
Zoo1
POP DOP
Bact
Zoo2
Phy2
Phy1
PO4
Yearly pool dynamics in P
3 Climate scenarios
27 fishing scenarios1 baseline scenario
16 management scenarios by single commercial
species(Anchovy, Sardine, Hake,
Red Mullet)
10 management scenarios by fleet
(changes in effort for bottom trawl, beam trawl,
purse seine, mid water trawl, Tuna fleets)
81 scenarios
(~ -25% inputs; ~IPCC B2)
(mod. precipitation pattern;~IPCC A2)
RF - ReferenceB2 – Local sustainability
A2 – Market oriented
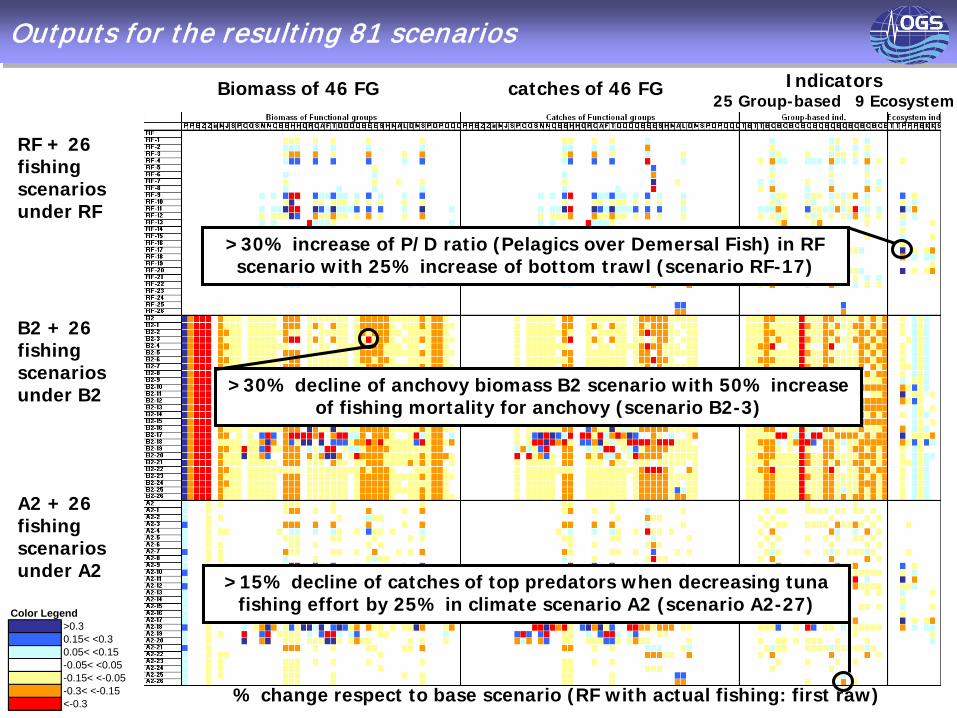
Outputs for the resulting 81 scenarios
RF + 26 fishing scenarios under RF
B2 + 26 fishing scenarios under B2
A2 + 26 fishing scenarios under A2
Biomass of 46 FG catches of 46 FG Indicators25 Group-based 9 Ecosystem
Color Legend>0.30.15< <0.30.05< <0.15-0.05< <0.05-0.15< <-0.05-0.3< <-0.15<-0.3 % change respect to base scenario (RF with actual fishing: first raw)
>30% increase of P/D ratio (Pelagics over Demersal Fish) in RF scenario with 25% increase of bottom trawl (scenario RF-17)
>30% decline of anchovy biomass B2 scenario with 50% increase of fishing mortality for anchovy (scenario B2-3)
>15% decline of catches of top predators when decreasing tuna fishing effort by 25% in climate scenario A2 (scenario A2-27)

Climate and fisheries effects: synergies and antagonisms
The value of model output obtained in different fishing (ONLY) scenarios Highlighted for all outputs:
Biomass of 46 FG
catches of 46 FGIndicators
25 Group-based 9 Ecosystem
RF baseline
Fishingscenario
Climatescenario
Fisheries &
Climatescenario
RF baseline
Fishingscenarios
Climatescenarios
Fisheries &
Climatescenarios
Mod
el o
utp
uts
Mod
el o
utp
uts
The value of the same model output obtained in different climate (ONLY) scenarios
The value of the same model output obtained in different fishing+climate scenarios
SYNERGISTIC EFFECTclimate + fishing > climate or fishing
ANTAGONISTIC EFFECTclimate + fishing < climate or fishing
What are the key issues?
Libralato et al. (2015b) in prep
Adriatic SeaBiomass Catches Indicators
25 Group-based 9 Ecosystem
RF + 26 fishing scenarios under RF
B2 + 26 fishing scenarios under B2
A2 + 26 fishing scenarios under A2
Reference & anomalies due to fishing
synergies
antagonism
Climate vs Fishing
Scenarios with Increasing fishing mortality or effort
Scenarios with DEcreasing fishing mortality or effort
Scenarios with Increasing fishing mortality or effort
Scenarios with DEcreasing fishing mortality or effort
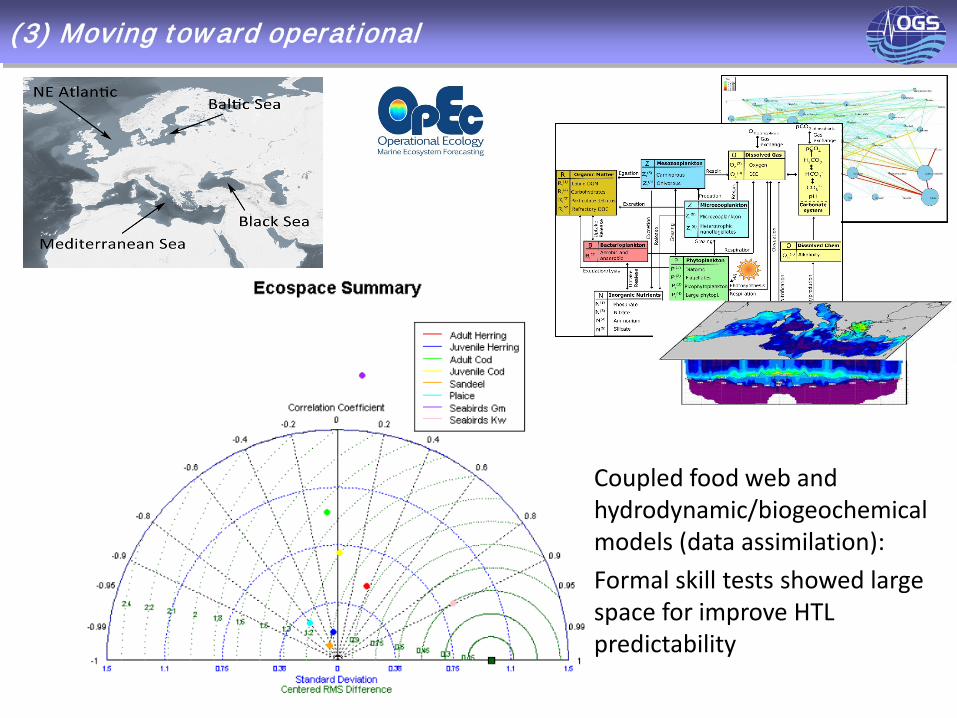
(3) Moving toward operational
Coupled food web and hydrodynamic/biogeochemicalmodels (data assimilation):Formal skill tests showed large space for improve HTL predictability
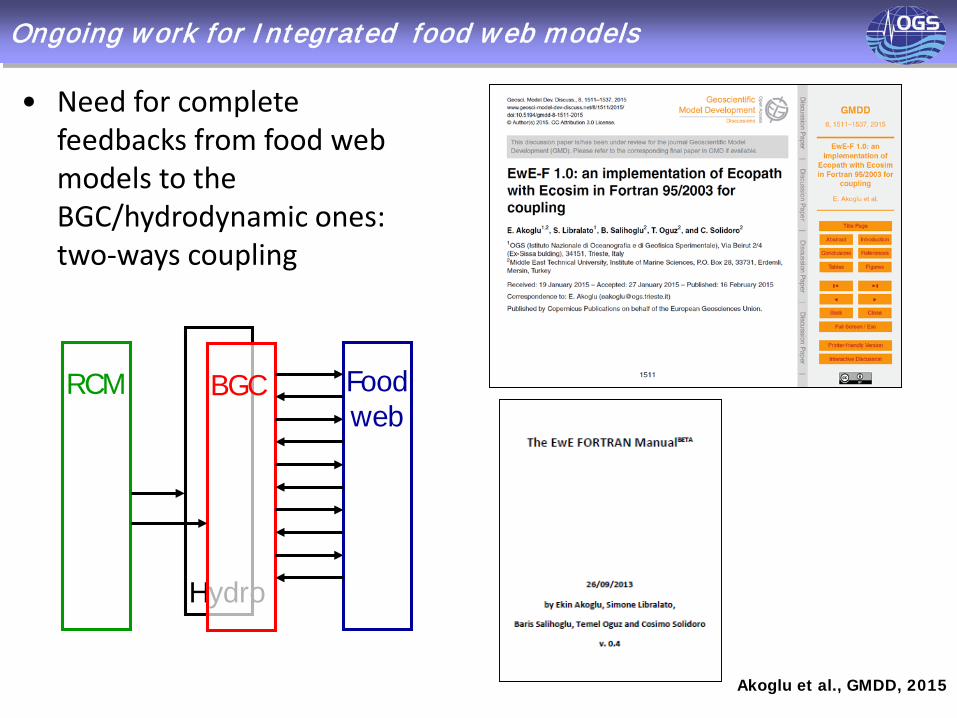
Ongoing work for Integrated food web models
Foodweb
Hydro
BGCRCM
• Need for complete feedbacks from food web models to the BGC/hydrodynamic ones: two-ways coupling
Akoglu et al., GMDD, 2015
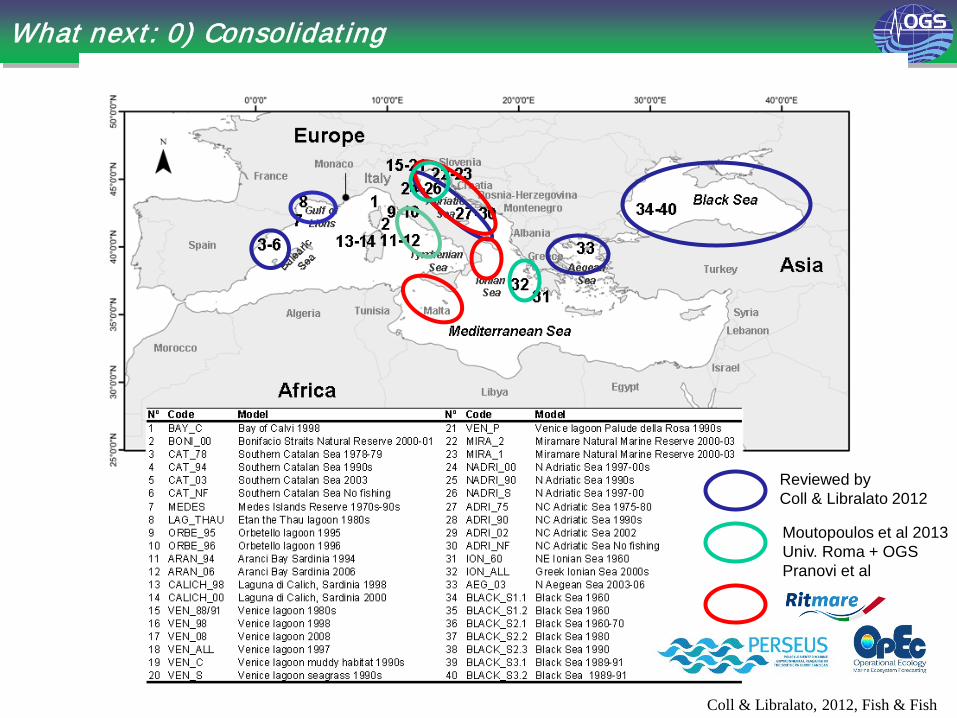
What next: 0) Consolidating
Coll & Libralato, 2012, Fish & Fish
Reviewed by Coll & Libralato 2012
Moutopoulos et al 2013Univ. Roma + OGSPranovi et al
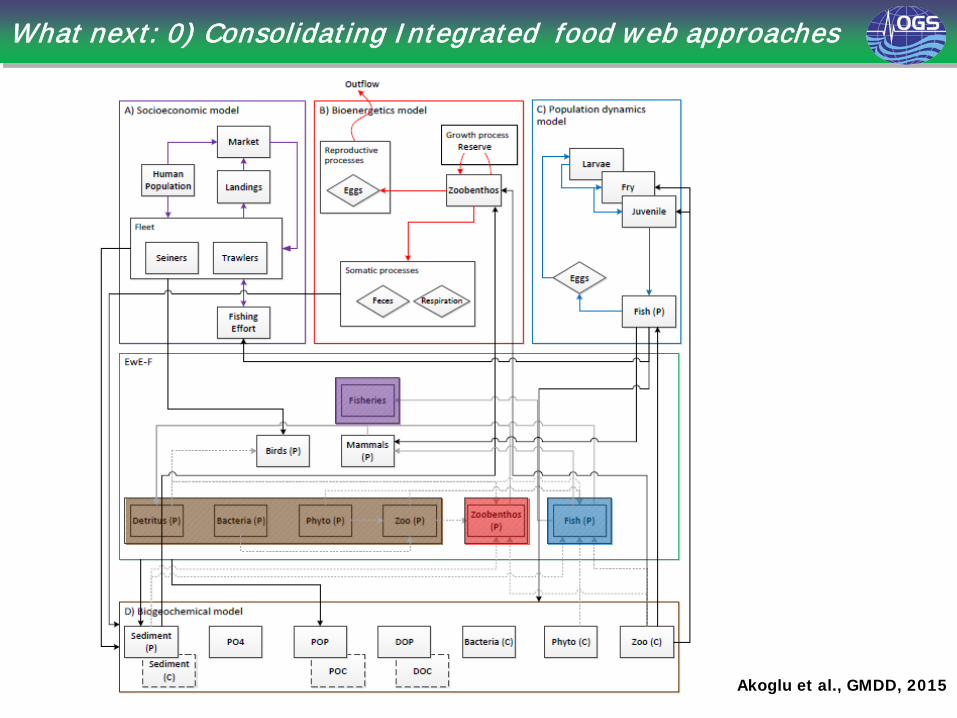
What next: 0) Consolidating Integrated food web approaches
Akoglu et al., GMDD, 2015
What next: 1) organizing ex isting data + new data
Data requirement is huge for food web modelling: need for continuingand increasing data collection (for increasing accuracy of our models)
- Mesocosm experiments to better define processes
- Need for better define parameters:
- continuing surveys (acoustic, trawl surveys)- better quantification of effort and catches- more information on keyspecies- more information on neglected groups- more information on less studied systems (deep systems, sediment models- more information on diet preferences (isotops, gut content..)
What next: 1) organizing ex isting data + new data
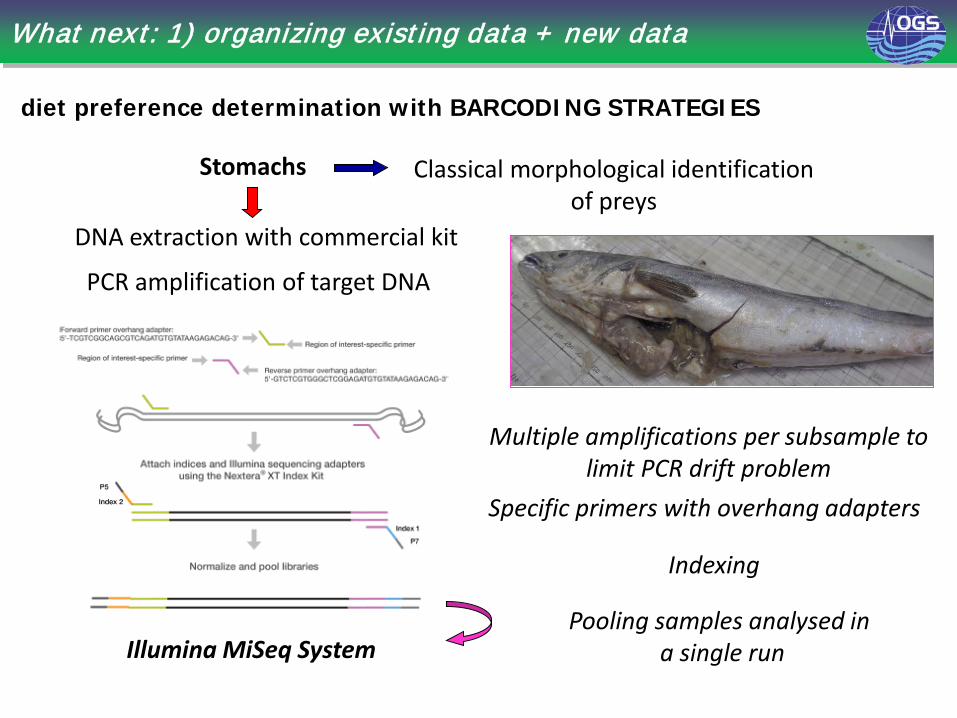
Stomachs Classical morphological identificationof preys
DNA extraction with commercial kit
PCR amplification of target DNA
Illumina MiSeq System
Specific primers with overhang adapters
Indexing
Pooling samples analysed in a single run
Multiple amplifications per subsample tolimit PCR drift problem
diet preference determination with BARCODING STRATEGIES
What next (2) incorporating adaptation, evolution, plasticity
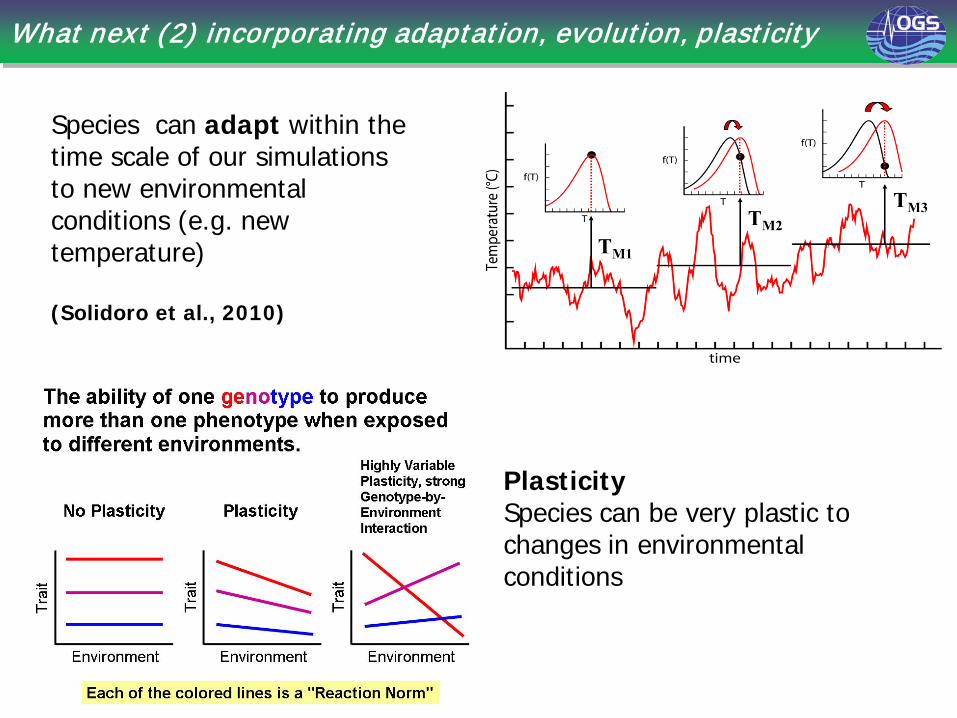
Species can adapt within the time scale of our simulations to new environmental conditions (e.g. new temperature)
(Solidoro et al., 2010)
PlasticitySpecies can be very plastic to changes in environmental conditions
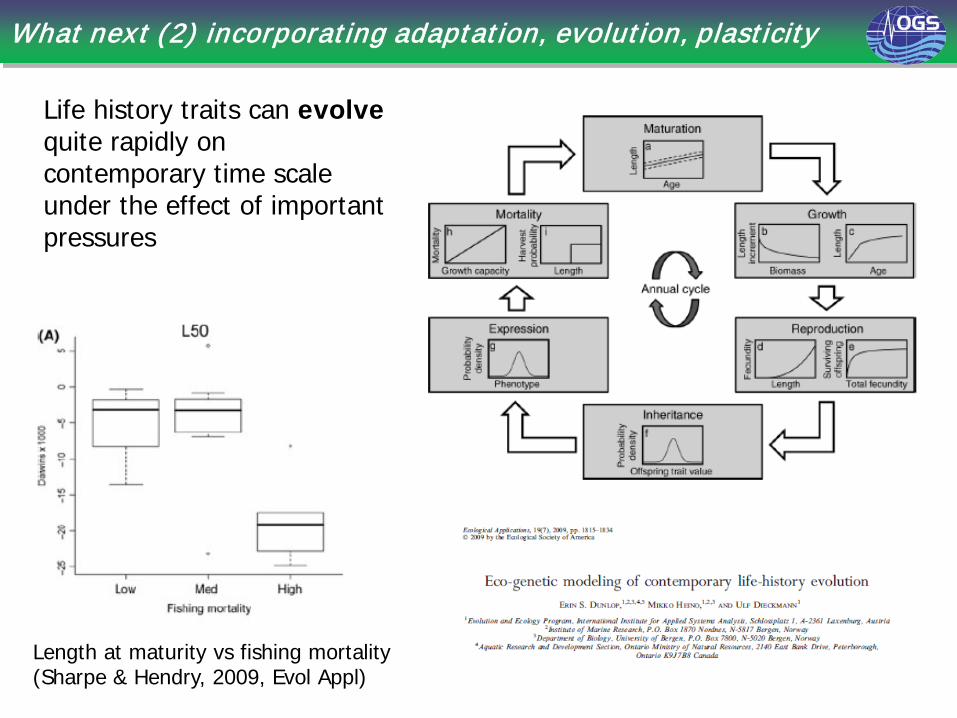
What next (2) incorporating adaptation, evolution, plasticity
Life history traits can evolvequite rapidly on contemporary time scale under the effect of important pressures
Length at maturity vs fishing mortality(Sharpe & Hendry, 2009, Evol Appl)
What next: 3) develop new models of food web
Likely, like in climate change many different models are used (see IPCC), also for marine system predictions (IPBES??) different models would be used to assess possible changes.
Use of different available model structures for making predictions: Atlantis(Fulton et al); Ecopath with Ecosim (Christensen et al); Osmose (Shin et al); MICE Medium Intermediate complexity models (Plagayi et al); Ecotroph(Gascuel et al),….
But also develop fresh new models. New conceptualization of food webs can help better using data, better representing plasticity, but also that might facilitate identification of reference levels (and indicators) ….
- Individual based food web models can be a pathway (VEW, Woods)
- Representations of food webs in terms of trophic levels
- …others….
Thank you!
Filippo Giorgi, ICTP (Trieste, ITALY)
Cosimo Solidoro, Ekin Akoglu, Gianpiero Cossarini, Paolo Lazzari, and the ECHO group, OGS (Trieste, ITALY)
Enrico Arneri, Alberto Santojanni, CNR-ISMAR (Ancona, ITALY)
Marta Coll, Isabel Palomera, Nixon Bahamon, ICM-CSIC (Barcelona, SPAIN)
Baris Salihoglu, Temel Oguz - METU (Mersin, TURKEY)
Acknow ledgments and credits


![Current Developments in Nuclear Density …arXiv:1009.0899v1 [nucl-th] 5 Sep 2010 Current Developments in Nuclear Density Functional Methods Jacek Dobaczewski Institute of Theoretical](https://img.pdfslide.us/doc/110x75/5e9779297b550830155ec947/current-developments-in-nuclear-density-arxiv10090899v1-nucl-th-5-sep-2010-current.jpg)