Embed Size (px)
Citation preview
NI-H D C V I I O P M I N 1 S Ih I H I /(MI H ' O R L I ) I79
/ Eul?ll'l(JplU.v /u/)cll~l.\ I . :~q ldUl /c ' . ~ f l ~ l ? i t l i . 15: 137-144. I((W)YMAN. G. L. h- GFSTHY. K. L. (1986): Diving behavior 0 1 South African fur seals. In Fitr .wul.\ niurc~rnol ~rrorrgws on liind uncl U I sra~ 142 152. Gentry. R. 1.. & Kooyman. G. 1.. (Eds). Princeton: Princeton llniversity Prc\s. RANI). R . W . (lY5Y): The cape fur seal / A ~ l ~ l l J l ~ l ~ p h l l ~ i ~ . \ p i~si l l i is I . Dist ri hut ion. a hunda ncc iind feeding hahits of the southwestern coast of the Cape Pro\ incc. Union of South Arrica. f t i w . v / . Rep.
Pretoria: The Government Printer.
Development of a fatted male phcnomenon in
Dip. Fi.\/i., Dt,p/. C'f>mit t / . & / t d . No. 34: 1-65,
S('HI'STI'RS1Ah. R. J. L Gt:N IRY. K. L . (1971): Manuscript submitted 4 April 1989
Marine mammals in zoos, aquaria and marine zoological parks in North America: 1990 census report
EDWARD D. ASPER', DEBORAH A. DUFFIELD', NORIE DIMEO-EDIGER' & DAREY SHELLJ ' Senior Vice- Prcsi~~ritlZool~,IFic.al Director. Seu World lnc., 7007 Se0 World Drive. Orlando. Floridu 32821-8097. Pro/i.s.ror. Dvpurtment of Riolog?,. Portlund Siuir Universit.r. Portland. Oregon 97201, .'Lug Protiuciions. Hunk.s. 0rc:qci.n 97/06 und JEDS A.cwciutc~.r. Yutnhill. Orexon 97148. USA
Thc first census of marine mammals on display in North America taken in 1076 (Cornell & Asper, 1078) was updated in 1979 (Cornell et ul., 1983). in 1983 (Asper rt d.. 1988) and most recently in 1990. All zoos. aquaria and marinc zoological parks in the IJnited States and Canada holding marine mammals have participated. Each institution was contacted by letter and telephone and all supplied data on ( 1 ) thc histories of the animals currently on display. (3) acquisitions, (3) breeding pro- grammes and births and (4) mortalities (Aspcr er ul.. 1988).
At the end of the 1990 census period. there were 102 zoological institutions maintaining marine mammals in North America. 87 in the United States and I5 in Canada. Sixty-nine of these were classified as zoos and 33 as marine zoological parks
or aquaria whosc principal purpose is to display marine mamqals. A n additional 18 private and research collections open to the public were a130 included. In the past scvcn years (census period 1983- 1990). three zoological institutions have stopped holding marirle mammals and I I have added marinc mammals to their inventories. Six private collections were established during this time.
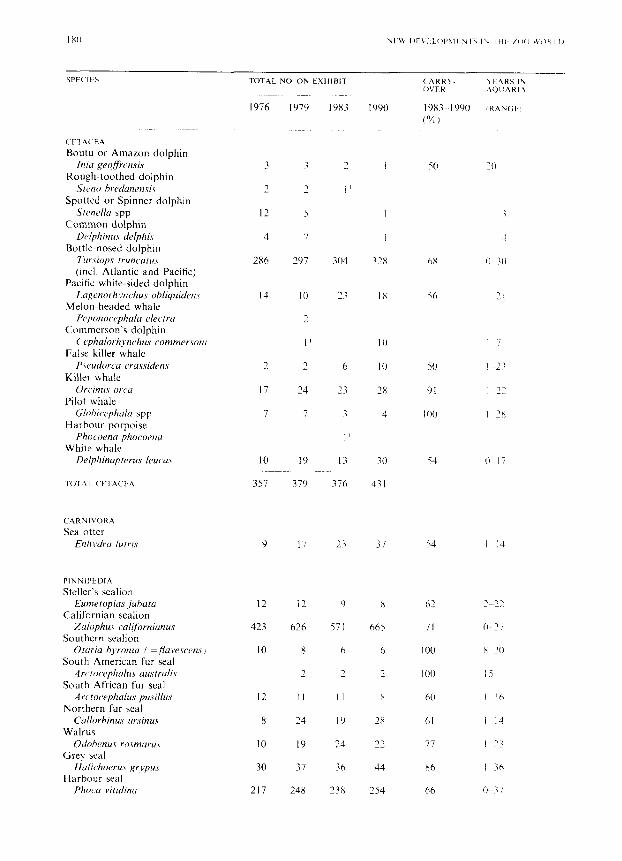
NlJMBERS A N D SPECIE ' DISTRIBUTION As of 31 March 199 R there were 1550 marine mammals on display, 431 ceta- ceans representing Len species. 1049 pinnipeds rcpresentisg 14 species. 33 manatecs and 37 sea alters (Table I ) . The increase in total n u m h r from 1343 in the 1983 census. was largely due to an
IOTAL N O O h LXHlRlT
~
1976
c r.1 A(XA
Boutu or Amazon dolphin
Rough-toothed dolphin
Spotted or Spinner dolphin
Common dolphin Delphirius c1dphi.c
Bottle-nosed dolphin Tur.siup.s rruncciru.c (incl. Atlantic and Pacific)
Lu,zynorhjwhus ohliquidens
Peponoccphulu cdcc'tru
C'cJphulorhFnchus c'ommrrsoni
P.seudorcu crussidei1.c
0rc.inu.s orc'ti
Glohicc~phalu spp
Phocoenu phococwii
Delphinuprerus lc~uc.u.s
lriiu Rroljrtwsi.s
Sirno hrcduncn.si.s
Strt1cllu spp
Pacific white-sided dolphin
Melon-headed whale
Commerson's dolphin
False killer whale
Killer whale
Pilot whale
Harbour porpoise
White whale
CAR?rlVOKA
Sea otter Enh,vdru 1iirri.v
P l N h l P t U l R
Steller's sealion Eumetopius juharu
Californian sealion Zu1ophu.r californiunus
Southern sealion Oturia h.rroniu ( =.fluvescens J
South American fur seal A rctocephulus uu.struli.s
South African fur seal Arrtoc~rphalu.s pusillus
Northern fur seal Callorhinus irrsinus
Walru? 0rlohenu.c ro.smuru.c
Grey seal Hulichorrus Rrypu.s
€larbour seal P h w u vitulinti
3
7
I2
4
286
14
2
17
7
10
357
9
12
423
10
12
8
10
30
217
I979
1
1 -
5
7
297
10
2
1 '
7 -
24
7
19
379 ~
17
12
626
8
7 -
I I
24
19
37
248
~~
1983
1
I '
304
2 1
6
27
I '
13
376
23
9
57 I
6
1 - I I
19
24
36
238
I990
I
I
7 2 X
IS
I 0
I0
28
4
1 0
41 1
17
X
665
h
1 - x
2X
71 _ _ 44
254
NEW DEVELOPMENTS IN THE ZOO WORLD 181
SPECIES
Baikal seal Phoca sihirica
Ringed seal Phoca hispida
Harp seal Phoca groenlandica
Hooded seal Cystophora cristata
Monk seal Monachus schauinslandi
Leopard seal Hydrurga leptonyx
Northern elephant seal Mirounga angustiros fris
TOTAL PINNIPEDIA
SIRENIA Amazonian manatee
Trichechus inunguis West Indian manatee
Trichechus manatus
TOTAL NO ON EXHIBIT ~ ~~
1976
2
1
32
757
2
10
TOTAL SIRENIA TOTAL MARINE MAMMALS
12 1135
1979
1019
2
1 1
13 1428
1983 1990
1
5 3
1 4
1 3
I ’ I ’
924 1049
1
19 33
20 33 1343 1550
CARRY- YEARS IN OVER AQUARIA
1983-1990 (RANGE)
(%I
6
40 4-10
100 2-1
100 4 4
5
15 2 4 2
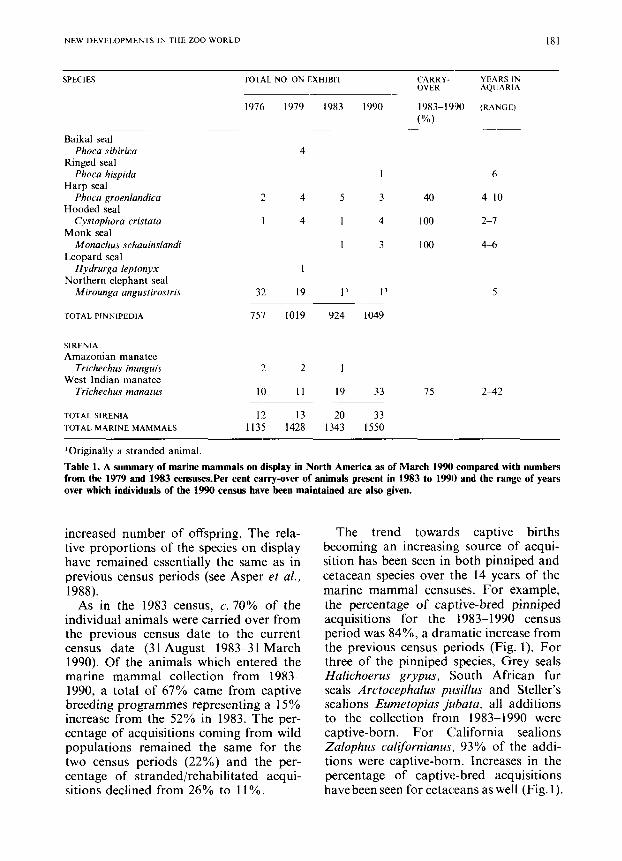
‘Originally a stranded animal. Table 1. A summary of marine mammals on display in North America as of March 1990 compared with numbers from the 1979 and 1983 censuses.Per cent carry-over of animals present in 1983 to 1990 and the range of years over which individuals of the 1990 census have been maintained are also given.
increased number of offspring. The rela- tive proportions of the species on display have remained essentially the same as in previous census periods (see Asper et al., 1988).
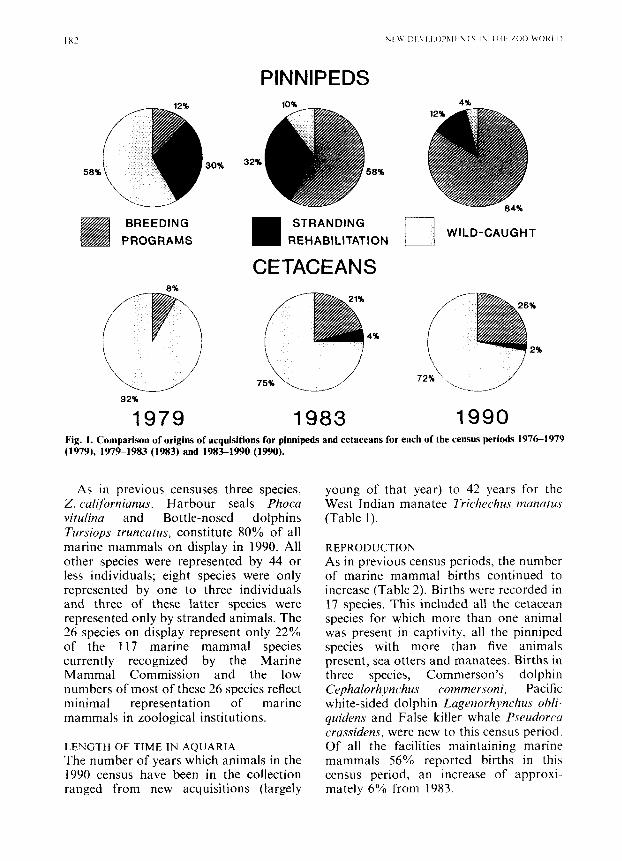
As in the 1983 census, c . 70% of the individual animals were carried over from the previous census date to the current census date (31 August 1983-31 March 1990). Of the animals which entered the marine mammal collection from 1983- 1990, a total of 67% came from captive breeding programmes representing a 15% increase from the 52% in 1983. The per- centage of acquisitions coming from wild populations remained the same for the two census periods (22%) and the per- centage of strandedlrehabilitated acqui- sitions declined from 26% to 11 YO.
The trend towards captive births becoming an increasing source of acqui- sition has been seen in both pinniped and cetacean species over the 14 years of the marine mammal censuses. For example, the percentage of captive-bred pinniped acquisitions for the 1983-1990 census period was 84%, a drainatic increase from the previous census periods (Fig. I). For three of the pinniped species, Grey seals Halichoerus grypus, South African fur seals Arctocephalus ptrsillus and Steller’s sealions Eumetopius jzibutu, all additions to the collection from 1983-1990 were captive-born. For California sealions Zalophus californianus, 93% of the addi- tions were captive-born. Increases in the percentage of captive-bred acquisitions havebeen seen for cetaceans as well (Fig. 1).
PlNNlPEDS
30% 58%
BREEDING PROGRAMS
8%
92%
1979
STRANDING REHAB I L I TAT I ON
CETACEANS
75% u 1983
4%
WILD-CAUGHT
1990 Fig. 1. Comparison of origins of acquisitions for pinnipeds and cetaceans for each of the census periods 19761979 (1979). 1979-1983 (1983) and 198S1990 (1990).
As in previous censuses three species, Z. californianus, Harbour seals Phoca vitulina and Bottle-nosed dolphins Tursiops truncatus, constitute 80% of all marine mammals on display in 1990. All other species were represented by 44 or less individuals; eight species were only represented by one to three individuals and three of these latter species were represented only by stranded animals. The 26 species on display represent only 22% of the 117 marine mammal species currently recognized by the Marine Mammal Commission and the low numbers of most of these 26 species reflect minimal representation of marine mammals in zoological institutions.
LENGTH OF TIME IN AQUARIA The number of years which animals in the 1990 census have been in the collection ranged from new acquisitions (largely
young of that year) to 42 years for the West Indian manatee Trichcchus nianatus (Table 1 ) .
REPRODUCTION As in previous census periods, the number of marine mammal births continued to increase (Table 2). Births were recorded in 17 species. This included all the cetacean species for which more than one animal was present in captivity, all the pinniped species with more than five animals present, sea otters and manatees. Births in three species, Commerson’s dolphin Cephalorhynchus commersoni, Pacific white-sided dolphin Lagenorhynchus ohli- quidens and False killer whale Pseudorcu crassidens, were new to this census period. Of all the facilities maintaining marine mammals 56% reported births in this census period, an increase of approxi- mately 6% from 1983.
183 NEW DEVELOPMENTS IN THE ZOO WORLD
~~
SPECIES 1976-1979 1979-1983 1983-1 990 TOTAL NO. NO. NO. 19761990 (no./year) (no./year) (no ./year)
CETACEA Bottle-nosed dolphin
Tursiops truncatus Pacific white-sided dolphin
Lagenorhynchus ohliquidens Commerson’s dolphin
Cephalorhynchus commersoni False killer whale
Pseudorca crassidens Killer whale
Orcinus orca Pilot whale
Globicephalu spp White whale
Delphinapterus leucas CARNIVORA Sea otter
Enhydra Iufris PlNNlPEDlA Steller’s sealion
Eumetopias jubuta Californian sealion
Zalophus californianus Southern sealion
Otaria byronia ( =Javescens) Fur seals
Arctocephalus spp Northern fur seal
Callorhinus ursinus Walrus
Odobenus rosmurus Grey seal
Halichoerus grypus Common harbour seal
Phoca vitulina SlRENlA West Indian manatee
Trichechus manatus
57(14) 204
4
7
1
16
2
4
37
14
884
12
20
25
9
80
267
13
TOTAL BIRTHS 234(78)3 470( 1 1 8)4 899( 138) 1599’
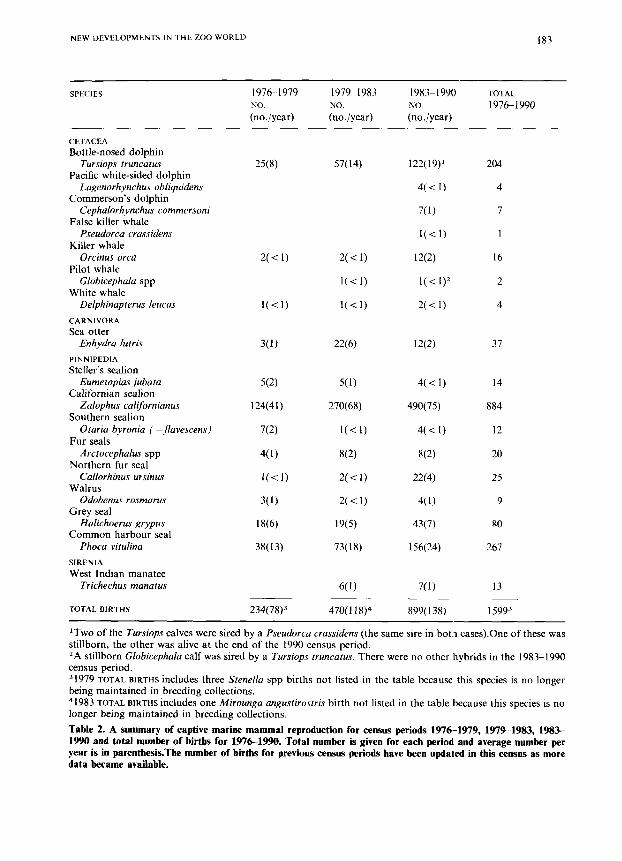
‘Two of the Tursiops calves were sired by a Pseudorca crassidens (the same sire in bot 1 cases).One of these was stillborn, the other was alive at the end of the 1990 census period. ZA stillborn Globicephalu calf was sired by a Tursiops truncatus. There were no other hybrids in the 1983-1990 census period. 31979 TOTAL BIRTHS includes three Sfenellu spp births not listed in the table because this species is no longer being maintained in breeding collections. 41983 TOTAL BIRTHS includes one Mirounga angustirostris birth not listed in the table because this species is no longer being maintained in breeding collections. Table 2. A summary of captive marine mammal reproduction for census periods 1976-1979, 197S1983, 1983- 1990 and total number of births for 1976-1990. Total number i s given for each period and average number per year i s in parenthesis-The number of births for previous census periods have been updated in this census as more data became available.
I s-l
100
80
60
40
20
0 I
ZalophuJ
I I / ,l I
1979 1983 1990 1979 1983 1990 1979 1983 1990
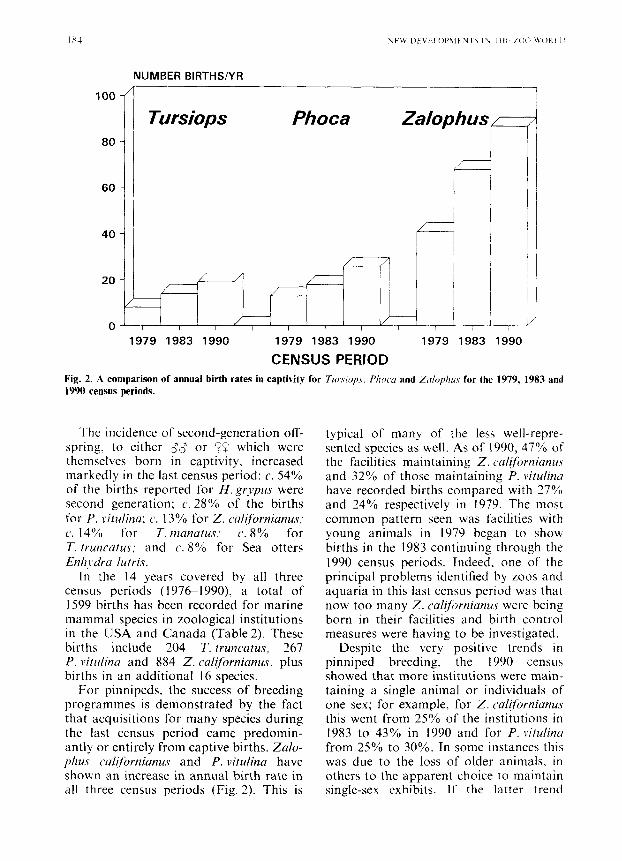
CENSUS PERIOD Fig. 2. A comparison of annual birth rates in captivity for Twc.rops, Pl7octr and Ztr/ophr\ for the 1979, 1983 and 1990 census periods.
The incidence of second-generation off- spring, to either 33 or 99 which were themselves born in captivity, increased markedly in the last census period: c. 54% of the births reported for H.grypus were second generation; c. 28% of the births for P . vitulina; c'. 13% for Z. californianus; c. 14% for T. manafus: c'. 8% for T. truncufus; and c. 8% for Sea otters Enfijdru lutris.
In the 14 years covered by all three census periods (1976-1990), a total of 1599 births has been recorded for marine mammal species in zoological institutions in the USA and Canada (Table2). These births include 204 T. truncatus, 267 P. vitulina and 884 Z. californianus, plus births in an additional 16 species.
For pinnipeds, the success of breeding programmes is demonstrated by the fact that acquisitions for many species during the last census period came predomin- antly or entirely from captive births. Zalo- phus cu1ifornianu.r and P. vitulina have shown an increase in annual birth rate in all three census periods (Fig. 2). This is
typical of many of the less well-repre- sented species as well. As of 1990, 47% of the facilities maintaining Z. californianus and 32% of those maintaining P. vitulinu have recorded births compared with 27%) and 24% respectively in 1979. The most common pattern seen was facilities with young animals in 1979 began to show births in the 1983 continuing through the 1990 census periods. Indeed, one of the principal problems identified by zoos and aquaria in this last census period was that now too many Z. calijbrnianus were being born in their facilities and birth control measures were having to be investigated.
Despite the very positive trends in pinniped breeding, the I990 census showed that more institutions were main- taining a single animal or individuals of one sex; for example, for Z. californianus this went from 25% of the institutions in 1983 to 43% in 1990 and for P. vitulintr from 25% to 30%. In some instances this was due to the loss of older animals, in others to the apparent choice to maintain single-sex exhibits. If the latter trend
NEW DEVELOPMENTS I N THE ZOO WORLD 185
continues it could be expected to have a negative effect on future acquisitions of these species from captive births.
For cetaceans, breeding potential has been well established for T. truncatus with increases in the numbers of births seen in all census periods (Fig. 2). However, while there was an increase in the percentage of facilities holding T. truncatus which recorded births from 1979 to 1983 (21- 38%), there was no further increase in numbers of facilities recording births from 1983 to 1990. Furthermore, the percent- age of facilities with one animal or single- sex holdings went from 14% in 1979 and 16% in 1983 to 34% in 1990. Although a number of new colonies with breeding potential were established in the 1990 census period, these predominantly contain young animals. Therefore, it will probably be some time before these new colonies will be productive breeding groups.
Births in six other cetacean species, including three new species, were seen in the 1990 census period (Table 2). Notably, there was successful introduction and breeding of C. commersoni in the 1990 census period (Joseph et al., 1987; Cornell et al., 1988). This suggests that it is possible to constitute breeding colonies of cetaceans which can become reproduct- ively active in a short time period. The immediate success of this breeding colony is thought to be due to the fact that a number of animals of varying ages were simultaneously introduced to captivity and remained together in an undisturbed social group.
Births were recorded for manatees and Sea otters in the 1990 census period (Table2). Of the four facilities main- taining manatees, three had births. The annual birth rate was similar to that seen in the 1983 census. Births per year in Sea otters, however, were one-third of their 1983 number. Only six institutions were exhibiting Sea otters: three of these had only one animal, one sex or a neutered 6; one had a young 6 and 9; one had a breeding 6 and an old $2; and one institu-
tion alone had an active breeding colony. Several Alaskan Sea of ters were added to collections following the oil spill at Valdez, Alaska, in May 1989 and with the increased breeding potmtial, the numbers of births in these colonies could be expected to rise again in the future.
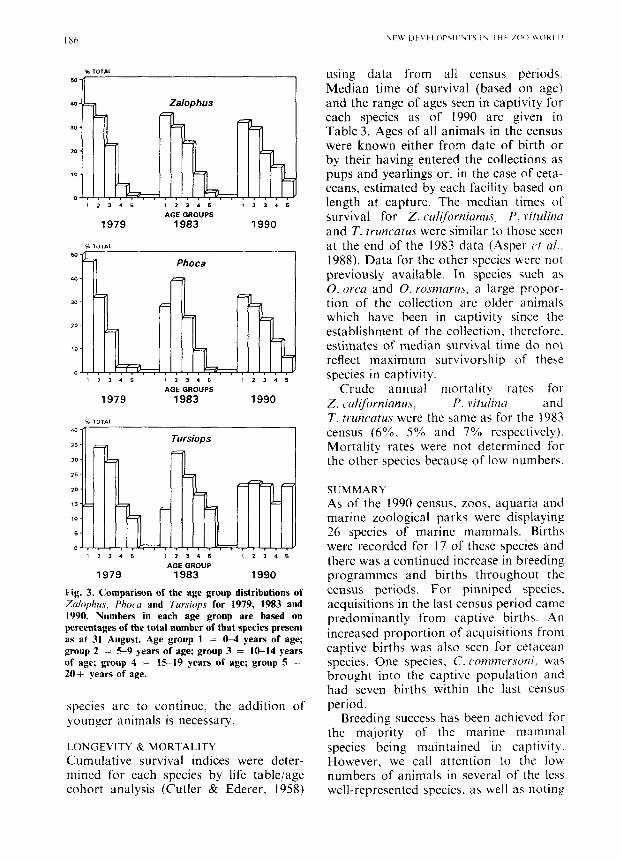
AGE STRUCTURE The age group distribution for individuals in the collection as of each census date was compared for Zalophus, Phoca and Tursiops for the 1979, 1983 and 1990 censuses (Fig. 3 ) . For the two pinniped species there has been ii gradual shift from high numbers of young animals and low numbers of older animals to a more gradual age distribution with higher numbers of older animals. For Tursiops there has been a shift from the largest proportion of animals being in the five to nine and ten to 14 year age groups, to a relatively equal distribution through most age groups. In 1990 a lower proportion of Tursiops in the 15-19 year age group, a prime reproductive (age group for 0 Tursiops, signals a potential decline in birth rate as this population continues to age.
Age group distribulions for the other pinniped and cetacean species were also compared for 1979, 1983 and 1990. For the Northern fur seal Callorhinus ursinus, E. juhata, the White whale Delphinapterus leucas and P. crassidms the 1990 age distribution is younger than it has been in previous years and it may be some years before sexual maturity is reached by some of these species in zoological institutions. For H . grypus, Walrus Odohenus rosmar- us, 0. orcu, T . rnanatus and E.lutris, animals are distributed across all age groups with more individuals in older age categories. The remaining species are characterized by varying degrees of ageing animals with little or no replacement in the younger age categories. This latter group includes, Arctocephalus spp, the Southern sealion Otaria hyronia, L. ohliquidens, Globicephala spp and the Boutu or Amazon dolphin Inia geoflren- sis. If breeding programmes for these
I86
40
~~ 10
0 2 3 4 6
1979
Zalophus
'I' 1 2 3 4 6
AGE GROUPS 1983
2 3 4 6
1990
1979
P TOT.%,
Phoca I
AGE GROUPS 1983 1990
_ _ 35
30
25
20
15
10
6
0 1 2 3 4 5 1 2 3 4 6 1 2 3 4 5
AGE GROUP 1979 1983 1990
Fig. 3. Comparison of the age group distributions of Zaloplius, Plioca and Tursiops for 1979, 1983 and 1990. Numbers in each age group are based on percentages of the total number of that species present as at 31 August. Age group 1 = W years of age; group 2 = 5 9 years of age; group 3 = 10-14 years of age: group 4 = 1519 years of age; group 5 = 20+ years o f age.
species are to continue, the addition of younger animals is necessary.
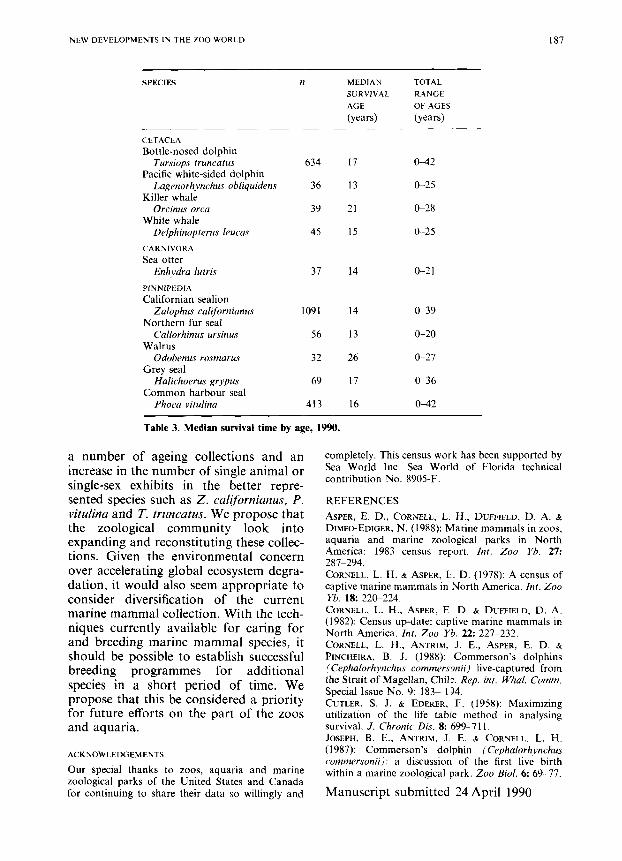
LONGEVITY & MORTALITY Cumulative survival indices were deter- mined for each species by life table/age cohort analysis (Cutler & Ederer, 1958)
using data from all census periods. Median time of survival (based on age) and the range of ages seen in captivity for each species as of 1990 are given in Table 3. Ages of all animals in the census were known either from date of birth or by their having entered the collections as pups and yearlings or, in the case of ceta- ceans, estimated by each facility based on length at capture. The median times of survival for Z. calijiornianus, P. vitulinu and T. truncatus were similar to those seen at the end of the 1983 data (Asper ct al., 1988). Data for the other species were not previously available. In species such as 0. orca and 0. rosmarus. a large propor- tion of the collection are older animals which have been in captivity since the establishment of the collection, therefore, estimates of median survival time do not reflect maximum survivorship of these species in captivity.
Crude annual mortality rates for Z. cal [forn ianus, P . vit ulintr and T. truncatus were the same as for the 1983 census (6%, 5% and 7% respectively). Mortality rates were not determined for the other species because of low numbers.
SUMMARY As of the 1990 census. zoos. aquaria and marine zoological parks were displaying 26 species of marine mammals. Births were recorded for 17 of these species and there was a continued increase in breeding programmes and births throughout the census periods. For pinniped species. acquisitions in the last census period came predominantly from captive births. An increased proportion of acquisitions from captive births was also seen for cetacean species. One species, C. comniwsoni, was brought into the captive population and had seven births within the last census period.
Breeding success has been achieved for the majority of the marine mammal species being maintained in captivity. However, we call attention to thc low numbers of animals in several of the less well-represented spccies. as well as notin&
NEW DEVELOPMENTS Ih THE ZOO WORLD I87
SPECIES
CETACEA Bottle-nosed dolphin
Tursiops truncatus Pacific white-sided dolphin
Lugenorhynchus obliquidens Killer whale
Orcinus orca White whale
Delphinupterus leucas CARNIVORA Sea otter
Enhydru lutris
Californian sealion Zalophus calijornianus
Northern fur seal Cutlorhinus ursinus
Walrus Odobenus rosmurus
Grey seal Halichoerus grypus
Common harbour seal Phoca vitulinu
PlNNlPEDlA
634 17 0 4 2
36 13 &2 5
39 21 0--28
45 15 0-25
37 14 0-2 1
1091 14 0-39
56 13 0-20
32 26 0-27
69 17 0-36
413 16 0 4 2
Table 3. Median survival time by age, 1990.
a number of ageing collections and an increase in the number of single animal or single-sex exhibits in the better repre- sented species such as Z . californianus, P . vitulina and T. truncatus. We propose that the zoological community look into expanding and reconstituting these collec- tions. Given the environmental concern over accelerating global ecosystem degra- dation, it would also seem appropriate to consider diversification of the current marine mammal collection. With the tech- niques currently available for caring for and breeding marine mammal species, it should be possible to establish successful breeding programmes for additional species in a short period of time. We propose that this be considered a priority for future efforts on the part of the zoos and aquaria.
ACKNOWLEDGEMENTS
Our special thanks to zoos, aquaria and marine zoological parks of the United States and Canada for continuing to share their data so willingly and
completely. This census work has been supported by Sea World Inc. Sea World of Florida technical contribution No. 8905-F.
REFERENCES ASPER, E. D., CORNELL, L. H., DUFFIELD, D. A. & DIMEO-EDIGER, N. (1988): Marine mammals in zoos, aquaria and marine zool(3gical parks in North America: 1983 census rqor t . Int. Zoo Yh. 27: 287-294. CORNELL, L. H. & ASPER, E . D. (1978): A census of captive marine mammals in North America. In[. Zoo Yh. 18: 22CL224. CORNELL, L. H.. ASPER, E D. & DUFFIELD, D. A. (1982): Census up-date: captive marine mammals in North America. Int. Zoo Yb. 2 2 227-232. CORNELL, L. H., ANTRIM, J. E., ASPER, E. D. & PINCHEIRA, B. J. (1988): Commerson’s dolphins (Cephulorhynchus commersgnii) live-captured from the Strait of Magellan, Chilf:. Rep. inr. Whal. Comm. Special Issue No. 9: 183- 134. CUTLER. S. J. & EDERER, F. (1958): Maximizing utilization of the life table method in analysing survival. J . Chronic Dis. 8: 699-71 1. JOSEPH, B. E., ANTRIM. J E. c CORNELL. L. H. (1987): Commerson’s dolphin (Cephalorhvnchus commersonii): a discussion of the first live birth within a marine zoological park. Zoo Bid. 6 69-77.
Manuscript submitted 24 April 1990