Embed Size (px)
Citation preview
Marijuana Use, Alcohol Use, and Driving in
Washington State
Emerging Issues With Poly-Drug Use on Washington Roadways
Darrin T. Grondel, Director Staci Hoff, PhD, Research Director Dick Doane, Research Investigator April 2018
Publication and Contact Information
A PDF version of this report is available for download on the Washington Traffic Safety Commission website at: http://wtsc.wa.gov/
For technical questions/information, please contact: Staci Hoff, PhD Research Director Washington Traffic Safety Commission PO Box 40944 Olympia, WA 98504-0944 Phone: 360.725.9874 Email: [email protected]
For policy-related questions/information, please contact: Shelly Baldwin Legislative and Media Relations Manager Washington Traffic Safety Commission PO Box 40944 Olympia, WA 98504-0944 Phone: 360.725.9889 Email: [email protected] Pam Pannkuk Deputy Director Washington Traffic Safety Commission PO Box 40944 Olympia, WA 98504-0944 Phone: 360.725.9884 Email: [email protected]
i
Table of Contents
Report Summary ....................................................................................................................................... - 1 -
Performance and Other Effects of Combining Marijuana and Alcohol ................................................ - 3 -
Crash Risk Estimates: Culpability, Case-Control, and Case-Crossover Studies ..................................... - 4 -
Laboratory/Simulator Studies ............................................................................................................... - 7 -
Research Complications ........................................................................................................................ - 9 -
Conclusions ........................................................................................................................................... - 9 -
Alcohol, Marijuana, and Other Drugs in Fatal Crash-Involved Drivers ................................................... - 10 -
Toxicology Testing of Drivers in Fatal Crashes .................................................................................... - 10 -
Toxicology Outcomes of Drivers in Fatal Crashes ............................................................................... - 11 -
The Rising Incidence of Poly-Drug Drivers in Fatal Crashes ................................................................ - 12 -
Washington’s Roadside Surveys 2014-2015 ........................................................................................... - 17 -
Self-report Marijuana Survey .............................................................................................................. - 18 -
Roadside Surveys: The Importance of Continued Data Collection ..................................................... - 26 -
Washington’s Self-Report Health Surveys .............................................................................................. - 27 -
Behavioral Risk Factor Surveillance System (BRFSS) ........................................................................... - 27 -
Healthy Youth Survey (HYS) ................................................................................................................ - 29 -
Summary and Conclusions ...................................................................................................................... - 32 -
Appendix A: Reference Summaries......................................................................................................... - 33 -
Appendix B: Roadside Survey Self-Report Marijuana Survey ................................................................. - 38 -
Appendix C: Post-stratification Weighting Methodology ....................................................................... - 40 -
ii
Table of Tables
Table 1: Studies Estimating THC Risk, Alone and in Combination with Alcohol ........................................ - 5 -
Table 2: Laboratory Studies Measuring Driving Performance as Impacted by THC and Alcohol ............. - 7 -
Table 3: Toxicology Testing of Surviving and Deceased Drivers in Fatal Crashes, 2008-2016 ................ - 10 -
Table 4: Toxicology Testing of Drivers in Fatal Crashes by Year ............................................................. - 11 -
Table 5: Toxicology Outcomes of Drivers in Fatal Crashes by Year ......................................................... - 11 -
Table 6: Categorization of Drivers in Fatal Crashes Testing Positive for Alcohol or Drugs, 2008-2016 .. - 12 -
Table 7: WA BRFSS Traffic Safety Module Driving After Marijuana Use................................................. - 27 -
Table 8: Number of Drivers Ages 16-18 Involved in Fatal Crashes 2008-2016 with Drugs/Alcohol ....... - 31 -
iii
Table of Figures
Figure 1: Recent Increases in Poly-Drug Drivers in Fatal Crashes ........................................................... - 13 -
Figure 2: Drivers in Fatal Crashes Testing Positive for Alcohol or Drugs ................................................. - 13 -
Figure 3: Gender of Drivers in Fatal Crashes Testing Positive for Alcohol or Drugs ................................ - 14 -
Figure 4: Age of Drivers in Fatal Crashes Testing Positive for Alcohol or Drugs ..................................... - 15 -
Figure 5: Contributing Factors of Drivers in Fatal Crashes Testing Positive for Alcohol or Drugs ........... - 16 -
Figure 6: Biological Results of Washington’s Roadside Survey ............................................................... - 17 -
Figures S.1: Have you ever, even once, used marijuana? ....................................................................... - 18 -
Figure S.2: At what age did you first use marijuana? ............................................................................. - 20 -
Figures S.3: How long has it been since you last used marijuana? ......................................................... - 20 -
Figure S.4: How often do you currently use marijuana? ......................................................................... - 21 -
Figure S.5: If you use marijuana every day, about how many times a day do you use it? ..................... - 22 -
Figure S.6: If you used marijuana in the past day, how recently did you use? ....................................... - 22 -
Figures S.7: Have you used marijuana within two hours before driving? Not driven because you had
recently used marijuana? ........................................................................................................................ - 23 -
Figures S.8: How do you think marijuana affected your driving? ........................................................... - 23 -
Figure S.9: How likely do you think it is that marijuana impairs a person’s ability to drive safely? ....... - 25 -
Figure S.10: How likely do you think it is that a person could be arrested for impaired driving after using
marijuana within two hours of driving? .................................................................................................. - 26 -
Figure B1: Driving Within 3 Hours of Marijuana Use: WA BRFSS 2014-2016 ......................................... - 27 -
Figure B2: Driving Within 3 Hours of Marijuana Use by Age/Gender: WA BRFSS 2014-2016 ................ - 28 -
Figure B3: Driving Within 3 Hours of Marijuana Use by Education/Income: WA BRFSS 2014-2016 ...... - 28 -
Figure B4: Driving After Marijuana Use and Other High-Risk Behaviors: WA BRFSS 2014-2016 ........... - 29 -
Figure H1: Rode with Driver Who Had Been Using Marijuana: WA HYS 2014-2016 .............................. - 30 -
Figure H2: Drove a Vehicle Within 3 Hours of Marijuana Use: WA HYS 2014-2016 ............................... - 31 -

iv
Glossary
Fatality Analysis Reporting System (FARS) – A national database funded by the National Highway Traffic
Safety Administration (NHTSA) containing a census of all fatal traffic crashes occurring in the U.S.
Washington State FARS is supplemented with information from toxicology reports, death records,
coroner reports, EMS information, vehicle registration, and driver licensing information.
THC – Acronym for Tetrahydrocannabinols. For purposes of this report, the use of THC specifically refers
to delta-9-THC, the psychoactive chemical entering the blood and brain immediately after marijuana
smoking/consumption.
Carboxy-THC/Hydroxy-THC – The metabolites of delta-9-THC; this metabolite may be detected for up to
30 days after consumption.
Cannabinoids – A class of chemical compounds contained in marijuana. For purposes of this report,
cannabinoids are an encompassing term to include any toxicology outcome related to marijuana (THC or
carboxy-THC undistinguished).
Marijuana ng/ml of Blood – The unit of measurement used to describe the level of THC and/or carboxy-
THC contained in a person’s blood.
Other Drugs – Other drugs found in drivers involved in fatal crashes are from discrete drug families
including narcotic analgesics, hallucinogens, depressants, stimulants, inhalants, and Phencyclidines
(PCP). This report does not include alcohol when referring to other drugs. Detailed THC information was
derived from toxicology reports. Descriptions of other drugs in this report relied on existing FARS drug
coding.
Poly-Drug Drivers – Drivers involved in fatal crashes that are positive for alcohol and one or more other
drugs, or two or more drugs that are not alcohol as confirmed by toxicology testing.
Blood Alcohol Concentration (BAC), Alcohol Greater Than/Equal to BAC .08 – The unit of measurement
used to describe the level of alcohol contained in a person’s blood; the measurement describes the
percent of a person’s blood that is alcohol. Alcohol greater than/equal to BAC .08 refers to a driver at or
in excess of the per se limit.
Weighted Surveys – Data collected from survey respondents that represent a sample of a larger
population are weighted for analysis so that the results better represent the larger population rather
than just the sample of respondents.
- 1 -
Report Summary
This report provides select updated fatal crash information originally presented in Washington Traffic
Safety Commission’s report Driver Toxicology Testing and the Involvement of Marijuana in Fatal Crashes,
2010-20141 (October 2015). Since that report was published, poly-drug drivers involved in fatal crashes
have increased significantly and is described more thoroughly in the present report. For the first time,
this report also includes compilations of analyses of Washington’s Roadside Self-Report Marijuana
Survey, and questions from the Behavioral Risk Factor Surveillance and Healthy Youth Surveys. The
following is a summary of key observations from these various data sources.
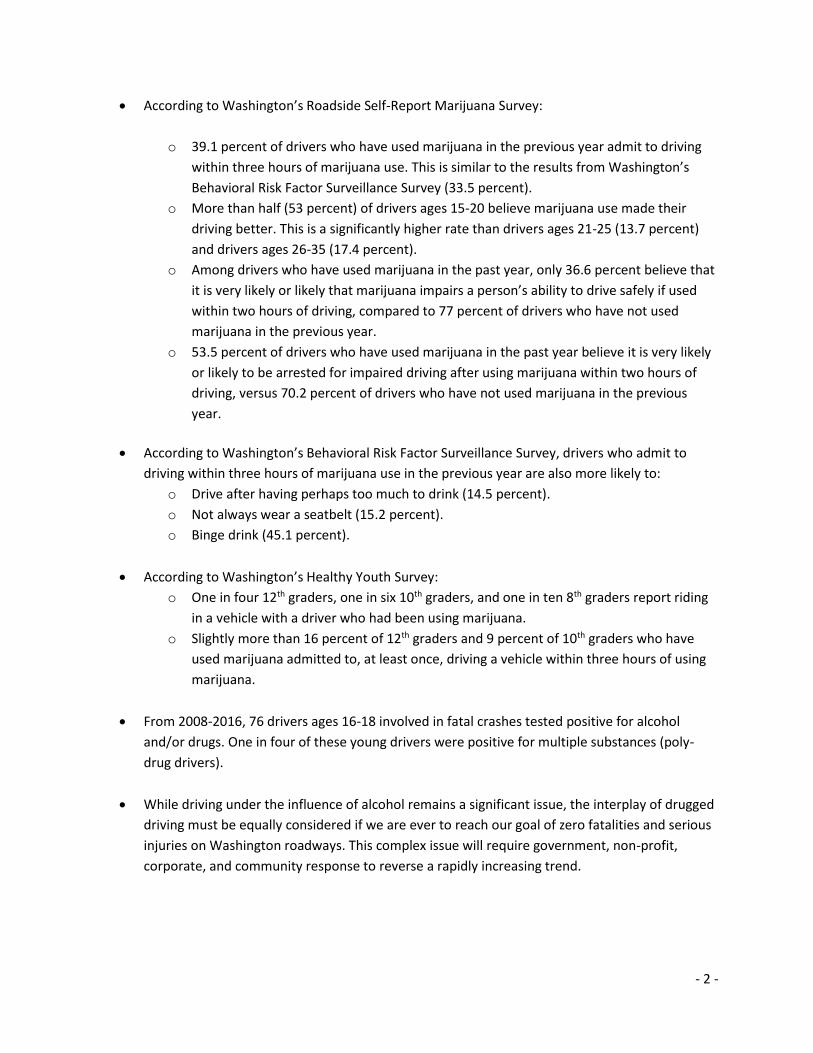
Driver impairment due to alcohol and/or drugs is the number one contributing factor in
Washington fatal crashes and is involved in nearly half of all traffic fatalities. Poly-drug drivers
(combinations of alcohol and drugs or multiple drugs) is now the most common type of
impairment among drivers in fatal crashes.
Among drivers involved in fatal crashes 2008-2016 who were blood tested for intoxicants, 61
percent were positive for alcohol and/or drugs.
Among drivers in fatal crashes 2008-2016 that tested positive for alcohol or drugs, 44 percent
tested positive for two or more substances (poly-drug drivers). The most common substance in
poly-drug drivers is alcohol, followed by THC. Alcohol and THC combined is the most common
poly-drug combination.
Although research-based estimates of the risks posed by THC have varied greatly, all studies
included in this report agree that combining alcohol and THC will only further inflate the level of
impairment and crash risk. The deadly consequences of combining these two impairing
substances and driving are already apparent in Washington fatal crash data.
For the first time in 2012, poly-drug drivers became the most prevalent type of impaired drivers
involved in fatal crashes. Since 2012, the number of poly-drug drivers involved in fatal crashes
have increased an average of 15 percent every year.
By 2016, the number of poly-drug drivers were more than double the number of alcohol-only
drivers and five times higher than the number of THC-only drivers involved in fatal crashes.
According to the biological results of Washington’s Roadside Survey, nearly one in five daytime
drivers may be under the influence of marijuana, up from less than one in 10 drivers prior to the
implementation of marijuana retail sales.
1 Available at http://wtsc.wa.gov/
- 2 -
According to Washington’s Roadside Self-Report Marijuana Survey:
o 39.1 percent of drivers who have used marijuana in the previous year admit to driving
within three hours of marijuana use. This is similar to the results from Washington’s
Behavioral Risk Factor Surveillance Survey (33.5 percent).
o More than half (53 percent) of drivers ages 15-20 believe marijuana use made their
driving better. This is a significantly higher rate than drivers ages 21-25 (13.7 percent)
and drivers ages 26-35 (17.4 percent).
o Among drivers who have used marijuana in the past year, only 36.6 percent believe that
it is very likely or likely that marijuana impairs a person’s ability to drive safely if used
within two hours of driving, compared to 77 percent of drivers who have not used
marijuana in the previous year.
o 53.5 percent of drivers who have used marijuana in the past year believe it is very likely
or likely to be arrested for impaired driving after using marijuana within two hours of
driving, versus 70.2 percent of drivers who have not used marijuana in the previous
year.
According to Washington’s Behavioral Risk Factor Surveillance Survey, drivers who admit to
driving within three hours of marijuana use in the previous year are also more likely to:
o Drive after having perhaps too much to drink (14.5 percent).
o Not always wear a seatbelt (15.2 percent).
o Binge drink (45.1 percent).
According to Washington’s Healthy Youth Survey:
o One in four 12th graders, one in six 10th graders, and one in ten 8th graders report riding
in a vehicle with a driver who had been using marijuana.
o Slightly more than 16 percent of 12th graders and 9 percent of 10th graders who have
used marijuana admitted to, at least once, driving a vehicle within three hours of using
marijuana.
From 2008-2016, 76 drivers ages 16-18 involved in fatal crashes tested positive for alcohol
and/or drugs. One in four of these young drivers were positive for multiple substances (poly-
drug drivers).
While driving under the influence of alcohol remains a significant issue, the interplay of drugged
driving must be equally considered if we are ever to reach our goal of zero fatalities and serious
injuries on Washington roadways. This complex issue will require government, non-profit,
corporate, and community response to reverse a rapidly increasing trend.
- 3 -
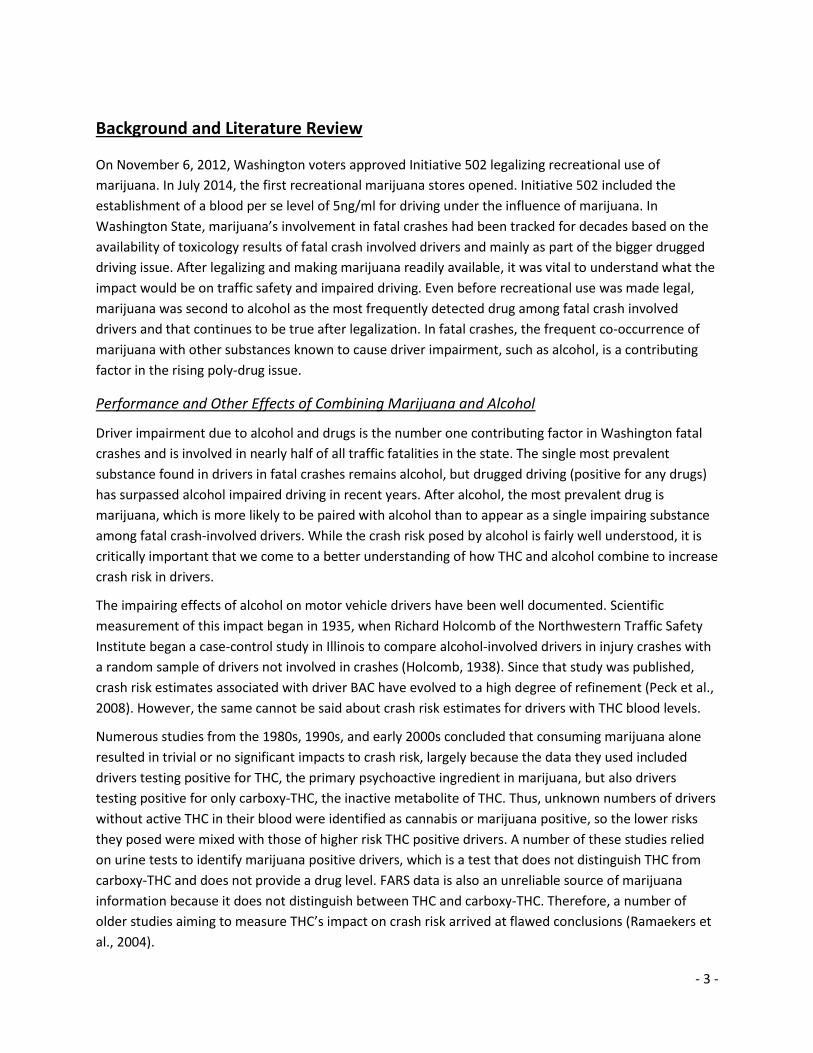
Background and Literature Review
On November 6, 2012, Washington voters approved Initiative 502 legalizing recreational use of
marijuana. In July 2014, the first recreational marijuana stores opened. Initiative 502 included the
establishment of a blood per se level of 5ng/ml for driving under the influence of marijuana. In
Washington State, marijuana’s involvement in fatal crashes had been tracked for decades based on the
availability of toxicology results of fatal crash involved drivers and mainly as part of the bigger drugged
driving issue. After legalizing and making marijuana readily available, it was vital to understand what the
impact would be on traffic safety and impaired driving. Even before recreational use was made legal,
marijuana was second to alcohol as the most frequently detected drug among fatal crash involved
drivers and that continues to be true after legalization. In fatal crashes, the frequent co-occurrence of
marijuana with other substances known to cause driver impairment, such as alcohol, is a contributing
factor in the rising poly-drug issue.
Performance and Other Effects of Combining Marijuana and Alcohol
Driver impairment due to alcohol and drugs is the number one contributing factor in Washington fatal
crashes and is involved in nearly half of all traffic fatalities in the state. The single most prevalent
substance found in drivers in fatal crashes remains alcohol, but drugged driving (positive for any drugs)
has surpassed alcohol impaired driving in recent years. After alcohol, the most prevalent drug is
marijuana, which is more likely to be paired with alcohol than to appear as a single impairing substance
among fatal crash-involved drivers. While the crash risk posed by alcohol is fairly well understood, it is
critically important that we come to a better understanding of how THC and alcohol combine to increase
crash risk in drivers.
The impairing effects of alcohol on motor vehicle drivers have been well documented. Scientific
measurement of this impact began in 1935, when Richard Holcomb of the Northwestern Traffic Safety
Institute began a case-control study in Illinois to compare alcohol-involved drivers in injury crashes with
a random sample of drivers not involved in crashes (Holcomb, 1938). Since that study was published,
crash risk estimates associated with driver BAC have evolved to a high degree of refinement (Peck et al.,
2008). However, the same cannot be said about crash risk estimates for drivers with THC blood levels.
Numerous studies from the 1980s, 1990s, and early 2000s concluded that consuming marijuana alone
resulted in trivial or no significant impacts to crash risk, largely because the data they used included
drivers testing positive for THC, the primary psychoactive ingredient in marijuana, but also drivers
testing positive for only carboxy-THC, the inactive metabolite of THC. Thus, unknown numbers of drivers
without active THC in their blood were identified as cannabis or marijuana positive, so the lower risks
they posed were mixed with those of higher risk THC positive drivers. A number of these studies relied
on urine tests to identify marijuana positive drivers, which is a test that does not distinguish THC from
carboxy-THC and does not provide a drug level. FARS data is also an unreliable source of marijuana
information because it does not distinguish between THC and carboxy-THC. Therefore, a number of
older studies aiming to measure THC’s impact on crash risk arrived at flawed conclusions (Ramaekers et
al., 2004).
- 4 -
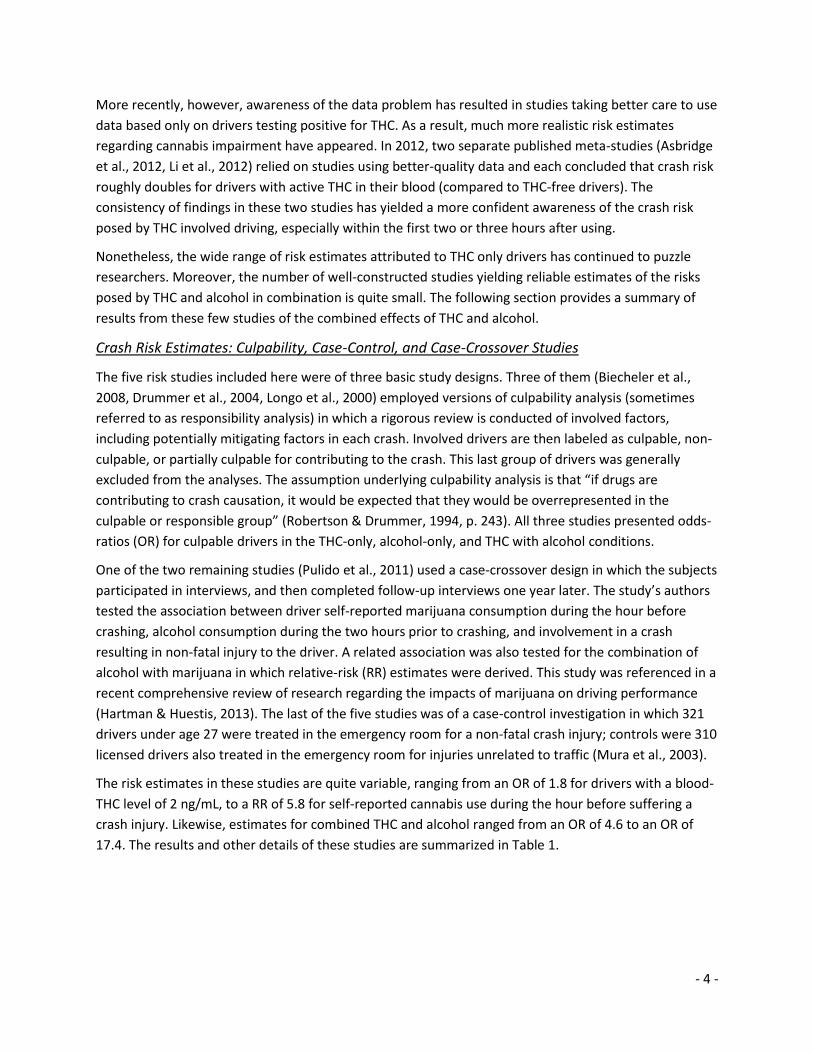
More recently, however, awareness of the data problem has resulted in studies taking better care to use
data based only on drivers testing positive for THC. As a result, much more realistic risk estimates
regarding cannabis impairment have appeared. In 2012, two separate published meta-studies (Asbridge
et al., 2012, Li et al., 2012) relied on studies using better-quality data and each concluded that crash risk
roughly doubles for drivers with active THC in their blood (compared to THC-free drivers). The
consistency of findings in these two studies has yielded a more confident awareness of the crash risk
posed by THC involved driving, especially within the first two or three hours after using.
Nonetheless, the wide range of risk estimates attributed to THC only drivers has continued to puzzle
researchers. Moreover, the number of well-constructed studies yielding reliable estimates of the risks
posed by THC and alcohol in combination is quite small. The following section provides a summary of
results from these few studies of the combined effects of THC and alcohol.
Crash Risk Estimates: Culpability, Case-Control, and Case-Crossover Studies
The five risk studies included here were of three basic study designs. Three of them (Biecheler et al.,
2008, Drummer et al., 2004, Longo et al., 2000) employed versions of culpability analysis (sometimes
referred to as responsibility analysis) in which a rigorous review is conducted of involved factors,
including potentially mitigating factors in each crash. Involved drivers are then labeled as culpable, non-
culpable, or partially culpable for contributing to the crash. This last group of drivers was generally
excluded from the analyses. The assumption underlying culpability analysis is that “if drugs are
contributing to crash causation, it would be expected that they would be overrepresented in the
culpable or responsible group” (Robertson & Drummer, 1994, p. 243). All three studies presented odds-
ratios (OR) for culpable drivers in the THC-only, alcohol-only, and THC with alcohol conditions.
One of the two remaining studies (Pulido et al., 2011) used a case-crossover design in which the subjects
participated in interviews, and then completed follow-up interviews one year later. The study’s authors
tested the association between driver self-reported marijuana consumption during the hour before
crashing, alcohol consumption during the two hours prior to crashing, and involvement in a crash
resulting in non-fatal injury to the driver. A related association was also tested for the combination of
alcohol with marijuana in which relative-risk (RR) estimates were derived. This study was referenced in a
recent comprehensive review of research regarding the impacts of marijuana on driving performance
(Hartman & Huestis, 2013). The last of the five studies was of a case-control investigation in which 321
drivers under age 27 were treated in the emergency room for a non-fatal crash injury; controls were 310
licensed drivers also treated in the emergency room for injuries unrelated to traffic (Mura et al., 2003).
The risk estimates in these studies are quite variable, ranging from an OR of 1.8 for drivers with a blood-
THC level of 2 ng/mL, to a RR of 5.8 for self-reported cannabis use during the hour before suffering a
crash injury. Likewise, estimates for combined THC and alcohol ranged from an OR of 4.6 to an OR of
17.4. The results and other details of these studies are summarized in Table 1.
- 5 -
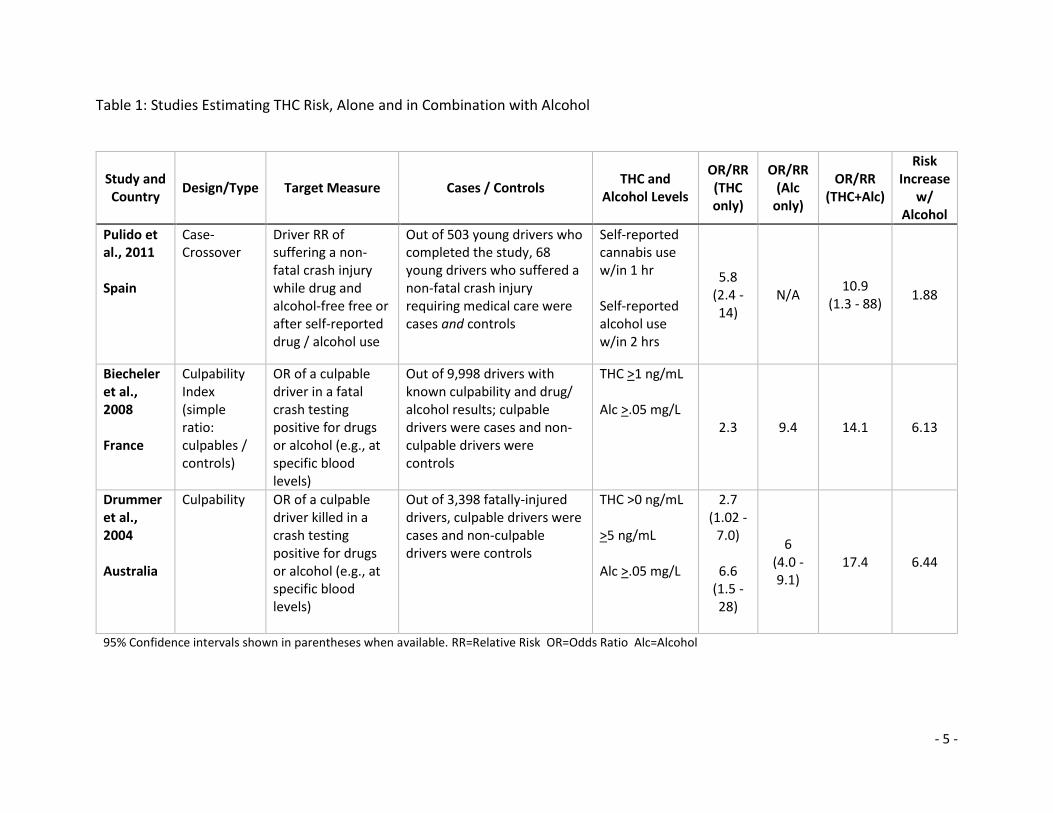
Table 1: Studies Estimating THC Risk, Alone and in Combination with Alcohol
Study and Country
Design/Type Target Measure Cases / Controls THC and
Alcohol Levels
OR/RR (THC only)
OR/RR (Alc
only)
OR/RR (THC+Alc)
Risk Increase
w/ Alcohol
Pulido et al., 2011 Spain
Case-Crossover
Driver RR of suffering a non-fatal crash injury while drug and alcohol-free free or after self-reported drug / alcohol use
Out of 503 young drivers who completed the study, 68 young drivers who suffered a non-fatal crash injury requiring medical care were cases and controls
Self-reported cannabis use w/in 1 hr Self-reported alcohol use w/in 2 hrs
5.8 (2.4 - 14)
N/A 10.9
(1.3 - 88) 1.88
Biecheler et al., 2008 France
Culpability Index (simple ratio: culpables / controls)
OR of a culpable driver in a fatal crash testing positive for drugs or alcohol (e.g., at specific blood levels)
Out of 9,998 drivers with known culpability and drug/ alcohol results; culpable drivers were cases and non-culpable drivers were controls
THC >1 ng/mL Alc >.05 mg/L
2.3 9.4 14.1 6.13
Drummer et al., 2004 Australia
Culpability OR of a culpable driver killed in a crash testing positive for drugs or alcohol (e.g., at specific blood levels)
Out of 3,398 fatally-injured drivers, culpable drivers were cases and non-culpable drivers were controls
THC >0 ng/mL >5 ng/mL Alc >.05 mg/L
2.7 (1.02 -
7.0)
6.6 (1.5 - 28)
6 (4.0 - 9.1)
17.4 6.44
95% Confidence intervals shown in parentheses when available. RR=Relative Risk OR=Odds Ratio Alc=Alcohol
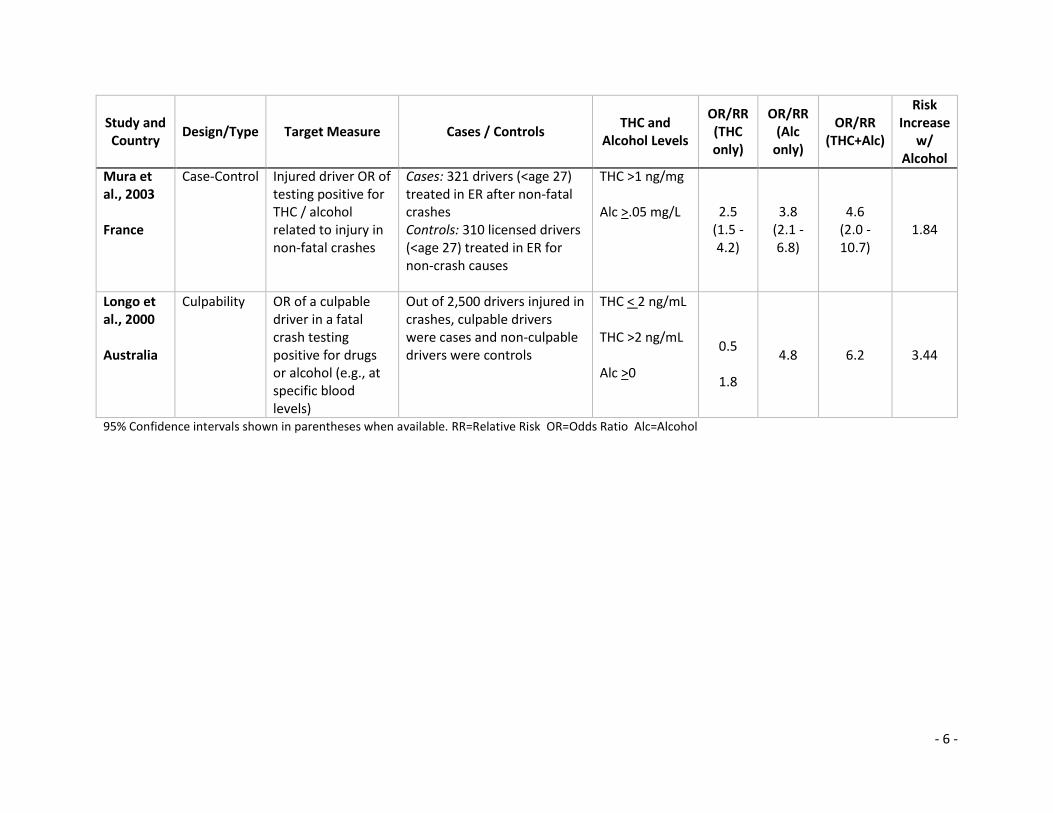
- 6 -
Study and Country
Design/Type Target Measure Cases / Controls THC and
Alcohol Levels
OR/RR (THC only)
OR/RR (Alc
only)
OR/RR (THC+Alc)
Risk Increase
w/ Alcohol
Mura et al., 2003 France
Case-Control Injured driver OR of testing positive for THC / alcohol related to injury in non-fatal crashes
Cases: 321 drivers (<age 27) treated in ER after non-fatal crashes Controls: 310 licensed drivers (<age 27) treated in ER for non-crash causes
THC >1 ng/mg Alc >.05 mg/L 2.5
(1.5 - 4.2)
3.8 (2.1 - 6.8)
4.6 (2.0 - 10.7)
1.84
Longo et al., 2000 Australia
Culpability OR of a culpable driver in a fatal crash testing positive for drugs or alcohol (e.g., at specific blood levels)
Out of 2,500 drivers injured in crashes, culpable drivers were cases and non-culpable drivers were controls
THC < 2 ng/mL THC >2 ng/mL Alc >0
0.5
1.8
4.8 6.2 3.44
95% Confidence intervals shown in parentheses when available. RR=Relative Risk OR=Odds Ratio Alc=Alcohol
- 7 -
Laboratory/Simulator Studies
A great advantage of simulator studies is that they yield precise estimates derived from controlled
research conditions, such as ongoing alcohol and drug levels during a series of performance trials.
Simulator studies often reveal the specific human skills and abilities compromised by impairing
substances. The psychomotor and neurocognitive faculties comprising the core of competencies vital to
the driving task are highly vulnerable to impairment.
The standard deviation of lane position (SDLP) is an exquisitely sensitive measure of the driver’s ability
to gauge and maintain consistent control of a vehicle’s position and trajectory in the roadway. Other
critical skills tests are the divided attention test (DAT), which measures the subject’s ability to process
and coordinate multiple information streams within the same time frame. All of these inputs must be
registered and prioritized in time to make needed adjustments to one’s vehicle operation in order to
maintain generally safe travel. Critical tracking (CT) represents the human ability to remain focused on
important visual objects moving about in the visual field – and making ongoing adjustments accordingly.
Other important measures used in laboratory and simulator studies include lateral acceleration (the
ability to adjust vehicle speed and steering wheel in order to safely control turning), time-out-of-lane
(another measure of lateral control), reaction time (usually assessed by the stop-signal test), and
working memory (a neurocognitive function measured by specific memory tests).
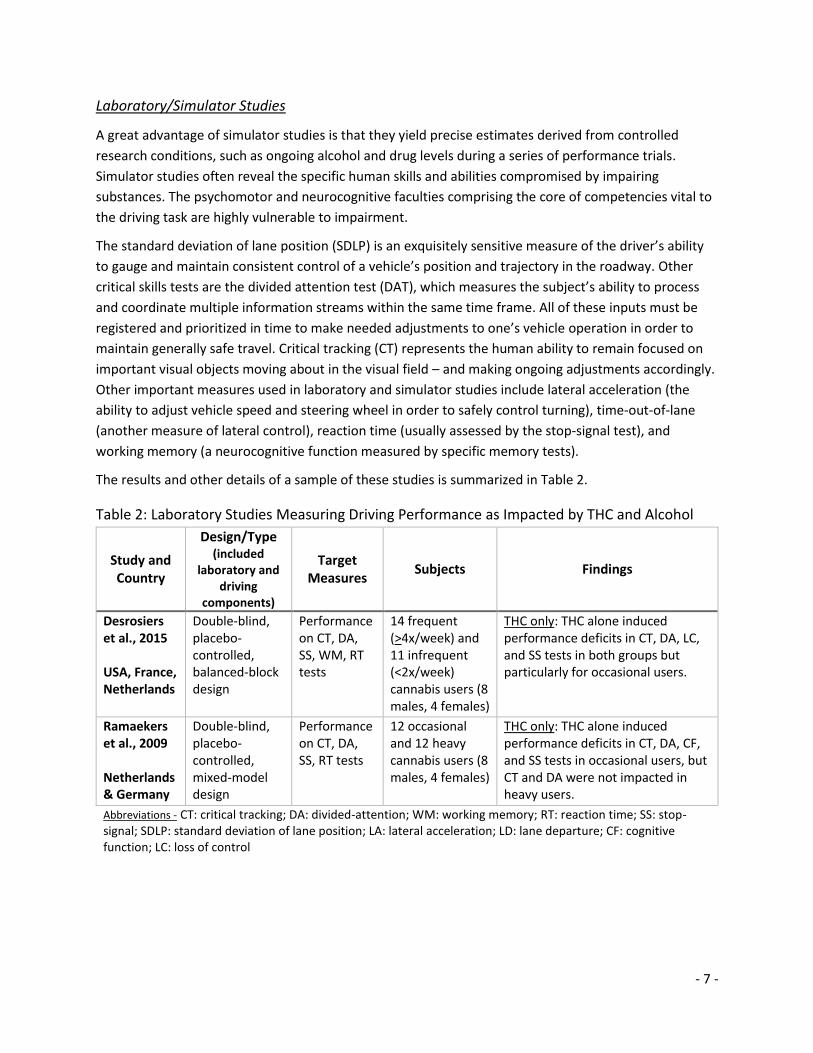
The results and other details of a sample of these studies is summarized in Table 2.
Table 2: Laboratory Studies Measuring Driving Performance as Impacted by THC and Alcohol
Study and Country
Design/Type (included
laboratory and driving
components)
Target Measures
Subjects Findings
Desrosiers et al., 2015 USA, France, Netherlands
Double-blind, placebo-controlled, balanced-block design
Performance on CT, DA, SS, WM, RT tests
14 frequent (>4x/week) and 11 infrequent (<2x/week) cannabis users (8 males, 4 females)
THC only: THC alone induced performance deficits in CT, DA, LC, and SS tests in both groups but particularly for occasional users.
Ramaekers et al., 2009 Netherlands & Germany
Double-blind, placebo-controlled, mixed-model design
Performance on CT, DA, SS, RT tests
12 occasional and 12 heavy cannabis users (8 males, 4 females)
THC only: THC alone induced performance deficits in CT, DA, CF, and SS tests in occasional users, but CT and DA were not impacted in heavy users.
Abbreviations - CT: critical tracking; DA: divided-attention; WM: working memory; RT: reaction time; SS: stop-signal; SDLP: standard deviation of lane position; LA: lateral acceleration; LD: lane departure; CF: cognitive function; LC: loss of control
- 8 -
Study and Country
Design/Type (included
laboratory and driving
components)
Target Measures
Subjects Findings
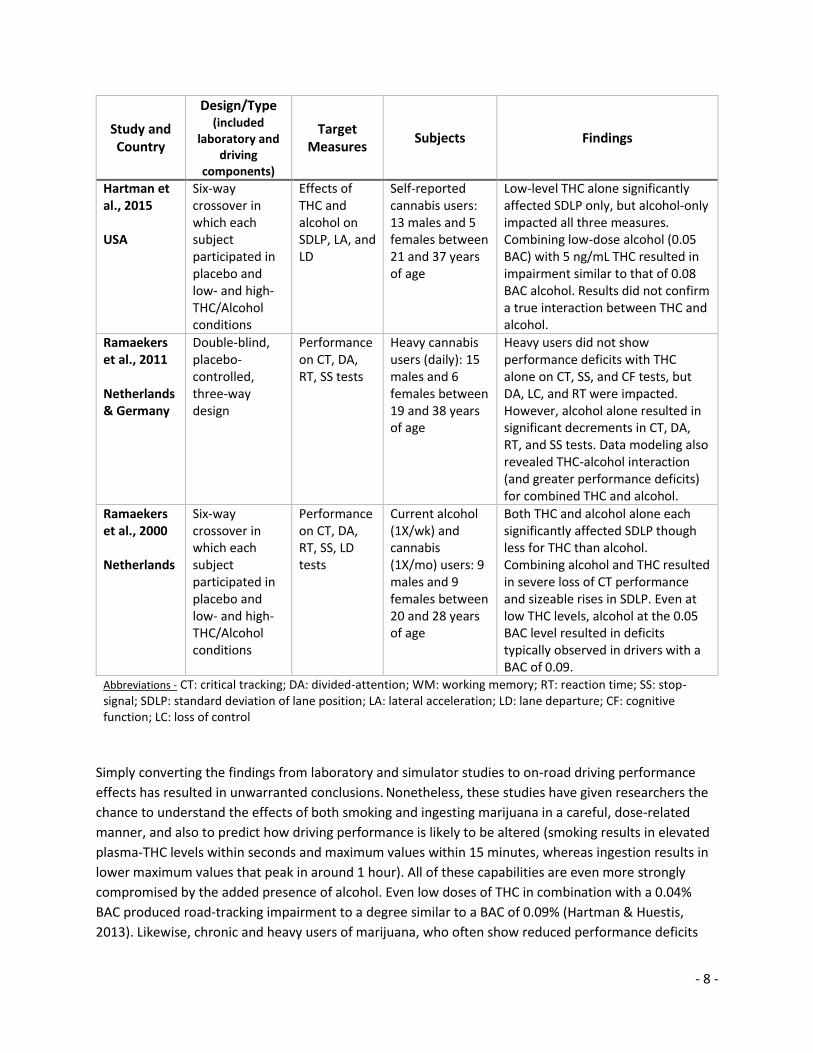
Hartman et al., 2015 USA
Six-way crossover in which each subject participated in placebo and low- and high- THC/Alcohol conditions
Effects of THC and alcohol on SDLP, LA, and LD
Self-reported cannabis users: 13 males and 5 females between 21 and 37 years of age
Low-level THC alone significantly affected SDLP only, but alcohol-only impacted all three measures. Combining low-dose alcohol (0.05 BAC) with 5 ng/mL THC resulted in impairment similar to that of 0.08 BAC alcohol. Results did not confirm a true interaction between THC and alcohol.
Ramaekers et al., 2011 Netherlands & Germany
Double-blind, placebo-controlled, three-way design
Performance on CT, DA, RT, SS tests
Heavy cannabis users (daily): 15 males and 6 females between 19 and 38 years of age
Heavy users did not show performance deficits with THC alone on CT, SS, and CF tests, but DA, LC, and RT were impacted. However, alcohol alone resulted in significant decrements in CT, DA, RT, and SS tests. Data modeling also revealed THC-alcohol interaction (and greater performance deficits) for combined THC and alcohol.
Ramaekers et al., 2000 Netherlands
Six-way crossover in which each subject participated in placebo and low- and high- THC/Alcohol conditions
Performance on CT, DA, RT, SS, LD tests
Current alcohol (1X/wk) and cannabis (1X/mo) users: 9 males and 9 females between 20 and 28 years of age
Both THC and alcohol alone each significantly affected SDLP though less for THC than alcohol. Combining alcohol and THC resulted in severe loss of CT performance and sizeable rises in SDLP. Even at low THC levels, alcohol at the 0.05 BAC level resulted in deficits typically observed in drivers with a BAC of 0.09.
Abbreviations - CT: critical tracking; DA: divided-attention; WM: working memory; RT: reaction time; SS: stop-signal; SDLP: standard deviation of lane position; LA: lateral acceleration; LD: lane departure; CF: cognitive function; LC: loss of control
Simply converting the findings from laboratory and simulator studies to on-road driving performance
effects has resulted in unwarranted conclusions. Nonetheless, these studies have given researchers the
chance to understand the effects of both smoking and ingesting marijuana in a careful, dose-related
manner, and also to predict how driving performance is likely to be altered (smoking results in elevated
plasma-THC levels within seconds and maximum values within 15 minutes, whereas ingestion results in
lower maximum values that peak in around 1 hour). All of these capabilities are even more strongly
compromised by the added presence of alcohol. Even low doses of THC in combination with a 0.04%
BAC produced road-tracking impairment to a degree similar to a BAC of 0.09% (Hartman & Huestis,
2013). Likewise, chronic and heavy users of marijuana, who often show reduced performance deficits
- 9 -
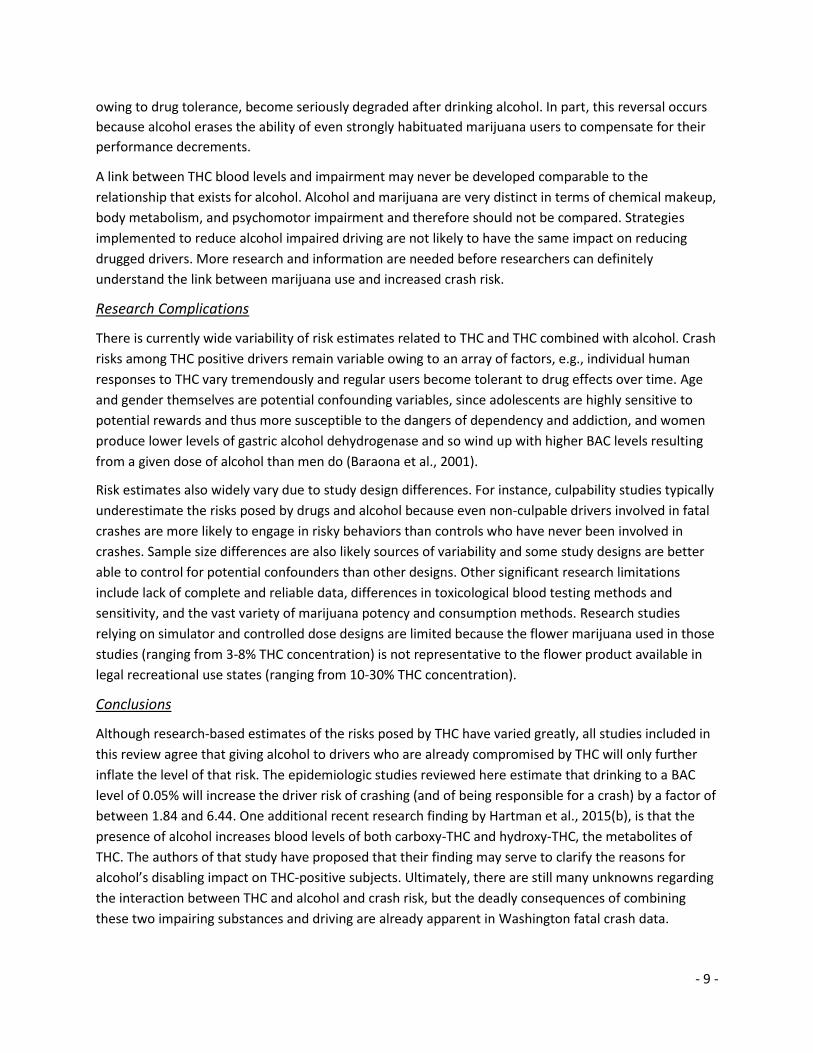
owing to drug tolerance, become seriously degraded after drinking alcohol. In part, this reversal occurs
because alcohol erases the ability of even strongly habituated marijuana users to compensate for their
performance decrements.
A link between THC blood levels and impairment may never be developed comparable to the
relationship that exists for alcohol. Alcohol and marijuana are very distinct in terms of chemical makeup,
body metabolism, and psychomotor impairment and therefore should not be compared. Strategies
implemented to reduce alcohol impaired driving are not likely to have the same impact on reducing
drugged drivers. More research and information are needed before researchers can definitely
understand the link between marijuana use and increased crash risk.
Research Complications
There is currently wide variability of risk estimates related to THC and THC combined with alcohol. Crash
risks among THC positive drivers remain variable owing to an array of factors, e.g., individual human
responses to THC vary tremendously and regular users become tolerant to drug effects over time. Age
and gender themselves are potential confounding variables, since adolescents are highly sensitive to
potential rewards and thus more susceptible to the dangers of dependency and addiction, and women
produce lower levels of gastric alcohol dehydrogenase and so wind up with higher BAC levels resulting
from a given dose of alcohol than men do (Baraona et al., 2001).
Risk estimates also widely vary due to study design differences. For instance, culpability studies typically
underestimate the risks posed by drugs and alcohol because even non-culpable drivers involved in fatal
crashes are more likely to engage in risky behaviors than controls who have never been involved in
crashes. Sample size differences are also likely sources of variability and some study designs are better
able to control for potential confounders than other designs. Other significant research limitations
include lack of complete and reliable data, differences in toxicological blood testing methods and
sensitivity, and the vast variety of marijuana potency and consumption methods. Research studies
relying on simulator and controlled dose designs are limited because the flower marijuana used in those
studies (ranging from 3-8% THC concentration) is not representative to the flower product available in
legal recreational use states (ranging from 10-30% THC concentration).
Conclusions
Although research-based estimates of the risks posed by THC have varied greatly, all studies included in
this review agree that giving alcohol to drivers who are already compromised by THC will only further
inflate the level of that risk. The epidemiologic studies reviewed here estimate that drinking to a BAC
level of 0.05% will increase the driver risk of crashing (and of being responsible for a crash) by a factor of
between 1.84 and 6.44. One additional recent research finding by Hartman et al., 2015(b), is that the
presence of alcohol increases blood levels of both carboxy-THC and hydroxy-THC, the metabolites of
THC. The authors of that study have proposed that their finding may serve to clarify the reasons for
alcohol’s disabling impact on THC-positive subjects. Ultimately, there are still many unknowns regarding
the interaction between THC and alcohol and crash risk, but the deadly consequences of combining
these two impairing substances and driving are already apparent in Washington fatal crash data.
- 10 -
Alcohol, Marijuana, and Other Drugs in Fatal Crash-Involved Drivers
The Revised Code of Washington 46.52.065 requires that “a blood sample be taken from all drivers and
all pedestrians who are killed in any traffic [crash] where the death occurred within four hours” for
analysis by the state toxicologist “to determine the concentration of alcohol and, where feasible, the
presence of drugs or other toxic substances.” This statute has led to statewide testing rates for deceased
drivers of almost 90 percent. Failure to test a deceased driver most often results from either a long-time
lag between crash and death or from some other barrier to obtaining a viable sample for testing.
Unfortunately, a similar law does not exist for surviving drivers involved in fatal crashes. Therefore,
testing rates among this group are much lower and rely on the reasonable suspicion of impairment by
the investigating law enforcement parties.
Washington State has a centralized toxicology laboratory. This means that all drivers suspected of
driving under the influence (DUI), either in traffic or as part of a crash investigation where a
blood/specimen was collected, are tested by the Washington State Patrol (WSP) Toxicology Lab. The
WSP Toxicology Lab’s reporting thresholds for THC have varied in the past from one to two nanograms
per milliliter of blood (ng/mL). On January 1, 2013, the WSP Toxicology Lab reset the THC reporting
threshold to one ng/mL and began conducting full panel (alcohol and drug) tests on all traffic crash
blood sample submissions. Prior to this date, the Lab tested blood for the presence of alcohol first. Only
if blood alcohol concentrations were under 0.10, the Lab then conducted drug testing. In addition, full
panel alcohol and drug testing was only performed when a driver was involved in vehicular
homicide/assault and/or underwent a Drug Recognition Expert examination. The Lab change to full
panel testing after 2013 had a minor impact on the data used in this report (Table 4). Drivers with only
alcohol screening were therefore excluded.
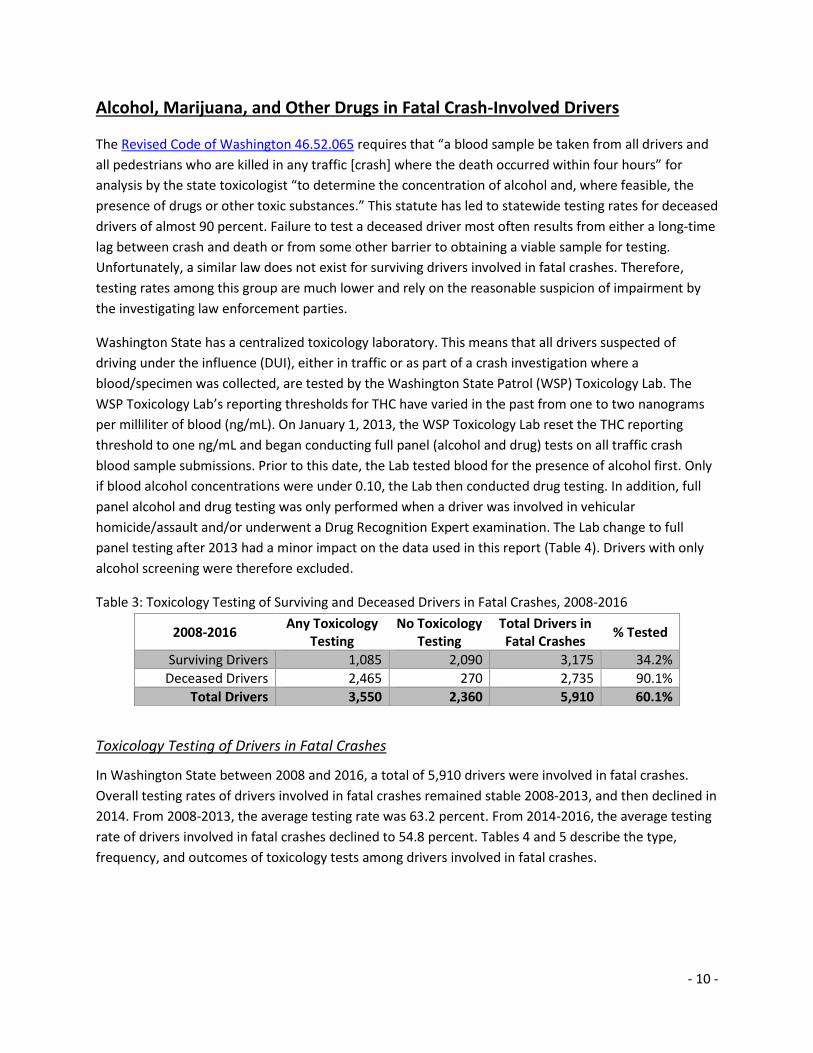
Table 3: Toxicology Testing of Surviving and Deceased Drivers in Fatal Crashes, 2008-2016
Toxicology Testing of Drivers in Fatal Crashes
In Washington State between 2008 and 2016, a total of 5,910 drivers were involved in fatal crashes.
Overall testing rates of drivers involved in fatal crashes remained stable 2008-2013, and then declined in
2014. From 2008-2013, the average testing rate was 63.2 percent. From 2014-2016, the average testing
rate of drivers involved in fatal crashes declined to 54.8 percent. Tables 4 and 5 describe the type,
frequency, and outcomes of toxicology tests among drivers involved in fatal crashes.
2008-2016 Any Toxicology
Testing No Toxicology
Testing Total Drivers in Fatal Crashes
% Tested
Surviving Drivers 1,085 2,090 3,175 34.2%
Deceased Drivers 2,465 270 2,735 90.1%
Total Drivers 3,550 2,360 5,910 60.1%
- 11 -
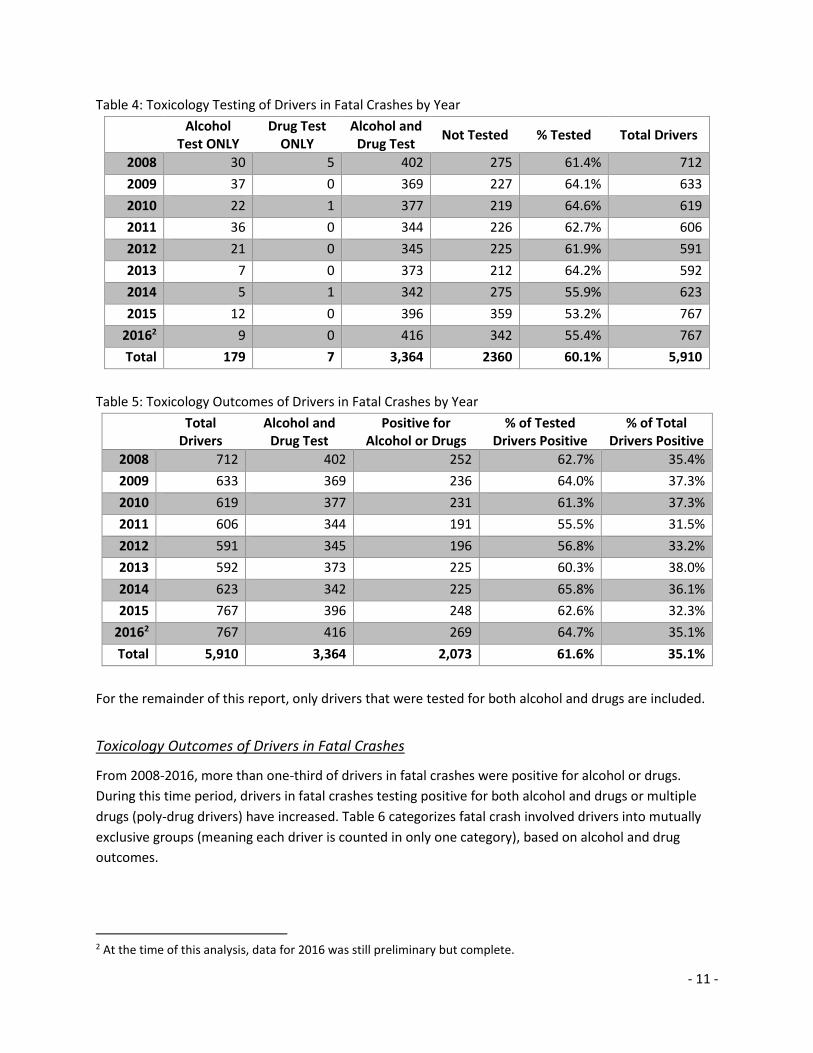
Table 4: Toxicology Testing of Drivers in Fatal Crashes by Year
Alcohol
Test ONLY Drug Test
ONLY Alcohol and
Drug Test Not Tested % Tested Total Drivers
2008 30 5 402 275 61.4% 712
2009 37 0 369 227 64.1% 633
2010 22 1 377 219 64.6% 619
2011 36 0 344 226 62.7% 606
2012 21 0 345 225 61.9% 591
2013 7 0 373 212 64.2% 592
2014 5 1 342 275 55.9% 623
2015 12 0 396 359 53.2% 767
20162 9 0 416 342 55.4% 767
Total 179 7 3,364 2360 60.1% 5,910
Table 5: Toxicology Outcomes of Drivers in Fatal Crashes by Year
Total Drivers
Alcohol and Drug Test
Positive for Alcohol or Drugs
% of Tested Drivers Positive
% of Total Drivers Positive
2008 712 402 252 62.7% 35.4%
2009 633 369 236 64.0% 37.3%
2010 619 377 231 61.3% 37.3%
2011 606 344 191 55.5% 31.5%
2012 591 345 196 56.8% 33.2%
2013 592 373 225 60.3% 38.0%
2014 623 342 225 65.8% 36.1%
2015 767 396 248 62.6% 32.3%
20162 767 416 269 64.7% 35.1%
Total 5,910 3,364 2,073 61.6% 35.1%
For the remainder of this report, only drivers that were tested for both alcohol and drugs are included.
Toxicology Outcomes of Drivers in Fatal Crashes
From 2008-2016, more than one-third of drivers in fatal crashes were positive for alcohol or drugs.
During this time period, drivers in fatal crashes testing positive for both alcohol and drugs or multiple
drugs (poly-drug drivers) have increased. Table 6 categorizes fatal crash involved drivers into mutually
exclusive groups (meaning each driver is counted in only one category), based on alcohol and drug
outcomes.
2 At the time of this analysis, data for 2016 was still preliminary but complete.
- 12 -
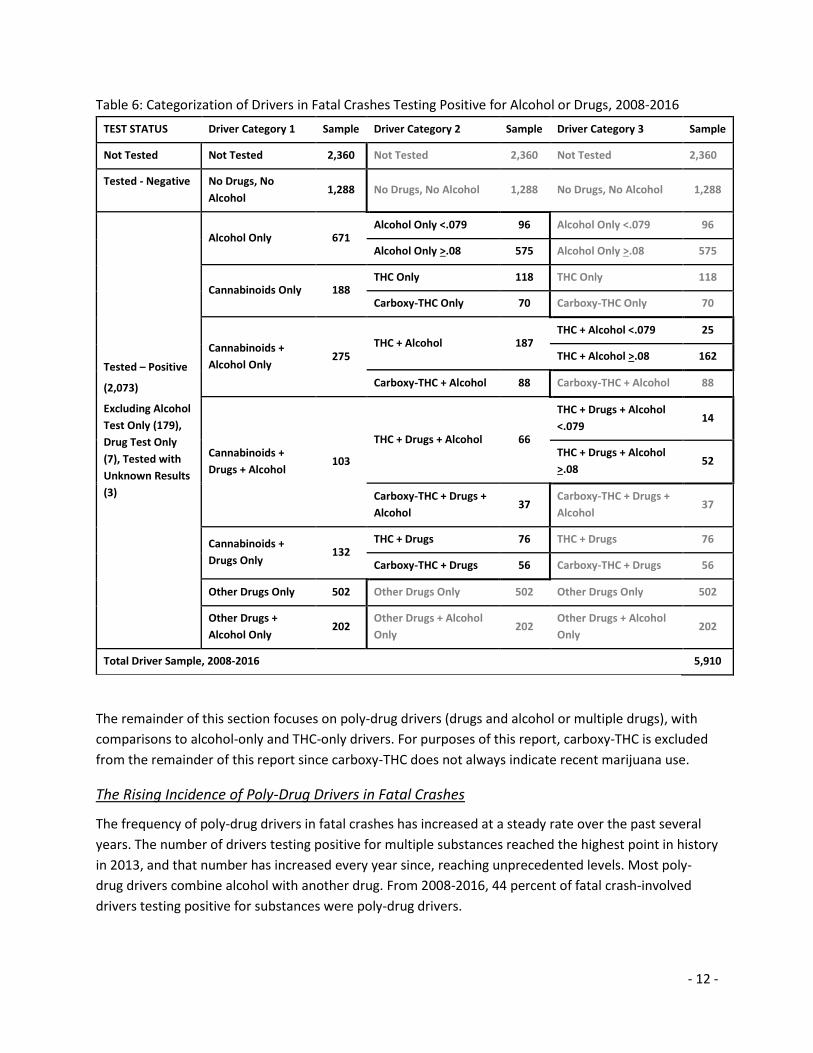
Table 6: Categorization of Drivers in Fatal Crashes Testing Positive for Alcohol or Drugs, 2008-2016
TEST STATUS Driver Category 1 Sample Driver Category 2 Sample Driver Category 3 Sample
Not Tested Not Tested 2,360 Not Tested 2,360 Not Tested 2,360
Tested - Negative No Drugs, No
Alcohol 1,288 No Drugs, No Alcohol 1,288 No Drugs, No Alcohol 1,288
Tested – Positive
(2,073)
Excluding Alcohol
Test Only (179),
Drug Test Only
(7), Tested with
Unknown Results
(3)
Alcohol Only 671 Alcohol Only <.079 96 Alcohol Only <.079 96
Alcohol Only >.08 575 Alcohol Only >.08 575
Cannabinoids Only 188 THC Only 118 THC Only 118
Carboxy-THC Only 70 Carboxy-THC Only 70
Cannabinoids +
Alcohol Only 275
THC + Alcohol 187 THC + Alcohol <.079 25
THC + Alcohol >.08 162
Carboxy-THC + Alcohol 88 Carboxy-THC + Alcohol 88
Cannabinoids +
Drugs + Alcohol 103
THC + Drugs + Alcohol 66
THC + Drugs + Alcohol
<.079 14
THC + Drugs + Alcohol
>.08 52
Carboxy-THC + Drugs +
Alcohol 37
Carboxy-THC + Drugs +
Alcohol 37
Cannabinoids +
Drugs Only 132
THC + Drugs 76 THC + Drugs 76
Carboxy-THC + Drugs 56 Carboxy-THC + Drugs 56
Other Drugs Only 502 Other Drugs Only 502 Other Drugs Only 502
Other Drugs +
Alcohol Only 202
Other Drugs + Alcohol
Only 202
Other Drugs + Alcohol
Only 202
Total Driver Sample, 2008-2016 5,910
The remainder of this section focuses on poly-drug drivers (drugs and alcohol or multiple drugs), with
comparisons to alcohol-only and THC-only drivers. For purposes of this report, carboxy-THC is excluded
from the remainder of this report since carboxy-THC does not always indicate recent marijuana use.
The Rising Incidence of Poly-Drug Drivers in Fatal Crashes
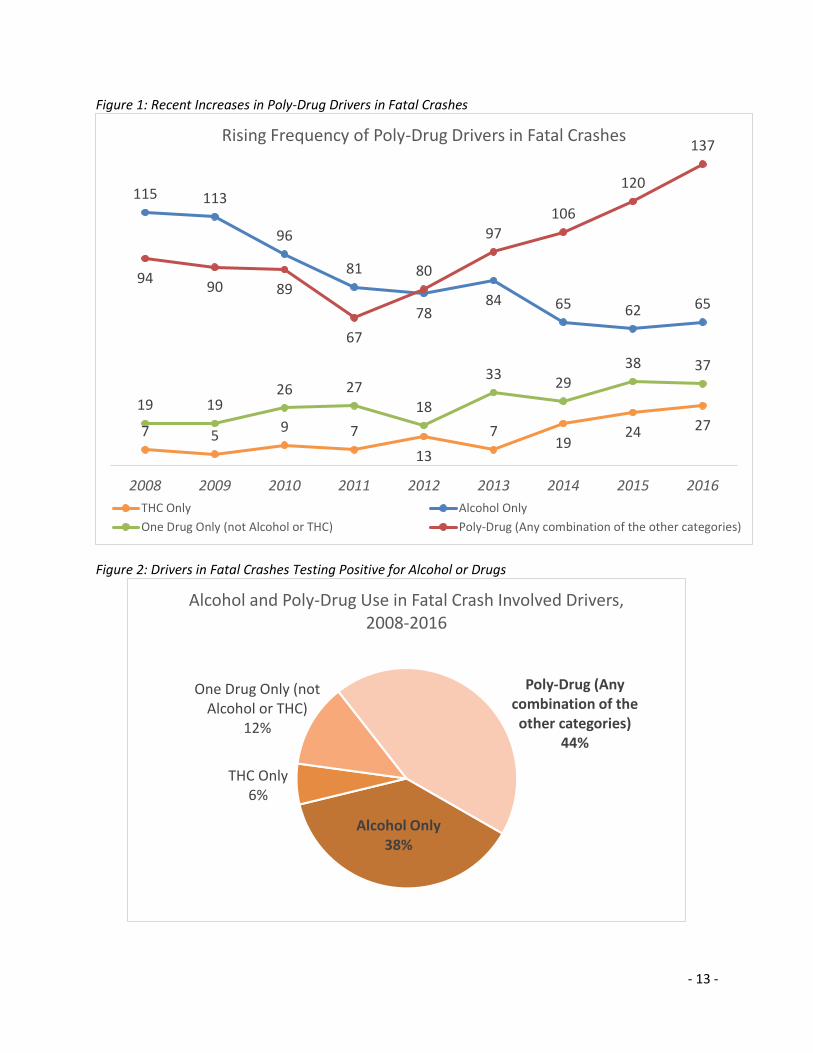
The frequency of poly-drug drivers in fatal crashes has increased at a steady rate over the past several
years. The number of drivers testing positive for multiple substances reached the highest point in history
in 2013, and that number has increased every year since, reaching unprecedented levels. Most poly-
drug drivers combine alcohol with another drug. From 2008-2016, 44 percent of fatal crash-involved
drivers testing positive for substances were poly-drug drivers.
- 13 -
Figure 1: Recent Increases in Poly-Drug Drivers in Fatal Crashes
Figure 2: Drivers in Fatal Crashes Testing Positive for Alcohol or Drugs
7 59 7
13
719
24 27
115 113
96
81
7884 65 62 65
19 1926 27
18
3329
38 37
9490 89
67
80
97106
120
137
2008 2009 2010 2011 2012 2013 2014 2015 2016
Rising Frequency of Poly-Drug Drivers in Fatal Crashes
THC Only Alcohol Only
One Drug Only (not Alcohol or THC) Poly-Drug (Any combination of the other categories)
Alcohol Only38%
THC Only6%
One Drug Only (not Alcohol or THC)
12%
Poly-Drug (Any combination of the other categories)
44%
Alcohol and Poly-Drug Use in Fatal Crash Involved Drivers, 2008-2016
- 14 -
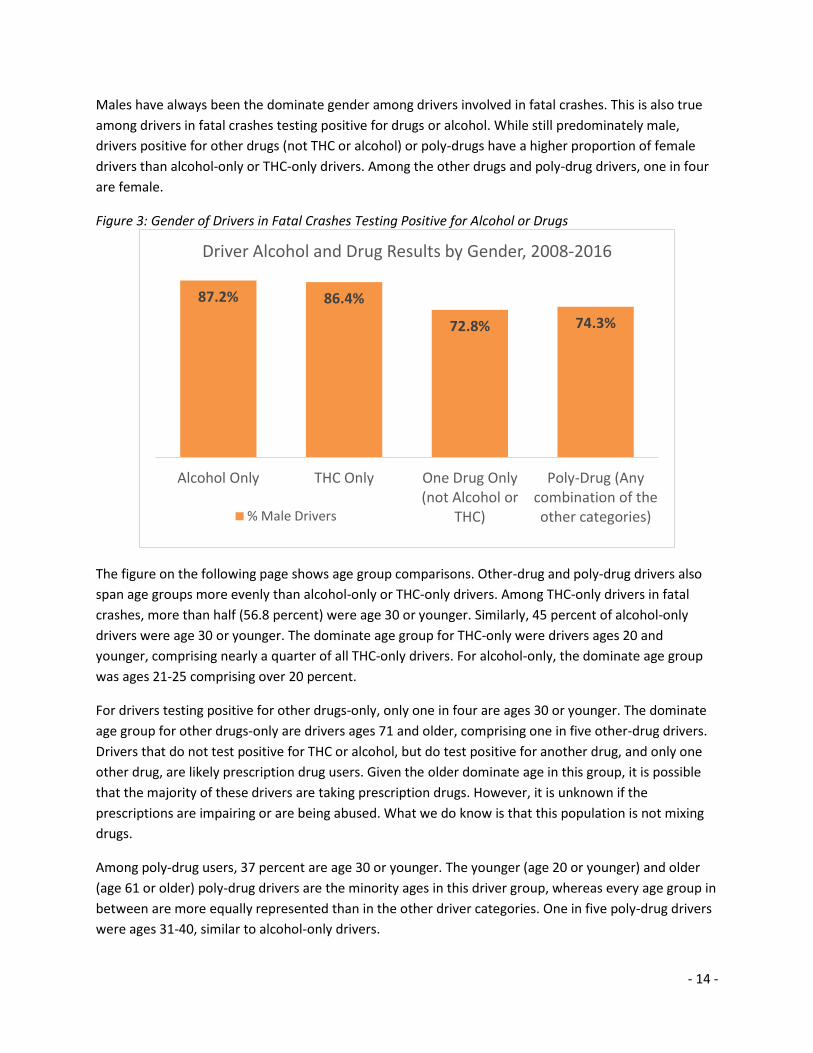
Males have always been the dominate gender among drivers involved in fatal crashes. This is also true
among drivers in fatal crashes testing positive for drugs or alcohol. While still predominately male,
drivers positive for other drugs (not THC or alcohol) or poly-drugs have a higher proportion of female
drivers than alcohol-only or THC-only drivers. Among the other drugs and poly-drug drivers, one in four
are female.
Figure 3: Gender of Drivers in Fatal Crashes Testing Positive for Alcohol or Drugs
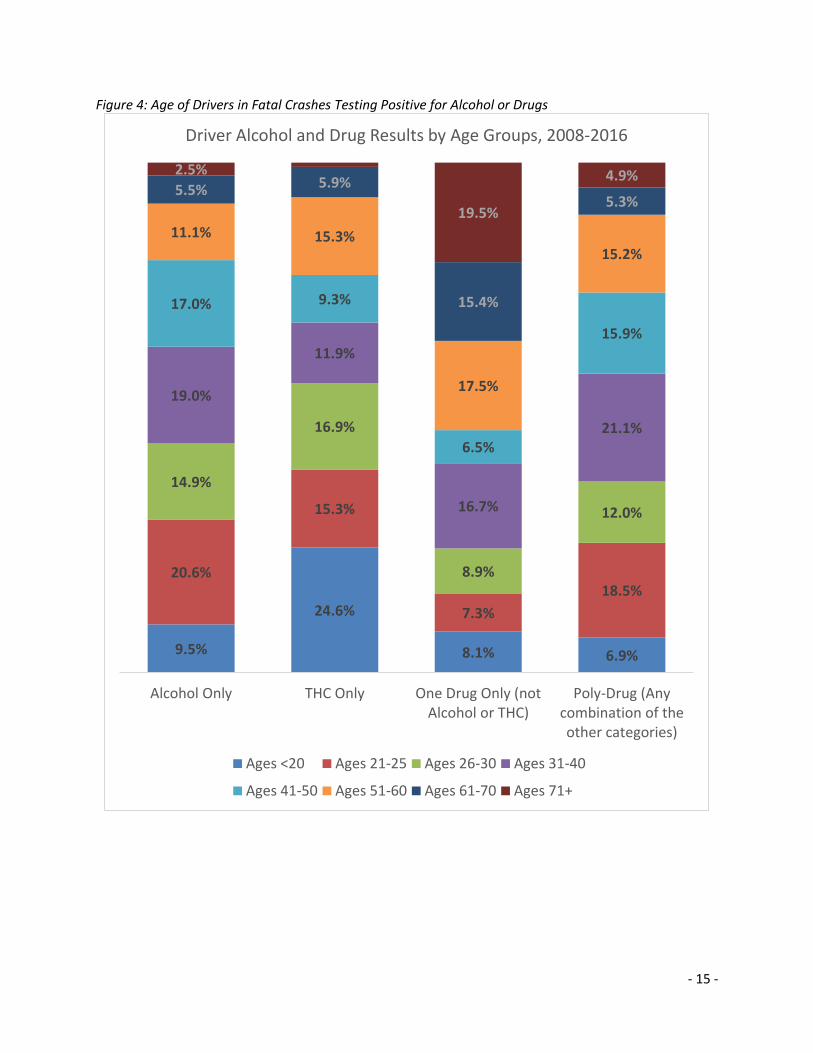
The figure on the following page shows age group comparisons. Other-drug and poly-drug drivers also
span age groups more evenly than alcohol-only or THC-only drivers. Among THC-only drivers in fatal
crashes, more than half (56.8 percent) were age 30 or younger. Similarly, 45 percent of alcohol-only
drivers were age 30 or younger. The dominate age group for THC-only were drivers ages 20 and
younger, comprising nearly a quarter of all THC-only drivers. For alcohol-only, the dominate age group
was ages 21-25 comprising over 20 percent.
For drivers testing positive for other drugs-only, only one in four are ages 30 or younger. The dominate
age group for other drugs-only are drivers ages 71 and older, comprising one in five other-drug drivers.
Drivers that do not test positive for THC or alcohol, but do test positive for another drug, and only one
other drug, are likely prescription drug users. Given the older dominate age in this group, it is possible
that the majority of these drivers are taking prescription drugs. However, it is unknown if the
prescriptions are impairing or are being abused. What we do know is that this population is not mixing
drugs.
Among poly-drug users, 37 percent are age 30 or younger. The younger (age 20 or younger) and older
(age 61 or older) poly-drug drivers are the minority ages in this driver group, whereas every age group in
between are more equally represented than in the other driver categories. One in five poly-drug drivers
were ages 31-40, similar to alcohol-only drivers.
87.2% 86.4%
72.8% 74.3%
Alcohol Only THC Only One Drug Only(not Alcohol or
THC)
Poly-Drug (Anycombination of theother categories)
Driver Alcohol and Drug Results by Gender, 2008-2016
% Male Drivers
- 15 -
Figure 4: Age of Drivers in Fatal Crashes Testing Positive for Alcohol or Drugs
9.5%
24.6%
8.1% 6.9%
20.6%
15.3%
7.3%
18.5%
14.9%
16.9%
8.9%
12.0%
19.0%
11.9%
16.7%
21.1%
17.0% 9.3%
6.5%
15.9%
11.1% 15.3%
17.5%
15.2%
5.5% 5.9%
15.4%
5.3%
2.5%
19.5%
4.9%
Alcohol Only THC Only One Drug Only (notAlcohol or THC)
Poly-Drug (Anycombination of theother categories)
Driver Alcohol and Drug Results by Age Groups, 2008-2016
Ages <20 Ages 21-25 Ages 26-30 Ages 31-40
Ages 41-50 Ages 51-60 Ages 61-70 Ages 71+
- 16 -
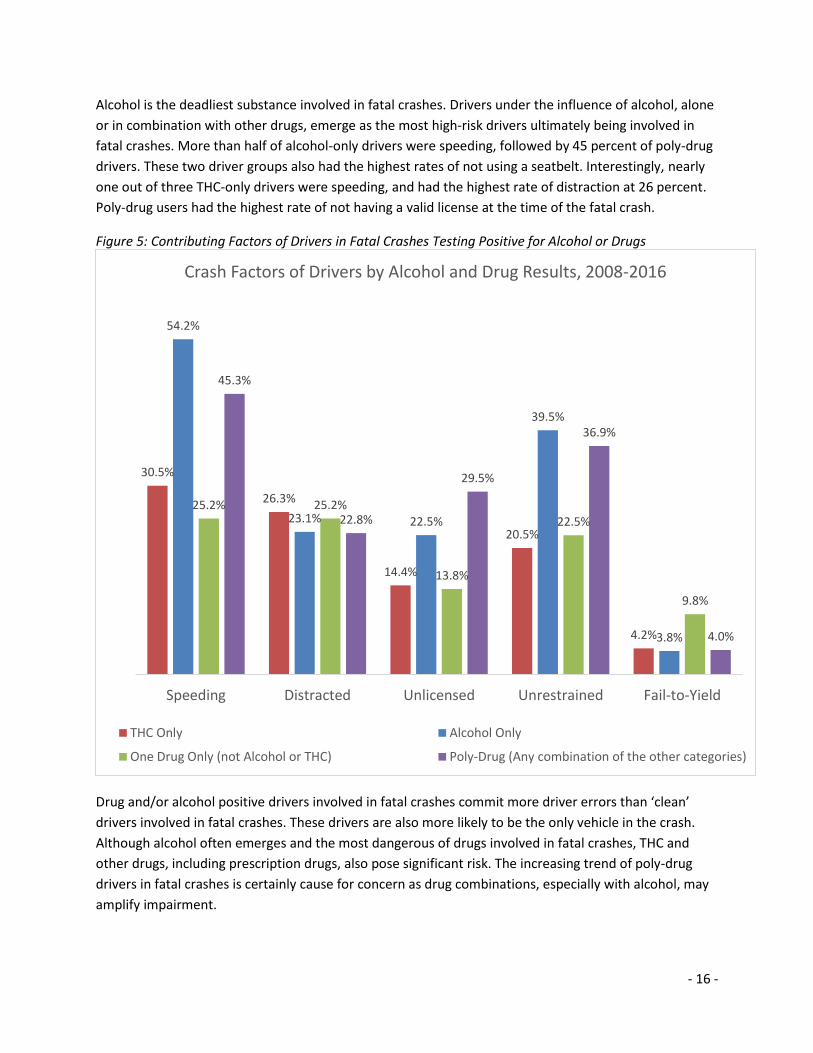
Alcohol is the deadliest substance involved in fatal crashes. Drivers under the influence of alcohol, alone
or in combination with other drugs, emerge as the most high-risk drivers ultimately being involved in
fatal crashes. More than half of alcohol-only drivers were speeding, followed by 45 percent of poly-drug
drivers. These two driver groups also had the highest rates of not using a seatbelt. Interestingly, nearly
one out of three THC-only drivers were speeding, and had the highest rate of distraction at 26 percent.
Poly-drug users had the highest rate of not having a valid license at the time of the fatal crash.
Figure 5: Contributing Factors of Drivers in Fatal Crashes Testing Positive for Alcohol or Drugs
Drug and/or alcohol positive drivers involved in fatal crashes commit more driver errors than ‘clean’
drivers involved in fatal crashes. These drivers are also more likely to be the only vehicle in the crash.
Although alcohol often emerges and the most dangerous of drugs involved in fatal crashes, THC and
other drugs, including prescription drugs, also pose significant risk. The increasing trend of poly-drug
drivers in fatal crashes is certainly cause for concern as drug combinations, especially with alcohol, may
amplify impairment.
30.5%
26.3%
14.4%
20.5%
4.2%
54.2%
23.1% 22.5%
39.5%
3.8%
25.2% 25.2%
13.8%
22.5%
9.8%
45.3%
22.8%
29.5%
36.9%
4.0%
Speeding Distracted Unlicensed Unrestrained Fail-to-Yield
Crash Factors of Drivers by Alcohol and Drug Results, 2008-2016
THC Only Alcohol Only
One Drug Only (not Alcohol or THC) Poly-Drug (Any combination of the other categories)
- 17 -
Washington’s Roadside Surveys 2014-2015
In partnership with NHTSA and the Pacific Institute for Research and Evaluation (PIRE), a roadside survey
modeling the National Roadside Survey (NRS) was conducted in Washington State. The survey collected
biological (blood and oral fluid) samples and self-report survey information from drivers randomly
selected from active traffic flow. This information was collected in three waves; one month prior to
retail sales, six months following retail sales (the opening of the first retail store for recreational
purchases), and twelve months following retail sales. More information about this effort and the full
results of the analysis of the biological samples can be found by reviewing Ramirez et al. (2016).
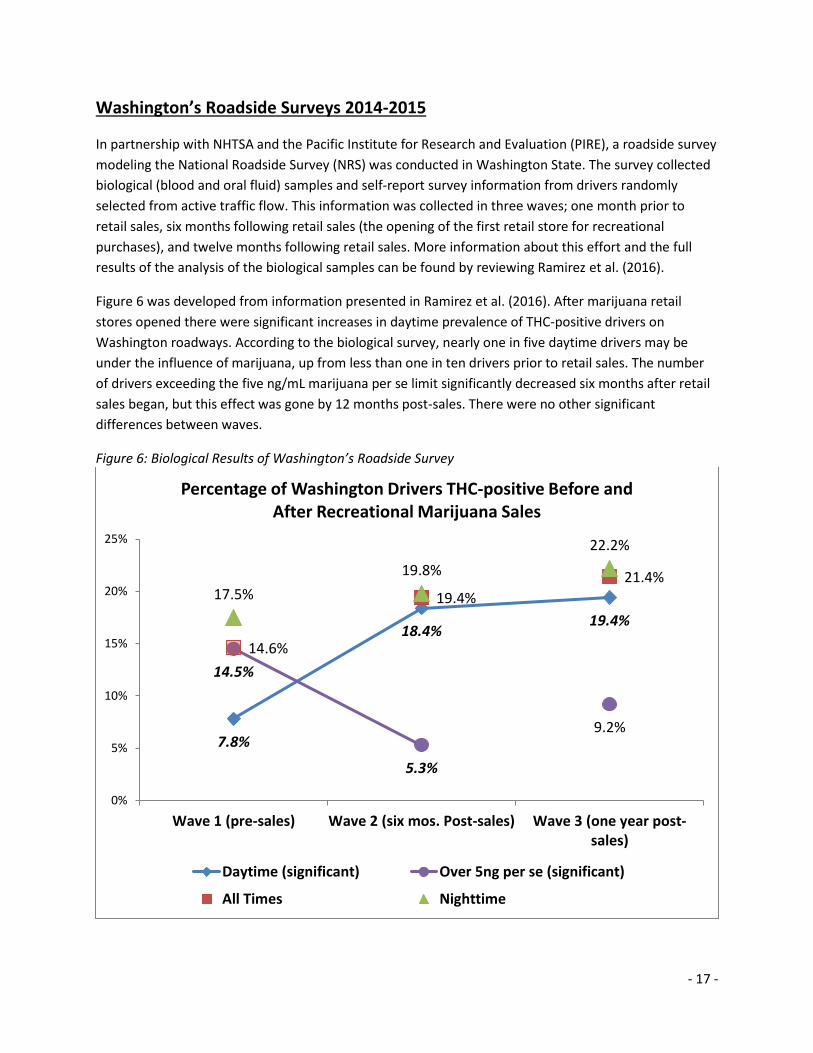
Figure 6 was developed from information presented in Ramirez et al. (2016). After marijuana retail
stores opened there were significant increases in daytime prevalence of THC-positive drivers on
Washington roadways. According to the biological survey, nearly one in five daytime drivers may be
under the influence of marijuana, up from less than one in ten drivers prior to retail sales. The number
of drivers exceeding the five ng/mL marijuana per se limit significantly decreased six months after retail
sales began, but this effect was gone by 12 months post-sales. There were no other significant
differences between waves.
Figure 6: Biological Results of Washington’s Roadside Survey
7.8%
18.4%19.4%
14.5%
5.3%
9.2%
14.6%
19.4%
21.4%17.5%
19.8%
22.2%
0%
5%
10%
15%
20%
25%
Wave 1 (pre-sales) Wave 2 (six mos. Post-sales) Wave 3 (one year post-sales)
Percentage of Washington Drivers THC-positive Before and After Recreational Marijuana Sales
Daytime (significant) Over 5ng per se (significant)
All Times Nighttime
- 18 -
Self-report Marijuana Survey
The Washington Traffic Safety Commission, in partnership with analysts from PIRE, the AAA Foundation
for Traffic Safety, and the Insurance Institute for Highway Safety, analyzed the self-report marijuana
survey information collected as part of the roadside survey. The full marijuana survey is available in
Appendix B. Analyses of this survey were not included in the Ramirez et al. (2016) report. This team of
analysts applied a post-stratification weighting adjustment to the design weights calculated for analysis
of the biological specimens. The weight adjustment was based on Washington licensed driver
demographics for age and gender. This adjustment provided greater generalizability to the licensed
driver population in Washington. This weighting method is described fully in Appendix C.
Initial analyses of the self-report survey did not reveal any significant changes in self-reported
information by wave. Therefore, the data was combined into a single sample with sufficient sample sizes
to perform demographic analyses. Those results are presented in this section. The following figures
show the weighted responses to the self-report marijuana survey collected as part of Washington’s
roadside survey. Only noteworthy outcomes by age, gender, and education level are presented.
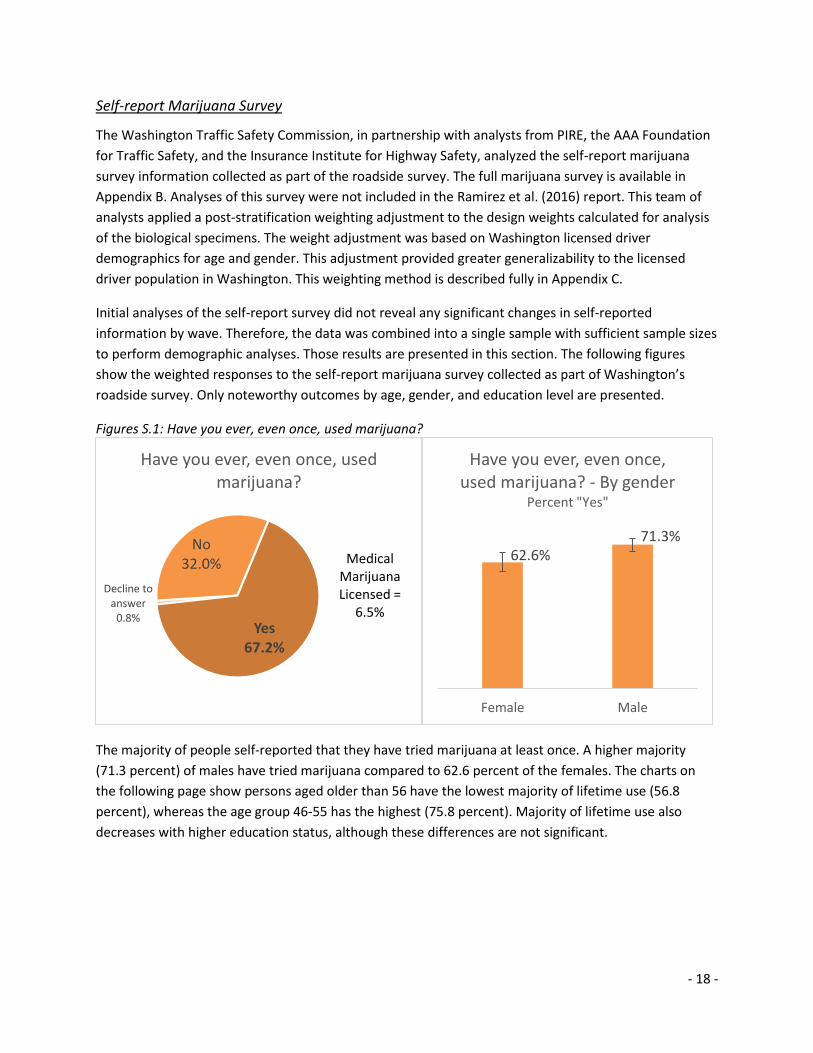
Figures S.1: Have you ever, even once, used marijuana?
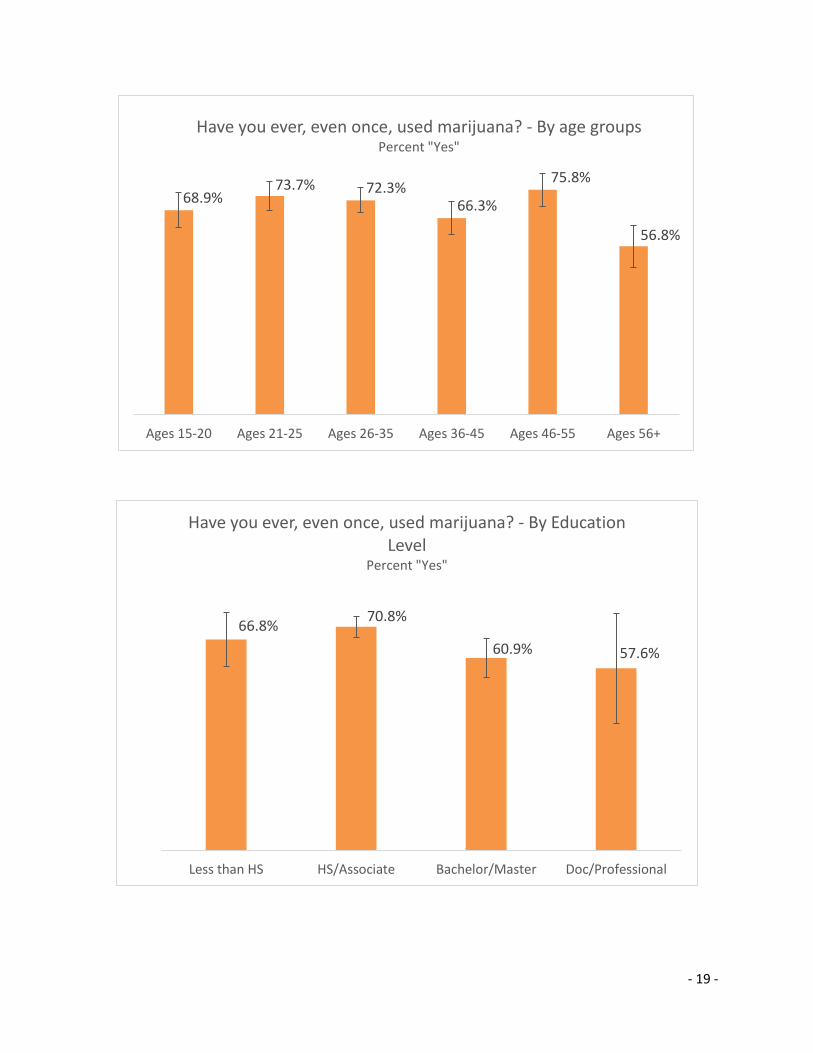
The majority of people self-reported that they have tried marijuana at least once. A higher majority
(71.3 percent) of males have tried marijuana compared to 62.6 percent of the females. The charts on
the following page show persons aged older than 56 have the lowest majority of lifetime use (56.8
percent), whereas the age group 46-55 has the highest (75.8 percent). Majority of lifetime use also
decreases with higher education status, although these differences are not significant.
Decline to answer
0.8%
No32.0%
Yes67.2%
Have you ever, even once, used marijuana?
Medical Marijuana Licensed =
6.5%
62.6%71.3%
Female Male
Have you ever, even once, used marijuana? - By gender
Percent "Yes"
- 19 -
68.9%73.7% 72.3%
66.3%
75.8%
56.8%
Ages 15-20 Ages 21-25 Ages 26-35 Ages 36-45 Ages 46-55 Ages 56+
Have you ever, even once, used marijuana? - By age groupsPercent "Yes"
66.8%70.8%
60.9% 57.6%
Less than HS HS/Associate Bachelor/Master Doc/Professional
Have you ever, even once, used marijuana? - By Education Level
Percent "Yes"
- 20 -
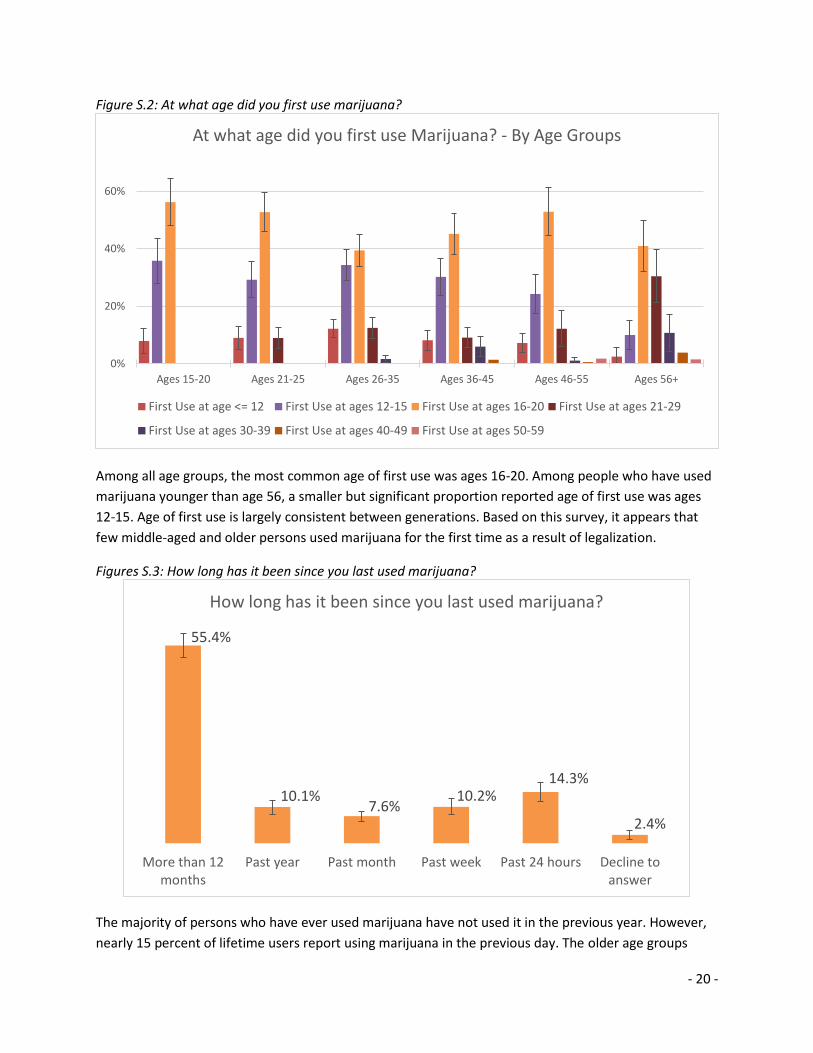
Figure S.2: At what age did you first use marijuana?
Among all age groups, the most common age of first use was ages 16-20. Among people who have used
marijuana younger than age 56, a smaller but significant proportion reported age of first use was ages
12-15. Age of first use is largely consistent between generations. Based on this survey, it appears that
few middle-aged and older persons used marijuana for the first time as a result of legalization.
Figures S.3: How long has it been since you last used marijuana?
The majority of persons who have ever used marijuana have not used it in the previous year. However,
nearly 15 percent of lifetime users report using marijuana in the previous day. The older age groups
0%
20%
40%
60%
Ages 15-20 Ages 21-25 Ages 26-35 Ages 36-45 Ages 46-55 Ages 56+
At what age did you first use Marijuana? - By Age Groups
First Use at age <= 12 First Use at ages 12-15 First Use at ages 16-20 First Use at ages 21-29
First Use at ages 30-39 First Use at ages 40-49 First Use at ages 50-59
55.4%
10.1%7.6%
10.2%14.3%
2.4%
More than 12months
Past year Past month Past week Past 24 hours Decline toanswer
How long has it been since you last used marijuana?
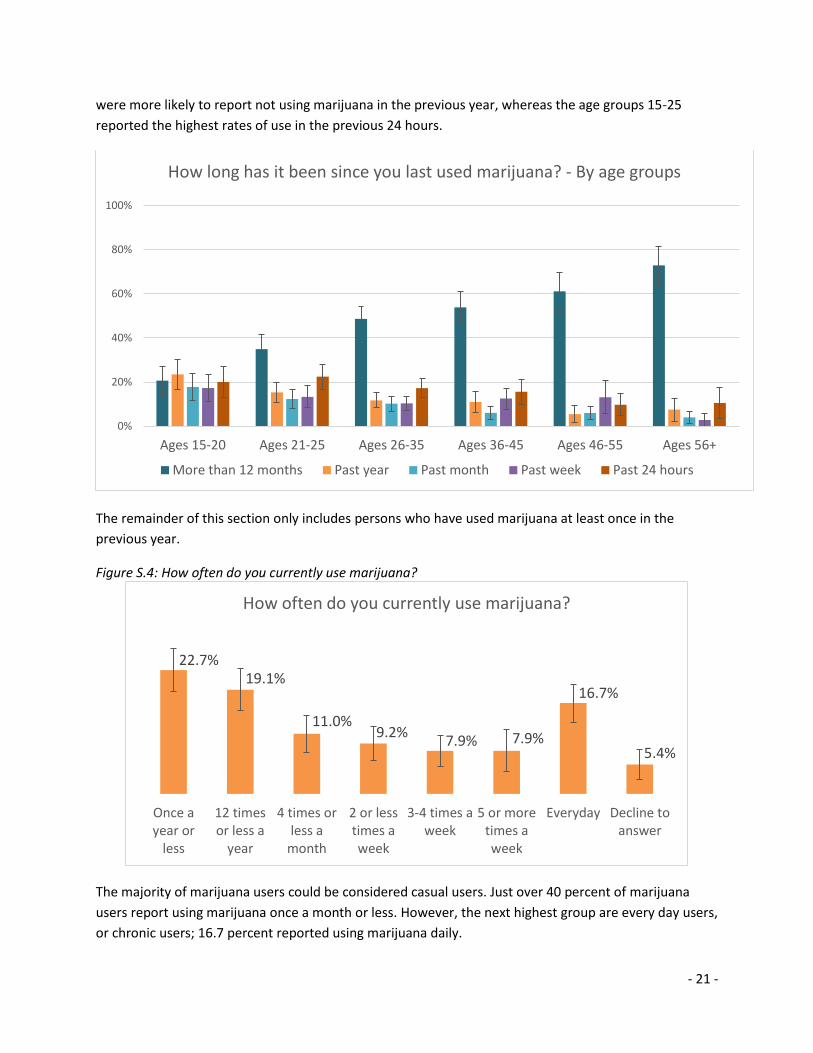
- 21 -
were more likely to report not using marijuana in the previous year, whereas the age groups 15-25
reported the highest rates of use in the previous 24 hours.
The remainder of this section only includes persons who have used marijuana at least once in the
previous year.
Figure S.4: How often do you currently use marijuana?
The majority of marijuana users could be considered casual users. Just over 40 percent of marijuana
users report using marijuana once a month or less. However, the next highest group are every day users,
or chronic users; 16.7 percent reported using marijuana daily.
0%
20%
40%
60%
80%
100%
Ages 15-20 Ages 21-25 Ages 26-35 Ages 36-45 Ages 46-55 Ages 56+
How long has it been since you last used marijuana? - By age groups
More than 12 months Past year Past month Past week Past 24 hours
22.7%19.1%
11.0%9.2%
7.9% 7.9%
16.7%
5.4%
Once ayear or
less
12 timesor less a
year
4 times orless a
month
2 or lesstimes aweek
3-4 times aweek
5 or moretimes aweek
Everyday Decline toanswer
How often do you currently use marijuana?
- 22 -
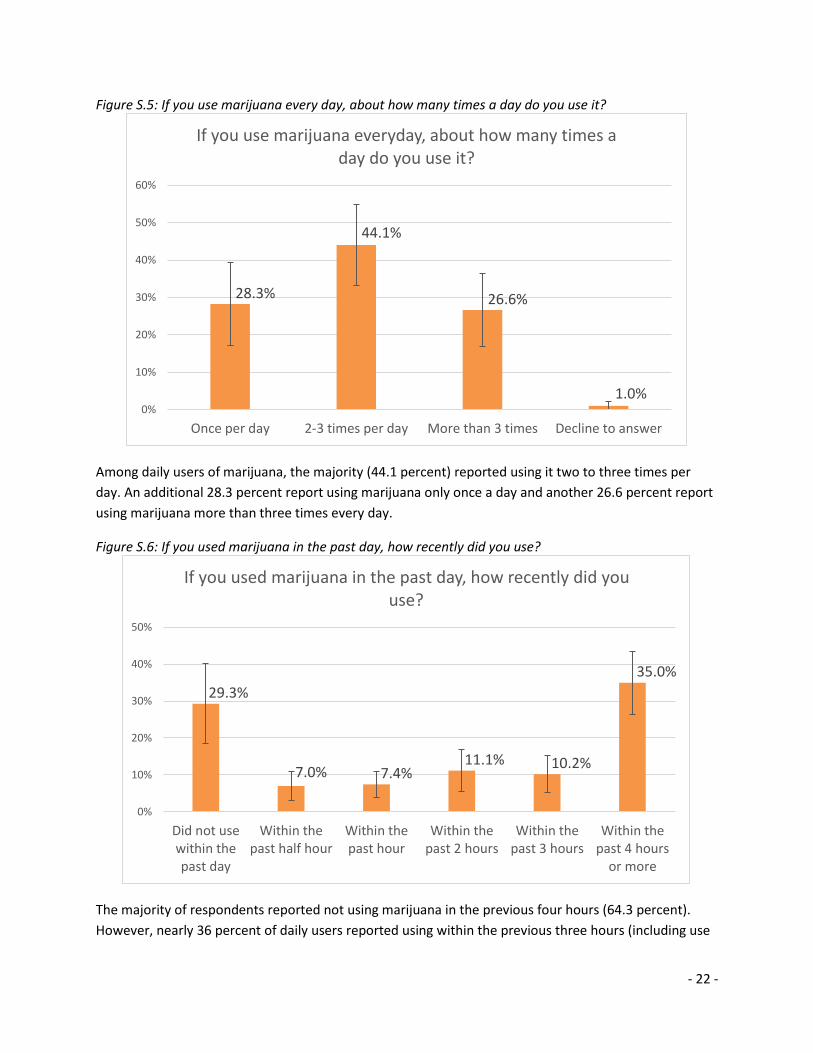
Figure S.5: If you use marijuana every day, about how many times a day do you use it?
Among daily users of marijuana, the majority (44.1 percent) reported using it two to three times per
day. An additional 28.3 percent report using marijuana only once a day and another 26.6 percent report
using marijuana more than three times every day.
Figure S.6: If you used marijuana in the past day, how recently did you use?
The majority of respondents reported not using marijuana in the previous four hours (64.3 percent).
However, nearly 36 percent of daily users reported using within the previous three hours (including use
28.3%
44.1%
26.6%
1.0%0%
10%
20%
30%
40%
50%
60%
Once per day 2-3 times per day More than 3 times Decline to answer
If you use marijuana everyday, about how many times a day do you use it?
29.3%
7.0% 7.4%11.1% 10.2%
35.0%
0%
10%
20%
30%
40%
50%
Did not usewithin thepast day
Within thepast half hour
Within thepast hour
Within thepast 2 hours
Within thepast 3 hours
Within thepast 4 hours
or more
If you used marijuana in the past day, how recently did you use?
- 23 -
in the past half hour, hour, two hours, and three hours in Figure S.6). All respondents were recruited
from the roadside, meaning they were all driving just before participating in the survey. Alarmingly, 7
percent reported use in the previous half hour, indicating some may have even been using marijuana
while driving. In fact, 39.1 percent of drivers admitted to driving within three hours of using marijuana at
least once in the previous year. Despite this admission, 58 percent of drivers also admit not driving due
to recent marijuana use.
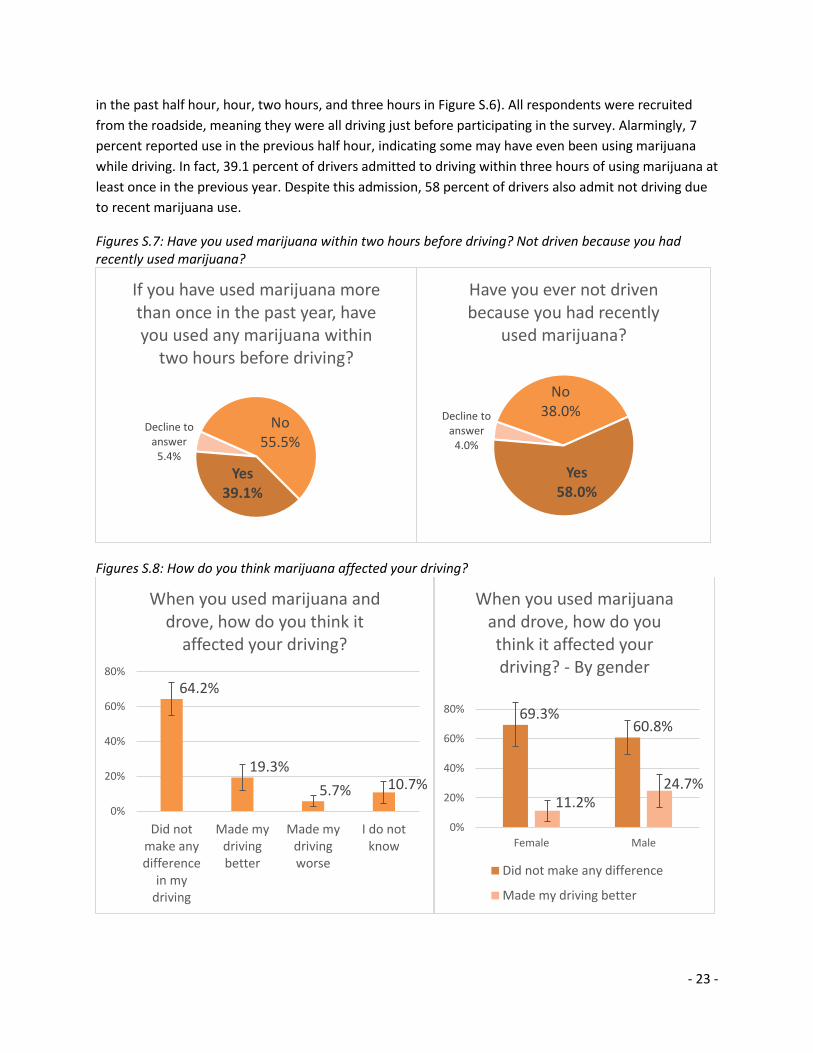
Figures S.7: Have you used marijuana within two hours before driving? Not driven because you had recently used marijuana?
Figures S.8: How do you think marijuana affected your driving?
Decline to answer
5.4%
No55.5%
Yes39.1%
If you have used marijuana more than once in the past year, have you used any marijuana within
two hours before driving?
Decline to answer
4.0%
No38.0%
Yes58.0%
Have you ever not driven because you had recently
used marijuana?
64.2%
19.3%
5.7% 10.7%
0%
20%
40%
60%
80%
Did notmake anydifference
in mydriving
Made mydrivingbetter
Made mydrivingworse
I do notknow
When you used marijuana and drove, how do you think it
affected your driving?
69.3%60.8%
11.2%24.7%
0%
20%
40%
60%
80%
Female Male
When you used marijuana and drove, how do you think it affected your driving? - By gender
Did not make any difference
Made my driving better
- 24 -
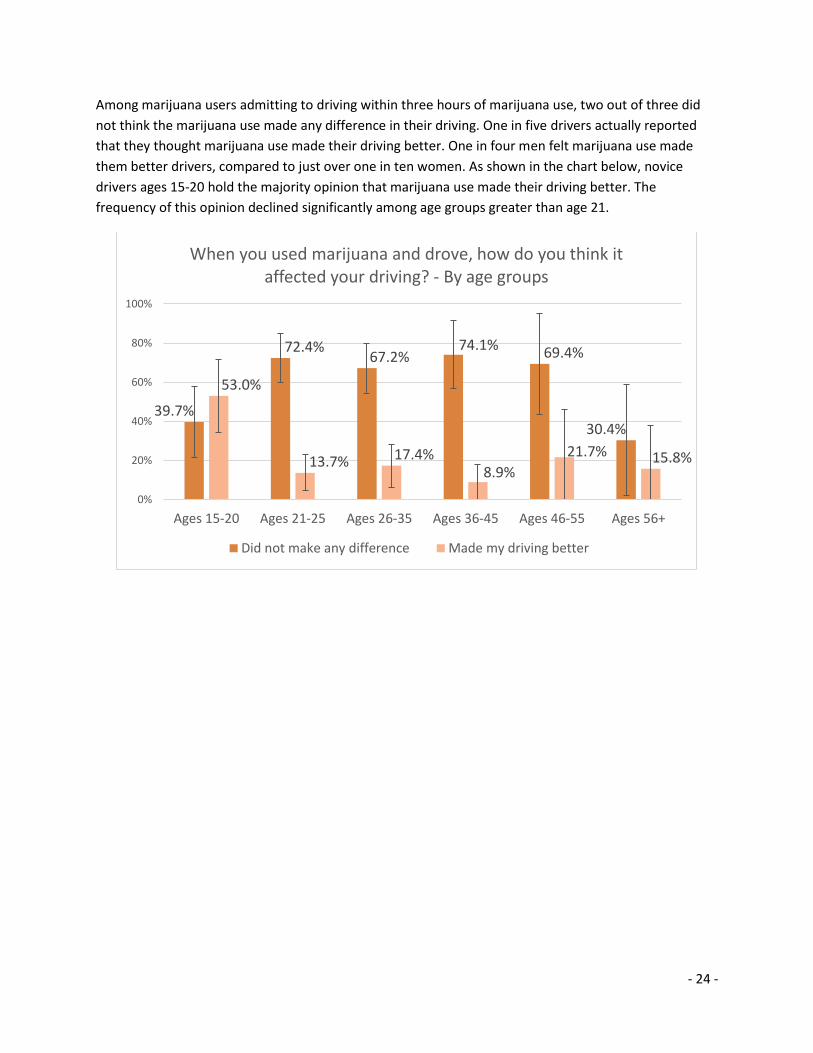
Among marijuana users admitting to driving within three hours of marijuana use, two out of three did
not think the marijuana use made any difference in their driving. One in five drivers actually reported
that they thought marijuana use made their driving better. One in four men felt marijuana use made
them better drivers, compared to just over one in ten women. As shown in the chart below, novice
drivers ages 15-20 hold the majority opinion that marijuana use made their driving better. The
frequency of this opinion declined significantly among age groups greater than age 21.
39.7%
72.4%67.2%
74.1% 69.4%
30.4%
53.0%
13.7% 17.4%8.9%
21.7% 15.8%
0%
20%
40%
60%
80%
100%
Ages 15-20 Ages 21-25 Ages 26-35 Ages 36-45 Ages 46-55 Ages 56+
When you used marijuana and drove, how do you think it affected your driving? - By age groups
Did not make any difference Made my driving better
- 25 -
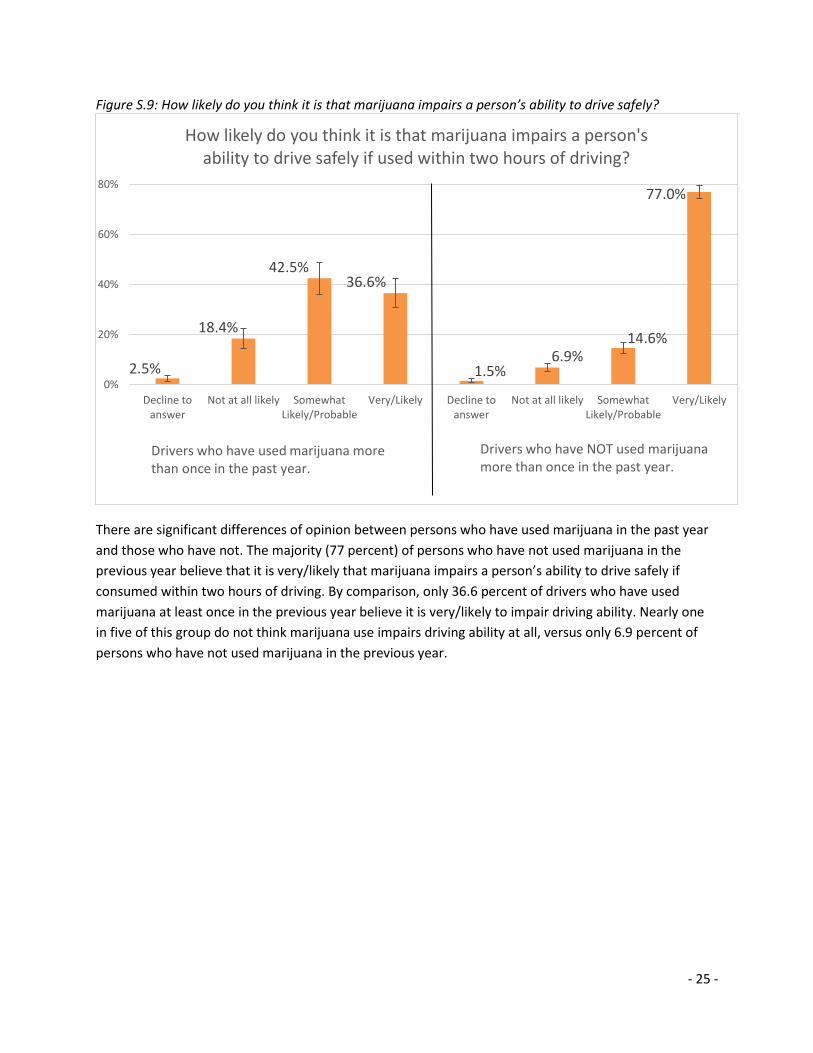
Figure S.9: How likely do you think it is that marijuana impairs a person’s ability to drive safely?
There are significant differences of opinion between persons who have used marijuana in the past year
and those who have not. The majority (77 percent) of persons who have not used marijuana in the
previous year believe that it is very/likely that marijuana impairs a person’s ability to drive safely if
consumed within two hours of driving. By comparison, only 36.6 percent of drivers who have used
marijuana at least once in the previous year believe it is very/likely to impair driving ability. Nearly one
in five of this group do not think marijuana use impairs driving ability at all, versus only 6.9 percent of
persons who have not used marijuana in the previous year.
2.5%
18.4%
42.5%36.6%
1.5%6.9%
14.6%
77.0%
0%
20%
40%
60%
80%
Decline toanswer
Not at all likely SomewhatLikely/Probable
Very/Likely Decline toanswer
Not at all likely SomewhatLikely/Probable
Very/Likely
How likely do you think it is that marijuana impairs a person's ability to drive safely if used within two hours of driving?
Drivers who have used marijuana more than once in the past year.
Drivers who have NOT used marijuana more than once in the past year.
- 26 -
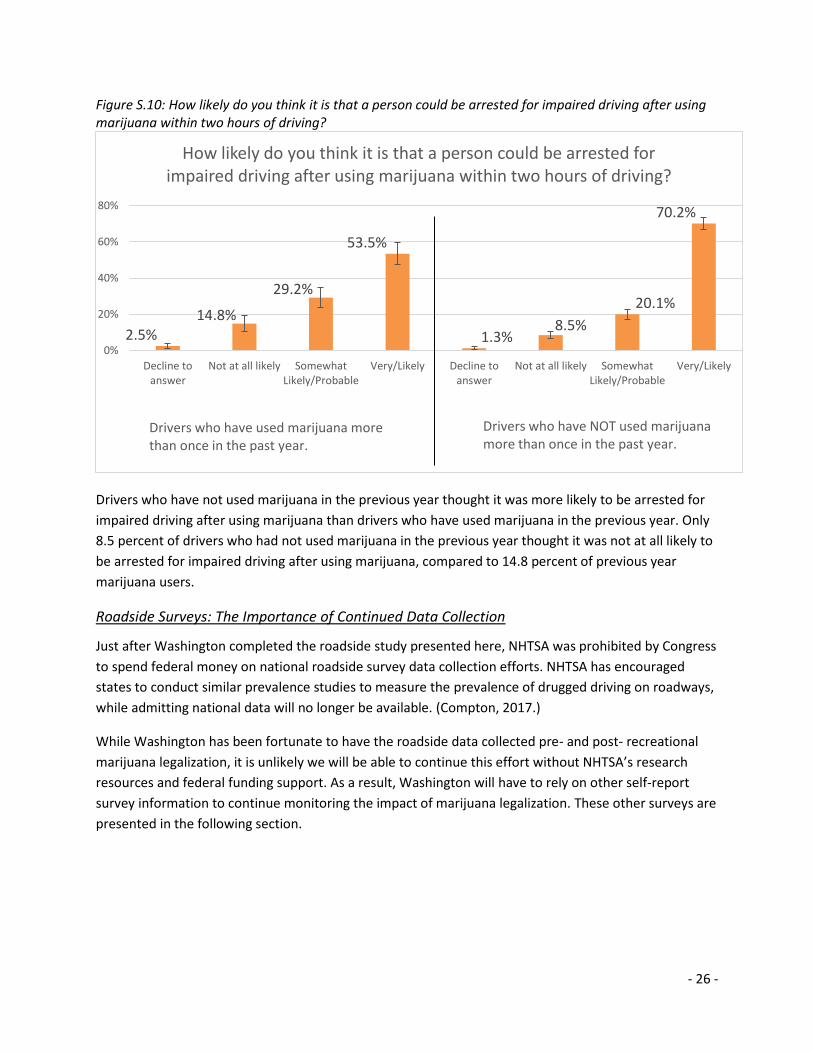
Figure S.10: How likely do you think it is that a person could be arrested for impaired driving after using marijuana within two hours of driving?
Drivers who have not used marijuana in the previous year thought it was more likely to be arrested for
impaired driving after using marijuana than drivers who have used marijuana in the previous year. Only
8.5 percent of drivers who had not used marijuana in the previous year thought it was not at all likely to
be arrested for impaired driving after using marijuana, compared to 14.8 percent of previous year
marijuana users.
Roadside Surveys: The Importance of Continued Data Collection
Just after Washington completed the roadside study presented here, NHTSA was prohibited by Congress
to spend federal money on national roadside survey data collection efforts. NHTSA has encouraged
states to conduct similar prevalence studies to measure the prevalence of drugged driving on roadways,
while admitting national data will no longer be available. (Compton, 2017.)
While Washington has been fortunate to have the roadside data collected pre- and post- recreational
marijuana legalization, it is unlikely we will be able to continue this effort without NHTSA’s research
resources and federal funding support. As a result, Washington will have to rely on other self-report
survey information to continue monitoring the impact of marijuana legalization. These other surveys are
presented in the following section.
2.5%14.8%
29.2%
53.5%
1.3%8.5%
20.1%
70.2%
0%
20%
40%
60%
80%
Decline toanswer
Not at all likely SomewhatLikely/Probable
Very/Likely Decline toanswer
Not at all likely SomewhatLikely/Probable
Very/Likely
How likely do you think it is that a person could be arrested for impaired driving after using marijuana within two hours of driving?
Drivers who have used marijuana more than once in the past year.
Drivers who have NOT used marijuana more than once in the past year.
- 27 -
Washington’s Self-Report Health Surveys
Behavioral Risk Factor Surveillance System (BRFSS)
Washington’s Behavioral Risk Factor Surveillance Survey (BRFSS) is managed by the Washington
Department of Health under a grant from the Centers for Disease Control and Prevention (CDC),
contributing to the national survey compiled by the CDC. The Washington BRFSS provides opportunity
for stakeholders to add additional questions to this survey, thereby taking advantage of large survey
sample sizes, robust weighting procedures, and multiple cross-analyses with other BRFSS modules. Since
2014, the WTSC has sponsored a traffic safety module on the BRFSS survey to include a question about
driving within three hours of using marijuana. If a respondent admits to using marijuana in the past 30
days, those respondents are then also asked about driving within three hours of marijuana use.
Table 7: WA BRFSS Traffic Safety Module Driving After Marijuana Use
If WA9.2 (MJPAST30) = 1 or WA9.4 (MEDMJ) = 1, continue, otherwise skip to next section
TSMJDRV WA13.5 Thinking about the last TWELVE months, did
you ever drive within approximately three hours after using marijuana or hashish?
1 = Yes 2 = No 7 = Don't Know 9 = Refused
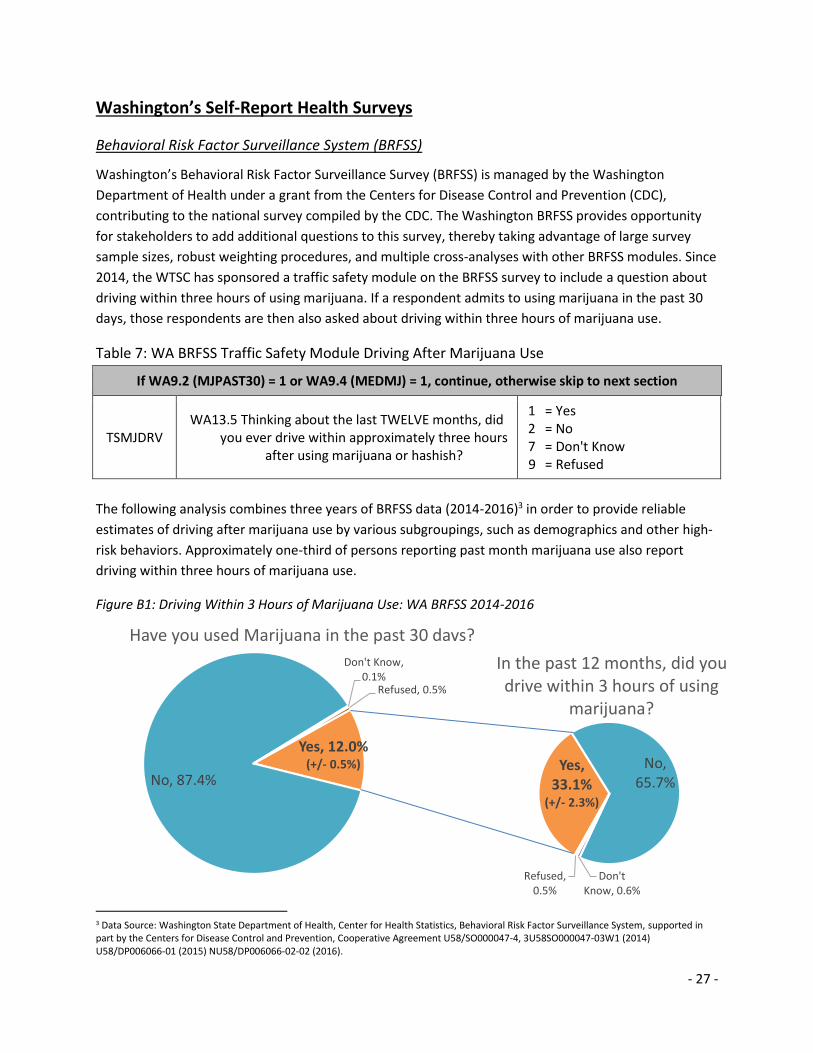
The following analysis combines three years of BRFSS data (2014-2016)3 in order to provide reliable
estimates of driving after marijuana use by various subgroupings, such as demographics and other high-
risk behaviors. Approximately one-third of persons reporting past month marijuana use also report
driving within three hours of marijuana use.
Figure B1: Driving Within 3 Hours of Marijuana Use: WA BRFSS 2014-2016
3 Data Source: Washington State Department of Health, Center for Health Statistics, Behavioral Risk Factor Surveillance System, supported in part by the Centers for Disease Control and Prevention, Cooperative Agreement U58/SO000047-4, 3U58SO000047-03W1 (2014) U58/DP006066-01 (2015) NU58/DP006066-02-02 (2016).
Yes, 12.0%(+/- 0.5%)
No, 87.4%
Don't Know, 0.1%
Refused, 0.5%
Have you used Marijuana in the past 30 days?
Yes, 33.1%
(+/- 2.3%)
No, 65.7%
Don't Know, 0.6%
Refused, 0.5%
In the past 12 months, did you drive within 3 hours of using
marijuana?
- 28 -
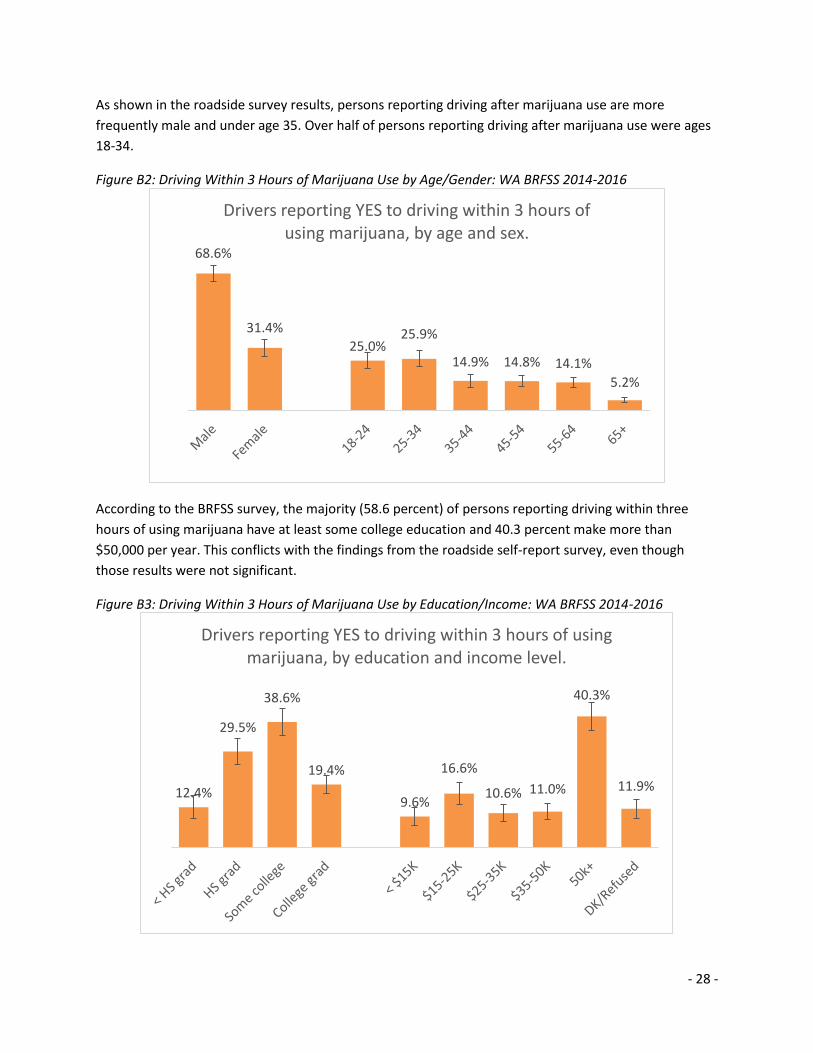
As shown in the roadside survey results, persons reporting driving after marijuana use are more
frequently male and under age 35. Over half of persons reporting driving after marijuana use were ages
18-34.
Figure B2: Driving Within 3 Hours of Marijuana Use by Age/Gender: WA BRFSS 2014-2016
According to the BRFSS survey, the majority (58.6 percent) of persons reporting driving within three
hours of using marijuana have at least some college education and 40.3 percent make more than
$50,000 per year. This conflicts with the findings from the roadside self-report survey, even though
those results were not significant.
Figure B3: Driving Within 3 Hours of Marijuana Use by Education/Income: WA BRFSS 2014-2016
68.6%
31.4%
25.0%25.9%
14.9% 14.8% 14.1%
5.2%
Drivers reporting YES to driving within 3 hours of using marijuana, by age and sex.
12.4%
29.5%
38.6%
19.4%
9.6%
16.6%
10.6% 11.0%
40.3%
11.9%
Drivers reporting YES to driving within 3 hours of using marijuana, by education and income level.
- 29 -
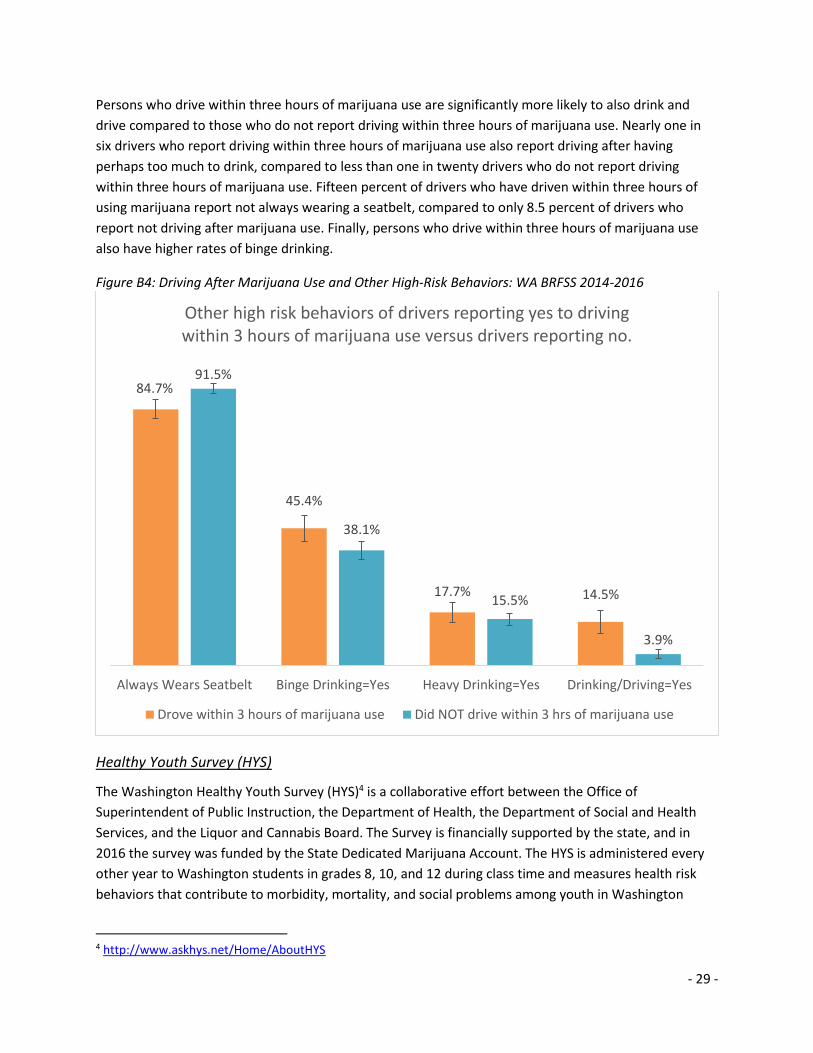
Persons who drive within three hours of marijuana use are significantly more likely to also drink and
drive compared to those who do not report driving within three hours of marijuana use. Nearly one in
six drivers who report driving within three hours of marijuana use also report driving after having
perhaps too much to drink, compared to less than one in twenty drivers who do not report driving
within three hours of marijuana use. Fifteen percent of drivers who have driven within three hours of
using marijuana report not always wearing a seatbelt, compared to only 8.5 percent of drivers who
report not driving after marijuana use. Finally, persons who drive within three hours of marijuana use
also have higher rates of binge drinking.
Figure B4: Driving After Marijuana Use and Other High-Risk Behaviors: WA BRFSS 2014-2016
Healthy Youth Survey (HYS)
The Washington Healthy Youth Survey (HYS)4 is a collaborative effort between the Office of
Superintendent of Public Instruction, the Department of Health, the Department of Social and Health
Services, and the Liquor and Cannabis Board. The Survey is financially supported by the state, and in
2016 the survey was funded by the State Dedicated Marijuana Account. The HYS is administered every
other year to Washington students in grades 8, 10, and 12 during class time and measures health risk
behaviors that contribute to morbidity, mortality, and social problems among youth in Washington
4 http://www.askhys.net/Home/AboutHYS
84.7%
45.4%
17.7% 14.5%
91.5%
38.1%
15.5%
3.9%
Always Wears Seatbelt Binge Drinking=Yes Heavy Drinking=Yes Drinking/Driving=Yes
Other high risk behaviors of drivers reporting yes to driving within 3 hours of marijuana use versus drivers reporting no.
Drove within 3 hours of marijuana use Did NOT drive within 3 hrs of marijuana use
- 30 -
State. In 2016, over 230,000 students from all 39 counties participated in HYS. In 2014, questions about
marijuana and driving were added to the survey. The HYS marijuana and driving questions were
modeled after the HYS drinking and driving questions.
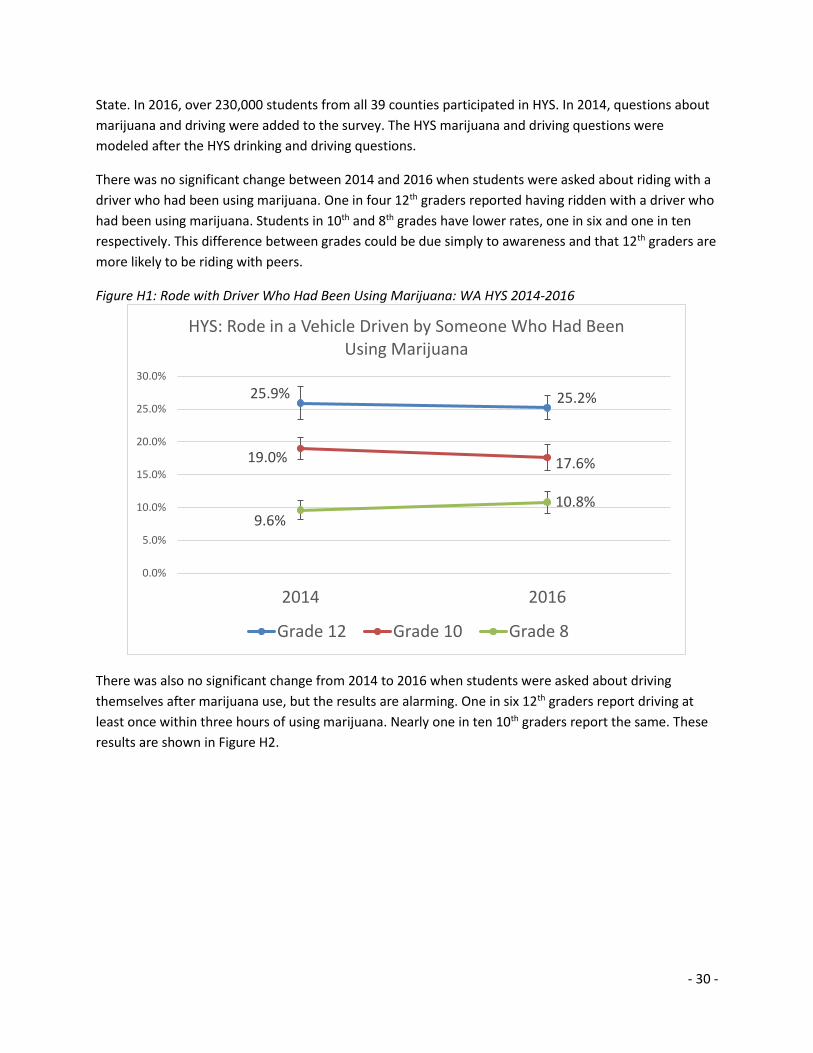
There was no significant change between 2014 and 2016 when students were asked about riding with a
driver who had been using marijuana. One in four 12th graders reported having ridden with a driver who
had been using marijuana. Students in 10th and 8th grades have lower rates, one in six and one in ten
respectively. This difference between grades could be due simply to awareness and that 12th graders are
more likely to be riding with peers.
Figure H1: Rode with Driver Who Had Been Using Marijuana: WA HYS 2014-2016
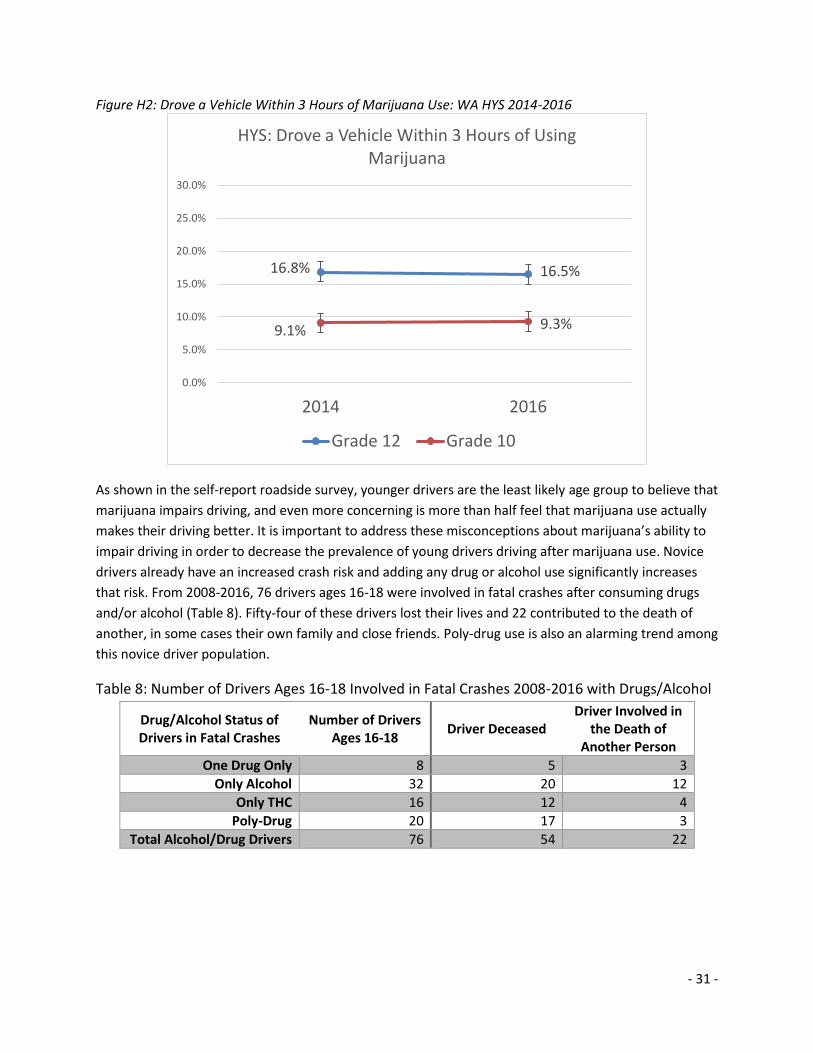
There was also no significant change from 2014 to 2016 when students were asked about driving
themselves after marijuana use, but the results are alarming. One in six 12th graders report driving at
least once within three hours of using marijuana. Nearly one in ten 10th graders report the same. These
results are shown in Figure H2.
25.9% 25.2%
19.0% 17.6%
9.6%10.8%
0.0%
5.0%
10.0%
15.0%
20.0%
25.0%
30.0%
2014 2016
HYS: Rode in a Vehicle Driven by Someone Who Had Been Using Marijuana
Grade 12 Grade 10 Grade 8
- 31 -
Figure H2: Drove a Vehicle Within 3 Hours of Marijuana Use: WA HYS 2014-2016
As shown in the self-report roadside survey, younger drivers are the least likely age group to believe that
marijuana impairs driving, and even more concerning is more than half feel that marijuana use actually
makes their driving better. It is important to address these misconceptions about marijuana’s ability to
impair driving in order to decrease the prevalence of young drivers driving after marijuana use. Novice
drivers already have an increased crash risk and adding any drug or alcohol use significantly increases
that risk. From 2008-2016, 76 drivers ages 16-18 were involved in fatal crashes after consuming drugs
and/or alcohol (Table 8). Fifty-four of these drivers lost their lives and 22 contributed to the death of
another, in some cases their own family and close friends. Poly-drug use is also an alarming trend among
this novice driver population.
Table 8: Number of Drivers Ages 16-18 Involved in Fatal Crashes 2008-2016 with Drugs/Alcohol
Drug/Alcohol Status of Drivers in Fatal Crashes
Number of Drivers Ages 16-18
Driver Deceased Driver Involved in
the Death of Another Person
One Drug Only 8 5 3
Only Alcohol 32 20 12
Only THC 16 12 4
Poly-Drug 20 17 3
Total Alcohol/Drug Drivers 76 54 22
16.8% 16.5%
9.1% 9.3%
0.0%
5.0%
10.0%
15.0%
20.0%
25.0%
30.0%
2014 2016
HYS: Drove a Vehicle Within 3 Hours of Using Marijuana
Grade 12 Grade 10
- 32 -
Summary and Conclusions
Poly-drug drivers, or drivers who have consumed two or more substances, have emerged as the most
common type of impaired drivers involved in Washington fatal crashes in just the past five years. In
2012, and for the first time, there were more poly-drug drivers involved in fatal crashes than drivers
who had consumed only alcohol, only marijuana, or only one other type of drug. Since 2012, the number
of poly-drug drivers involved in fatal crashes continues to increase every year at an average rate of 15
percent per year. This alarming trend comes at a time when traffic fatalities are on the rise, jumping
almost 20 percent in 2015 alone. The recent rise in traffic fatalities is most certainly due in part to an
increase in poly-drug use among drivers on Washington roadways. While alcohol is still the most
common substance mixed with other drugs among this high-risk group, alcohol-specific
countermeasures alone will not be sufficient for impacting this emerging issue. While it is still largely
unknown what role marijuana alone plays in fatal crash risk, it is clear that marijuana mixed with other
substances, most commonly alcohol, is contributing to fatal crashes in Washington State.
Information from several self-report surveys indicate that not only is driving after marijuana use quite
prevalent, many drivers do not believe that marijuana actually impairs driving. This misperception is
especially prevalent among young drivers who also use marijuana. More than half of drivers under the
age of 20 that report driving after recent marijuana use actually believe the marijuana use makes their
driving better. This is an especially dangerous opinion if, for example, a driver might use marijuana to
compensate for the consumption of another substance, such as alcohol, that clearly creates a driving
deficit. It is these poly-drug drivers that we see more and more of in fatal crashes every year.
Funding to implement traffic safety countermeasures to combat the increase in drugged driving is
limited as there are no specific federal programs addressing drugged driving like there is for alcohol
driving. National fatal crash data is a limited resource for studying drugged driving trends due to the
extreme variability between states in drug testing, reporting, and laboratory procedures (such as which
drugs are included on common screening panels and reporting thresholds for certain drugs). Now that
the National Roadside Surveys have been defunded, it will be harder than ever to track the evolution of
this deadly issue. Regardless, the Washington Traffic Safety Commission, along with our many state,
federal, and community partners, continue to develop innovative and new countermeasures and data
collection efforts to combat drugged driving within an environment of limited resources. While alcohol
driving very much remains a significant issue, the interplay of drugged driving must be equally
considered if we are ever to reach our goal of zero fatalities and serious injuries on Washington
roadways. This complex issue will require government, non-profit, corporate, and community response
to reverse a rapidly increasing trend.
- 33 -
Appendix A: Reference Summaries
Asbridge M, Hayden JA, & Cartwright JL (2012). Acute cannabis consumption and motor vehicle collision
risk: systematic review of observation studies and meta-analysis. British Medical Journal. 344:e536.
This systematic review and meta-analysis of nine studies (selected from a pool of just under
3,000 studies) regarding motor vehicle crash risk resulting from driver consumption of cannabis
found that driving under the influence of THC was associated with roughly a doubled risk of
crashing compared to controls (OR=1.92, 1.35-2.73). These studies included cohort designs,
case-control designs, and cross-sectional designs.
Baraona E, Abittan CS, Dohmen K, Moretti M, Pozzato G, Chayes ZW, Shaefer C, & Lieber CS (2001).
Gender differences in pharmacokinetics of alcohol. Alcoholism: Clinical and Experimental Research.
25:502-507.
This study investigated the possible source of gender differences in alcohol metabolism. It is
known that “for an equal alcohol intake, women develop higher blood alcohol levels than men”
and that women demonstrate “a faster rate of ethanol elimination” (502). One hour after a
‘standard fatty meal’ 22 male and 23 female subjects were randomly given, either orally (10%
solution) or intravenously (5% solution), an alcohol dose of 300 mg/kg body weight.
Biecheler M-B, Peytavin J-F, the SAM Group, Facy F, & Martineau H (2008). SAM survey on “drugs in
fatal accidents”: search of substances consumed and comparison between drivers involved under the
influence of alcohol or cannabis. Traffic Injury Prevention. 9:11-21.
To estimate the added culpability risk of combining alcohol with THC, this study relied on
complete and accurate alcohol and drug data, as required by law, for all drivers involved in
French fatal crashes. Culpability analysis and calculation of odds ratios revealed that culpable
drivers (cases) were 2.3 times more likely (than controls) to have blood-THC at levels above 1
ng/mL, 9.4 times more likely to have a BAC of 0.05 or higher, and 14.1 times more likely to have
combined THC with alcohol.
Compton (2017). Marijuana-Impaired Driving – A Report to Congress. U.S. Department of
Transportation, Washington D.C. Report Number DOT HS 812 440.
This report was prepared in response to a federal requirement directing the U.S. DOT to
examine issues related to marijuana-impaired driving, provide a report to Congress, and in the
report provide recommendations.
Desrosiers NA, Ramaekers JG, Chauchard E, Gorelick DA, & Huestis MA (2015). Smoked cannabis’
psychomotor and neurocognitive effects in occasional and frequent smokers. Journal of Analytical
Toxicology. 39:251-261.
This study compared tolerance to cannabis intoxication among frequent and infrequent users,
as measured in laboratory and simulator testing of critical tracking (CT), divided attention (DA),
and working memory (WK). Authors found ‘significantly impaired psychomotor function’ as late
as 3.5 hours after smoking, especially for infrequent users but for frequent users as well (p. 256).
- 34 -
CT and DA were particularly comprised in infrequent users during the initial hour post-smoking.
Minimal impact was found on WM. Overall, results confirm significant tolerance in frequent
users compared to infrequent ones.
Drummer OH, Gerostamoulos J, Batziris H, Chu M, Caplehorn J, Robertson MD, & Swann P (2004). The
involvement of drugs in drivers of motor vehicles killed in Australian road traffic crashes. Accident
Analysis and Prevention. 36:239-248.
This study of 3,398 drivers killed in Australian road crashes conducted a culpability review (see
Robertson and Drummer, 1994, for a description of this procedure) and then determined the
odds-ratios of finding drugs and alcohol in the blood of culpable versus non-culpable drivers.
Hartman RL, Brown TL, Milavetz G, Spurgin A, Pierce RS, Gorelick DA, Gaffney G, & Huestis MA (2015a).
Cannabis effects on driving lateral control with and without alcohol. Drug and Alcohol
Dependence.154:25-37.
This study investigated the impact of THC on one measure of driver lateral control (SDLP) at
various blood levels instead of as a dose-response effect (as in many earlier studies). At a THC
blood-level of 8.2 ng/mL the authors found a substantial increase in SDLP, roughly equivalent to
that observed among subjects testing at the 0.05% Breath Alcohol Concentration (BrAC) level.
Combining 5 ng/mL THC with 0.05% BrAC produced SDLP increases similar to those with a BrAC
of 0.08%.
Hartman RL, Brown TL, Milavetz G, Spurgin A, Gorelick DA, Gaffney G, & Huestis MA (2015b). Controlled
cannabis vaporizer administration: blood and plasma cannabinoids with and without alcohol. Clinical
Chemistry.61:850-869.
This study scrutinized blood and plasma cannabinoid level changes in 32 adult cannabis users
(>1/every 3 months) who inhaled vaporized placebo, low-dose, or high-dose cannabis 10
minutes after drinking placebo or low-dose alcohol (0.065% peak breath alcohol). The study
found that adding doses of alcohol to THC-positive subjects increases levels of 11-OH-THC, the
very potent psychoactive metabolite which is intermediate between THC and carboxy-THC.
Hartman RL & Huestis MA (2013). Cannabis effects on driving skills. Clinical Chemistry. 59:478-492.
This is a comprehensive review of results from epidemiologic, culpability, case-control,
laboratory, and driving-simulator studies regarding the impacts of THC on human performance.
Holcomb, RL (1938). Alcohol in relation to traffic accidents. Journal of the American Medical Association.
111:1076-1085.
The author’s investigation represents the first case-control study of the relationship between
alcohol levels and crash risk.
Li M-C, Brady JE, DiMaggio CH, Lusardi AR, Tzong KY, & Li G (2012). Marijuana use and motor vehicle
crashes. Epidemiologic Reviews. 34:65-72.
This systematic review and meta-analysis of nine studies (selected from a pool of just under
3,000 studies) regarding motor vehicle crash risk resulting from driver consumption of cannabis
- 35 -
found that driving under the influence of THC was associated with roughly a doubled risk of
crashing compared to controls (OR=2.66). These studies included cohort designs, case-control
designs, and cross-sectional designs.
Longo M, Hunter CE, Lokan R, White JM, & White MA (2000). The prevalence of alcohol, cannabinoids,
benzodiazepines and stimulants among injured drivers and their role in driver culpability. Part2: the
relationship between drug prevalence and drug concentration, and driver culpability. Accident Analysis
and Prevention. 32: 623-632.
This culpability study of 2,500 drivers injured in Australian crashes found that drivers testing
positive for THC (up to 2 ng/mL) had a lower odds ratio (OR) of being culpable than drug-free
drivers. Drivers with THC levels of 2.1 ng/mL and above showed an OR of 1.8. Alcohol-only
drivers had a culpability OR of 4.8, whereas drivers who combined THC with alcohol showed an
OR of 6.2. Thus, the low culpability of THC-only drivers was greatly inflated by the presence of
alcohol.
Mura P, Kintz P, Ludes B, Gaulier JM, Marquet P, Martin-Dupont S, Vincent F, Kaddour A, Goullé JP,
Nouveau J, Moulsma M, Tilhet-Coartet S, & Pourrat O (2003). Comparison of the prevalence of alcohol,
cannabis and other drugs between 900 injured drivers and 900 control subjects: results of a French
collaborative study. Forensic Science International. 133:79-85.
This case-control study examined drivers > 18 years of age treated in emergency rooms (ERs) in
France. Cases consisted of 321 drivers ages 18-27 admitted to ERs with non-fatal crash injuries
and controls consisted of licensed drivers (also ages 18-27) admitted to ERs with non-fatal
injuries sustained for other causes. The blood of both cases and controls were tested for THC (>1
ng/mg) and alcohol (>.05 mg/L).
Peck RC, Gebers MA, Voas RB, & Romano E (2008). The relationship between blood alcohol
concentration (BAC), age, and crash risk. Journal of Safety Research. 39:311-319.
This study reanalyzed data originally collected and reported in the 2005 Long Beach-Fort
Lauderdale study of crash risk arising from different levels of driver alcohol impairment at
different BAC levels. The authors used conditional logistic regression analysis, a method
sensitive to variable interactions, in this specific case to that between age and BAC in producing
crash risk. Notably, the study found that drivers under age 21 with a BAC of 0.08 are 4.5 times
more likely to crash than drivers ages 21 and over at the same BAC level. That risk ratio
increases to 9.6 for a BAC of 0.12 – and to 20.3 at 0.16.
Pulido J, Barrio G, Lardelli P, Bravo MJ, Espelt MTBA, & De la Fuente L (2011). Cannabis use and traffic
injuries. Epidemiology. 22:609-610.
This study recruited subjects from a population of young regular cocaine users in three large
Spanish cities. The authors obtained baseline data and follow-up questionnaires for a sample of
503 subjects. For their cannabis study, researchers used a case-crossover design to examine the
relationship between driver cannabis intoxication and the risk of a traffic-related injury during
the two hours after use. The “self-matching” feature of this study design offered “complete
- 36 -
adjustment for all confounders that remain stable over time,” such as personality traits, driving
ability, physical limitations, or the presence of other drugs. Thus, this design represented an
improvement over earlier observational studies that were only partly successful in controlling
for confounders. The 68 subjects who reported sustaining injuries after driving a motor vehicle
became the core subjects for this study. The results showed a relative-risk (RR) of 5.8 during the
first hour after cannabis use among subjects who had ingested cannabis but were free of other
drugs or alcohol (compared to the control period for the same drivers, in which they were free
of all psychoactive substances), which rose to 10.9 for subjects who had ingested alcohol as well
as cannabis. The RR for both groups dropped to 2.2 and 1.9, respectively, during the second
hour of this study. Thus, combining alcohol with cannabis resulted in an 88 percent increase in
the risk of sustaining an injury while driving.
Ramaekers JG, Theunissen EL, De Brouwer M, Toennes SW, Moeller MR, & Kauert G (2011). Tolerance
and cross-tolerance to neurocognitive effects of THC and alcohol in heavy cannabis users.
Psychopharmacology. 214:391-401.
This double-blind, placebo-controlled study investigated the hypothesis, based largely on
numerous animal studies, that heavy cannabis users develop cross-tolerance to the impairing
effects of alcohol. The authors administered critical tracking (CT), divided attention (DA), stop-
signal (SS), and Tower of London (CF) tests to 21 daily cannabis users over a seven-hour period,
during which the subjects drank alcohol in placebo, low-level, and high-level concentrations. The
authors hypothesized, based on animal testing data, that cannabis users who are highly tolerant
to the effects of THC may also be cross-tolerant to the effects of alcohol. However, while the
study found that THC generally did not affect neurocognitive performance in heavy users,
alcohol strongly affected it. Moreover, combining alcohol with THC resulted in diminished
performance on DA test compared to alcohol alone conditions.
Ramaekers JG, Kauert G, van Ruitenbeek P, Theunissen EL, Toennes SW, & Moeller MR (2009).
Neurocognitive performance during acute THC intoxication in heavy and occasional cannabis users.
Journal of Psychopharmacology.23:266-277.
This study used a double-blind, placebo-controlled, mixed-model design to quantify the
relationship between tolerance (in experienced users) to THC and the apparent reduction in the
observed degree of performance deficit. It also confirmed that THC alone generated
performance deficits for occasional users in critical tracking, divided attention capability,
reaction time, and cognitive function. By contrast, neither CT nor DA capabilities were
compromised by the same doses in heavy users.
Ramaekers JG, Berghaus G, van Laar M, & Drummer OH (2004). Dose related risk of motor vehicle
crashes after cannabis use. Drug and Alcohol Dependence.73:109-119.
This study reviewed earlier studies and found that all those relying on carboxy-THC as a measure
of driver impairment (e.g., based on urine-testing) found odds-ratios of about 1.0 and below,
thereby driving the erroneous conclusion that cannabis is not impairing.
- 37 -
Ramaekers JG, Robbe HWJ, & O’Hanlon JF (2000). Marijuana, alcohol, and actual driving performance.
Human Psychopharmacology. 15:551-558.
In this study the authors tested 18 participants (9 males and 9 females between 20 and 28 years
of age in six different THC and alcohol conditions. The study found that alcohol and THC alone
caused significant SDLP increases, though the size of the deficit caused by THC was much than
that created by alcohol. Moreover, combining THC and alcohol led to a ‘severe’ loss of critical
tracking ability. Combining low-levels of THC with alcohol sufficient to create a BAC 0.05 led to
impairment deficits generally observed in drivers with a BAC level of 0.09%.
Ramirez A, Berning, A, Carr K, Scherer M, Lacey JH, Kelley-Baker, T, & Fisher DA (2016). Marijuana, other
drugs, and alcohol use by drivers in Washington State (Report No. DOT HS 812 299). Washington, DC:
National Highway Traffic Safety Administration.
National roadside surveys have been conducted nearly every decade since the 1970s. The
Washington State roadside study used a similar research design and tested biological samples
for more than 70 over-the-counter, prescription, and illegal drugs that may impair driving. The
main objective of this study was to examine whether the percent of drivers positive for
marijuana increased after sales of the drug became available in July 2014. The study found a
statistically significantly increase in daytime prevalence of THC-positive drivers between the six
months prior to retail sales (7.8 percent) and the 12 months following retail sales (18.9 percent).
Robertson MD & Drummer OH (1994). Responsibility analysis: a methodology to study the effects of
drugs in driving. Accident Analysis and Prevention. 26:243-247.
The authors describe a formal method for assigning responsibility (often called culpability in
more recent studies) to drivers involved in injury and fatality crashes through a close
examination of eight separate factors involved (including mitigating ones). This particular study
is based on the assumption that “if drugs are contributing to accident causation, it would be
expected that they would be overrepresented in the culpable or responsible group” (243).
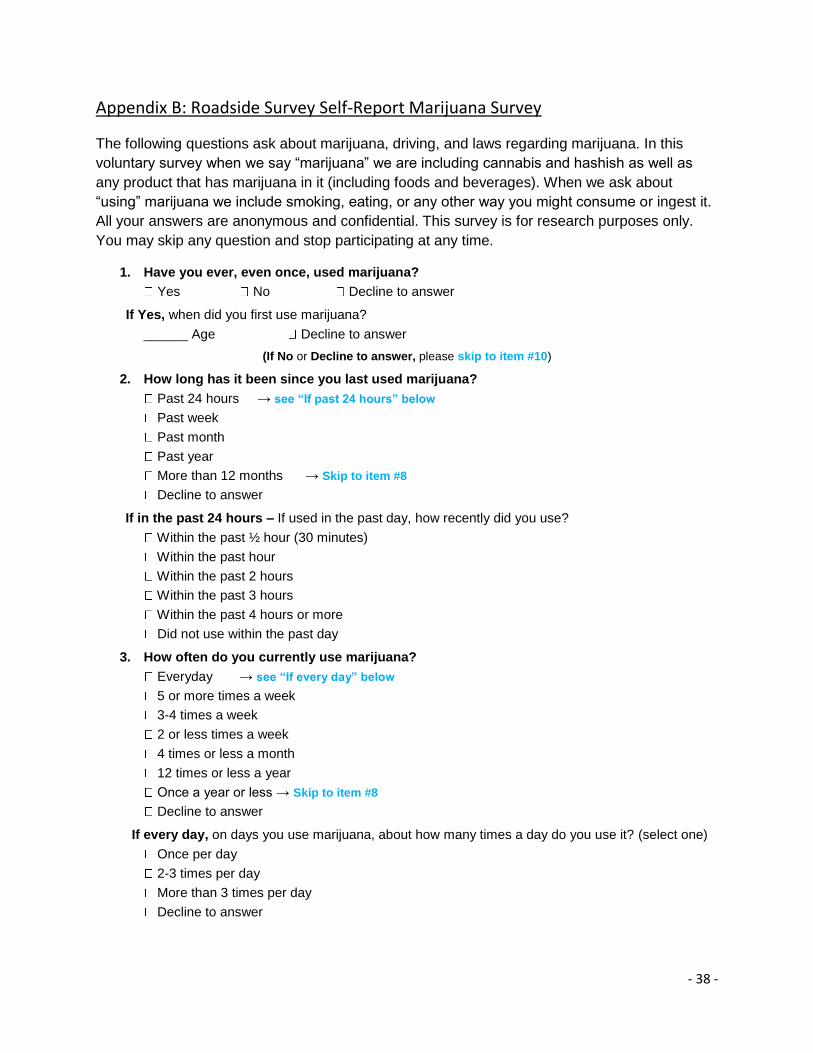
- 38 -
Appendix B: Roadside Survey Self-Report Marijuana Survey
The following questions ask about marijuana, driving, and laws regarding marijuana. In this
voluntary survey when we say “marijuana” we are including cannabis and hashish as well as
any product that has marijuana in it (including foods and beverages). When we ask about
“using” marijuana we include smoking, eating, or any other way you might consume or ingest it.
All your answers are anonymous and confidential. This survey is for research purposes only.
You may skip any question and stop participating at any time.
1. Have you ever, even once, used marijuana?
Yes No Decline to answer
If Yes, when did you first use marijuana?
______ Age Decline to answer
(If No or Decline to answer, please skip to item #10)
2. How long has it been since you last used marijuana?
Past 24 hours → see “If past 24 hours” below
Past week
Past month
Past year
More than 12 months → Skip to item #8
Decline to answer
If in the past 24 hours – If used in the past day, how recently did you use?
Within the past ½ hour (30 minutes)
Within the past hour
Within the past 2 hours
Within the past 3 hours
Within the past 4 hours or more
Did not use within the past day
3. How often do you currently use marijuana?
Everyday → see “If every day” below
5 or more times a week
3-4 times a week
2 or less times a week
4 times or less a month
12 times or less a year
Once a year or less → Skip to item #8
Decline to answer
If every day, on days you use marijuana, about how many times a day do you use it? (select one)
Once per day
2-3 times per day
More than 3 times per day
Decline to answer
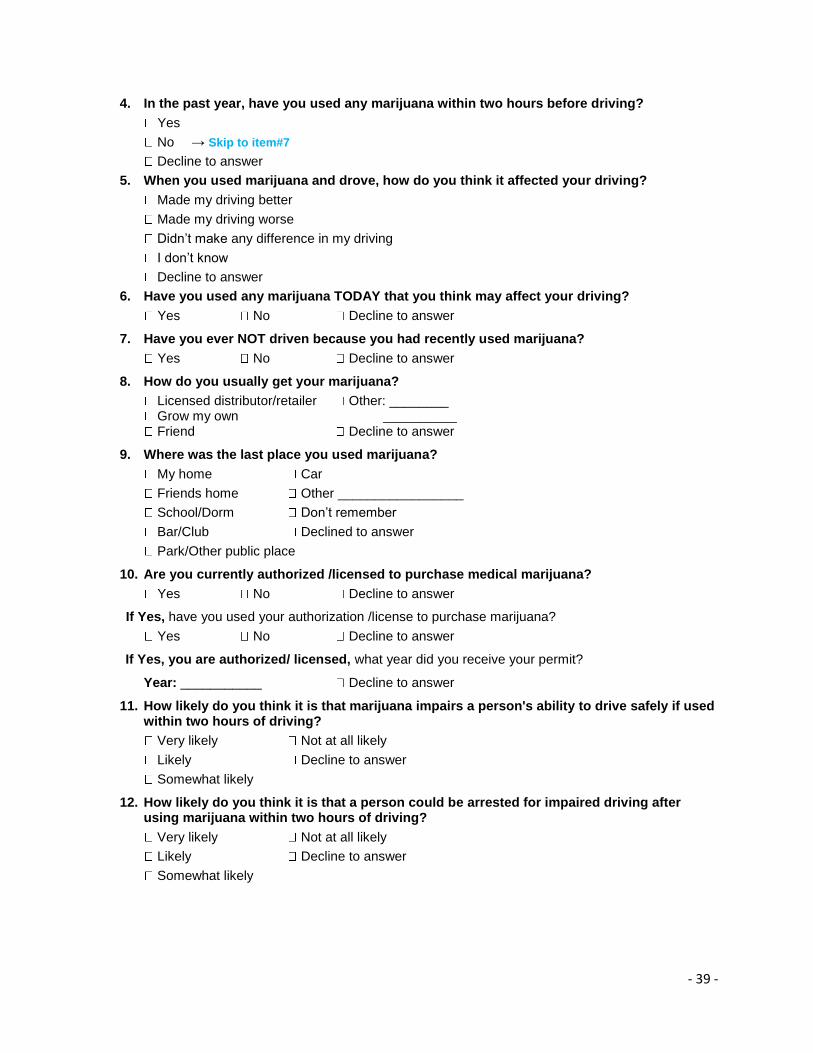
- 39 -
4. In the past year, have you used any marijuana within two hours before driving?
Yes
No → Skip to item#7
Decline to answer
5. When you used marijuana and drove, how do you think it affected your driving?
Made my driving better
Made my driving worse
Didn’t make any difference in my driving
I don’t know
Decline to answer
6. Have you used any marijuana TODAY that you think may affect your driving?
Yes No Decline to answer
7. Have you ever NOT driven because you had recently used marijuana?
Yes No Decline to answer
8. How do you usually get your marijuana?
Licensed distributor/retailer Other: ________ Grow my own __________ Friend Decline to answer
9. Where was the last place you used marijuana?
My home Car
Friends home Other _________________
School/Dorm Don’t remember
Bar/Club Declined to answer
Park/Other public place
10. Are you currently authorized /licensed to purchase medical marijuana?
Yes No Decline to answer
If Yes, have you used your authorization /license to purchase marijuana?
Yes No Decline to answer
If Yes, you are authorized/ licensed, what year did you receive your permit?
Year: ___________ Decline to answer
11. How likely do you think it is that marijuana impairs a person's ability to drive safely if used within two hours of driving?
Very likely Not at all likely
Likely Decline to answer
Somewhat likely
12. How likely do you think it is that a person could be arrested for impaired driving after using marijuana within two hours of driving?
Very likely Not at all likely
Likely Decline to answer
Somewhat likely
- 40 -
Appendix C: Post-stratification Weighting Methodology
The Washington roadside survey followed the same sampling method from the 2007 and 2013-2014
National Roadside Surveys. The sampling procedure is a multistage sampling strategy employing four
nested sampling frames:
Primary Sampling Units (PSUs) = 6 of 39 counties selected
Random selection of 1-mile2 grids = 30 grids per county selected
Semi-random selection of survey sites within grids (1 site per grid, 1 site per PSU) = 6 sites
Random selection of vehicles at the survey site
The above method was used across all three waves. Some sites were used between different waves, but
not all. At each of the six sites, five two-hour data collection periods commenced during each wave.
From the roadside survey data provided by NHTSA and PIRE, every observation within a specified
site/time had the same weight, indicating the weight as a design (site-level) weight rather than a
respondent (person-level) weight. The 2007 NRS methodology identifies PSU population density,
number of fatal crashes, number of injury crashes, and select socioeconomic conditions as site selection
factors. It is unclear based on the available materials if these factors are also used in deriving the design
weights, or if the design weights are just simply selection probabilities based on total PSUs and total
observed vehicle counts during data collection. As reported in the 2007 NRS Drug Results report, the
probability of selection within each of the four nested sampling frames was known; therefore the weight
was the inverse of the product of the four probabilities.
Assuming the Washington roadside survey weights are also the inverse of the product of the four
sampling probabilities, then a post-stratification adjustment based on the licensed driver population by
age and gender may increase the representativeness of the sample to the Washington licensed driver
population for the self-report survey analysis.
Licensed Driver Population information was provided by the Department of Licensing (DOL) for calendar
year 2014 and included counts by age, gender and county. The driver and passenger demographic data
was initially grouped by age using self-reported driver age. However, 98 records were missing self-
reported driver age, therefore age was regrouped to follow the categorization of the surveyor-reported
age groups (five age groups). Self-reported age was used first, and if missing then the surveyor-reported
age group was used. For records missing both the age variables, age was considered UNK. There were 16
records missing either gender, or both age variables. Since there were only 16 records out of 2,532
missing the post-stratification age/gender information, the adjustment factor was set to one, which
resulted in no adjustment to the design weight for these records.
Using the DOL information, licensed driver population proportions by age and gender were derived.
These proportions are shown in the table below.
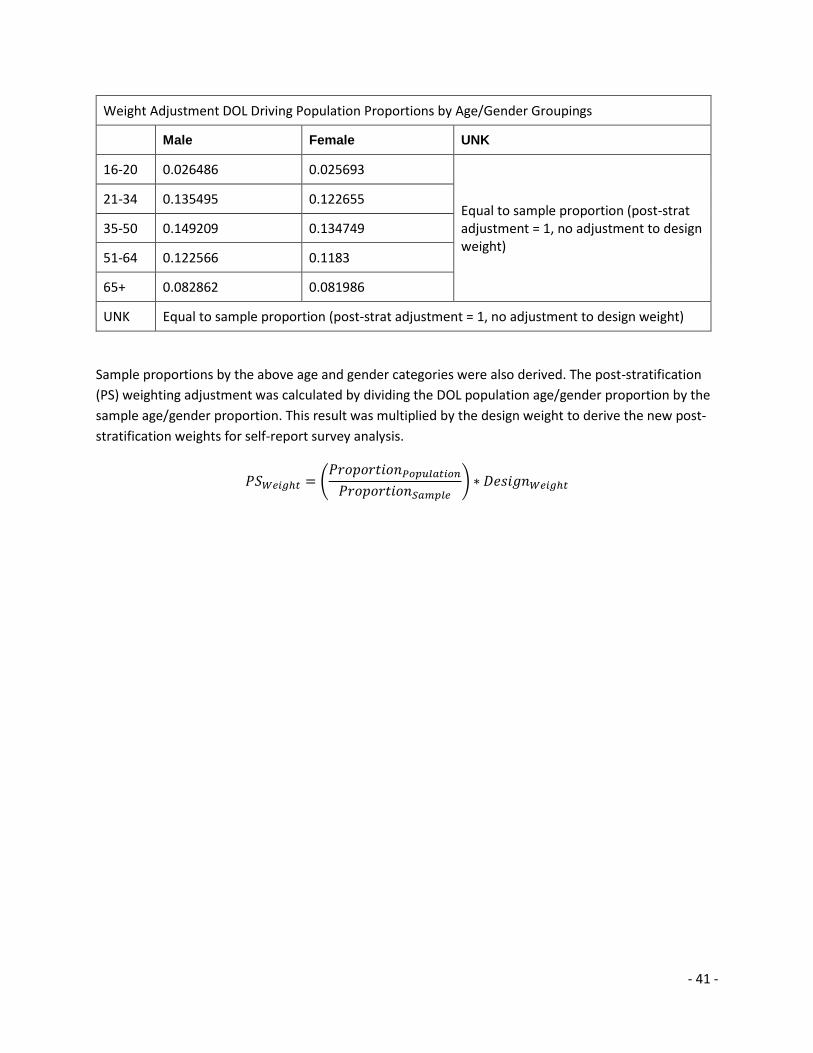
- 41 -
Weight Adjustment DOL Driving Population Proportions by Age/Gender Groupings
Male Female UNK
16-20 0.026486 0.025693
Equal to sample proportion (post-strat adjustment = 1, no adjustment to design weight)
21-34 0.135495 0.122655
35-50 0.149209 0.134749
51-64 0.122566 0.1183
65+ 0.082862 0.081986
UNK Equal to sample proportion (post-strat adjustment = 1, no adjustment to design weight)
Sample proportions by the above age and gender categories were also derived. The post-stratification
(PS) weighting adjustment was calculated by dividing the DOL population age/gender proportion by the
sample age/gender proportion. This result was multiplied by the design weight to derive the new post-
stratification weights for self-report survey analysis.
𝑃𝑆𝑊𝑒𝑖𝑔ℎ𝑡 = (𝑃𝑟𝑜𝑝𝑜𝑟𝑡𝑖𝑜𝑛𝑃𝑜𝑝𝑢𝑙𝑎𝑡𝑖𝑜𝑛
𝑃𝑟𝑜𝑝𝑜𝑟𝑡𝑖𝑜𝑛𝑆𝑎𝑚𝑝𝑙𝑒) ∗ 𝐷𝑒𝑠𝑖𝑔𝑛𝑊𝑒𝑖𝑔ℎ𝑡