Embed Size (px)
Citation preview

PART C: DRUG TRAFFICKING OFFENSESMARIJUANA
Analysis of Marijuana Trafficking Offenses STATISTICAL OVERVIEW: FISCAL YEAR 2011
In fiscal year 2011, federal courts sentenced 6,752 marijuana trafficking offenders. Marijuana was the primary drug type involved in the drug trafficking crime in 27.6 percent of drug trafficking offenses. Over 70 percent (71.4%, n=4,816) of marijuana trafficking offenders were sentenced in just two circuits: judges in the Fifth Circuit sentenced 2,429 marijuana trafficking offenders (36.0% of marijuana trafficking offenders nationwide) and judges in the Ninth Circuit sentenced 2,387 marijuana trafficking offenders (35.4% of marijuana trafficking offenders nationwide).71 The 2,429 marijuana trafficking offenders sentenced in the Fifth Circuit accounted for 49.0 percent of that circuit’s total drug trafficking caseload, while the 2,387 marijuana trafficking offenders sentenced in the Ninth Circuit accounted for 46.2 percent of its drug trafficking caseload. The Tenth Circuit, which had the most marijuana trafficking offenders following the Fifth and Ninth Circuits, had only 416 such offenders (6.2% of marijuana trafficking offenders nationwide and 28.0% of its drug trafficking caseload). Next, the Sixth Circuit had 341 marijuana trafficking offenders (5.1% of marijuana trafficking offenders nationwide and 17.5% of its drug trafficking
71 See “National Distribution of Primary Drug Type by Circuit and District, Marijuana, FY 2011” Appendix Table. By way of comparison, only 41.3 percent of all drug trafficking offenses in fiscal year 2011 were sentenced by judges in those two circuits. See “National Distribution of Selected Offenses by Circuit and District, Drug Trafficking Offenses, FY 2011” Appendix Table.
caseload). The table below illustrates that the proportion of the circuits’ drug trafficking caseload comprised of marijuana trafficking offenses ranged from a low of 3.0 percent in the District of Columbia Circuit to a high of 49.0 percent in the Fifth Circuit.
At the district level, the number of marijuana trafficking offenders sentenced in fiscal year 2011 ranged from zero (Northern Mariana Islands) to 1,726 offenders (Arizona). Judges in only three districts sentenced more than 1,000 marijuana trafficking offenders. Judges in the District of Arizona sentenced 1,726 marijuana trafficking offenders, which was 25.6 percent of all marijuana trafficking offenders nationwide. Judges in the Western District of Texas sentenced 1,191 marijuana trafficking offenders (17.6% of marijuana trafficking offenders nationwide) and judges in the Southern
1

PART C: DRUG TRAFFICKING OFFENSESMARIJUANA
District of Texas sentenced 1,110 marijuana trafficking offenders (16.4% of marijuana trafficking offenders nationwide). These three districts accounted for more than half (59.6%, n=4,027) of all marijuana trafficking offenders sentenced nationwide.72 Only three other districts sentenced more than 100 marijuana trafficking offenders: Southern California with 366 offenders (5.4% of marijuana trafficking offenders nationwide); New Mexico with 334 offenders (4.9% of marijuana trafficking offenders nationwide); and Eastern California with 106 offenders (1.6% of marijuana trafficking offenders nationwide). Over 70 percent (70.2%, n=66) of the 94 districts sentenced fewer than 30 marijuana trafficking offenders. Notably, the proportion of a district’s drug trafficking caseload comprised of marijuana trafficking offenses varied considerably between districts. In those districts that reported sentencing marijuana trafficking offenders in fiscal year 2011, the District of Wyoming sentenced the lowest proportion of marijuana trafficking offenders, at 0.7 percent of its drug trafficking offenders. In contrast, marijuana trafficking offenders were 84.0 percent of the District of Arizona’s drug trafficking caseload. In four districts, marijuana trafficking offenders were more than 50 percent of the drug trafficking offenders sentenced in those districts: Arizona (84.0% of the drug trafficking offenders in the district, n=1,726); Southern Texas (64.0% of the drug trafficking offenders in the district, n=1,110); New Mexico (56.3% of the drug trafficking offenders in the district, n=334); and Western Texas (55.6% of the drug trafficking offenders in the district, n=1,191). In contrast, marijuana trafficking offenders were less than three percent of drug trafficking offenders in four districts that sentenced marijuana trafficking offenders in fiscal year 2011. Those districts were: Wyoming (0.7% of drug trafficking offenders in the district, n=1); Eastern Louisiana (1.7% of drug trafficking offenders in the district, n=2); Western Oklahoma (2.6% of drug
72 See “National Distribution of Primary Drug Type by Circuit and District, Marijuana, FY 2011” Appendix Table. By way of comparison, only 24.2 percent of all drug trafficking cases in fiscal year 2011 were sentenced in those three districts. See “National Distribution of Selected Offenses by Circuit and District, Drug Trafficking Offenses, FY 2011” Appendix Table.
trafficking offenders in the district, n=3); and Middle Louisiana (2.7% of drug trafficking offenders in the district, n=1).73
73 See “Proportion of the Drug Trafficking Caseload in Each Circuit and District by Primary Drug Type, Marijuana, FY 2011” Appendix Table.
2

PART C: DRUG TRAFFICKING OFFENSES MARIJUANA
NATIONAL TREND ANALYSIS
This section addresses federal sentencing
trends for marijuana trafficking offenses over time. Much of the analysis uses time periods that are based on major changes in the legal framework gov-erning federal sentencing rather than time periods divided by fiscal or calendar year. These four peri-ods, the Koon, PROTECT Act, Booker, and Gall periods, and their significance, are discussed more fully in Part A.
The number of marijuana trafficking offend-ers has remained relatively stable since fiscal year 2004, with a slightly higher number of such offend-ers sentenced in fiscal year 2011. The percentage of marijuana trafficking offenses relative to the overall drug trafficking caseload has varied across the four periods: marijuana was the primary drug type in 29.8 percent of drug trafficking offenses nationwide in the Koon period, 25.6 percent during the PRO-TECT Act period, 24.4 percent in the Booker period, and 25.9 percent in the Gall period.
3

PART C: DRUG TRAFFICKING OFFENSES MARIJUANA
NATIONAL TREND ANALYSIS OFFENDER AND OFFENSE CHARACTERISTICS
The majority of marijuana trafficking of-
fenders have been United States citizens across the four periods, but the proportion of United States citi-zen marijuana trafficking offenders has decreased from the PROTECT Act period to the Gall period. Male offenders have been the majority of marijuana trafficking offenders in each period. Hispanic of-fenders consistently have been the largest group of marijuana trafficking offenders, with White offend-ers the second largest group in each period.
The majority of marijuana trafficking of-
fenders have been in Criminal History Category I in each of the four periods. The second largest group of marijuana trafficking offenders has been in Crim-inal History Category III during every period.
4

PART C: DRUG TRAFFICKING OFFENSES MARIJUANA
NATIONAL TREND ANALYSIS OFFENDER AND OFFENSE CHARACTERISTICS
The majority of marijuana trafficking of-
fenders have been sentenced to prison only in each of the four periods. The percentage sentenced to a split sentence of prison and community confinement has been small but has increased steadily over the four periods.
5

PART C: DRUG TRAFFICKING OFFENSES MARIJUANA
NATIONAL TREND ANALYSIS OFFENDER AND OFFENSE CHARACTERISTICS
The average guideline minimum for drug trafficking offenses can generally be viewed as a proxy for the seriousness of the offense. For mariju-ana trafficking offenses, the average guideline mini-mum increased from the Koon to Booker periods, but decreased in the Gall period, suggesting that the offenses have become less serious. Average sen-tence length also decreased in the Gall period. Changes in sentence length are influenced by vari-ous factors including the guideline range, depar-tures, and variances.
The table includes the percentage of mariju-
ana trafficking offenders who were granted safety valve relief from the mandatory minimum penalty, pursuant to 18 U.S.C. § 3553(f) and USSG §5C1.2.
The table also includes the percentage of
marijuana trafficking offenses that involved a weap-on, because the offender was convicted under 18 U.S.C. § 924(c) or because the offender received the weapon enhancement at §2D1.1(b)(1). An offender who possessed a firearm or other dangerous weapon (or induced another participant to do so) in connec-tion with the offense is ineligible for safety valve relief.
Rates of within range sentences have de-
creased over time due to increases in both govern-ment and non-government sponsored below range rates. The extent of the reduction from the guideline minimum has varied depending on the type of below range sentence, but the largest reductions have oc-curred in substantial assistance below range sentenc-es.
6

PART C: DRUG TRAFFICKING OFFENSES MARIJUANA
NATIONAL TREND ANALYSIS INFLUENCE OF THE GUIDELINES
The rate of within range sentences for mari-juana trafficking offenses increased in fiscal years 2003 and 2004 and then in fiscal year 2005 returned to previous levels. Despite some fluctuation, they have remained relatively stable since then. The high rate of non-government sponsored below range sentences and the correspondingly low rate of government sponsored below range sentences through fiscal year 2002, as well the reversal in trends thereafter, are attributable to the change in the way the Commission reported its departure data.
7

NATIONAL TREND ANALYSIS INFLUENCE OF THE GUIDELINES
The relationship between the red and blue lines illustrates that average sentences have closely paralleled average guideline minimums in marijuana trafficking offenses. When the average guideline minimum increased for marijuana trafficking of-fenses, the average sentence also increased. Con-versely, when the average guideline minimum de-creased, the average sentence also decreased. The percentage difference between the aver-age guideline minimum and the average sentence in marijuana trafficking offenses has shown little vari-ation over time. This figure and others demonstrate that the influence of the guidelines has been sub-stantial and stable for marijuana trafficking sentenc-es. *Click on chart for corresponding table by period.
PART C: DRUG TRAFFICKING OFFENSES MARIJUANA
8

PART C: DRUG TRAFFICKING OFFENSES MARIJUANA
CIRCUIT TREND ANALYSIS INFLUENCE OF THE GUIDELINES
At the national level, the rate of within range sentences for marijuana traf-ficking offenses increased in fiscal years 2003 and 2004 and then in fiscal year 2005 returned to previous levels. Despite some fluctuation, they have remained relatively stable since. The circuits have shown a great deal of variation in these offenses, with some circuits paralleling the national trend and others showing a decline in within range rates.
9

PART C: DRUG TRAFFICKING OFFENSES MARIJUANA
CIRCUIT TREND ANALYSIS INFLUENCE OF THE GUIDELINES
At the national level, the rate of within range sentences for marijuana traf-ficking offenses increased in fiscal years 2003 and 2004 and then in fiscal year 2005 returned to previous levels. Despite some fluctuation, they have remained relatively stable since. The circuits have shown a great deal of variation in these offenses, with some circuits paralleling the national trend and others showing a decline in within range rates.
10

PART C: DRUG TRAFFICKING OFFENSES MARIJUANA
CIRCUIT TREND ANALYSIS INFLUENCE OF THE GUIDELINES
At the national level, the rate of within range sentences for marijuana traf-ficking offenses increased in fiscal years 2003 and 2004 and then in fiscal year 2005 returned to previous levels. Despite some fluctuation, they have remained relatively stable since. The circuits have shown a great deal of variation in these offenses, with some circuits paralleling the national trend and others showing a decline in within range rates.
11

PART C: DRUG TRAFFICKING OFFENSES MARIJUANA
CIRCUIT TREND ANALYSIS INFLUENCE OF THE GUIDELINES
At the national level, average sentences have closely paralleled the av-erage guideline minimum. This trend has occurred for most circuits. On the national level, the per-centage difference between the average guideline minimum and the average sen-tence in marijuana trafficking offenses has shown little variation over time. While there has been greater variation across the circuits, most circuits have reflected the national trend.
12

PART C: DRUG TRAFFICKING OFFENSES MARIJUANA
CIRCUIT TREND ANALYSIS INFLUENCE OF THE GUIDELINES
At the national level, average sentences have closely paralleled the av-erage guideline minimum. This trend has occurred for most circuits. On the national level, the per-centage difference between the average guideline minimum and the average sen-tence in marijuana trafficking offenses has shown little variation over time. While there has been greater variation across the circuits, most circuits have reflected the national trend.
13

PART C: DRUG TRAFFICKING OFFENSES MARIJUANA
CIRCUIT TREND ANALYSIS INFLUENCE OF THE GUIDELINES
At the national level, average sentences have closely paralleled the av-erage guideline minimum. This trend has occurred for most circuits. On the national level, the per-centage difference between the average guideline minimum and the average sen-tence in marijuana trafficking offenses has shown little variation over time. While there has been greater variation across the circuits, most circuits have reflected the national trend.
14

PART C: DRUG TRAFFICKING OFFENSES MARIJUANA
CIRCUIT TREND ANALYSIS INFLUENCE OF THE GUIDELINES
At the national level, average sentences have closely paralleled the av-erage guideline minimum. This trend has occurred for most circuits. On the national level, the per-centage difference between the average guideline minimum and the average sen-tence in marijuana trafficking offenses has shown little variation over time. While there has been greater variation across the circuits, most circuits have reflected the national trend.
15

PART C: DRUG TRAFFICKING OFFENSES MARIJUANA
CIRCUIT TREND ANALYSIS INFLUENCE OF THE GUIDELINES
At the national level, average sentences have closely paralleled the av-erage guideline minimum. This trend has occurred for most circuits. On the national level, the per-centage difference between the average guideline minimum and the average sen-tence in marijuana trafficking offenses has shown little variation over time. While there has been greater variation across the circuits, most circuits have reflected the national trend.
16

PART C: DRUG TRAFFICKING OFFENSES MARIJUANA
CIRCUIT TREND ANALYSIS INFLUENCE OF THE GUIDELINES
At the national level, average sentences have closely paralleled the av-erage guideline minimum. This trend has occurred for most circuits. On the national level, the per-centage difference between the average guideline minimum and the average sen-tence in marijuana trafficking offenses has shown little variation over time. While there has been greater variation across the circuits, most circuits have reflected the national trend.
17

PART C: DRUG TRAFFICKING OFFENSES MARIJUANA
DISTRICT TREND ANALYSIS GOVERNMENT SPONSORED BELOW RANGE SENTENCES
Most districts have clustered between rates
of ten to 49 percent government sponsored below range sentences in each period.
18

PART C: DRUG TRAFFICKING OFFENSES MARIJUANA
DISTRICT TREND ANALYSIS GOVERNMENT SPONSORED BELOW RANGE SENTENCES
The table lists the five districts with the
highest and lowest rates of government sponsored below range sentences in marijuana trafficking of-fenses for each of the four periods.
19

PART C: DRUG TRAFFICKING OFFENSES MARIJUANA
DISTRICT TREND ANALYSIS GOVERNMENT SPONSORED BELOW RANGE SENTENCES The spread among the middle 50 percent of districts was greatest in the Koon period, but similar in the other periods. As seen in the lower placement of the box along the vertical axis in the Booker peri-od compared to the PROTECT Act period, the mid-dle 50 percent of districts had slightly lower rates of government sponsored below range sentences in the Booker period, while in the Gall period, the higher placement of the box indicates slightly higher rates of such sentences among the middle 50 percent of districts. *Click on chart for corresponding table.
20

PART C: DRUG TRAFFICKING OFFENSES MARIJUANA
DISTRICT TREND ANALYSIS GOVERNMENT SPONSORED BELOW RANGE SENTENCES
In most districts, reductions for government
sponsored below range sentences have been between 30 and 59 percent below the guideline minimum. A few districts in the PROTECT Act and Gall periods averaged reductions of 100 percent. A 100 percent reduction likely reflects a reduction from a guideline range calling for a term of imprisonment to a sen-tence of probation.
21

PART C: DRUG TRAFFICKING OFFENSES MARIJUANA
DISTRICT TREND ANALYSIS GOVERNMENT SPONSORED BELOW RANGE SENTENCES
The spread in the average extent of reduc-
tion among the middle 50 percent of districts was greatest in the PROTECT Act period. In the Gall period, the higher placement of the box along the vertical axis indicates that Gall period reductions among the middle 50 percent of districts were larger than during previous periods.
22

PART C: DRUG TRAFFICKING OFFENSES MARIJUANA
DISTRICT TREND ANALYSIS SUBSTANTIAL ASSISTANCE SENTENCES
The majority of districts in the Koon period
clustered around substantial assistance below range sentence rates of between ten and 19 percent, and between 30 and 49 percent. In the Gall period, one-third of districts had substantial assistance below range rates of between 20 and 29 percent.
23

PART C: DRUG TRAFFICKING OFFENSES MARIJUANA
DISTRICT TREND ANALYSIS SUBSTANTIAL ASSISTANCE SENTENCES
The table lists the five districts with the highest and lowest rates of substantial assistance be-low range sentences in marijuana trafficking offens-es for each of the four periods.
24

PART C: DRUG TRAFFICKING OFFENSES MARIJUANA
DISTRICT TREND ANALYSIS SUBSTANTIAL ASSISTANCE SENTENCES
The spread in the rates of substantial assis-tance sentences among the middle 50 percent of dis-tricts has decreased from the PROTECT Act period through the Gall period. As illustrated by the lower placement of the box along the vertical axis in the Booker and Gall periods, the middle 50 percent of districts had generally lower substantial assistance below range rates in the Booker and Gall periods, compared to the PROTECT Act period. *Click on chart for corresponding table.
25

PART C: DRUG TRAFFICKING OFFENSES MARIJUANA
DISTRICT TREND ANALYSIS SUBSTANTIAL ASSISTANCE SENTENCES
Across all the periods, most districts have averaged reductions of between 40 to 59 percent below the guideline minimum.
26

PART C: DRUG TRAFFICKING OFFENSES MARIJUANA
DISTRICT TREND ANALYSIS SUBSTANTIAL ASSISTANCE SENTENCES
As illustrated by the varying sizes and placement of the boxes along the vertical axis, both the average extent of the reduction and the spread in the extent of the reduction have fluctuated over time. In the middle 50 percent of districts in the Gall peri-od, however, the average extent of the reduction was greater than in the other periods, as illustrated by the higher placement of the box along the vertical axis.
27

PART C: DRUG TRAFFICKING OFFENSES MARIJUANA
DISTRICT TREND ANALYSIS OTHER GOVERNMENT SPONSORED BELOW RANGE SENTENCES
During the PROTECT Act period, the ma-
jority of districts did not impose other government sponsored below range sentences in marijuana traf-ficking offenses. In the Booker and Gall periods, the majority of districts reported such sentences but generally at rates of less than ten percent.
During the Koon period, except for substan-
tial assistance motions by the government, the Com-mission did not differentiate between court-sponsored and other types of government-sponsored below range sentences. Accordingly, there are no reported other government sponsored below range sentences for the Koon period.
28
PART C: DRUG TRAFFICKING OFFENSES MARIJUANA
DISTRICT TREND ANALYSIS OTHER GOVERNMENT SPONSORED BELOW RANGE SENTENCES
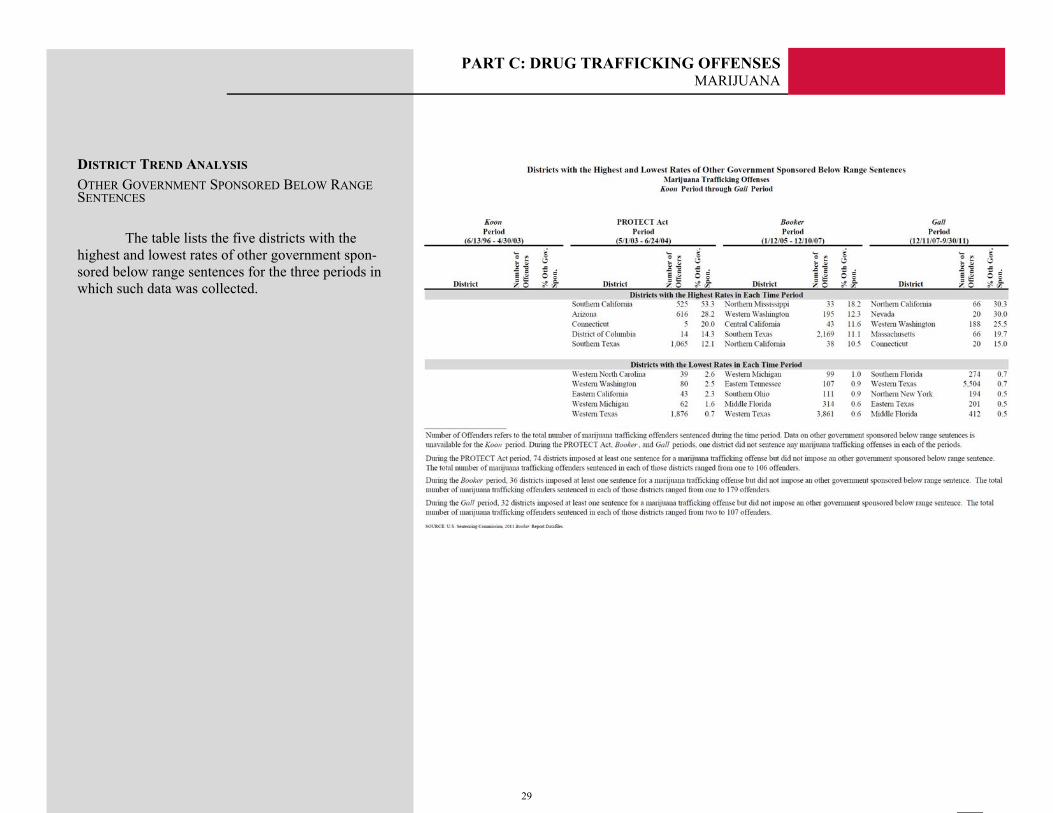
The table lists the five districts with the
highest and lowest rates of other government spon-sored below range sentences for the three periods in which such data was collected.
29

PART C: DRUG TRAFFICKING OFFENSES MARIJUANA
DISTRICT TREND ANALYSIS OTHER GOVERNMENT SPONSORED BELOW RANGE SENTENCES
The number of districts reporting other gov-ernment sponsored below range sentences has in-creased from the PROTECT Act period to the Book-er and Gall periods.
*Click on chart for corresponding table.
30

PART C: DRUG TRAFFICKING OFFENSES MARIJUANA
DISTRICT TREND ANALYSIS OTHER GOVERNMENT SPONSORED BELOW RANGE SENTENCES
The extent of reduction in other government
sponsored below range sentences has varied over time. In over 20 percent of districts in the PRO-TECT Act period, the average extent of the reduc-tion was between 50 and 59 percent below the guideline minimum. In the Booker period, the aver-age extent of the reduction was between ten and 19 percent below the guideline minimum in over 20 percent of districts. In the Gall period, over 20 per-cent of districts averaged reductions of between 40 and 49 percent below the guideline minimum.
31

PART C: DRUG TRAFFICKING OFFENSES MARIJUANA
DISTRICT TREND ANALYSIS OTHER GOVERNMENT SPONSORED BELOW RANGE SENTENCES
Although more district courts reported other government sponsored below range sentences in the Gall period, the spread in the extent of the reduction among the middle 50 percent of districts was smaller in this period than in the other periods. However, as illustrated by the higher placement of the box along the vertical axis in the Gall period compared to the Booker period, the middle 50 percent of districts generally granted larger average reductions in the Gall period.
32

PART C: DRUG TRAFFICKING OFFENSES MARIJUANA
DISTRICT TREND ANALYSIS NON-GOVERNMENT SPONSORED BELOW RANGE SENTENCES
The majority of districts in the PROTECT
Act period did not report any non-government spon-sored below range sentences, and those that did had rates of less than ten percent. During the Booker and Gall periods, more districts reported such sen-tences, and generally at rates of between less than ten percent and 19 percent. In the Gall period, more districts had non-government sponsored below range rates of 20 to 29 percent.
33

PART C: DRUG TRAFFICKING OFFENSES MARIJUANA
DISTRICT TREND ANALYSIS NON-GOVERNMENT SPONSORED BELOW RANGE SENTENCES
The table lists the five districts with the
highest and lowest rates of non-government spon-sored below range sentences in marijuana trafficking offenses for each of the four periods.
34

PART C: DRUG TRAFFICKING OFFENSES MARIJUANA
DISTRICT TREND ANALYSIS NON-GOVERNMENT SPONSORED BELOW RANGE SENTENCES
The number of districts reporting non-government sponsored below range sentences in-creased from the PROTECT Act period through the Gall period. As illustrated by the higher placement and increasing size of the boxes over time, with more districts imposing such sentences, both the av-erage rates and the variation in the rates among the middle 50 percent of districts have increased.
*Click on chart for corresponding table.
35

PART C: DRUG TRAFFICKING OFFENSES MARIJUANA
DISTRICT TREND ANALYSIS NON-GOVERNMENT SPONSORED BELOW RANGE SENTENCES
The largest percentage of districts have av-eraged reductions between 20 and 49 percent below the guideline minimum in every period.
36

PART C: DRUG TRAFFICKING OFFENSES MARIJUANA
DISTRICT TREND ANALYSIS NON-GOVERNMENT SPONSORED BELOW RANGE SENTENCES
The spread in the extent of the reduction among the middle 50 percent of districts was greatest during the PROTECT Act period. While the spreads in the Booker and Gall periods were similar, reduc-tions were generally larger in the Gall period, as il-lustrated by the higher placement of the box along the vertical axis.
37

PART C: DRUG TRAFFICKING OFFENSESMARIJUANA
Appendix: Marijuana Trafficking Offenses I. OVERVIEW National Distribution of Selected Offenses by Circuit and District
National Distribution of Primary Drug Type by Circuit and District Proportion of the Drug Trafficking Caseload in Each Circuit and District
by Primary Drug Type II. SENTENCE POSITION RELATIVE TO THE GUIDELINE RANGE Within Range Rates by Circuit and District
Above Range Rates by Circuit and District
Government Sponsored Below Range Rates by Circuit and District §5K1.1 Substantial Assistance Sentences §5K3.1 Early Disposition Program Sentences Other Government Sponsored Below Range Sentences
Non-Government Sponsored Below Range Sentences by Circuit and
District
Average Guideline Minimum and Length of Imprisonment by Circuit and District
III. BOX PLOTS: BELOW RANGE RATES BY DISTRICT Government Sponsored Below Range Rates Koon Period PROTECT Act Period Booker Period Gall Period
§5K1.1 Substantial Assistance Rates Koon Period PROTECT Act Period Booker Period Gall Period
Other Government Sponsored Below Range Sentences PROTECT Act Period Booker Period Gall Period
Non-Government Sponsored Below Range Rates Koon Period PROTECT Act Period Booker Period Gall Period
38

District
District of Columbia 16 0.3 50 0.8 3 0.1 15 0.1 133 0.5 2 0.9 11 0.7
Maine 39 0.7 17 0.3 2 0.1 4 0.0 70 0.3 1 0.4 8 0.5Massachusetts 61 1.0 85 1.4 5 0.2 44 0.2 192 0.8 1 0.4 16 1.0New Hampshire 26 0.4 25 0.4 0 0.0 6 0.0 85 0.3 1 0.4 3 0.2Puerto Rico 38 0.6 98 1.7 9 0.4 30 0.1 699 2.9 7 3.1 5 0.3Rhode Island 26 0.4 15 0.3 0 0.0 30 0.1 83 0.3 0 0.0 7 0.4
Connecticut 48 0.8 37 0.6 0 0.0 6 0.0 164 0.7 2 0.9 5 0.3New York Eastern 37 0.6 160 2.7 14 0.5 146 0.7 410 1.7 0 0.0 18 1.1 Northern 47 0.8 26 0.4 20 0.8 59 0.3 243 1.0 7 3.1 45 2.8 Southern 57 1.0 240 4.1 5 0.2 164 0.8 579 2.4 0 0.0 7 0.4 Western 36 0.6 82 1.4 7 0.3 80 0.4 309 1.3 5 2.2 35 2.1Vermont 20 0.3 11 0.2 2 0.1 7 0.0 82 0.3 0 0.0 4 0.2
Delaware 24 0.4 7 0.1 0 0.0 9 0.0 27 0.1 1 0.4 6 0.4New Jersey 82 1.4 134 2.3 5 0.2 33 0.2 223 0.9 0 0.0 21 1.3Pennsylvania Eastern 100 1.7 164 2.8 2 0.1 76 0.4 328 1.3 0 0.0 23 1.4 Middle 22 0.4 54 0.9 2 0.1 45 0.2 177 0.7 6 2.7 15 0.9 Western 39 0.7 52 0.9 0 0.0 36 0.2 179 0.7 2 0.9 38 2.3Virgin Islands 12 0.2 2 0.0 1 0.0 7 0.0 19 0.1 0 0.0 0 0.0
Maryland 110 1.9 87 1.5 2 0.1 54 0.3 251 1.0 15 6.6 31 1.9North Carolina Eastern 148 2.5 68 1.2 0 0.0 56 0.3 346 1.4 4 1.8 8 0.5 Middle 159 2.7 22 0.4 0 0.0 57 0.3 153 0.6 1 0.4 20 1.2 Western 69 1.2 61 1.0 2 0.1 66 0.3 182 0.7 5 2.2 7 0.4South Carolina 172 2.9 134 2.3 4 0.2 52 0.2 401 1.6 1 0.4 23 1.4Virginia Eastern 75 1.3 168 2.8 5 0.2 175 0.8 389 1.6 8 3.5 30 1.8 Western 23 0.4 25 0.4 0 0.0 7 0.0 197 0.8 0 0.0 10 0.6West Virginia Northern 35 0.6 15 0.3 0 0.0 12 0.1 144 0.6 0 0.0 7 0.4 Southern 41 0.7 16 0.3 0 0.0 5 0.0 166 0.7 1 0.4 5 0.3
39

District
Louisiana Eastern 33 0.6 58 1.0 1 0.0 19 0.1 120 0.5 0 0.0 8 0.5 Middle 27 0.5 29 0.5 0 0.0 16 0.1 37 0.2 0 0.0 0 0.0 Western 41 0.7 40 0.7 0 0.0 11 0.1 60 0.2 3 1.3 11 0.7Mississippi Northern 32 0.5 20 0.3 0 0.0 5 0.0 65 0.3 1 0.4 18 1.1 Southern 23 0.4 72 1.2 3 0.1 22 0.1 77 0.3 1 0.4 5 0.3Texas Eastern 98 1.7 93 1.6 17 0.7 82 0.4 460 1.9 1 0.4 25 1.5 Northern 86 1.5 80 1.4 9 0.4 142 0.7 259 1.1 7 3.1 42 2.6 Southern 182 3.1 120 2.0 938 36.8 4,656 21.9 1,735 7.1 3 1.3 24 1.5 Western 185 3.1 160 2.7 307 12.1 2,997 14.1 2,143 8.7 4 1.8 55 3.4
Kentucky Eastern 55 0.9 51 0.9 0 0.0 22 0.1 259 1.1 6 2.7 19 1.2 Western 27 0.5 52 0.9 0 0.0 21 0.1 158 0.6 0 0.0 10 0.6Michigan Eastern 126 2.1 97 1.6 2 0.1 104 0.5 243 1.0 4 1.8 35 2.1 Western 61 1.0 42 0.7 0 0.0 108 0.5 104 0.4 4 1.8 21 1.3Ohio Northern 117 2.0 97 1.6 2 0.1 25 0.1 173 0.7 0 0.0 28 1.7 Southern 63 1.1 78 1.3 3 0.1 81 0.4 269 1.1 4 1.8 36 2.2Tennessee Eastern 143 2.4 53 0.9 4 0.2 19 0.1 474 1.9 1 0.4 12 0.7 Middle 89 1.5 32 0.5 0 0.0 17 0.1 82 0.3 2 0.9 11 0.7 Western 166 2.8 77 1.3 3 0.1 19 0.1 184 0.8 2 0.9 9 0.6
Illinois Central 54 0.9 23 0.4 2 0.1 28 0.1 138 0.6 6 2.7 27 1.7 Northern 42 0.7 161 2.7 0 0.0 105 0.5 285 1.2 6 2.7 14 0.9 Southern 53 0.9 28 0.5 1 0.0 7 0.0 139 0.6 5 2.2 18 1.1Indiana Northern 126 2.1 47 0.8 1 0.0 10 0.0 147 0.6 2 0.9 12 0.7 Southern 18 0.3 24 0.4 0 0.0 28 0.1 143 0.6 2 0.9 15 0.9Wisconsin Eastern 65 1.1 38 0.6 0 0.0 18 0.1 262 1.1 1 0.4 14 0.9 Western 19 0.3 20 0.3 0 0.0 18 0.1 68 0.3 1 0.4 3 0.2
Arkansas Eastern 29 0.5 37 0.6 0 0.0 52 0.2 126 0.5 1 0.4 11 0.7 Western 26 0.4 13 0.2 4 0.2 94 0.4 91 0.4 6 2.7 9 0.6Iowa Northern 66 1.1 22 0.4 3 0.1 136 0.6 184 0.8 6 2.7 20 1.2 Southern 52 0.9 44 0.7 6 0.2 28 0.1 148 0.6 1 0.4 25 1.5Minnesota 39 0.7 61 1.0 1 0.0 42 0.2 159 0.6 6 2.7 13 0.8Missouri Eastern 124 2.1 106 1.8 2 0.1 25 0.1 225 0.9 7 3.1 54 3.3 Western 162 2.7 72 1.2 2 0.1 33 0.2 174 0.7 7 3.1 27 1.7Nebraska 50 0.8 50 0.8 0 0.0 95 0.4 219 0.9 2 0.9 23 1.4North Dakota 15 0.3 6 0.1 2 0.1 46 0.2 76 0.3 0 0.0 19 1.2South Dakota 23 0.4 23 0.4 0 0.0 50 0.2 104 0.4 1 0.4 9 0.6
40

District
Alaska 19 0.3 8 0.1 0 0.0 4 0.0 66 0.3 0 0.0 7 0.4Arizona 103 1.7 61 1.0 331 13.0 4,542 21.4 2,054 8.4 1 0.4 28 1.7California Central 59 1.0 236 4.0 33 1.3 439 2.1 511 2.1 2 0.9 50 3.1 Eastern 42 0.7 68 1.2 0 0.0 369 1.7 295 1.2 5 2.2 38 2.3 Northern 62 1.1 104 1.8 2 0.1 154 0.7 159 0.6 2 0.9 24 1.5 Southern 37 0.6 37 0.6 557 21.9 1,129 5.3 1,151 4.7 1 0.4 39 2.4Guam 1 0.0 12 0.2 2 0.1 1 0.0 12 0.0 0 0.0 0 0.0Hawaii 10 0.2 19 0.3 1 0.0 5 0.0 103 0.4 1 0.4 8 0.5Idaho 28 0.5 30 0.5 0 0.0 93 0.4 134 0.5 1 0.4 9 0.6Montana 20 0.3 24 0.4 0 0.0 12 0.1 116 0.5 1 0.4 23 1.4Nevada 84 1.4 66 1.1 3 0.1 152 0.7 131 0.5 0 0.0 17 1.0Northern Mariana Islands 1 0.0 0 0.0 0 0.0 0 0.0 2 0.0 0 0.0 0 0.0Oregon 66 1.1 50 0.8 0 0.0 73 0.3 155 0.6 3 1.3 18 1.1Washington Eastern 40 0.7 16 0.3 2 0.1 136 0.6 91 0.4 0 0.0 5 0.3 Western 56 0.9 76 1.3 6 0.2 102 0.5 192 0.8 1 0.4 14 0.9
Colorado 86 1.5 44 0.7 4 0.2 181 0.9 159 0.6 0 0.0 8 0.5Kansas 82 1.4 47 0.8 12 0.5 62 0.3 251 1.0 2 0.9 16 1.0New Mexico 104 1.8 17 0.3 87 3.4 1,957 9.2 593 2.4 0 0.0 16 1.0Oklahoma Eastern 16 0.3 17 0.3 0 0.0 5 0.0 21 0.1 0 0.0 2 0.1 Northern 31 0.5 23 0.4 0 0.0 38 0.2 48 0.2 0 0.0 3 0.2 Western 33 0.6 43 0.7 0 0.0 64 0.3 114 0.5 3 1.3 12 0.7Utah 103 1.7 59 1.0 8 0.3 490 2.3 161 0.7 5 2.2 28 1.7Wyoming 34 0.6 7 0.1 0 0.0 83 0.4 140 0.6 2 0.9 11 0.7
Alabama Middle 24 0.4 23 0.4 0 0.0 17 0.1 66 0.3 0 0.0 5 0.3 Northern 109 1.8 58 1.0 2 0.1 32 0.2 84 0.3 3 1.3 16 1.0 Southern 64 1.1 54 0.9 3 0.1 10 0.0 166 0.7 2 0.9 8 0.5Florida Middle 149 2.5 173 2.9 27 1.1 302 1.4 534 2.2 6 2.7 49 3.0 Northern 49 0.8 28 0.5 1 0.0 17 0.1 115 0.5 1 0.4 16 1.0 Southern 92 1.6 461 7.8 49 1.9 161 0.8 640 2.6 3 1.3 32 2.0Georgia Middle 41 0.7 26 0.4 0 0.0 43 0.2 96 0.4 3 1.3 6 0.4 Northern 71 1.2 86 1.5 13 0.5 120 0.6 153 0.6 3 1.3 22 1.3 Southern 101 1.7 44 0.7 0 0.0 9 0.0 168 0.7 2 0.9 12 0.7
______________SOURCE: U.S. Sentencing Commission, 2011 Booker Report Datafiles.
41

District
District of Columbia 57 1.0 42 1.0 3 0.1 4 0.1 12 0.7
Maine 17 0.3 10 0.2 0 0.0 13 0.2 16 0.9Massachusetts 42 0.7 57 1.4 9 0.2 26 0.4 34 1.9New Hampshire 28 0.5 6 0.1 6 0.1 6 0.1 4 0.2Puerto Rico 536 9.1 80 1.9 0 0.0 23 0.3 50 2.8Rhode Island 16 0.3 29 0.7 0 0.0 4 0.1 20 1.1
Connecticut 45 0.8 82 1.9 0 0.0 10 0.1 25 1.4New York Eastern 153 2.6 73 1.7 2 0.0 38 0.6 135 7.7 Northern 75 1.3 78 1.8 4 0.1 74 1.1 6 0.3 Southern 190 3.2 133 3.2 28 0.6 48 0.7 134 7.6 Western 88 1.5 81 1.9 14 0.3 55 0.8 22 1.2Vermont 31 0.5 9 0.2 2 0.0 14 0.2 5 0.3
Delaware 12 0.2 5 0.1 0 0.0 2 0.0 4 0.2New Jersey 108 1.8 24 0.6 4 0.1 7 0.1 60 3.4Pennsylvania Eastern 101 1.7 94 2.2 25 0.6 28 0.4 41 2.3 Middle 40 0.7 68 1.6 16 0.4 29 0.4 21 1.2 Western 62 1.1 72 1.7 1 0.0 7 0.1 24 1.4Virgin Islands 6 0.1 8 0.2 0 0.0 5 0.1 0 0.0
Maryland 79 1.3 83 2.0 6 0.1 12 0.2 58 3.3North Carolina Eastern 90 1.5 183 4.3 28 0.6 24 0.4 13 0.7 Middle 47 0.8 79 1.9 16 0.4 8 0.1 1 0.1 Western 58 1.0 64 1.5 13 0.3 27 0.4 18 1.0South Carolina 126 2.1 200 4.7 24 0.5 21 0.3 10 0.6Virginia Eastern 123 2.1 136 3.2 20 0.5 21 0.3 44 2.5 Western 28 0.5 54 1.3 62 1.4 7 0.1 15 0.9West Virginia Northern 31 0.5 53 1.3 15 0.3 8 0.1 21 1.2 Southern 19 0.3 51 1.2 1 0.0 27 0.4 4 0.2
42

District
Louisiana Eastern 18 0.3 57 1.4 10 0.2 2 0.0 27 1.5 Middle 14 0.2 18 0.4 2 0.0 1 0.0 0 0.0 Western 20 0.3 19 0.5 14 0.3 5 0.1 1 0.1Mississippi Northern 14 0.2 40 0.9 3 0.1 6 0.1 0 0.0 Southern 30 0.5 12 0.3 6 0.1 24 0.4 2 0.1Texas Eastern 135 2.3 69 1.6 157 3.6 66 1.0 11 0.6 Northern 56 1.0 49 1.2 112 2.5 24 0.4 8 0.5 Southern 412 7.0 28 0.7 99 2.2 1,110 16.4 65 3.7 Western 445 7.6 166 3.9 216 4.9 1,191 17.6 80 4.5
Kentucky Eastern 40 0.7 46 1.1 17 0.4 41 0.6 9 0.5 Western 24 0.4 68 1.6 19 0.4 18 0.3 0 0.0Michigan Eastern 73 1.2 53 1.3 3 0.1 59 0.9 22 1.2 Western 26 0.4 19 0.5 2 0.0 42 0.6 10 0.6Ohio Northern 60 1.0 23 0.5 0 0.0 37 0.5 47 2.7 Southern 64 1.1 73 1.7 1 0.0 76 1.1 49 2.8Tennessee Eastern 57 1.0 123 2.9 189 4.3 21 0.3 16 0.9 Middle 35 0.6 12 0.3 11 0.2 15 0.2 2 0.1 Western 31 0.5 35 0.8 63 1.4 32 0.5 6 0.3
Illinois Central 20 0.3 77 1.8 19 0.4 14 0.2 7 0.4 Northern 99 1.7 85 2.0 7 0.2 15 0.2 59 3.3 Southern 23 0.4 59 1.4 26 0.6 14 0.2 11 0.6Indiana Northern 43 0.7 42 1.0 22 0.5 33 0.5 4 0.2 Southern 34 0.6 38 0.9 54 1.2 14 0.2 1 0.1Wisconsin Eastern 83 1.4 82 1.9 2 0.0 27 0.4 61 3.5 Western 10 0.2 22 0.5 14 0.3 13 0.2 8 0.5
Arkansas Eastern 25 0.4 21 0.5 54 1.2 23 0.3 1 0.1 Western 7 0.1 25 0.6 54 1.2 5 0.1 0 0.0Iowa Northern 6 0.1 27 0.6 133 3.0 16 0.2 2 0.1 Southern 13 0.2 37 0.9 83 1.9 8 0.1 1 0.1Minnesota 36 0.6 15 0.4 65 1.5 32 0.5 4 0.2Missouri Eastern 41 0.7 46 1.1 66 1.5 51 0.8 14 0.8 Western 25 0.4 38 0.9 62 1.4 36 0.5 0 0.0Nebraska 6 0.1 45 1.1 137 3.1 25 0.4 2 0.1North Dakota 7 0.1 5 0.1 58 1.3 4 0.1 0 0.0South Dakota 9 0.2 10 0.2 56 1.3 20 0.3 0 0.0
43

District
Alaska 11 0.2 18 0.4 21 0.5 2 0.0 7 0.4Arizona 178 3.0 8 0.2 119 2.7 1,726 25.6 21 1.2California Central 53 0.9 109 2.6 212 4.8 39 0.6 45 2.6 Eastern 30 0.5 19 0.5 110 2.5 106 1.6 14 0.8 Northern 20 0.3 20 0.5 70 1.6 24 0.4 8 0.5 Southern 246 4.2 14 0.3 442 10.0 366 5.4 62 3.5Guam 0 0.0 0 0.0 11 0.2 1 0.0 0 0.0Hawaii 2 0.0 2 0.0 76 1.7 4 0.1 15 0.9Idaho 10 0.2 1 0.0 111 2.5 7 0.1 0 0.0Montana 42 0.7 0 0.0 62 1.4 5 0.1 4 0.2Nevada 12 0.2 12 0.3 75 1.7 9 0.1 15 0.9Northern Mariana Islands 0 0.0 0 0.0 2 0.0 0 0.0 0 0.0Oregon 6 0.1 13 0.3 64 1.5 45 0.7 14 0.8Washington Eastern 10 0.2 3 0.1 31 0.7 35 0.5 3 0.2 Western 27 0.5 13 0.3 61 1.4 18 0.3 28 1.6
Colorado 61 1.0 27 0.6 48 1.1 8 0.1 3 0.2Kansas 37 0.6 56 1.3 96 2.2 38 0.6 9 0.5New Mexico 72 1.2 24 0.6 111 2.5 334 4.9 47 2.7Oklahoma Eastern 1 0.0 7 0.2 11 0.2 1 0.0 0 0.0 Northern 8 0.1 4 0.1 27 0.6 5 0.1 2 0.1 Western 8 0.1 45 1.1 29 0.7 3 0.0 15 0.9Utah 4 0.1 5 0.1 98 2.2 26 0.4 19 1.1Wyoming 14 0.2 1 0.0 119 2.7 1 0.0 2 0.1
Alabama Middle 9 0.2 17 0.4 28 0.6 11 0.2 0 0.0 Northern 18 0.3 35 0.8 19 0.4 4 0.1 3 0.2 Southern 24 0.4 51 1.2 53 1.2 11 0.2 0 0.0Florida Middle 193 3.3 103 2.4 75 1.7 89 1.3 22 1.2 Northern 58 1.0 21 0.5 3 0.1 15 0.2 0 0.0 Southern 354 6.0 52 1.2 22 0.5 80 1.2 64 3.6Georgia Middle 29 0.5 43 1.0 11 0.2 9 0.1 0 0.0 Northern 56 1.0 6 0.1 45 1.0 20 0.3 13 0.7 Southern 40 0.7 52 1.2 11 0.2 42 0.6 2 0.1
______________SOURCE: U.S. Sentencing Commission, 2011 Booker Report Datafiles.
44

District
District of Columbia 57 42.9 42 31.6 3 2.3 4 3.0 12 9.0
Maine 17 24.3 10 14.3 0 0.0 13 18.6 16 22.9Massachusetts 42 21.9 57 29.7 9 4.7 26 13.5 34 17.7New Hampshire 28 32.9 6 7.1 6 7.1 6 7.1 4 4.7Puerto Rico 536 76.7 80 11.4 0 0.0 23 3.3 50 7.2Rhode Island 16 19.3 29 34.9 0 0.0 4 4.8 20 24.1
Connecticut 45 27.4 82 50.0 0 0.0 10 6.1 25 15.2New York Eastern 153 37.3 73 17.8 2 0.5 38 9.3 135 32.9 Northern 75 30.9 78 32.1 4 1.6 74 30.5 6 2.5 Southern 190 32.8 133 23.0 28 4.8 48 8.3 134 23.1 Western 88 28.5 81 26.2 14 4.5 55 17.8 22 7.1Vermont 31 37.8 9 11.0 2 2.4 14 17.1 5 6.1
Delaware 12 44.4 5 18.5 0 0.0 2 7.4 4 14.8New Jersey 108 48.4 24 10.8 4 1.8 7 3.1 60 26.9Pennsylvania Eastern 101 30.8 94 28.7 25 7.6 28 8.5 41 12.5 Middle 40 22.6 68 38.4 16 9.0 29 16.4 21 11.9 Western 62 34.6 72 40.2 1 0.6 7 3.9 24 13.4Virgin Islands 6 31.6 8 42.1 0 0.0 5 26.3 0 0.0
Maryland 79 31.5 83 33.1 6 2.4 12 4.8 58 23.1North Carolina Eastern 90 26.0 183 52.9 28 8.1 24 6.9 13 3.8 Middle 47 30.7 79 51.6 16 10.5 8 5.2 1 0.7 Western 58 31.9 64 35.2 13 7.1 27 14.8 18 9.9South Carolina 126 31.4 200 49.9 24 6.0 21 5.2 10 2.5Virginia Eastern 123 31.6 136 35.0 20 5.1 21 5.4 44 11.3 Western 28 14.2 54 27.4 62 31.5 7 3.6 15 7.6West Virginia Northern 31 21.5 53 36.8 15 10.4 8 5.6 21 14.6 Southern 19 11.4 51 30.7 1 0.6 27 16.3 4 2.4
45

District
Louisiana Eastern 18 15.0 57 47.5 10 8.3 2 1.7 27 22.5 Middle 14 37.8 18 48.6 2 5.4 1 2.7 0 0.0 Western 20 33.3 19 31.7 14 23.3 5 8.3 1 1.7Mississippi Northern 14 21.5 40 61.5 3 4.6 6 9.2 0 0.0 Southern 30 39.0 12 15.6 6 7.8 24 31.2 2 2.6Texas Eastern 135 29.3 69 15.0 157 34.1 66 14.3 11 2.4 Northern 56 21.6 49 18.9 112 43.2 24 9.3 8 3.1 Southern 412 23.7 28 1.6 99 5.7 1,110 64.0 65 3.7 Western 445 20.8 166 7.7 216 10.1 1,191 55.6 80 3.7
Kentucky Eastern 40 15.4 46 17.8 17 6.6 41 15.8 9 3.5 Western 24 15.2 68 43.0 19 12.0 18 11.4 0 0.0Michigan Eastern 73 30.0 53 21.8 3 1.2 59 24.3 22 9.1 Western 26 25.0 19 18.3 2 1.9 42 40.4 10 9.6Ohio Northern 60 34.7 23 13.3 0 0.0 37 21.4 47 27.2 Southern 64 23.8 73 27.1 1 0.4 76 28.3 49 18.2Tennessee Eastern 57 12.0 123 25.9 189 39.9 21 4.4 16 3.4 Middle 35 42.7 12 14.6 11 13.4 15 18.3 2 2.4 Western 31 16.8 35 19.0 63 34.2 32 17.4 6 3.3
Illinois Central 20 14.5 77 55.8 19 13.8 14 10.1 7 5.1 Northern 99 34.7 85 29.8 7 2.5 15 5.3 59 20.7 Southern 23 16.5 59 42.4 26 18.7 14 10.1 11 7.9Indiana Northern 43 29.3 42 28.6 22 15.0 33 22.4 4 2.7 Southern 34 23.8 38 26.6 54 37.8 14 9.8 1 0.7Wisconsin Eastern 83 31.7 82 31.3 2 0.8 27 10.3 61 23.3 Western 10 14.7 22 32.4 14 20.6 13 19.1 8 11.8
Arkansas Eastern 25 19.8 21 16.7 54 42.9 23 18.3 1 0.8 Western 7 7.7 25 27.5 54 59.3 5 5.5 0 0.0Iowa Northern 6 3.3 27 14.7 133 72.3 16 8.7 2 1.1 Southern 13 8.8 37 25.0 83 56.1 8 5.4 1 0.7Minnesota 36 22.6 15 9.4 65 40.9 32 20.1 4 2.5Missouri Eastern 41 18.2 46 20.4 66 29.3 51 22.7 14 6.2 Western 25 14.4 38 21.8 62 35.6 36 20.7 0 0.0Nebraska 6 2.7 45 20.5 137 62.6 25 11.4 2 0.9North Dakota 7 9.2 5 6.6 58 76.3 4 5.3 0 0.0South Dakota 9 8.7 10 9.6 56 53.8 20 19.2 0 0.0
46

District
Alaska 11 16.7 18 27.3 21 31.8 2 3.0 7 10.6Arizona 178 8.7 8 0.4 119 5.8 1,726 84.0 21 1.0California Central 53 10.4 109 21.3 212 41.5 39 7.6 45 8.8 Eastern 30 10.2 19 6.4 110 37.3 106 35.9 14 4.7 Northern 20 12.6 20 12.6 70 44.0 24 15.1 8 5.0 Southern 246 21.4 14 1.2 442 38.4 366 31.8 62 5.4Guam 0 0.0 0 0.0 11 91.7 1 8.3 0 0.0Hawaii 2 1.9 2 1.9 76 73.8 4 3.9 15 14.6Idaho 10 7.5 1 0.7 111 82.8 7 5.2 0 0.0Montana 42 36.2 0 0.0 62 53.4 5 4.3 4 3.4Nevada 12 9.2 12 9.2 75 57.3 9 6.9 15 11.5Northern Mariana Islands 0 0.0 0 0.0 2 100.0 0 0.0 0 0.0Oregon 6 3.9 13 8.4 64 41.3 45 29.0 14 9.0Washington Eastern 10 11.0 3 3.3 31 34.1 35 38.5 3 3.3 Western 27 14.1 13 6.8 61 31.8 18 9.4 28 14.6
Colorado 61 38.4 27 17.0 48 30.2 8 5.0 3 1.9Kansas 37 14.7 56 22.3 96 38.2 38 15.1 9 3.6New Mexico 72 12.1 24 4.0 111 18.7 334 56.3 47 7.9Oklahoma Eastern 1 4.8 7 33.3 11 52.4 1 4.8 0 0.0 Northern 8 16.7 4 8.3 27 56.3 5 10.4 2 4.2 Western 8 7.0 45 39.5 29 25.4 3 2.6 15 13.2Utah 4 2.5 5 3.1 98 60.9 26 16.1 19 11.8Wyoming 14 10.0 1 0.7 119 85.0 1 0.7 2 1.4
Alabama Middle 9 13.6 17 25.8 28 42.4 11 16.7 0 0.0 Northern 18 21.4 35 41.7 19 22.6 4 4.8 3 3.6 Southern 24 14.5 51 30.7 53 31.9 11 6.6 0 0.0Florida Middle 193 36.1 103 19.3 75 14.0 89 16.7 22 4.1 Northern 58 50.4 21 18.3 3 2.6 15 13.0 0 0.0 Southern 354 55.3 52 8.1 22 3.4 80 12.5 64 10.0Georgia Middle 29 30.2 43 44.8 11 11.5 9 9.4 0 0.0 Northern 56 36.6 6 3.9 45 29.4 20 13.1 13 8.5 Southern 40 23.8 52 31.0 11 6.5 42 25.0 2 1.2
______________SOURCE: U.S. Sentencing Commission, 2011 Booker Report Datafiles.
47

Koon Gall
Koon Booker Gall
48

Koon Booker Gall
49

Koon Booker Gall
50

Koon Gall
Koon Booker Gall
51

Koon Booker Gall
52

Koon Booker Gall
53

Koon Gall
Koon Booker Gall
54

Koon Booker Gall
55

Koon Booker Gall
56

District
District of Columbia 48 21 43.8 14 5 35.7 28 14 50.0 12 7 58.3
Maine 105 41 39.0 10 1 10.0 40 19 47.5 52 27 51.9Massachusetts 197 86 43.7 8 6 75.0 61 19 31.1 66 13 19.7New Hampshire 71 47 66.2 17 10 58.8 22 8 36.4 40 19 47.5Puerto Rico 66 4 6.1 17 4 23.5 47 4 8.5 47 1 2.1Rhode Island 27 5 18.5 2 0 0.0 10 2 20.0 10 2 20.0
Connecticut 55 16 29.1 5 3 60.0 16 2 12.5 20 3 15.0New York Eastern 295 88 29.8 49 16 32.7 118 43 36.4 127 39 30.7 Northern 212 134 63.2 46 19 41.3 127 63 49.6 194 83 42.8 Southern 107 32 29.9 19 2 10.5 126 29 23.0 162 36 22.2 Western 212 97 45.8 48 27 56.3 176 86 48.9 162 77 47.5Vermont 105 35 33.3 17 9 52.9 83 38 45.8 70 20 28.6
Delaware 23 8 34.8 3 1 33.3 2 0 0.0 10 6 60.0New Jersey 24 12 50.0 3 1 33.3 32 14 43.8 17 4 23.5Pennsylvania Eastern 231 165 71.4 15 11 73.3 84 31 36.9 85 43 50.6 Middle 86 43 50.0 9 3 33.3 42 17 40.5 85 30 35.3 Western 74 33 44.6 9 1 11.1 37 18 48.6 23 8 34.8Virgin Islands 18 2 11.1 3 2 66.7 18 1 5.6 33 5 15.2
Maryland 75 36 48.0 11 4 36.4 38 20 52.6 38 13 34.2North Carolina Eastern 128 63 49.2 23 10 43.5 43 18 41.9 75 31 41.3 Middle 115 43 37.4 12 0 0.0 27 6 22.2 33 9 27.3 Western 260 156 60.0 39 13 33.3 87 31 35.6 91 37 40.7South Carolina 239 98 41.0 27 4 14.8 82 17 20.7 68 12 17.6Virginia Eastern 291 52 17.9 75 7 9.3 190 8 4.2 115 15 13.0 Western 129 33 25.6 22 8 36.4 91 26 28.6 31 4 12.9West Virginia Northern 76 8 10.5 18 3 16.7 58 5 8.6 42 6 14.3 Southern 180 27 15.0 21 0 0.0 67 3 4.5 49 8 16.3
Koon Gall
Koon Booker Gall
57

District
Louisiana Eastern 102 21 20.6 12 1 8.3 26 5 19.2 15 1 6.7 Middle 20 10 50.0 3 1 33.3 15 1 6.7 7 3 42.9 Western 53 20 37.7 10 3 30.0 37 9 24.3 26 3 11.5Mississippi Northern 64 32 50.0 15 7 46.7 33 9 27.3 15 4 26.7 Southern 114 37 32.5 42 10 23.8 58 6 10.3 45 12 26.7Texas Eastern 269 33 12.3 36 4 11.1 94 13 13.8 201 18 9.0 Northern 378 115 30.4 51 5 9.8 115 26 22.6 110 28 25.5 Southern 5,896 1,405 23.8 1,065 105 9.9 2,169 282 13.0 3,488 362 10.4 Western 9,420 1,063 11.3 1,876 196 10.4 3,861 305 7.9 5,504 474 8.6
Kentucky Eastern 555 184 33.2 74 32 43.2 179 94 52.5 172 80 46.5 Western 124 25 20.2 16 3 18.8 62 21 33.9 69 30 43.5Michigan Eastern 504 224 44.4 73 41 56.2 275 133 48.4 207 57 27.5 Western 291 128 44.0 62 28 45.2 99 35 35.4 151 36 23.8Ohio Northern 201 110 54.7 22 8 36.4 75 37 49.3 118 57 48.3 Southern 226 134 59.3 41 22 53.7 111 62 55.9 247 143 57.9Tennessee Eastern 328 168 51.2 47 17 36.2 107 36 33.6 90 36 40.0 Middle 95 40 42.1 21 8 38.1 46 11 23.9 38 9 23.7 Western 157 71 45.2 14 7 50.0 56 23 41.1 135 52 38.5
Illinois Central 88 43 48.9 16 4 25.0 33 5 15.2 61 11 18.0 Northern 122 48 39.3 32 15 46.9 45 11 24.4 45 9 20.0 Southern 159 12 7.5 31 4 12.9 57 4 7.0 65 7 10.8Indiana Northern 99 29 29.3 27 6 22.2 55 20 36.4 114 30 26.3 Southern 114 56 49.1 27 10 37.0 69 20 29.0 67 11 16.4Wisconsin Eastern 69 18 26.1 28 0 0.0 52 12 23.1 119 30 25.2 Western 37 6 16.2 9 1 11.1 18 1 5.6 33 10 30.3
Arkansas Eastern 123 24 19.5 15 2 13.3 71 21 29.6 78 19 24.4 Western 53 18 34.0 9 4 44.4 20 15 75.0 21 14 66.7Iowa Northern 84 27 32.1 28 13 46.4 45 15 33.3 58 16 27.6 Southern 70 32 45.7 13 4 30.8 48 13 27.1 94 33 35.1Minnesota 128 44 34.4 29 13 44.8 103 35 34.0 121 28 23.1Missouri Eastern 236 87 36.9 44 11 25.0 120 28 23.3 167 43 25.7 Western 320 179 55.9 44 20 45.5 84 27 32.1 109 33 30.3Nebraska 123 31 25.2 25 0 0.0 89 13 14.6 84 6 7.1North Dakota 32 5 15.6 8 2 25.0 8 3 37.5 9 5 55.6South Dakota 148 27 18.2 31 3 9.7 79 3 3.8 66 2 3.0
Koon Booker Gall
58

District
Alaska 45 9 20.0 8 0 0.0 11 2 18.2 19 10 52.6Arizona 3,964 445 11.2 616 93 15.1 2,038 212 10.4 3,707 219 5.9California Central 62 15 24.2 19 5 26.3 43 5 11.6 133 29 21.8 Eastern 171 57 33.3 43 17 39.5 105 17 16.2 340 80 23.5 Northern 86 20 23.3 13 1 7.7 38 11 28.9 66 10 15.2 Southern 7,461 651 8.7 525 33 6.3 1,766 93 5.3 1,991 85 4.3Guam 6 2 33.3 1 1 100.0 1 0 0.0 2 2 100.0Hawaii 64 24 37.5 5 1 20.0 29 11 37.9 16 5 31.3Idaho 41 17 41.5 8 3 37.5 21 17 81.0 34 23 67.6Montana 162 47 29.0 23 8 34.8 50 9 18.0 38 9 23.7Nevada 50 16 32.0 11 4 36.4 13 2 15.4 20 2 10.0Northern Mariana Islands 0 0 0.0 0 0 0.0 0 0 0.0 0 0 0.0Oregon 89 29 32.6 33 14 42.4 81 29 35.8 142 49 34.5Washington Eastern 126 23 18.3 39 7 17.9 65 20 30.8 123 25 20.3 Western 295 106 35.9 80 20 25.0 195 57 29.2 188 48 25.5
Colorado 128 50 39.1 14 5 35.7 50 20 40.0 45 18 40.0Kansas 193 48 24.9 39 9 23.1 118 33 28.0 137 42 30.7New Mexico 1,889 177 9.4 262 12 4.6 1,065 70 6.6 1,472 91 6.2Oklahoma Eastern 35 3 8.6 5 1 20.0 6 1 16.7 5 1 20.0 Northern 50 9 18.0 3 0 0.0 16 4 25.0 30 6 20.0 Western 89 15 16.9 10 4 40.0 33 4 12.1 23 7 30.4Utah 45 6 13.3 11 0 0.0 40 8 20.0 55 15 27.3Wyoming 39 4 10.3 9 1 11.1 49 8 16.3 13 2 15.4
Alabama Middle 76 31 40.8 3 1 33.3 33 22 66.7 27 10 37.0 Northern 159 100 62.9 18 5 27.8 37 13 35.1 34 15 44.1 Southern 175 77 44.0 24 13 54.2 42 16 38.1 49 10 20.4Florida Middle 728 338 46.4 106 36 34.0 314 95 30.3 412 142 34.5 Northern 318 97 30.5 70 30 42.9 115 43 37.4 107 29 27.1 Southern 535 104 19.4 84 20 23.8 366 59 16.1 274 24 8.8Georgia Middle 142 59 41.5 18 5 27.8 33 12 36.4 42 6 14.3 Northern 259 86 33.2 45 12 26.7 57 12 21.1 111 25 22.5 Southern 96 37 38.5 18 6 33.3 40 9 22.5 97 14 14.4
Cases missing information necessary to determine sentence position relative to the guideline range were excluded from the analysis.
SOURCE: U.S. Sentencing Commission, 2011 Booker Report Datafiles.
Koon Booker Gall
59

District
District of Columbia 48 n/a n/a 14 0 0.0 28 0 0.0 12 0 0.0
Maine 105 n/a n/a 10 0 0.0 40 0 0.0 52 0 0.0Massachusetts 197 n/a n/a 8 0 0.0 61 0 0.0 66 0 0.0New Hampshire 71 n/a n/a 17 0 0.0 22 0 0.0 40 0 0.0Puerto Rico 66 n/a n/a 17 0 0.0 47 0 0.0 47 0 0.0Rhode Island 27 n/a n/a 2 0 0.0 10 0 0.0 10 0 0.0
Connecticut 55 n/a n/a 5 0 0.0 16 0 0.0 20 0 0.0New York Eastern 295 n/a n/a 49 0 0.0 118 1 0.8 127 0 0.0 Northern 212 n/a n/a 46 0 0.0 127 0 0.0 194 0 0.0 Southern 107 n/a n/a 19 0 0.0 126 0 0.0 162 0 0.0 Western 212 n/a n/a 48 0 0.0 176 0 0.0 162 0 0.0Vermont 105 n/a n/a 17 0 0.0 83 0 0.0 70 0 0.0
Delaware 23 n/a n/a 3 0 0.0 2 0 0.0 10 0 0.0New Jersey 24 n/a n/a 3 0 0.0 32 0 0.0 17 0 0.0Pennsylvania Eastern 231 n/a n/a 15 0 0.0 84 0 0.0 85 0 0.0 Middle 86 n/a n/a 9 0 0.0 42 0 0.0 85 0 0.0 Western 74 n/a n/a 9 0 0.0 37 0 0.0 23 0 0.0Virgin Islands 18 n/a n/a 3 0 0.0 18 0 0.0 33 0 0.0
Maryland 75 n/a n/a 11 0 0.0 38 0 0.0 38 0 0.0North Carolina Eastern 128 n/a n/a 23 0 0.0 43 0 0.0 75 0 0.0 Middle 115 n/a n/a 12 0 0.0 27 0 0.0 33 0 0.0 Western 260 n/a n/a 39 0 0.0 87 0 0.0 91 0 0.0South Carolina 239 n/a n/a 27 0 0.0 82 0 0.0 68 0 0.0Virginia Eastern 291 n/a n/a 75 0 0.0 190 0 0.0 115 0 0.0 Western 129 n/a n/a 22 0 0.0 91 0 0.0 31 0 0.0West Virginia Northern 76 n/a n/a 18 0 0.0 58 0 0.0 42 0 0.0 Southern 180 n/a n/a 21 0 0.0 67 0 0.0 49 0 0.0
Koon Gall
Koon Booker Gall
60

District
Louisiana Eastern 102 n/a n/a 12 0 0.0 26 0 0.0 15 0 0.0 Middle 20 n/a n/a 3 0 0.0 15 0 0.0 7 0 0.0 Western 53 n/a n/a 10 0 0.0 37 0 0.0 26 0 0.0Mississippi Northern 64 n/a n/a 15 0 0.0 33 0 0.0 15 0 0.0 Southern 114 n/a n/a 42 0 0.0 58 0 0.0 45 0 0.0Texas Eastern 269 n/a n/a 36 0 0.0 94 0 0.0 201 0 0.0 Northern 378 n/a n/a 51 0 0.0 115 0 0.0 110 0 0.0 Southern 5,896 n/a n/a 1,065 0 0.0 2,169 10 0.5 3,488 4 0.1 Western 9,420 n/a n/a 1,876 0 0.0 3,861 4 0.1 5,504 0 0.0
Kentucky Eastern 555 n/a n/a 74 0 0.0 179 0 0.0 172 0 0.0 Western 124 n/a n/a 16 0 0.0 62 0 0.0 69 0 0.0Michigan Eastern 504 n/a n/a 73 0 0.0 275 0 0.0 207 0 0.0 Western 291 n/a n/a 62 0 0.0 99 0 0.0 151 0 0.0Ohio Northern 201 n/a n/a 22 0 0.0 75 0 0.0 118 0 0.0 Southern 226 n/a n/a 41 0 0.0 111 0 0.0 247 0 0.0Tennessee Eastern 328 n/a n/a 47 0 0.0 107 0 0.0 90 0 0.0 Middle 95 n/a n/a 21 0 0.0 46 0 0.0 38 0 0.0 Western 157 n/a n/a 14 0 0.0 56 0 0.0 135 0 0.0
Illinois Central 88 n/a n/a 16 0 0.0 33 0 0.0 61 1 1.6 Northern 122 n/a n/a 32 0 0.0 45 0 0.0 45 0 0.0 Southern 159 n/a n/a 31 0 0.0 57 0 0.0 65 0 0.0Indiana Northern 99 n/a n/a 27 0 0.0 55 0 0.0 114 0 0.0 Southern 114 n/a n/a 27 0 0.0 69 0 0.0 67 0 0.0Wisconsin Eastern 69 n/a n/a 28 0 0.0 52 0 0.0 119 0 0.0 Western 37 n/a n/a 9 0 0.0 18 0 0.0 33 0 0.0
Arkansas Eastern 123 n/a n/a 15 0 0.0 71 0 0.0 78 0 0.0 Western 53 n/a n/a 9 0 0.0 20 0 0.0 21 0 0.0Iowa Northern 84 n/a n/a 28 0 0.0 45 0 0.0 58 0 0.0 Southern 70 n/a n/a 13 0 0.0 48 0 0.0 94 0 0.0Minnesota 128 n/a n/a 29 0 0.0 103 0 0.0 121 0 0.0Missouri Eastern 236 n/a n/a 44 0 0.0 120 0 0.0 167 0 0.0 Western 320 n/a n/a 44 0 0.0 84 0 0.0 109 0 0.0Nebraska 123 n/a n/a 25 0 0.0 89 0 0.0 84 0 0.0North Dakota 32 n/a n/a 8 0 0.0 8 0 0.0 9 0 0.0South Dakota 148 n/a n/a 31 0 0.0 79 0 0.0 66 0 0.0
Koon Booker Gall
61
District
Alaska 45 n/a n/a 8 0 0.0 11 0 0.0 19 0 0.0Arizona 3,964 n/a n/a 616 83 13.5 2,038 1,209 59.3 3,707 1,398 37.7California Central 62 n/a n/a 19 0 0.0 43 1 2.3 133 0 0.0 Eastern 171 n/a n/a 43 0 0.0 105 0 0.0 340 0 0.0 Northern 86 n/a n/a 13 0 0.0 38 1 2.6 66 0 0.0 Southern 7,461 n/a n/a 525 96 18.3 1,766 1,185 67.1 1,991 1,386 69.6Guam 6 n/a n/a 1 0 0.0 1 0 0.0 2 0 0.0Hawaii 64 n/a n/a 5 0 0.0 29 0 0.0 16 0 0.0Idaho 41 n/a n/a 8 0 0.0 21 0 0.0 34 0 0.0Montana 162 n/a n/a 23 0 0.0 50 0 0.0 38 0 0.0Nevada 50 n/a n/a 11 0 0.0 13 0 0.0 20 0 0.0Northern Mariana Islands 0 n/a n/a 0 0 0.0 0 0 0.0 0 0 0.0Oregon 89 n/a n/a 33 0 0.0 81 0 0.0 142 0 0.0Washington Eastern 126 n/a n/a 39 0 0.0 65 0 0.0 123 0 0.0 Western 295 n/a n/a 80 0 0.0 195 0 0.0 188 0 0.0
Colorado 128 n/a n/a 14 0 0.0 50 0 0.0 45 0 0.0Kansas 193 n/a n/a 39 0 0.0 118 0 0.0 137 0 0.0New Mexico 1,889 n/a n/a 262 36 13.7 1,065 372 34.9 1,472 642 43.6Oklahoma Eastern 35 n/a n/a 5 0 0.0 6 0 0.0 5 0 0.0 Northern 50 n/a n/a 3 0 0.0 16 0 0.0 30 0 0.0 Western 89 n/a n/a 10 0 0.0 33 0 0.0 23 0 0.0Utah 45 n/a n/a 11 0 0.0 40 0 0.0 55 0 0.0Wyoming 39 n/a n/a 9 0 0.0 49 0 0.0 13 0 0.0
Alabama Middle 76 n/a n/a 3 0 0.0 33 0 0.0 27 0 0.0 Northern 159 n/a n/a 18 0 0.0 37 0 0.0 34 0 0.0 Southern 175 n/a n/a 24 0 0.0 42 0 0.0 49 0 0.0Florida Middle 728 n/a n/a 106 0 0.0 314 0 0.0 412 0 0.0 Northern 318 n/a n/a 70 0 0.0 115 0 0.0 107 0 0.0 Southern 535 n/a n/a 84 0 0.0 366 0 0.0 274 0 0.0Georgia Middle 142 n/a n/a 18 0 0.0 33 0 0.0 42 0 0.0 Northern 259 n/a n/a 45 0 0.0 57 0 0.0 111 0 0.0 Southern 96 n/a n/a 18 0 0.0 40 0 0.0 97 0 0.0
Cases missing information necessary to determine sentence position relative to the guideline range were excluded from the analysis.
SOURCE: U.S. Sentencing Commission, 2011 Booker Report Datafiles.
Koon Booker Gall
62

District
District of Columbia 48 n/a n/a 14 2 14.3 28 2 7.1 12 1 8.3
Maine 105 n/a n/a 10 0 0.0 40 0 0.0 52 0 0.0Massachusetts 197 n/a n/a 8 0 0.0 61 1 1.6 66 13 19.7New Hampshire 71 n/a n/a 17 0 0.0 22 1 4.5 40 3 7.5Puerto Rico 66 n/a n/a 17 0 0.0 47 0 0.0 47 0 0.0Rhode Island 27 n/a n/a 2 0 0.0 10 1 10.0 10 1 10.0
Connecticut 55 n/a n/a 5 1 20.0 16 0 0.0 20 3 15.0New York Eastern 295 n/a n/a 49 5 10.2 118 3 2.5 127 13 10.2 Northern 212 n/a n/a 46 0 0.0 127 0 0.0 194 1 0.5 Southern 107 n/a n/a 19 0 0.0 126 2 1.6 162 7 4.3 Western 212 n/a n/a 48 0 0.0 176 6 3.4 162 3 1.9Vermont 105 n/a n/a 17 0 0.0 83 2 2.4 70 4 5.7
Delaware 23 n/a n/a 3 0 0.0 2 0 0.0 10 0 0.0New Jersey 24 n/a n/a 3 0 0.0 32 0 0.0 17 0 0.0Pennsylvania Eastern 231 n/a n/a 15 0 0.0 84 1 1.2 85 0 0.0 Middle 86 n/a n/a 9 0 0.0 42 1 2.4 85 2 2.4 Western 74 n/a n/a 9 0 0.0 37 0 0.0 23 0 0.0Virgin Islands 18 n/a n/a 3 0 0.0 18 0 0.0 33 0 0.0
Maryland 75 n/a n/a 11 0 0.0 38 2 5.3 38 1 2.6North Carolina Eastern 128 n/a n/a 23 0 0.0 43 0 0.0 75 0 0.0 Middle 115 n/a n/a 12 0 0.0 27 0 0.0 33 0 0.0 Western 260 n/a n/a 39 1 2.6 87 4 4.6 91 3 3.3South Carolina 239 n/a n/a 27 0 0.0 82 0 0.0 68 3 4.4Virginia Eastern 291 n/a n/a 75 0 0.0 190 2 1.1 115 1 0.9 Western 129 n/a n/a 22 0 0.0 91 0 0.0 31 1 3.2West Virginia Northern 76 n/a n/a 18 0 0.0 58 1 1.7 42 0 0.0 Southern 180 n/a n/a 21 0 0.0 67 0 0.0 49 0 0.0
Koon Gall
Koon Booker Gall
63

District
Louisiana Eastern 102 n/a n/a 12 0 0.0 26 0 0.0 15 0 0.0 Middle 20 n/a n/a 3 0 0.0 15 0 0.0 7 0 0.0 Western 53 n/a n/a 10 0 0.0 37 0 0.0 26 0 0.0Mississippi Northern 64 n/a n/a 15 1 6.7 33 6 18.2 15 1 6.7 Southern 114 n/a n/a 42 0 0.0 58 0 0.0 45 0 0.0Texas Eastern 269 n/a n/a 36 0 0.0 94 0 0.0 201 1 0.5 Northern 378 n/a n/a 51 0 0.0 115 2 1.7 110 2 1.8 Southern 5,896 n/a n/a 1,065 129 12.1 2,169 241 11.1 3,488 188 5.4 Western 9,420 n/a n/a 1,876 14 0.7 3,861 22 0.6 5,504 39 0.7
Kentucky Eastern 555 n/a n/a 74 0 0.0 179 0 0.0 172 3 1.7 Western 124 n/a n/a 16 0 0.0 62 2 3.2 69 3 4.3Michigan Eastern 504 n/a n/a 73 0 0.0 275 3 1.1 207 6 2.9 Western 291 n/a n/a 62 1 1.6 99 1 1.0 151 2 1.3Ohio Northern 201 n/a n/a 22 0 0.0 75 1 1.3 118 2 1.7 Southern 226 n/a n/a 41 0 0.0 111 1 0.9 247 5 2.0Tennessee Eastern 328 n/a n/a 47 0 0.0 107 1 0.9 90 2 2.2 Middle 95 n/a n/a 21 0 0.0 46 1 2.2 38 2 5.3 Western 157 n/a n/a 14 0 0.0 56 1 1.8 135 1 0.7
Illinois Central 88 n/a n/a 16 0 0.0 33 2 6.1 61 0 0.0 Northern 122 n/a n/a 32 0 0.0 45 1 2.2 45 0 0.0 Southern 159 n/a n/a 31 0 0.0 57 2 3.5 65 0 0.0Indiana Northern 99 n/a n/a 27 2 7.4 55 1 1.8 114 2 1.8 Southern 114 n/a n/a 27 1 3.7 69 4 5.8 67 2 3.0Wisconsin Eastern 69 n/a n/a 28 0 0.0 52 0 0.0 119 15 12.6 Western 37 n/a n/a 9 0 0.0 18 0 0.0 33 0 0.0
Arkansas Eastern 123 n/a n/a 15 0 0.0 71 1 1.4 78 1 1.3 Western 53 n/a n/a 9 0 0.0 20 0 0.0 21 0 0.0Iowa Northern 84 n/a n/a 28 0 0.0 45 2 4.4 58 1 1.7 Southern 70 n/a n/a 13 0 0.0 48 1 2.1 94 2 2.1Minnesota 128 n/a n/a 29 0 0.0 103 2 1.9 121 1 0.8Missouri Eastern 236 n/a n/a 44 0 0.0 120 0 0.0 167 5 3.0 Western 320 n/a n/a 44 2 4.5 84 1 1.2 109 1 0.9Nebraska 123 n/a n/a 25 0 0.0 89 2 2.2 84 5 6.0North Dakota 32 n/a n/a 8 0 0.0 8 0 0.0 9 0 0.0South Dakota 148 n/a n/a 31 0 0.0 79 1 1.3 66 1 1.5
Koon Booker Gall
64

District
Alaska 45 n/a n/a 8 0 0.0 11 1 9.1 19 2 10.5Arizona 3,964 n/a n/a 616 174 28.2 2,038 67 3.3 3,707 118 3.2California Central 62 n/a n/a 19 1 5.3 43 5 11.6 133 15 11.3 Eastern 171 n/a n/a 43 1 2.3 105 6 5.7 340 5 1.5 Northern 86 n/a n/a 13 0 0.0 38 4 10.5 66 20 30.3 Southern 7,461 n/a n/a 525 280 53.3 1,766 32 1.8 1,991 50 2.5Guam 6 n/a n/a 1 0 0.0 1 0 0.0 2 0 0.0Hawaii 64 n/a n/a 5 0 0.0 29 1 3.4 16 2 12.5Idaho 41 n/a n/a 8 0 0.0 21 0 0.0 34 0 0.0Montana 162 n/a n/a 23 0 0.0 50 1 2.0 38 0 0.0Nevada 50 n/a n/a 11 0 0.0 13 0 0.0 20 6 30.0Northern Mariana Islands 0 n/a n/a 0 0 0.0 0 0 0.0 0 0 0.0Oregon 89 n/a n/a 33 1 3.0 81 4 4.9 142 21 14.8Washington Eastern 126 n/a n/a 39 0 0.0 65 3 4.6 123 9 7.3 Western 295 n/a n/a 80 2 2.5 195 24 12.3 188 48 25.5
Colorado 128 n/a n/a 14 0 0.0 50 1 2.0 45 2 4.4Kansas 193 n/a n/a 39 0 0.0 118 5 4.2 137 9 6.6New Mexico 1,889 n/a n/a 262 20 7.6 1,065 40 3.8 1,472 43 2.9Oklahoma Eastern 35 n/a n/a 5 0 0.0 6 0 0.0 5 0 0.0 Northern 50 n/a n/a 3 0 0.0 16 0 0.0 30 0 0.0 Western 89 n/a n/a 10 0 0.0 33 0 0.0 23 0 0.0Utah 45 n/a n/a 11 0 0.0 40 3 7.5 55 2 3.6Wyoming 39 n/a n/a 9 0 0.0 49 4 8.2 13 1 7.7
Alabama Middle 76 n/a n/a 3 0 0.0 33 0 0.0 27 0 0.0 Northern 159 n/a n/a 18 0 0.0 37 0 0.0 34 0 0.0 Southern 175 n/a n/a 24 0 0.0 42 0 0.0 49 0 0.0Florida Middle 728 n/a n/a 106 0 0.0 314 2 0.6 412 2 0.5 Northern 318 n/a n/a 70 0 0.0 115 0 0.0 107 0 0.0 Southern 535 n/a n/a 84 0 0.0 366 5 1.4 274 2 0.7Georgia Middle 142 n/a n/a 18 1 5.6 33 0 0.0 42 0 0.0 Northern 259 n/a n/a 45 0 0.0 57 0 0.0 111 2 1.8 Southern 96 n/a n/a 18 0 0.0 40 1 2.5 97 3 3.1
Cases missing information necessary to determine sentence position relative to the guideline range were excluded from the analysis.
SOURCE: U.S. Sentencing Commission, 2011 Booker Report Datafiles.
Koon Booker Gall
65

Koon Gall
Koon Booker Gall
66

Koon Booker Gall
67

Koon Booker Gall
68

CIRCUIT
District Total
Mean Guideline Minimum
Mean Months Total
Mean Guideline Minimum
Mean Months Total
Mean Guideline Minimum
Mean Months Total
Mean Guideline Minimum
Mean Months
TOTAL 41,914 43 34 6,610 46 39 17,048 49 40 23,458 42 35
D.C. CIRCUIT 48 109 52 14 104 42 28 92 44 12 108 40District of Columbia 48 109 52 14 104 42 28 92 44 12 108 40
FIRST CIRCUIT 466 66 49 54 58 49 180 70 58 215 57 43Maine 105 68 56 10 63 62 40 55 47 52 59 45Massachusetts 197 66 40 8 92 67 61 86 61 66 62 37New Hampshire 71 53 37 17 48 37 22 54 45 40 49 30Puerto Rico 66 69 68 17 49 45 47 74 72 47 60 61Rhode Island 27 90 77 2 49 49 10 54 51 10 39 29
SECOND CIRCUIT 988 57 35 184 47 33 646 59 37 735 56 32Connecticut 55 74 41 5 87 18 16 83 54 20 65 47New York Eastern 295 70 40 49 92 72 118 86 47 127 68 31 Northern 212 40 24 46 30 19 127 47 31 194 46 31 Southern 108 79 48 19 49 35 126 86 54 162 88 48 Western 212 42 32 48 18 12 176 35 27 162 33 23Vermont 106 52 33 17 36 23 83 45 24 70 35 14
THIRD CIRCUIT 456 74 46 42 72 54 215 72 54 253 52 36Delaware 23 58 47 3 47 21 2 12 3 10 53 22New Jersey 24 81 58 3 50 50 32 118 91 17 25 15Pennsylvania Eastern 231 94 50 15 107 68 84 81 58 85 82 52 Middle 86 46 37 9 53 46 42 57 49 85 39 33 Western 74 56 46 9 56 56 37 60 45 23 55 39Virgin Islands 18 29 24 3 45 36 18 9 9 33 18 14
FOURTH CIRCUIT 1,494 74 62 249 87 83 683 87 78 542 68 59Maryland 75 92 71 11 73 67 38 70 57 38 68 52North Carolina Eastern 128 99 81 23 104 87 43 118 87 75 95 82 Middle 115 68 58 12 102 109 27 98 89 33 84 72 Western 260 76 49 40 82 70 87 82 64 91 74 63South Carolina 239 64 55 27 79 77 82 91 85 68 65 58Virginia Eastern 292 83 79 75 103 106 190 106 107 115 64 58 Western 129 80 68 22 123 104 91 76 59 31 74 69West Virginia Northern 76 48 47 18 38 38 58 49 47 42 32 30 Southern 180 57 53 21 39 43 67 71 65 49 40 33
(6/13/96 - 04/30/03) (5/1/03 - 6/24/04) (1/12/05 - 12/10/07) (12/11/07-9/30/11)Period Period Period
Average Guideline Minimum and Length of Imprisonment by Circuit and DistrictMarijuana Trafficking Offenses
Koon Period through Gall Period
Koon PROTECT Act GallBookerPeriod
69

CIRCUIT
District Total
Mean Guideline Minimum
Mean Months Total
Mean Guideline Minimum
Mean Months Total
Mean Guideline Minimum
Mean Months Total
Mean Guideline Minimum
Mean Months
FIFTH CIRCUIT 16,345 39 35 3,112 37 35 6,408 41 39 9,411 40 37Louisiana Eastern 102 40 36 12 46 41 26 45 40 15 52 52 Middle 20 43 42 3 110 127 15 56 67 7 61 62 Western 53 67 61 10 41 48 37 58 56 26 47 46Mississippi Northern 64 81 61 15 108 75 33 83 76 15 58 52 Southern 114 49 42 42 47 43 58 57 59 45 69 61Texas Eastern 270 47 44 36 61 51 94 76 74 201 75 73 Northern 379 80 68 51 81 79 115 124 118 110 96 86 Southern 5,904 46 40 1,066 40 38 2,169 49 45 3,488 49 45 Western 9,439 32 29 1,877 32 31 3,861 33 31 5,504 31 29
SIXTH CIRCUIT 2,486 54 41 372 68 54 1,012 70 53 1,227 62 45Kentucky Eastern 556 40 30 74 62 49 179 67 51 172 54 40 Western 125 47 41 16 58 55 63 92 76 69 59 41Michigan Eastern 504 62 46 74 62 39 275 65 43 207 62 45 Western 292 60 50 62 69 62 99 76 67 151 71 63Ohio Northern 201 62 43 23 100 88 75 59 46 118 53 37 Southern 226 49 32 41 47 31 112 61 42 247 73 44Tennessee Eastern 329 59 45 47 73 62 107 83 69 90 72 60 Middle 95 59 47 21 111 89 46 76 60 38 38 31 Western 158 57 42 14 67 56 56 70 54 135 50 38
SEVENTH CIRCUIT 690 78 70 170 77 70 329 82 74 504 69 60Illinois Central 88 78 63 16 116 111 33 103 94 61 124 112 Northern 122 78 64 32 83 64 45 79 67 45 63 53 Southern 161 88 89 31 66 65 57 78 71 65 89 87Indiana Northern 99 59 53 27 60 55 55 77 71 114 52 49 Southern 114 76 63 27 90 78 69 99 89 67 66 61Wisconsin Eastern 69 72 62 28 51 51 52 63 56 119 50 32 Western 37 98 103 9 113 117 18 67 70 33 66 56
EIGHTH CIRCUIT 1,321 60 46 247 71 60 668 72 61 807 61 50Arkansas Eastern 124 58 54 15 71 69 71 69 59 78 62 54 Western 54 45 37 9 56 55 20 58 36 21 52 40Iowa Northern 84 90 78 28 110 82 45 116 98 58 93 85 Southern 70 69 51 13 106 83 48 80 71 94 86 69Minnesota 129 62 48 30 70 54 103 65 49 121 45 32Missouri Eastern 236 53 39 44 52 46 121 58 49 167 61 48 Western 320 71 44 44 76 52 84 93 76 109 58 45Nebraska 124 71 61 25 76 77 89 76 69 84 64 56North Dakota 32 13 12 8 22 23 8 84 63 9 65 34South Dakota 148 30 27 31 59 57 79 55 54 66 35 35
BookerPeriod
(1/12/05 - 12/10/07)
Average Guideline Minimum and Length of Imprisonment by Circuit and District (cont.)
Koon PROTECT Act GallPeriod Period Period
(5/1/03 - 6/24/04) (12/11/07-9/30/11)(6/13/96 - 04/30/03)
70

CIRCUIT
District Total
Mean Guideline Minimum
Mean Months Total
Mean Guideline Minimum
Mean Months Total
Mean Guideline Minimum
Mean Months Total
Mean Guideline Minimum
Mean Months
NINTH CIRCUIT 12,658 31 20 1,427 35 26 4,464 37 25 6,819 33 24Alaska 45 52 43 8 48 45 11 71 58 19 56 37Arizona 3,977 38 20 617 39 28 2,039 44 29 3,707 32 24California Central 62 83 65 19 66 53 48 64 42 133 64 42 Eastern 171 70 53 43 80 66 105 49 43 340 52 43 Northern 87 63 43 13 24 19 39 55 29 66 42 29 Southern 7,481 23 16 526 22 15 1,767 23 17 1,991 22 15Guam 6 90 28 1 18 6 1 0 0 2 44 7Hawaii 64 64 45 5 65 58 29 101 75 16 63 28Idaho 41 84 74 8 32 23 21 54 34 34 60 42Montana 162 39 35 23 73 72 50 63 64 38 39 38Nevada 50 62 44 11 72 69 13 41 36 20 41 30Northern Mariana Islands 0 0 0 0 0 0 0 0 0 0 0 0Oregon 89 62 48 33 35 28 81 54 41 142 63 45Washington Eastern 126 35 25 40 26 19 65 48 31 123 52 39 Western 297 53 34 80 35 28 195 37 26 188 47 28
TENTH CIRCUIT 2,473 38 32 353 36 31 1,377 40 31 1,780 31 22Colorado 128 41 30 14 44 22 50 44 32 45 37 23Kansas 193 59 52 39 60 60 118 73 62 137 70 55New Mexico 1,889 32 26 262 26 22 1,065 30 22 1,472 25 17Oklahoma Eastern 35 64 56 5 38 40 6 105 97 5 52 47 Northern 50 69 68 3 102 111 16 70 60 30 67 59 Western 89 96 79 10 103 73 33 97 79 23 65 48Utah 50 31 27 11 78 74 40 79 58 55 65 51Wyoming 39 46 45 9 47 47 49 83 78 13 32 30
ELEVENTH CIRCUIT 2,489 70 57 386 80 67 1,038 70 59 1,153 56 48Alabama Middle 76 53 45 3 29 26 33 120 79 27 55 48 Northern 159 59 44 18 66 57 37 85 62 34 90 58 Southern 175 57 40 24 78 56 43 51 42 49 45 40Florida Middle 728 70 54 106 66 56 314 61 52 412 63 51 Northern 318 98 87 70 107 85 115 120 104 107 66 60 Southern 536 66 57 84 65 58 366 53 47 274 45 39Georgia Middle 142 52 44 18 46 44 33 71 60 42 31 31 Northern 259 76 63 45 122 107 57 99 87 111 67 61 Southern 96 57 49 18 70 64 40 80 69 97 41 40
Guideline minimums account for applicable statutory mandatory penalties. Guideline minimums of life and other guideline minimums exceeding 470 months are capped at 470 months.
SOURCE: U.S. Sentencing Commission, 2011 Booker Report Datafiles.
(6/13/96 - 04/30/03) (5/1/03 - 6/24/04) (12/11/07-9/30/11)Period Period
Sentences of probation only are included as zero (0) months of imprisonment. Life sentences and other sentences exceeding 470 months are capped at 470 months. This analysis includes time of confinement as described in USSG §5C1.1 (Imposition of a Term of Imprisonment). Some cases were excluded due to missing or indeterminable sentencing information.
PeriodKoon PROTECT Act Gall
Average Guideline Minimum and Length of Imprisonment by Circuit and District (cont.)
BookerPeriod
(1/12/05 - 12/10/07)
71

Pennsylvania, Eastern 71.4 165 231New Hampshire 66.2 47 71New York, Northern 63.7 135 212Alabama, Northern 62.9 100 159North Carolina, Western 60.0 156 260Ohio, Southern 59.3 134 226Missouri, Western 56.3 180 320Ohio, Northern 54.7 110 201Tennessee, Eastern 51.2 168 328Pennsylvania, Middle 50.0 43 86Mississippi, Northern 50.0 32 64New Jersey 50.0 12 24Louisiana, Middle 50.0 10 20North Carolina, Eastern 49.2 63 128Indiana, Southern 49.1 56 114Illinois, Central 48.9 43 88Maryland 48.0 36 75Florida, Middle 46.4 338 728New York, Western 45.8 97 212Iowa, Southern 45.7 32 70Tennessee, Western 45.2 71 157Pennsylvania, Western 44.6 33 74Michigan, Eastern 44.4 224 504Alabama, Southern 44.0 77 175Michigan, Western 44.0 128 291District of Columbia 43.8 21 48Massachusetts 43.7 86 197Tennessee, Middle 42.1 40 95Georgia, Middle 41.5 59 142Idaho 41.5 17 41South Carolina 41.0 98 239Alabama, Middle 40.8 31 76Illinois, Northern 39.3 48 122Colorado 39.1 50 128Maine 39.0 41 105Georgia, Southern 38.5 37 96Louisiana, Western 37.7 20 53Hawaii 37.5 24 64North Carolina, Middle 37.4 43 115Missouri, Eastern 37.3 88 236Washington, Western 36.9 109 295Delaware 34.8 8 23
Koon
72

Minnesota 34.4 44 128Arkansas, Western 34.0 18 53California, Eastern 33.3 57 171Vermont 33.3 35 105Guam 33.3 2 6Georgia, Northern 33.2 86 259Kentucky, Eastern 33.2 184 555Oregon 32.6 29 89Mississippi, Southern 32.5 37 114Iowa, Northern 32.1 27 84Nevada 32.0 16 50Florida, Northern 30.5 97 318Texas, Northern 30.4 115 378New York, Eastern 30.2 89 295New York, Southern 29.9 32 107Indiana, Northern 29.3 29 99Connecticut 29.1 16 55Montana 29.0 47 162Wisconsin, Eastern 26.1 18 69Virginia, Western 25.6 33 129Nebraska 25.2 31 123Kansas 24.9 48 193Texas, Southern 24.7 1,458 5,896California, Central 24.2 15 62California, Northern 23.3 20 86Louisiana, Eastern 20.6 21 102Kentucky, Western 20.2 25 124Alaska 20.0 9 45Arkansas, Eastern 19.5 24 123Florida, Southern 19.4 104 535Washington, Eastern 19.0 24 126Rhode Island 18.5 5 27South Dakota 18.2 27 148Oklahoma, Northern 18.0 9 50Virginia, Eastern 17.9 52 291Oklahoma, Western 16.9 15 89Wisconsin, Western 16.2 6 37Arizona 15.9 630 3,964North Dakota 15.6 5 32West Virginia, Southern 15.0 27 180Utah 13.3 6 45Texas, Eastern 12.3 33 269Texas, Western 11.6 1,095 9,420Virgin Islands 11.1 2 18California, Southern 10.6 791 7,461West Virginia, Northern 10.5 8 76New Mexico 10.4 196 1,889Wyoming 10.3 4 39Oklahoma, Eastern 8.6 3 35Illinois, Southern 7.5 12 159Puerto Rico 6.1 4 66_______The following districts had no marijuana trafficking offenses in the selected time period: Northern Mariana Islands.
SOURCE: U.S. Sentencing Commission, 2011 Booker Report Datafiles.
Koon
73

Guam 100.0 1 1Connecticut 80.0 4 5California, Southern 77.9 409 525Massachusetts 75.0 6 8Pennsylvania, Eastern 73.3 11 15Virgin Islands 66.7 2 3New Hampshire 58.8 10 17Arizona 56.8 350 616New York, Western 56.3 27 48Michigan, Eastern 56.2 41 73Alabama, Southern 54.2 13 24Ohio, Southern 53.7 22 41Mississippi, Northern 53.3 8 15Vermont 52.9 9 17Missouri, Western 50.0 22 44District of Columbia 50.0 7 14Tennessee, Western 50.0 7 14Illinois, Northern 46.9 15 32Michigan, Western 46.8 29 62Iowa, Northern 46.4 13 28Oregon 45.5 15 33Minnesota 44.8 13 29Arkansas, Western 44.4 4 9North Carolina, Eastern 43.5 10 23Kentucky, Eastern 43.2 32 74Florida, Northern 42.9 30 70New York, Eastern 42.9 21 49California, Eastern 41.9 18 43New York, Northern 41.3 19 46Indiana, Southern 40.7 11 27Oklahoma, Western 40.0 4 10Tennessee, Middle 38.1 8 21Idaho 37.5 3 8Virginia, Western 36.4 8 22Ohio, Northern 36.4 8 22Maryland 36.4 4 11Nevada 36.4 4 11Tennessee, Eastern 36.2 17 47North Carolina, Western 35.9 14 39Colorado 35.7 5 14Montana 34.8 8 23Florida, Middle 34.0 36 106
74

Georgia, Middle 33.3 6 18Georgia, Southern 33.3 6 18Pennsylvania, Middle 33.3 3 9Delaware 33.3 1 3New Jersey 33.3 1 3Louisiana, Middle 33.3 1 3Alabama, Middle 33.3 1 3California, Central 31.6 6 19Iowa, Southern 30.8 4 13Louisiana, Western 30.0 3 10Indiana, Northern 29.6 8 27Alabama, Northern 27.8 5 18Washington, Western 27.5 22 80Georgia, Northern 26.7 12 45New Mexico 26.0 68 262Missouri, Eastern 25.0 11 44Illinois, Central 25.0 4 16North Dakota 25.0 2 8Florida, Southern 23.8 20 84Mississippi, Southern 23.8 10 42Puerto Rico 23.5 4 17Kansas 23.1 9 39Texas, Southern 22.0 234 1,065Hawaii 20.0 1 5Oklahoma, Eastern 20.0 1 5Kentucky, Western 18.8 3 16Washington, Eastern 17.9 7 39West Virginia, Northern 16.7 3 18South Carolina 14.8 4 27Arkansas, Eastern 13.3 2 15Illinois, Southern 12.9 4 31Texas, Western 11.2 210 1,876Texas, Eastern 11.1 4 36Pennsylvania, Western 11.1 1 9Wisconsin, Western 11.1 1 9Wyoming 11.1 1 9New York, Southern 10.5 2 19Maine 10.0 1 10Texas, Northern 9.8 5 51South Dakota 9.7 3 31Virginia, Eastern 9.3 7 75Louisiana, Eastern 8.3 1 12California, Northern 7.7 1 13Wisconsin, Eastern 0.0 0 28Nebraska 0.0 0 25West Virginia, Southern 0.0 0 21North Carolina, Middle 0.0 0 12Utah 0.0 0 11Alaska 0.0 0 8Oklahoma, Northern 0.0 0 3Rhode Island 0.0 0 2_______The following districts had no marijuana trafficking offenses in the selected time period: Northern Mariana Islands.
SOURCE: U.S. Sentencing Commission, 2011 Booker Report Datafiles.
75

Idaho 81.0 17 21Arkansas, Western 75.0 15 20California, Southern 74.2 1,310 1,766Arizona 73.0 1,488 2,038Alabama, Middle 66.7 22 33Maryland 57.9 22 38District of Columbia 57.1 16 28Ohio, Southern 56.8 63 111Kentucky, Eastern 52.5 94 179New York, Western 52.3 92 176Ohio, Northern 50.7 38 75New York, Northern 49.6 63 127Michigan, Eastern 49.5 136 275Pennsylvania, Western 48.6 18 37Vermont 48.2 40 83Maine 47.5 19 40Mississippi, Northern 45.5 15 33New Mexico 45.3 482 1,065New Jersey 43.8 14 32Tennessee, Western 42.9 24 56Pennsylvania, Middle 42.9 18 42California, Northern 42.1 16 38Colorado 42.0 21 50North Carolina, Eastern 41.9 18 43Washington, Western 41.5 81 195Hawaii 41.4 12 29New Hampshire 40.9 9 22Oregon 40.7 33 81North Carolina, Western 40.2 35 87New York, Eastern 39.8 47 118Indiana, Northern 38.2 21 55Pennsylvania, Eastern 38.1 32 84Alabama, Southern 38.1 16 42Iowa, Northern 37.8 17 45North Dakota 37.5 3 8Florida, Northern 37.4 43 115Kentucky, Western 37.1 23 62Michigan, Western 36.4 36 99Georgia, Middle 36.4 12 33Minnesota 35.9 37 103Washington, Eastern 35.4 23 65Alabama, Northern 35.1 13 37
Booker
76

Indiana, Southern 34.8 24 69Tennessee, Eastern 34.6 37 107Missouri, Western 33.3 28 84Massachusetts 32.8 20 61Kansas 32.2 38 118Arkansas, Eastern 31.0 22 71Florida, Middle 30.9 97 314Rhode Island 30.0 3 10Iowa, Southern 29.2 14 48Virginia, Western 28.6 26 91Utah 27.5 11 40Alaska 27.3 3 11Illinois, Northern 26.7 12 45Tennessee, Middle 26.1 12 46California, Central 25.6 11 43Georgia, Southern 25.0 10 40Oklahoma, Northern 25.0 4 16New York, Southern 24.6 31 126Texas, Southern 24.6 533 2,169Wyoming 24.5 12 49Texas, Northern 24.3 28 115Louisiana, Western 24.3 9 37Missouri, Eastern 23.3 28 120Wisconsin, Eastern 23.1 12 52North Carolina, Middle 22.2 6 27California, Eastern 21.9 23 105Illinois, Central 21.2 7 33Georgia, Northern 21.1 12 57South Carolina 20.7 17 82Montana 20.0 10 50Louisiana, Eastern 19.2 5 26Florida, Southern 17.5 64 366Nebraska 16.9 15 89Oklahoma, Eastern 16.7 1 6Nevada 15.4 2 13Texas, Eastern 13.8 13 94Connecticut 12.5 2 16Oklahoma, Western 12.1 4 33Illinois, Southern 10.5 6 57West Virginia, Northern 10.3 6 58Mississippi, Southern 10.3 6 58Texas, Western 8.6 331 3,861Puerto Rico 8.5 4 47Louisiana, Middle 6.7 1 15Virgin Islands 5.6 1 18Wisconsin, Western 5.6 1 18Virginia, Eastern 5.3 10 190South Dakota 5.1 4 79West Virginia, Southern 4.5 3 67Delaware 0.0 0 2Guam 0.0 0 1_______The following districts had no marijuana trafficking offenses in the selected time period: Northern Mariana Islands.
SOURCE: U.S. Sentencing Commission, 2011 Booker Report Datafiles.
Booker
77

Guam 100.0 2 2California, Southern 76.4 1,521 1,991Idaho 67.6 23 34Arkansas, Western 66.7 14 21District of Columbia 66.7 8 12Alaska 63.2 12 19Delaware 60.0 6 10Ohio, Southern 59.9 148 247North Dakota 55.6 5 9New Hampshire 55.0 22 40New Mexico 52.7 776 1,472Maine 51.9 27 52Washington, Western 51.1 96 188Pennsylvania, Eastern 50.6 43 85Ohio, Northern 50.0 59 118New York, Western 49.4 80 162Oregon 49.3 70 142Kentucky, Eastern 48.3 83 172Kentucky, Western 47.8 33 69Arizona 46.8 1,735 3,707California, Northern 45.5 30 66Colorado 44.4 20 45Alabama, Northern 44.1 15 34North Carolina, Western 44.0 40 91Hawaii 43.8 7 16New York, Northern 43.3 84 194Louisiana, Middle 42.9 3 7Tennessee, Eastern 42.2 38 90North Carolina, Eastern 41.3 31 75New York, Eastern 40.9 52 127Nevada 40.0 8 20Massachusetts 39.4 26 66Tennessee, Western 39.3 53 135Wisconsin, Eastern 37.8 45 119Pennsylvania, Middle 37.6 32 85Iowa, Southern 37.2 35 94Kansas 37.2 51 137Alabama, Middle 37.0 10 27Maryland 36.8 14 38Florida, Middle 35.0 144 412Pennsylvania, Western 34.8 8 23Vermont 34.3 24 70
Gall
78

Mississippi, Northern 33.3 5 15California, Central 33.1 44 133Missouri, Western 31.2 34 109Utah 30.9 17 55Michigan, Eastern 30.4 63 207Oklahoma, Western 30.4 7 23Wisconsin, Western 30.3 10 33Connecticut 30.0 6 20Rhode Island 30.0 3 10Iowa, Northern 29.3 17 58Tennessee, Middle 28.9 11 38Missouri, Eastern 28.7 48 167Indiana, Northern 28.1 32 114Washington, Eastern 27.6 34 123Texas, Northern 27.3 30 110North Carolina, Middle 27.3 9 33Florida, Northern 27.1 29 107Mississippi, Southern 26.7 12 45New York, Southern 26.5 43 162Arkansas, Eastern 25.6 20 78Michigan, Western 25.2 38 151California, Eastern 25.0 85 340Georgia, Northern 24.3 27 111Minnesota 24.0 29 121Montana 23.7 9 38New Jersey 23.5 4 17Wyoming 23.1 3 13South Carolina 22.1 15 68Alabama, Southern 20.4 10 49Illinois, Northern 20.0 9 45Oklahoma, Northern 20.0 6 30Oklahoma, Eastern 20.0 1 5Illinois, Central 19.7 12 61Indiana, Southern 19.4 13 67Georgia, Southern 17.5 17 97West Virginia, Southern 16.3 8 49Virginia, Western 16.1 5 31Texas, Southern 15.9 554 3,488Virgin Islands 15.2 5 33West Virginia, Northern 14.3 6 42Georgia, Middle 14.3 6 42Virginia, Eastern 13.9 16 115Nebraska 13.1 11 84Louisiana, Western 11.5 3 26Illinois, Southern 10.8 7 65Florida, Southern 9.5 26 274Texas, Eastern 9.5 19 201Texas, Western 9.3 513 5,504Louisiana, Eastern 6.7 1 15South Dakota 4.5 3 66Puerto Rico 2.1 1 47_______The following districts had no marijuana trafficking offenses in the selected time period: Northern Mariana Islands.
SOURCE: U.S. Sentencing Commission, 2011 Booker Report Datafiles.
Gall
79

Koon
80

Koon
81

82

83

Booker
84

Booker
85

Gall
86

Gall
87

California, Southern 53.3 280 525Arizona 28.2 174 616Connecticut 20.0 1 5District of Columbia 14.3 2 14Texas, Southern 12.1 129 1,065New York, Eastern 10.2 5 49New Mexico 7.6 20 262Indiana, Northern 7.4 2 27Mississippi, Northern 6.7 1 15Georgia, Middle 5.6 1 18California, Central 5.3 1 19Missouri, Western 4.5 2 44Indiana, Southern 3.7 1 27Oregon 3.0 1 33North Carolina, Western 2.6 1 39Washington, Western 2.5 2 80California, Eastern 2.3 1 43Michigan, Western 1.6 1 62Texas, Western 0.7 14 1,876Florida, Middle 0.0 0 106Florida, Southern 0.0 0 84Virginia, Eastern 0.0 0 75Kentucky, Eastern 0.0 0 74Michigan, Eastern 0.0 0 73Florida, Northern 0.0 0 70Texas, Northern 0.0 0 51New York, Western 0.0 0 48Tennessee, Eastern 0.0 0 47New York, Northern 0.0 0 46Georgia, Northern 0.0 0 45Missouri, Eastern 0.0 0 44Mississippi, Southern 0.0 0 42Ohio, Southern 0.0 0 41Washington, Eastern 0.0 0 39Kansas 0.0 0 39Texas, Eastern 0.0 0 36Illinois, Northern 0.0 0 32Illinois, Southern 0.0 0 31South Dakota 0.0 0 31Minnesota 0.0 0 29Wisconsin, Eastern 0.0 0 28Iowa, Northern 0.0 0 28
88

South Carolina 0.0 0 27Nebraska 0.0 0 25Alabama, Southern 0.0 0 24North Carolina, Eastern 0.0 0 23Montana 0.0 0 23Virginia, Western 0.0 0 22Ohio, Northern 0.0 0 22West Virginia, Southern 0.0 0 21Tennessee, Middle 0.0 0 21New York, Southern 0.0 0 19West Virginia, Northern 0.0 0 18Alabama, Northern 0.0 0 18Georgia, Southern 0.0 0 18New Hampshire 0.0 0 17Puerto Rico 0.0 0 17Vermont 0.0 0 17Kentucky, Western 0.0 0 16Illinois, Central 0.0 0 16Pennsylvania, Eastern 0.0 0 15Arkansas, Eastern 0.0 0 15Tennessee, Western 0.0 0 14Colorado 0.0 0 14Iowa, Southern 0.0 0 13California, Northern 0.0 0 13North Carolina, Middle 0.0 0 12Louisiana, Eastern 0.0 0 12Maryland 0.0 0 11Nevada 0.0 0 11Utah 0.0 0 11Maine 0.0 0 10Louisiana, Western 0.0 0 10Oklahoma, Western 0.0 0 10Pennsylvania, Middle 0.0 0 9Pennsylvania, Western 0.0 0 9Wisconsin, Western 0.0 0 9Arkansas, Western 0.0 0 9Wyoming 0.0 0 9Massachusetts 0.0 0 8North Dakota 0.0 0 8Alaska 0.0 0 8Idaho 0.0 0 8Hawaii 0.0 0 5Oklahoma, Eastern 0.0 0 5Delaware 0.0 0 3New Jersey 0.0 0 3Virgin Islands 0.0 0 3Louisiana, Middle 0.0 0 3Oklahoma, Northern 0.0 0 3Alabama, Middle 0.0 0 3Rhode Island 0.0 0 2Guam 0.0 0 1_______The following districts had no marijuana trafficking offenses in the selected time period: Northern Mariana Islands.
SOURCE: U.S. Sentencing Commission, 2011 Booker Report Datafiles.
89

Mississippi, Northern 18.2 6 33Washington, Western 12.3 24 195California, Central 11.6 5 43Texas, Southern 11.1 241 2,169California, Northern 10.5 4 38Rhode Island 10.0 1 10Alaska 9.1 1 11Wyoming 8.2 4 49Utah 7.5 3 40District of Columbia 7.1 2 28Illinois, Central 6.1 2 33Indiana, Southern 5.8 4 69California, Eastern 5.7 6 105Maryland 5.3 2 38Oregon 4.9 4 81Washington, Eastern 4.6 3 65North Carolina, Western 4.6 4 87New Hampshire 4.5 1 22Iowa, Northern 4.4 2 45Kansas 4.2 5 118New Mexico 3.8 40 1,065Illinois, Southern 3.5 2 57Hawaii 3.4 1 29New York, Western 3.4 6 176Arizona 3.3 67 2,038Kentucky, Western 3.2 2 62New York, Eastern 2.5 3 118Georgia, Southern 2.5 1 40Vermont 2.4 2 83Pennsylvania, Middle 2.4 1 42Nebraska 2.2 2 89Illinois, Northern 2.2 1 45Tennessee, Middle 2.2 1 46Iowa, Southern 2.1 1 48Montana 2.0 1 50Colorado 2.0 1 50Minnesota 1.9 2 103Indiana, Northern 1.8 1 55California, Southern 1.8 32 1,766Tennessee, Western 1.8 1 56Texas, Northern 1.7 2 115West Virginia, Northern 1.7 1 58
Booker
90

Massachusetts 1.6 1 61New York, Southern 1.6 2 126Arkansas, Eastern 1.4 1 71Florida, Southern 1.4 5 366Ohio, Northern 1.3 1 75South Dakota 1.3 1 79Pennsylvania, Eastern 1.2 1 84Missouri, Western 1.2 1 84Michigan, Eastern 1.1 3 275Virginia, Eastern 1.1 2 190Michigan, Western 1.0 1 99Tennessee, Eastern 0.9 1 107Ohio, Southern 0.9 1 111Florida, Middle 0.6 2 314Texas, Western 0.6 22 3,861Kentucky, Eastern 0.0 0 179New York, Northern 0.0 0 127Missouri, Eastern 0.0 0 120Florida, Northern 0.0 0 115Texas, Eastern 0.0 0 94Virginia, Western 0.0 0 91South Carolina 0.0 0 82West Virginia, Southern 0.0 0 67Mississippi, Southern 0.0 0 58Georgia, Northern 0.0 0 57Wisconsin, Eastern 0.0 0 52Puerto Rico 0.0 0 47North Carolina, Eastern 0.0 0 43Alabama, Southern 0.0 0 42Maine 0.0 0 40Pennsylvania, Western 0.0 0 37Louisiana, Western 0.0 0 37Alabama, Northern 0.0 0 37Oklahoma, Western 0.0 0 33Alabama, Middle 0.0 0 33Georgia, Middle 0.0 0 33New Jersey 0.0 0 32North Carolina, Middle 0.0 0 27Louisiana, Eastern 0.0 0 26Idaho 0.0 0 21Arkansas, Western 0.0 0 20Virgin Islands 0.0 0 18Wisconsin, Western 0.0 0 18Connecticut 0.0 0 16Oklahoma, Northern 0.0 0 16Louisiana, Middle 0.0 0 15Nevada 0.0 0 13North Dakota 0.0 0 8Oklahoma, Eastern 0.0 0 6Delaware 0.0 0 2Guam 0.0 0 1_______The following districts had no marijuana trafficking offenses in the selected time period: Northern Mariana Islands.
SOURCE: U.S. Sentencing Commission, 2011 Booker Report Datafiles.
Booker
91

California, Northern 30.3 20 66Nevada 30.0 6 20Washington, Western 25.5 48 188Massachusetts 19.7 13 66Connecticut 15.0 3 20Oregon 14.8 21 142Wisconsin, Eastern 12.6 15 119Hawaii 12.5 2 16California, Central 11.3 15 133Alaska 10.5 2 19New York, Eastern 10.2 13 127Rhode Island 10.0 1 10District of Columbia 8.3 1 12Wyoming 7.7 1 13New Hampshire 7.5 3 40Washington, Eastern 7.3 9 123Mississippi, Northern 6.7 1 15Kansas 6.6 9 137Nebraska 6.0 5 84Vermont 5.7 4 70Texas, Southern 5.4 188 3,488Tennessee, Middle 5.3 2 38Colorado 4.4 2 45South Carolina 4.4 3 68Kentucky, Western 4.3 3 69New York, Southern 4.3 7 162Utah 3.6 2 55North Carolina, Western 3.3 3 91Virginia, Western 3.2 1 31Arizona 3.2 118 3,707Georgia, Southern 3.1 3 97Missouri, Eastern 3.0 5 167Indiana, Southern 3.0 2 67New Mexico 2.9 43 1,472Michigan, Eastern 2.9 6 207Maryland 2.6 1 38California, Southern 2.5 50 1,991Pennsylvania, Middle 2.4 2 85Tennessee, Eastern 2.2 2 90Iowa, Southern 2.1 2 94Ohio, Southern 2.0 5 247New York, Western 1.9 3 162
Gall
92

Texas, Northern 1.8 2 110Georgia, Northern 1.8 2 111Indiana, Northern 1.8 2 114Kentucky, Eastern 1.7 3 172Iowa, Northern 1.7 1 58Ohio, Northern 1.7 2 118South Dakota 1.5 1 66California, Eastern 1.5 5 340Michigan, Western 1.3 2 151Arkansas, Eastern 1.3 1 78Missouri, Western 0.9 1 109Virginia, Eastern 0.9 1 115Minnesota 0.8 1 121Tennessee, Western 0.7 1 135Florida, Southern 0.7 2 274Texas, Western 0.7 39 5,504New York, Northern 0.5 1 194Texas, Eastern 0.5 1 201Florida, Middle 0.5 2 412Florida, Northern 0.0 0 107Pennsylvania, Eastern 0.0 0 85North Carolina, Eastern 0.0 0 75Illinois, Southern 0.0 0 65Illinois, Central 0.0 0 61Maine 0.0 0 52West Virginia, Southern 0.0 0 49Alabama, Southern 0.0 0 49Puerto Rico 0.0 0 47Mississippi, Southern 0.0 0 45Illinois, Northern 0.0 0 45West Virginia, Northern 0.0 0 42Georgia, Middle 0.0 0 42Montana 0.0 0 38Idaho 0.0 0 34Alabama, Northern 0.0 0 34Virgin Islands 0.0 0 33North Carolina, Middle 0.0 0 33Wisconsin, Western 0.0 0 33Oklahoma, Northern 0.0 0 30Alabama, Middle 0.0 0 27Louisiana, Western 0.0 0 26Pennsylvania, Western 0.0 0 23Oklahoma, Western 0.0 0 23Arkansas, Western 0.0 0 21New Jersey 0.0 0 17Louisiana, Eastern 0.0 0 15Delaware 0.0 0 10North Dakota 0.0 0 9Louisiana, Middle 0.0 0 7Oklahoma, Eastern 0.0 0 5Guam 0.0 0 2_______The following districts had no marijuana trafficking offenses in the selected time period: Northern Mariana Islands.
SOURCE: U.S. Sentencing Commission, 2011 Booker Report Datafiles.
Gall
93

Koon
94

Koon
95

96

97

Booker
98

Booker
99

Gall
100

Gall
101