Embed Size (px)
Citation preview

Maricopa CountyEconomic and Fiscal Issues
Presentation to theGovernment Accountability Office Review Team
Maricopa County Office of Management and BudgetOctober 8, 2009

Local Economy

Arizona Employment Rank Among 50 States1980 – 2009 Growth Over Previous Year Source: Arizona State University
79
18
2 1 13
19
38
35
28
2022
5
2 2 2 2 1 2
5
8
12
42 2 2
22
47
1
6
11
16
21
26
31
36
41
46
1980 200819941982 1984 1986 1988 1990 1992 1996 1998 2000 2002 2004 2006
= YTD August = 49
Recession Periods
Provided by Elliott D. Pollack and Co.
Greater Phoenix Y/Y Job Losses - Recent RecessionsDuration in Months - BLS
-8.0%
-7.0%
-6.0%
-5.0%
-4.0%
-3.0%
-2.0%
-1.0%
0.0%
0 3 6 9 12 15 181974 Recession 1980/81 Recession 1991 Recession2001 Recession Current Recession
1980/81
1974
2001
1991
August
Provided by Elliott D. Pollack and Co.
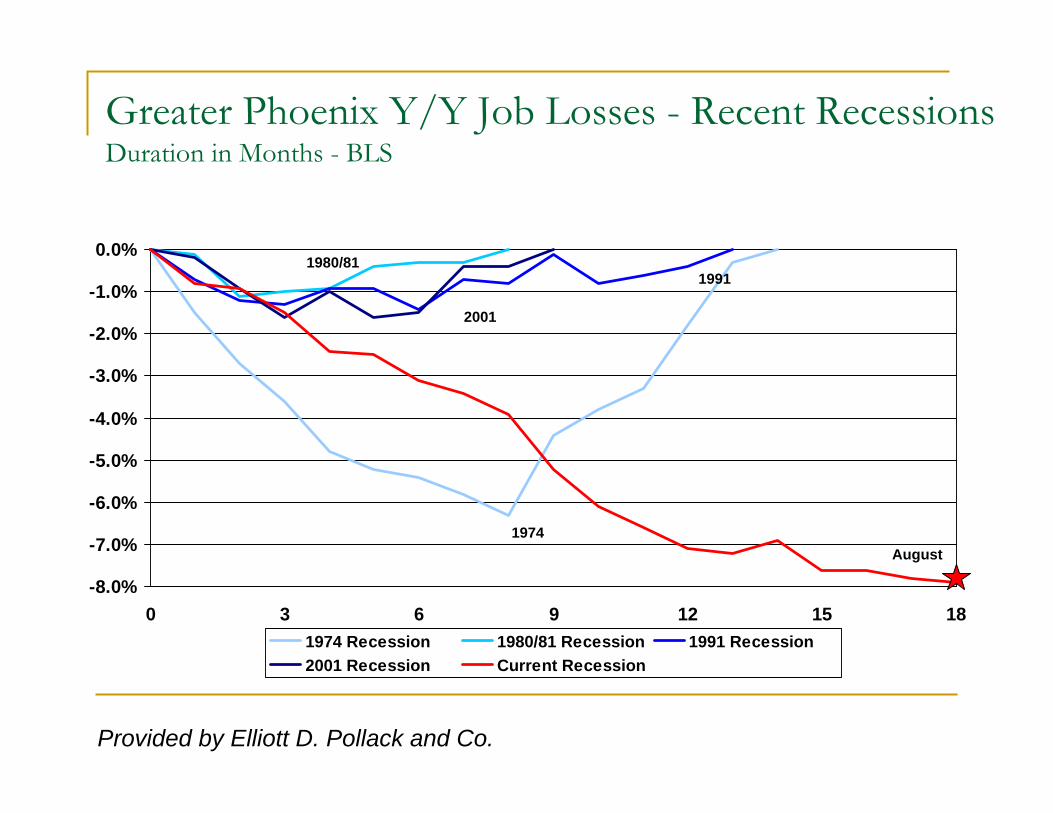
Phoenix-Mesa MSA Employment*Annual Percent Change 1975–2010**Source: Department of Commerce, Research Administration
-3.5%
4.6%
8.1%
12.7%
10.3%
3.5%3.1%
-0.3%
5.5%
11.0%9.1%
5.0%3.6%
2.6%2.5%
2.2%
-0.4%
1.2%
4.9%
6.6%7.3%
7.2%5.4%
5.4%
4.6%3.5%
1.2%
-0.1%
1.5%3.9%
6.2%5.4%
1.3%
-2.0%
-6.0%
-1.0%
-8%-6%-4%-2%0%2%4%6%8%
10%12%14%
1975
1977
1979
1981
1983
1985
1987
1989
1991
1993
1995
1997
1999
2001
2003
2005
2007
2009
*Non-agricultural wage & salary employment. Changed from SIC to NAICS reporting in 1990.
** 2008, 2009, & 2010 forecast is from Elliott D. Pollack & Co. Recession PeriodsProvided by Elliott D. Pollack and Co.

Employment Levels: Greater Phoenix back to Peak in 2014Source: ADOC
1,000.0
1,200.0
1,400.0
1,600.0
1,800.0
2,000.0
2,200.0
2,400.0
Jan-95
Jul-95
Jan-96
Jul-96
Jan-97
Jul-97
Jan-98
Jul-98
Jan-99
Jul-99
Jan-00
Jul-00
Jan-01
Jul-01
Jan-02
Jul-02
Jan-03
Jul-03
Jan-04
Jul-04
Jan-05
Jul-05
Jan-06
Jul-06
Jan-07
Jul-07
Jan-08
Jul-08
Jan-09
Jul-09
Jan-10
Jul-10
Jan-11
Jul-11
Jan-12
Jul-12
Jan-13
Jul-13
Jan-14
Jul-14
Recession Periods
Peak
Provided by Elliott D. Pollack and Co.

Phoenix-Mesa Employment Source: Arizona Department of Commerce, Research Administration
-0.7%Health Services
0.0%Educational Services
-6.5%Other Services
-9.2%Transp. & Utilities
-8.0%Manufacturing
-2.2%Leisure & hosp svcs
-5.5%Government
-11.7%Prof. & Bus. Services
-26.2%Construction
-7.4%Trade
-6.3%
-4.1%
-16.2%
Financial Activities
Information
Mining
Sectors in Decline Sectors Increasing
NONE!!!
Provided by Elliott D. Pollack and Co.
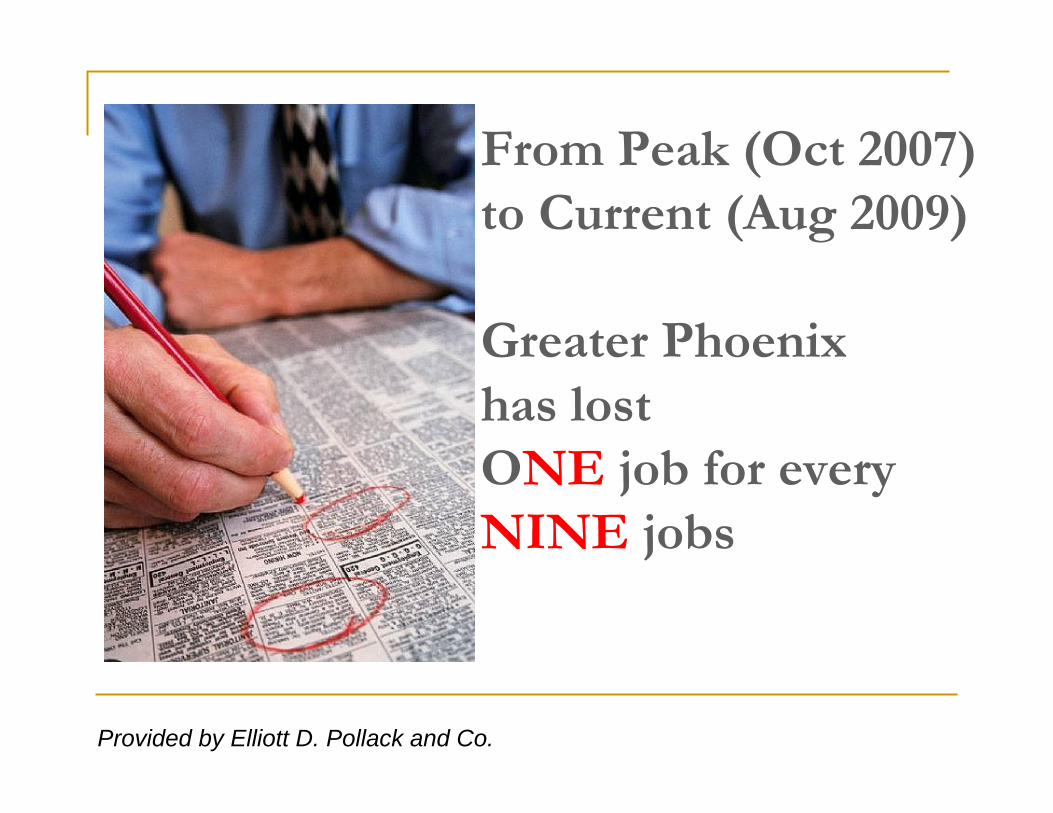
From Peak (Oct 2007) to Current (Aug 2009)
Greater Phoenix has lost ONE job for every NINE jobs
Provided by Elliott D. Pollack and Co.
2.1%
3.7%
4.2%
4.7%
3.9%
3.3%
3.0%
3.1%
4.3%
5.1%
4.2%4.4%
2.9%2.5%
1.3%
2.4%
2.8%
3.5%
4.3%4.6%
4.2%4.2%
3.8%
4.3%4.3%
3.1%3.2%3.5%
4.0%
4.6%
4.2%
3.5%
2.4%
1.6%1.8%
0%
2%
4%
6%
1976 1978 1980 1982 1984 1986 1988 1990 1992 1994 1996 1998 2000 2002 2004 2006 2008 2010
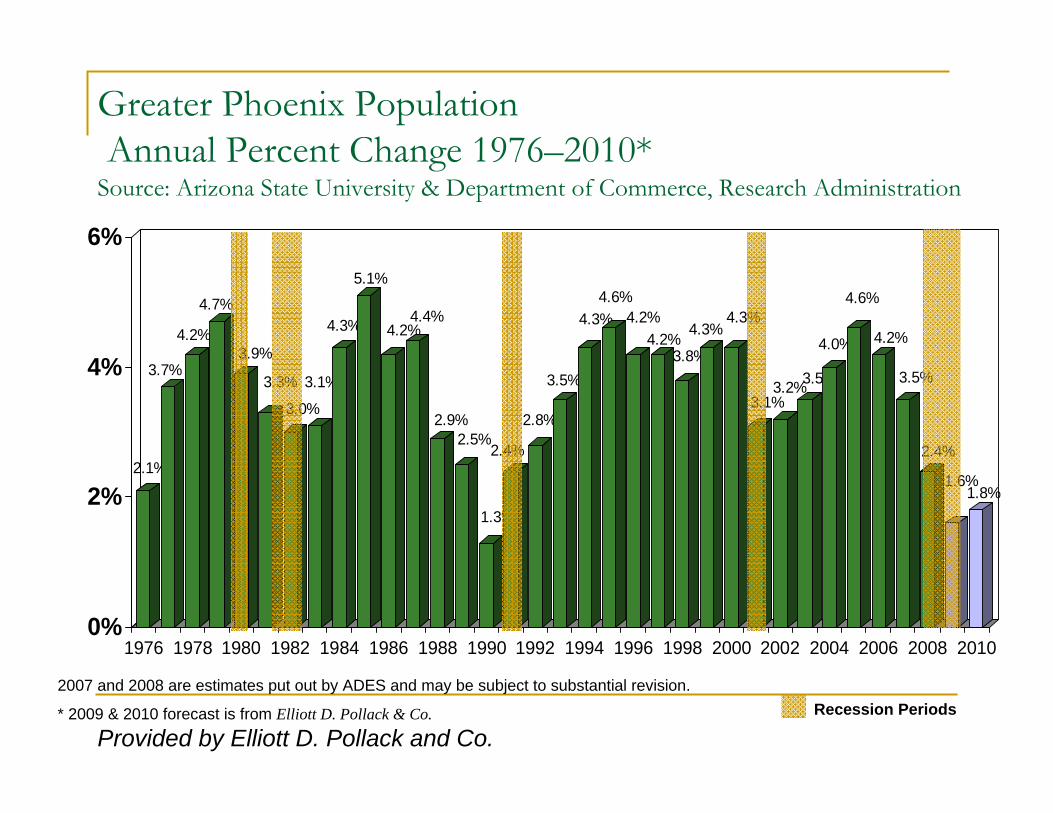
Greater Phoenix PopulationAnnual Percent Change 1976–2010*
Source: Arizona State University & Department of Commerce, Research Administration
2007 and 2008 are estimates put out by ADES and may be subject to substantial revision.
* 2009 & 2010 forecast is from Elliott D. Pollack & Co. Recession Periods
Provided by Elliott D. Pollack and Co.

Greater Phoenix PopulationNet Change 1975–2010Source: ADOC
35.828.7
50.559.6
69.860.0
52.749.7
53.2
75.6
94.581.3
89.3
60.154.9
29.7
54.6
64.5
83.8
104.2
118.6 111.9115.6
111.0
130.4
136.3
100.5107.8
122.7
146.0
172.9164.6
142.6
103.3
69.4
79.3
020406080
100120140160180200
1975
1977
1979
1981
1983
1985
1987
1989
1991
1993
1995
1997
1999
2001
2003
2005
2007
2009
Recession Periods
*Forecasts from Elliott D. Pollack & CompanyProvided by Elliott D. Pollack and Co.

Greater Phoenix Net Migration1975–2010Source: University of Arizona
23.217.3
38.1
47.3
56.1
38.042.4
32.335.4
58.5
74.5
59.466.5
36.9
30.3
6.3
44.8
54.5
70.2
98.5
105.9
85.580.682.874.2 69.2 74.9
73.6
64.9
83.6
118.3121.3
86.0
72.4
7.4
25.7
0
20
40
60
80
100
120
140
1975
1977
1979
1981
1983
1985
1987
1989
1991
1993
1995
1997
1999
2001
2003
2005
2007
2009
Recession Periods
*Forecasts from UofAProvided by Elliott D. Pollack and Co.

Properties in the Foreclosure Process Maricopa County 2002 – 2009 Source: The Information Market
0
5,000
10,000
15,000
20,000
25,000
30,000
35,000
40,000
45,000
50,000
Jan-02
Mar-02
May-02
Jul-02
Sep-02
Nov-02
Jan-03
Mar-03
May-03
Jul-03
Sep-03
Nov-03
Jan-04
Mar-04
May-04
Jul-04
Sep-04
Nov-04
Jan-05
Mar-05
May-05
Jul-05
Sep-05
Nov-05
Jan-06
Mar-06
May-06
Jul-06
Sep-06
Nov-06
Jan-07
Mar-07
May-07
Jul-07
Sep-07
Nov-07
Jan-08
Mar-08
May-08
Jul-08
Sep-08
Nov-08
Jan-09
Mar-09
May-09
*Data through May 2009.Provided by Elliott D. Pollack and Co.

Arizona Delinquency RatesPercent Change Quarter Ago1998 – 2009* Source: Mortgage Bankers Association
0.0%2.0%4.0%6.0%8.0%
10.0%12.0%14.0%16.0%18.0%20.0%22.0%24.0%26.0%
1998
Q1
1998
Q3
1999
Q1
1999
320
00 Q
120
00 Q
320
01 Q
120
01 Q
320
02 Q
120
02 Q
320
03 Q
120
03 Q
320
04 Q
120
04 Q
320
05 Q
120
05 Q
320
06 Q
120
06 Q
320
07 Q
120
07 Q
320
08 Q
120
08 Q
320
09 Q
1
Prime Subprime * Data through 1st quarter 2009
Recession Periods
Provided by Elliott D. Pollack and Co.

Single-Family Vacancy RateGreater Phoenix 1993–2009q2Source: PMHS
2.3%2.5% 2.4%
2.1%2.0% 2.1%
2.3%2.5%
2.3%
2.8% 2.8%1.9% 2.0%
2.9%
5.0%5.6%
9.8%
0%
2%
4%
6%
8%
10%
12%
1993
1994
1995
1996
1997
1998
1999
2000
2001
2002
2003
2004
2005
2006
2007
2008
2009
Provided by Elliott D. Pollack and Co.
8,705
11,081
22,28128,851
18,843
11,485
10,64911,625
19,44718,12522,598
23,222
17,94415,085
12,00010,61413,698
18,379
22,652
27,426
28,54329,609
31,715
36,001
35,30834,701
36,151
38,914
47,720
60,892
63,570
42,423
31,172
12,582
0
10,000
20,000
30,000
40,000
50,000
60,000
70,000
1975
1977
1979
1981
1983
1985
1987
1989
1991
1993
1995
1997
1999
2001
2003
2005
2007
# Permits Recession Periods
Provided by Elliott D. Pollack and Co.
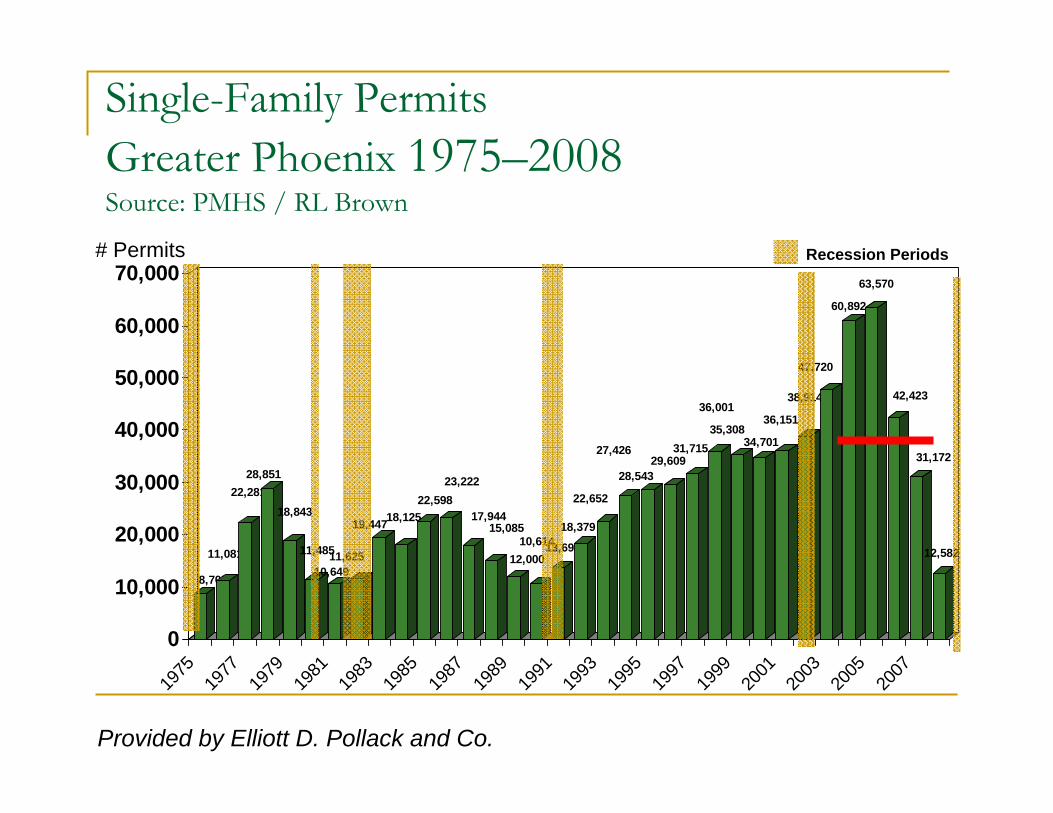
Single-Family PermitsGreater Phoenix 1975–2008Source: PMHS / RL Brown

Oversupply of Housing
Greater Phoenix long-term demographics call for roughly 35,000-40,000 single family units per year (much less next two years)It appears that we overbuilt by as many as 75,000 units between 2003 and 2006 (exact figures depend on actual population flows) Even at the end of next year, given the expectation that foreclosures will continue to flood the market, excess supply could still be 40,000 to 50,000 units regardless of how we do the calculationBalance between supply and demand will not be fully achieved until about 2014, but building will still occur between now and then

Greater Phoenix S&P/Case-Schiller Home Price Index** Percent Change Year Ago1990 – 2009* Source: Macro Markets, LLC
-40%-35%-30%-25%-20%-15%-10%-5%0%5%
10%15%20%25%30%35%40%45%50%
Jan-90
Jul-9
0Jan
-91Ju
l-91
Jan-92
Jul-9
2Jan
-93Ju
l-93
Jan-94
Jul-9
4Jan
-95Ju
l-95
Jan-96
Jul-9
6Jan
-97Ju
l-97
Jan-98
Jul-9
8Jan
-99Ju
l-99
Jan-00
Jul-0
0Jan
-01Ju
l-01
Jan-02
Jul-0
2Jan
-03Ju
l-03
Jan-04
Jul-0
4Jan
-05Ju
l-05
Jan-06
Jul-0
6Jan
-07Ju
l-07
Jan-08
Jul-0
8Jan
-09
Recession Periods
*Data through June 2009**Measures changes in existing single family home prices given a constant level of quality.
Provided by Elliott D. Pollack and Co.
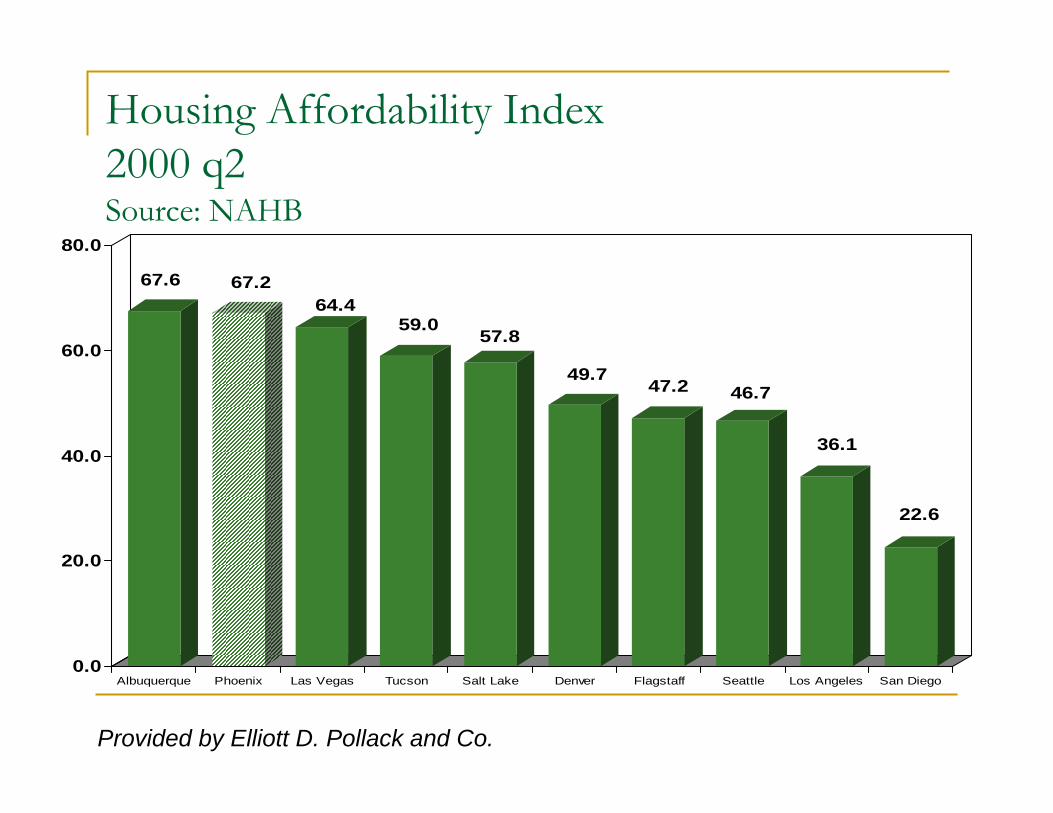
Housing Affordability Index2000 q2Source: NAHB
67.6 67.264.4
59.057.8
49.747.2 46.7
36.1
22.6
0.0
20.0
40.0
60.0
80.0
Albuquerque Phoenix Las Vegas Tucson Salt Lake Denver Flagstaff Seattle Los Angeles San Diego
Provided by Elliott D. Pollack and Co.
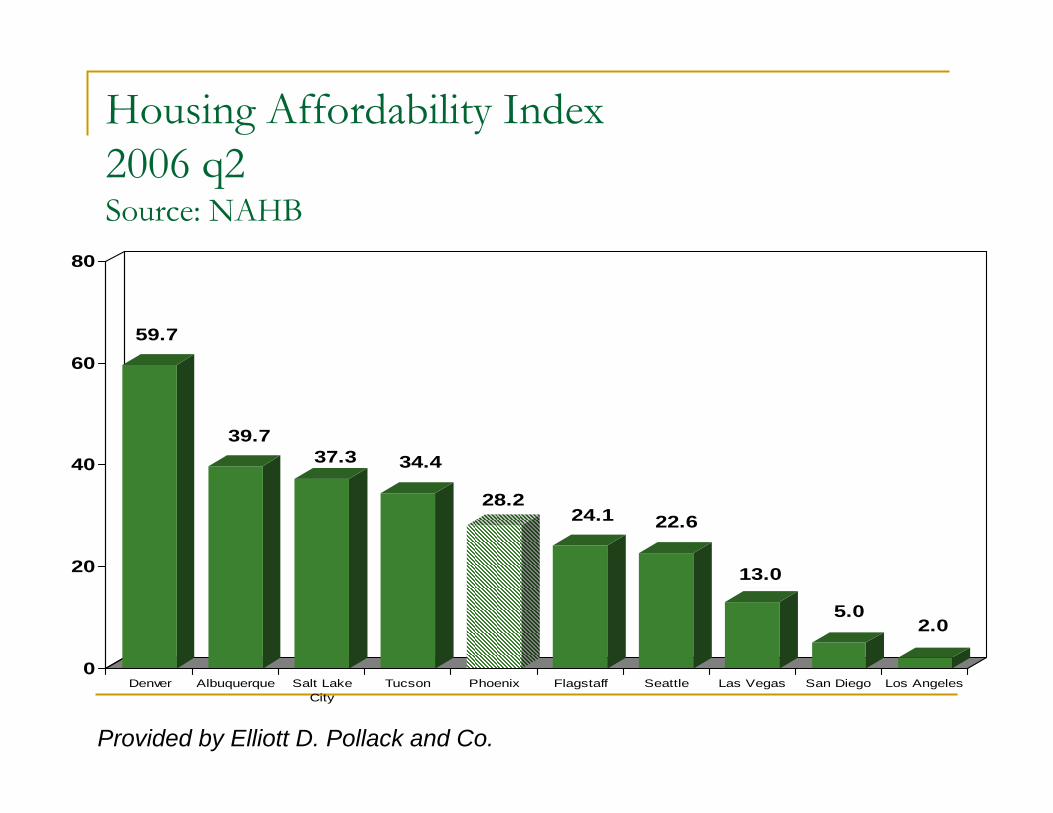
Housing Affordability Index2006 q2Source: NAHB
59.7
39.737.3 34.4
28.224.1 22.6
13.0
5.02.0
0
20
40
60
80
Denver Albuquerque Salt LakeCity
Tucson Phoenix Flagstaff Seattle Las Vegas San Diego Los Angeles
Provided by Elliott D. Pollack and Co.
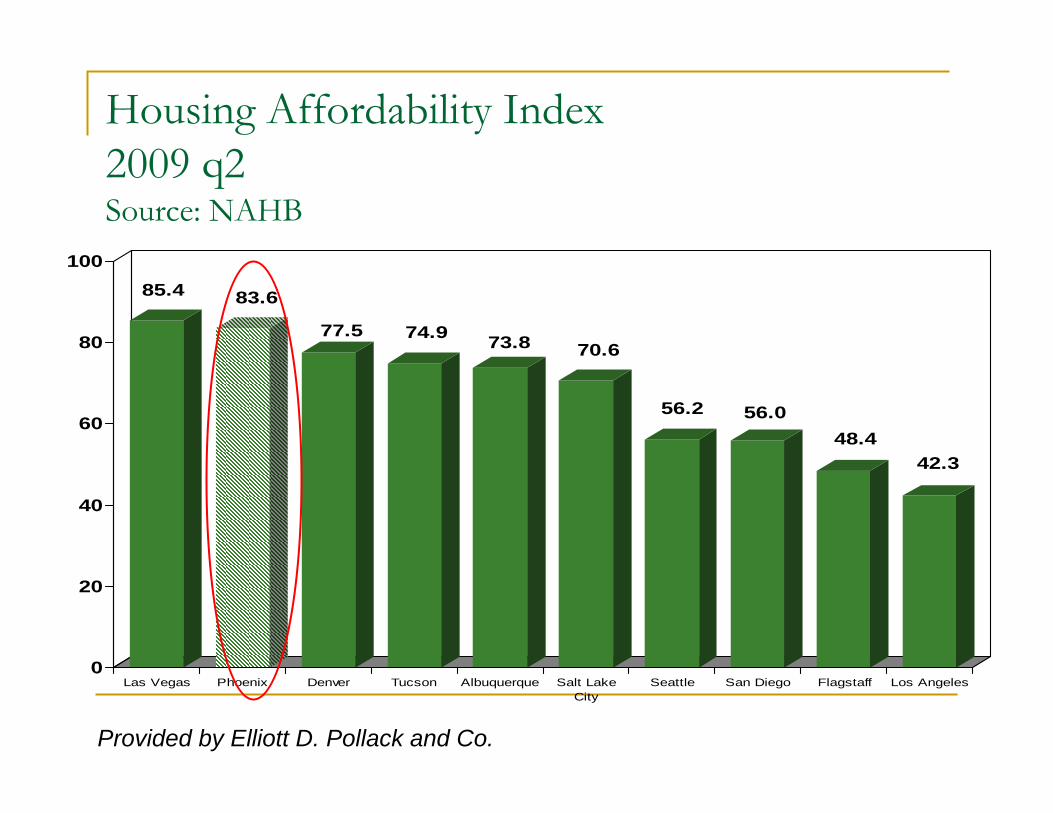
Housing Affordability Index2009 q2Source: NAHB
85.4 83.6
77.5 74.9 73.8 70.6
56.2 56.048.4
42.3
0
20
40
60
80
100
Las Vegas Phoenix Denver Tucson Albuquerque Salt LakeCity
Seattle San Diego Flagstaff Los Angeles
Provided by Elliott D. Pollack and Co.

Office Space Year-End Vacancy RatesMaricopa County 1986–2010*Source: CB Richard Ellis
26.7%
22.8%24.0%
26.7%26.4%
25.4%
22.7%
18.8%
14.8%
11.7%
9.5% 9.2%9.5%
10.0% 9.9%
16.0%
18.8%18.3%
16.4%
12.6%11.1%
13.9%
19.1%
25.3%
27.1%
0%
5%
10%
15%
20%
25%
30%
35%
1986
1987
1988
1989
1990
1991
1992
1993
1994
1995
1996
1997
1998
1999
2000
2001
2002
2003
2004
2005
2006
2007
2008
2009
2010
*2009 -2010 are forecasts from CB Richard Ellis
Recession Periods
Provided by Elliott D. Pollack and Co.

No significant office building in Greater
Phoenix for next 5 years.
Provided by Elliott D. Pollack and Co.
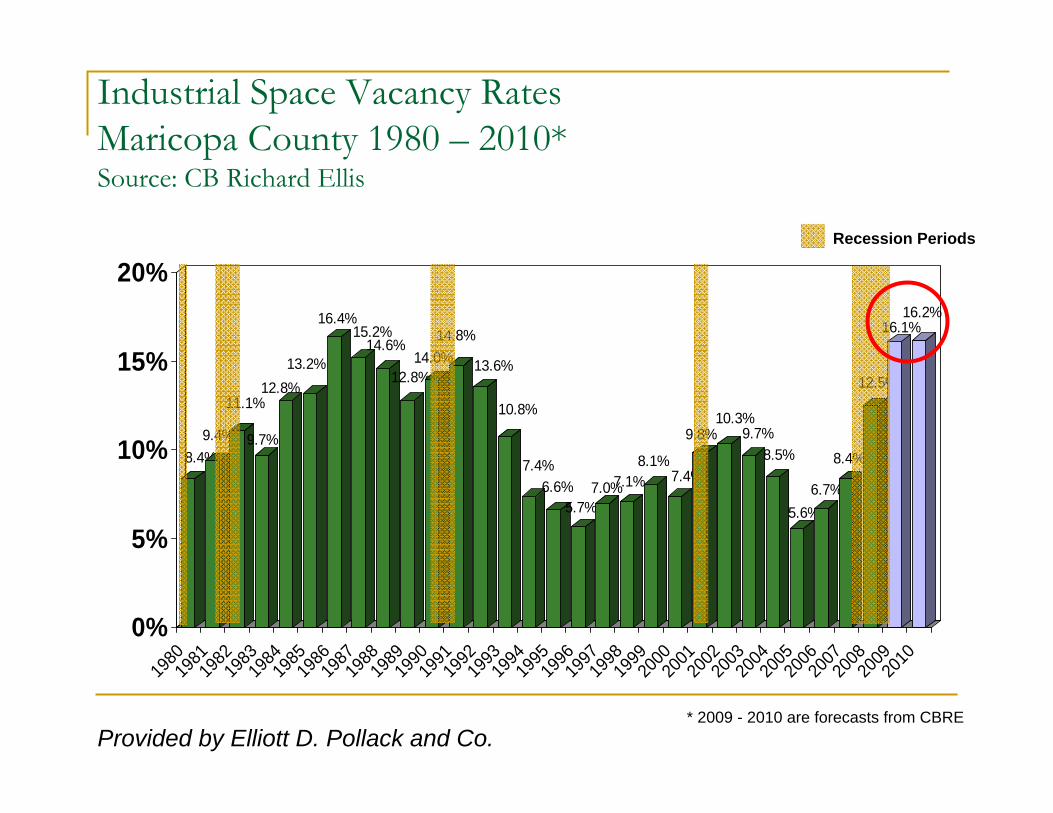
Industrial Space Vacancy RatesMaricopa County 1980 – 2010*Source: CB Richard Ellis
8.4%9.4%
11.1%
9.7%
12.8%13.2%
16.4%15.2%
14.6%
12.8%14.0%
14.8%
13.6%
10.8%
7.4%6.6%
5.7%7.0%7.1%
8.1%7.4%
9.8%10.3%
9.7%8.5%
5.6%6.7%
8.4%
12.5%
16.1%16.2%
0%
5%
10%
15%
20%
1980
1981
1982
1983
1984
1985
1986
1987
1988
1989
1990
1991
1992
1993
1994
1995
1996
1997
1998
1999
2000
2001
2002
2003
2004
2005
2006
2007
2008
2009
2010
* 2009 - 2010 are forecasts from CBRE
Recession Periods
Provided by Elliott D. Pollack and Co.
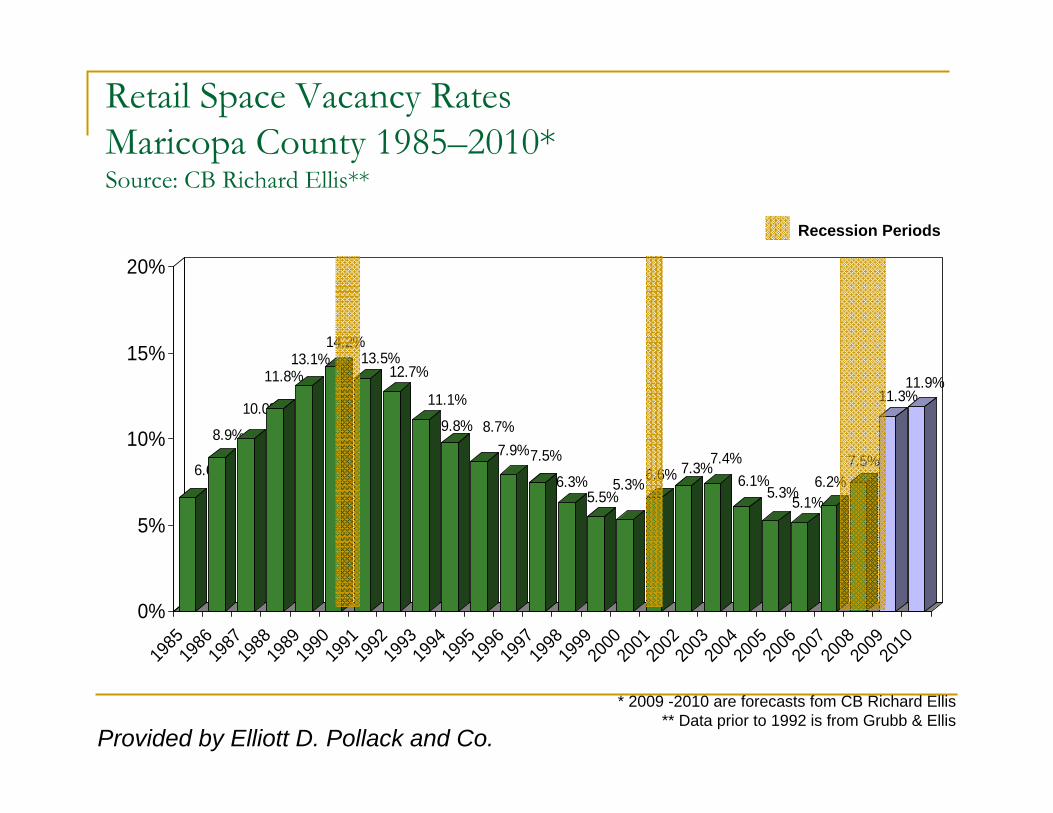
Retail Space Vacancy RatesMaricopa County 1985–2010*Source: CB Richard Ellis**
6.6%
8.9%
10.0%
11.8%13.1%
14.2%13.5%
12.7%
11.1%
9.8% 8.7%7.9%7.5%
6.3%5.5%
5.3%6.6% 7.3%7.4%6.1%
5.3%5.1%6.2%
7.5%
11.3%11.9%
0%
5%
10%
15%
20%
1985
1986
1987
1988
1989
1990
1991
1992
1993
1994
1995
1996
1997
1998
1999
2000
2001
2002
2003
2004
2005
2006
2007
2008
2009
2010
* 2009 -2010 are forecasts fom CB Richard Ellis** Data prior to 1992 is from Grubb & Ellis
Recession Periods
Provided by Elliott D. Pollack and Co.
It could take a decade before prices get back to peak levels in the commercial
markets.
Provided by Elliott D. Pollack and Co.
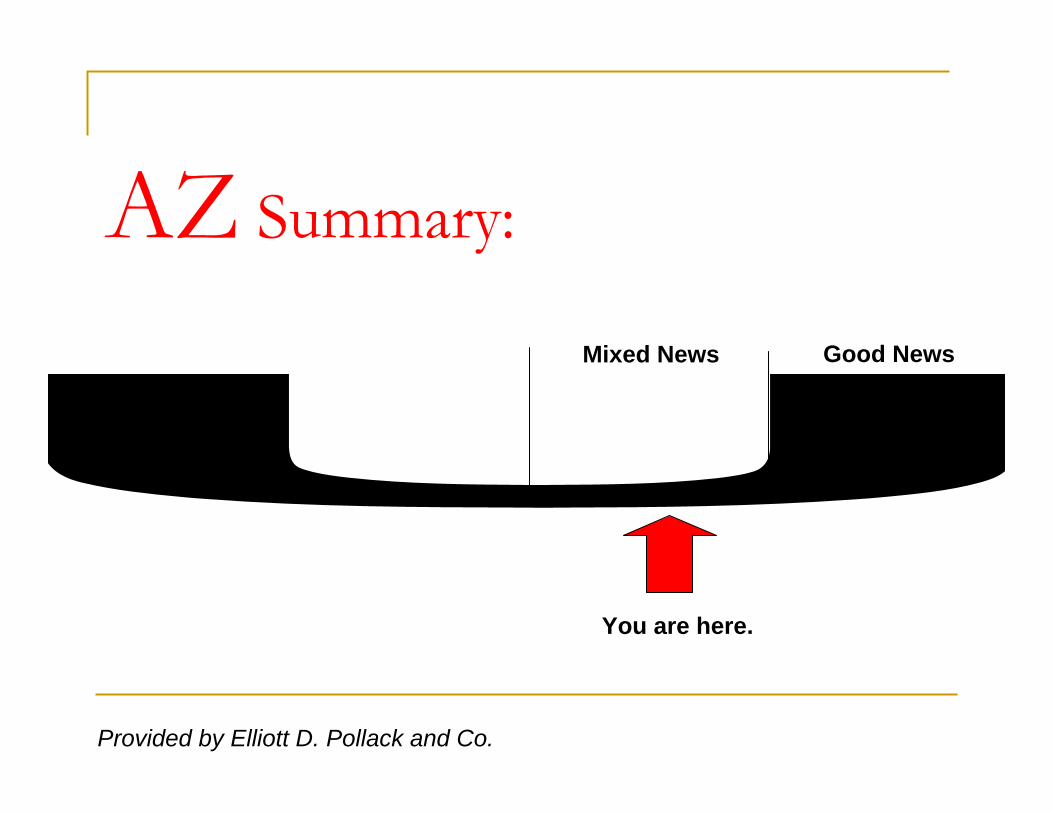
AZ Summary:
You are here.
Mixed News Good News
Provided by Elliott D. Pollack and Co.
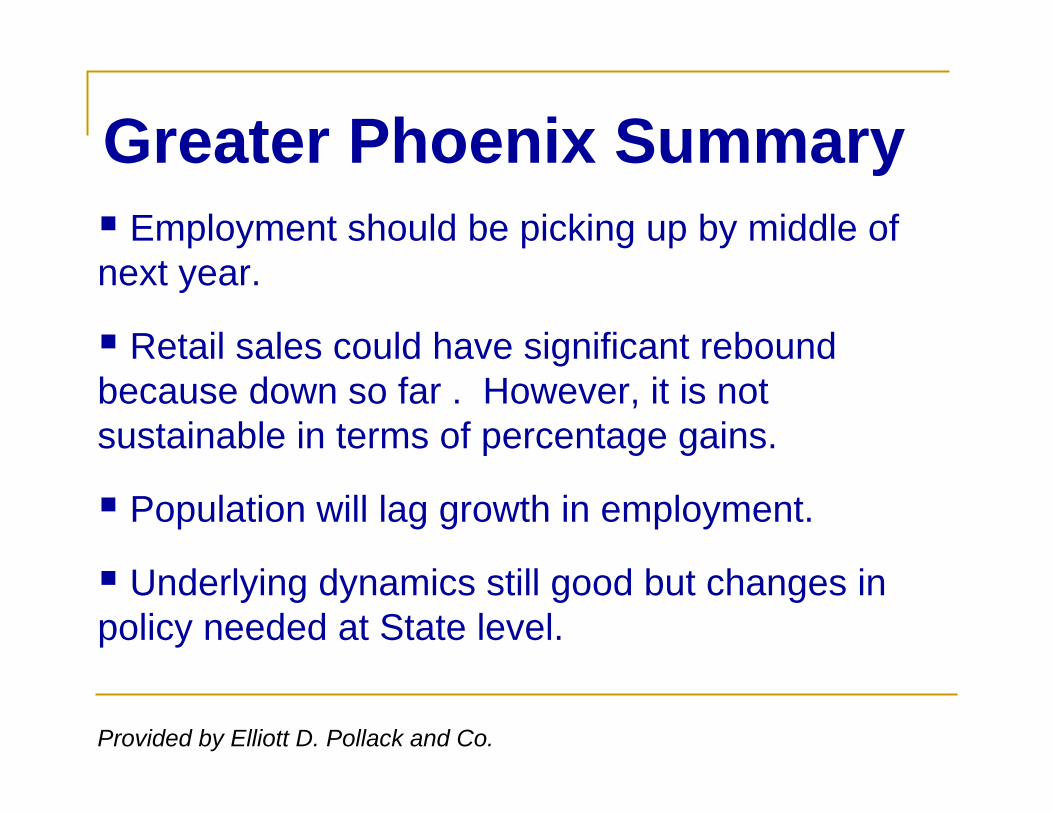
Employment should be picking up by middle of next year.
Retail sales could have significant rebound because down so far . However, it is not sustainable in terms of percentage gains.
Population will lag growth in employment.
Underlying dynamics still good but changes in policy needed at State level.
Greater Phoenix Summary
Provided by Elliott D. Pollack and Co.

Greater Phoenix Forecast 2009 – 2010
Source: Elliott D. Pollack & Company, AZ Blue Chip, Department of Commerce, Research Administration
5.0%-9.0%-10.0%0.1%Retail Sales
2.5%-1.0%3.0%4.5%Personal Income
-1.0%-6.0%-2.0%1.3%Employment
1.8%1.6%2.4%3.5%Population
2010200920082007Indicator
? ? ?
Provided by Elliott D. Pollack and Co.

Maricopa County Budget
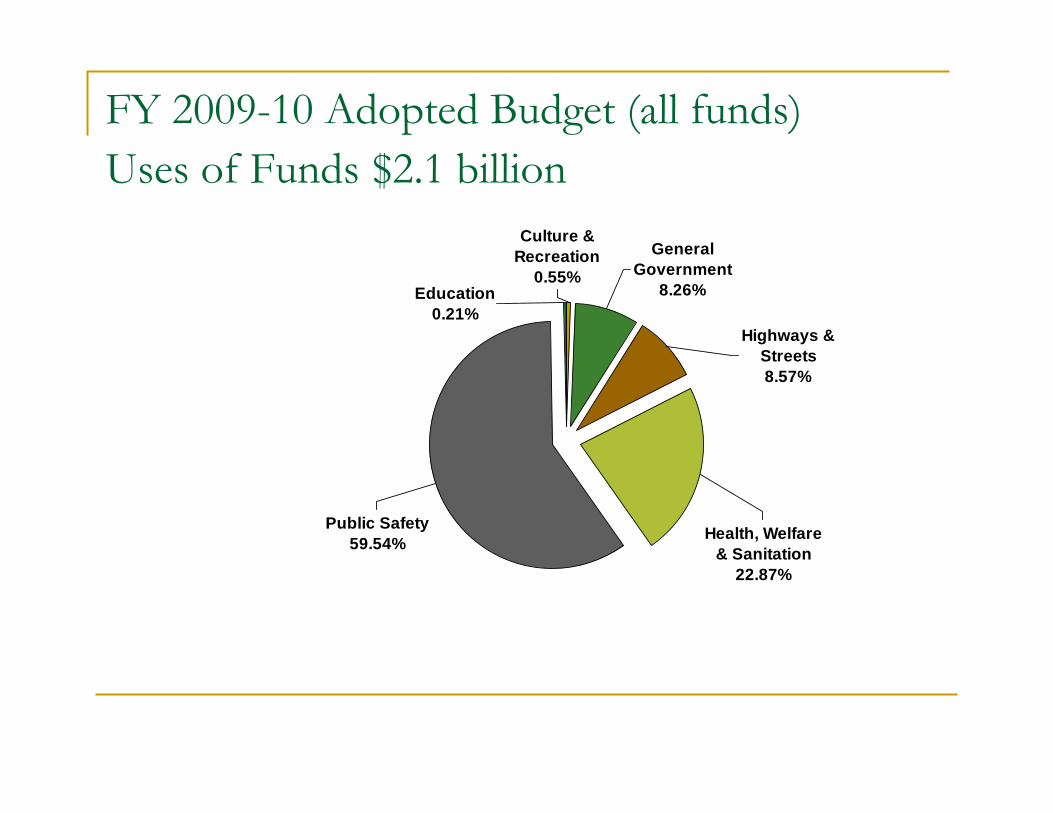
FY 2009-10 Adopted Budget (all funds)Uses of Funds $2.1 billion
Highways & Streets8.57%
Health, Welfare & Sanitation
22.87%
Public Safety59.54%
Education0.21%
General Government
8.26%
Culture & Recreation
0.55%

General Fund Operating Revenue$1.09 billion
State-Shared Sales Tax, $368.40 M,
34%
Vehicle License Tax, $118.40 M,
11%
Property Tax, $487.40
M , 44%
Other Revenues,
$115.20 M , 11%

2009-10 Net Variance overFY 2008-09 Adopted Budget
(millions)FY 2008-09 FY 2009-10
Adopted Recomm. Reduction %
Total County 2,259$ 2,136$ 122$ 5.4%
Total County Operating 1,772$ 1,712$ 60$ 3.4%
Total General Fund 1,443$ 1,273$ 170$ 11.8%
General Fund Operating 1,167$ 1,089$ 77$ 6.6%
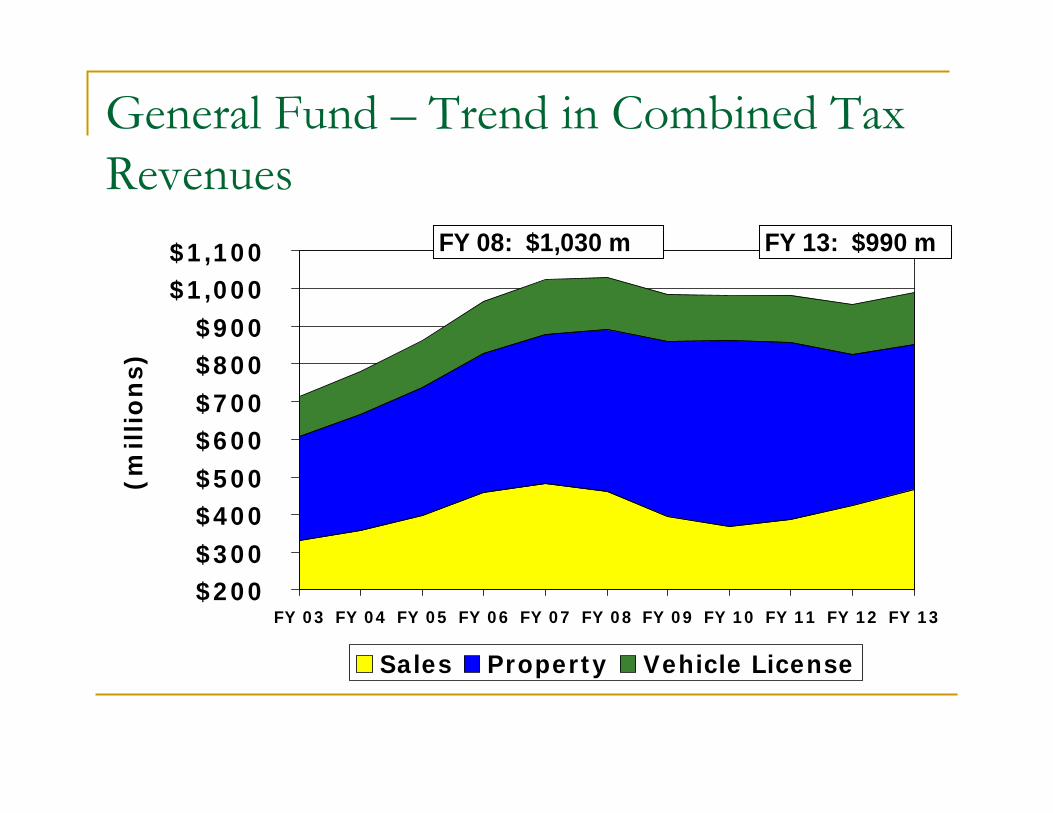
General Fund – Trend in Combined Tax Revenues
$200$300$400$500$600$700$800$900
$1,000$1,100
FY 03 FY 04 FY 05 FY 06 FY 07 FY 08 FY 09 FY 10 FY 11 FY 12 FY 13
(mil
lio
ns)
Sales Property Vehicle License
FY 08: $1,030 m FY 13: $990 m

Sales Tax Trend
$357.5$368.4
$468.1
$425.5
$386.9$394.9
$461.0
$480.4
$457.8
$397.7
$300$320$340$360$380$400$420$440$460$480$500
FY 04 FY 05 FY 06 FY 07 FY 08 FY 09 FY 10 FY 11 FY 12 FY 13
(mil
lio
ns)
Forecasts – Elliott D. Pollack pessimistic scenario, July 2009

Vehicle License Tax Trend
$104
$126
$138$143
$149
$132
$127
$120
$139
$144
$138
$123
$116
$80
$90
$100
$110
$120
$130
$140
$150
$160
FY 03 FY 04 FY 05 FY 06 FY 07 FY 08 FY 09 FY 10 FY 11 FY 12 FY 13 FY 14 FY 15
(mil
lio
ns)
Forecasts – Elliott D. Pollack pessimistic scenario, July 2009
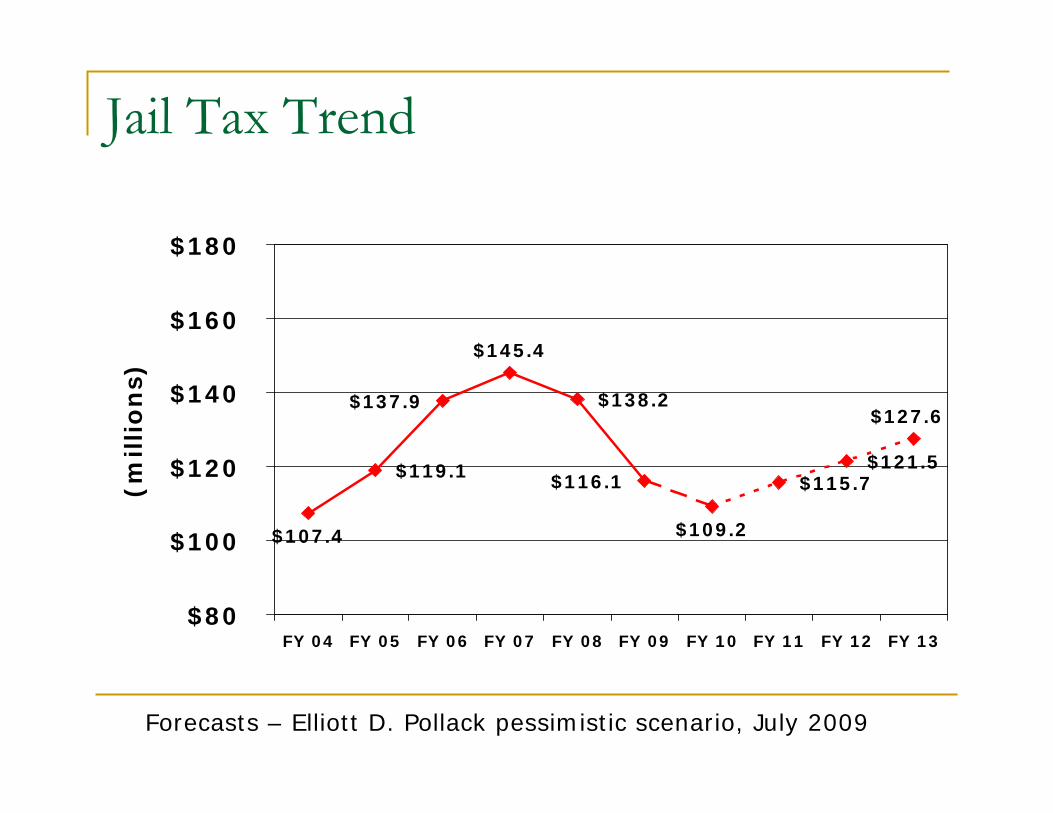
Jail Tax Trend
$107.4 $109.2
$119.1
$137.9
$145.4
$138.2
$116.1 $115.7$121.5
$127.6
$80
$100
$120
$140
$160
$180
FY 04 FY 05 FY 06 FY 07 FY 08 FY 09 FY 10 FY 11 FY 12 FY 13
(millio
ns)
Forecasts – Elliott D. Pollack pessimistic scenario, July 2009

State Shared Highway User Revenues
$86.6
$80.1
$90.6
$97.0
$107.6
$102.8
$87.8 $93.4$96.2
$99.1
$60
$70
$80
$90
$100
$110
$120
FY 04 FY 05 FY 06 FY 07 FY 08 FY 09 FY 10 FY 11 FY 12 FY 13
(millions)
Forecasts – Elliott D. Pollack pessimistic scenario, July 2009

Total Net Assessed Value
Primary
Secondary
$20
$25
$30
$35
$40
$45
$50
$55
$60
$65
FY03
FY04
FY05
FY06
FY07
FY08
FY09
FY10
FY11
FY12
FY13
FY14
(billio
ns)
Forecasts – Elliott D. Pollack pessimistic scenario, July 2009
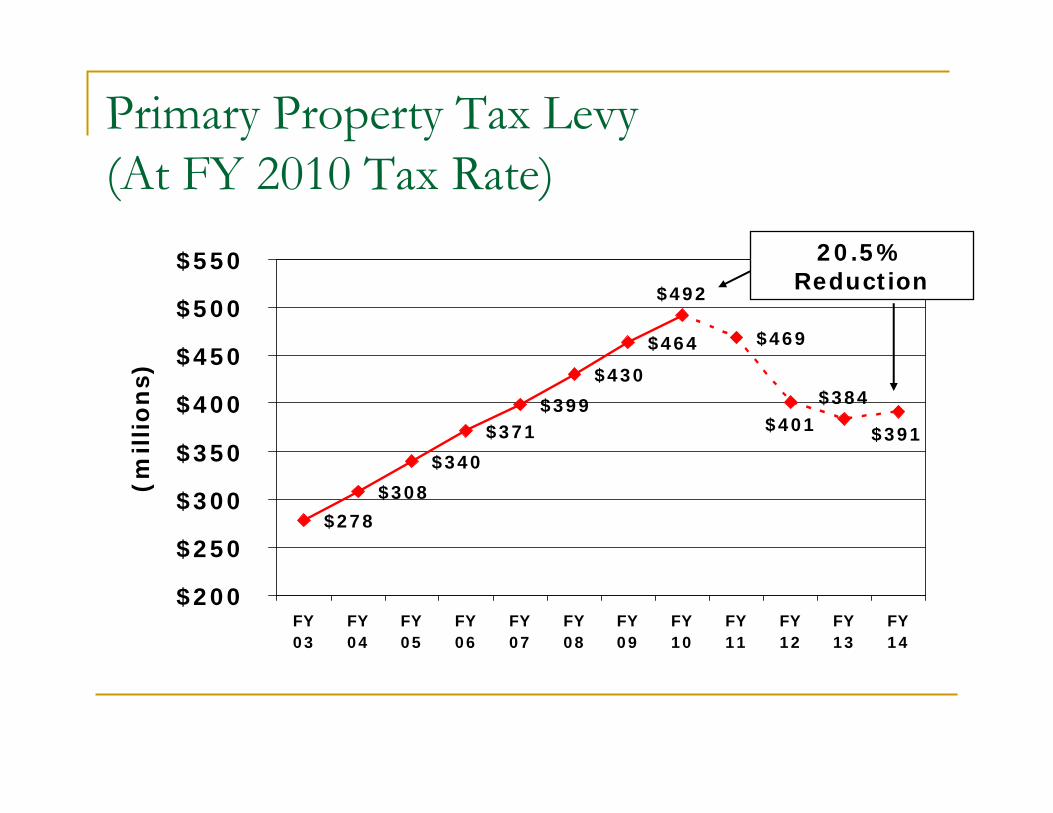
Primary Property Tax Levy(At FY 2010 Tax Rate)
$278
$464
$384
$391$401
$469
$492
$430
$399$371
$340
$308
$200
$250
$300
$350
$400
$450
$500
$550
FY03
FY04
FY05
FY06
FY07
FY08
FY09
FY10
FY11
FY12
FY13
FY14
(millio
ns)
20.5% Reduction
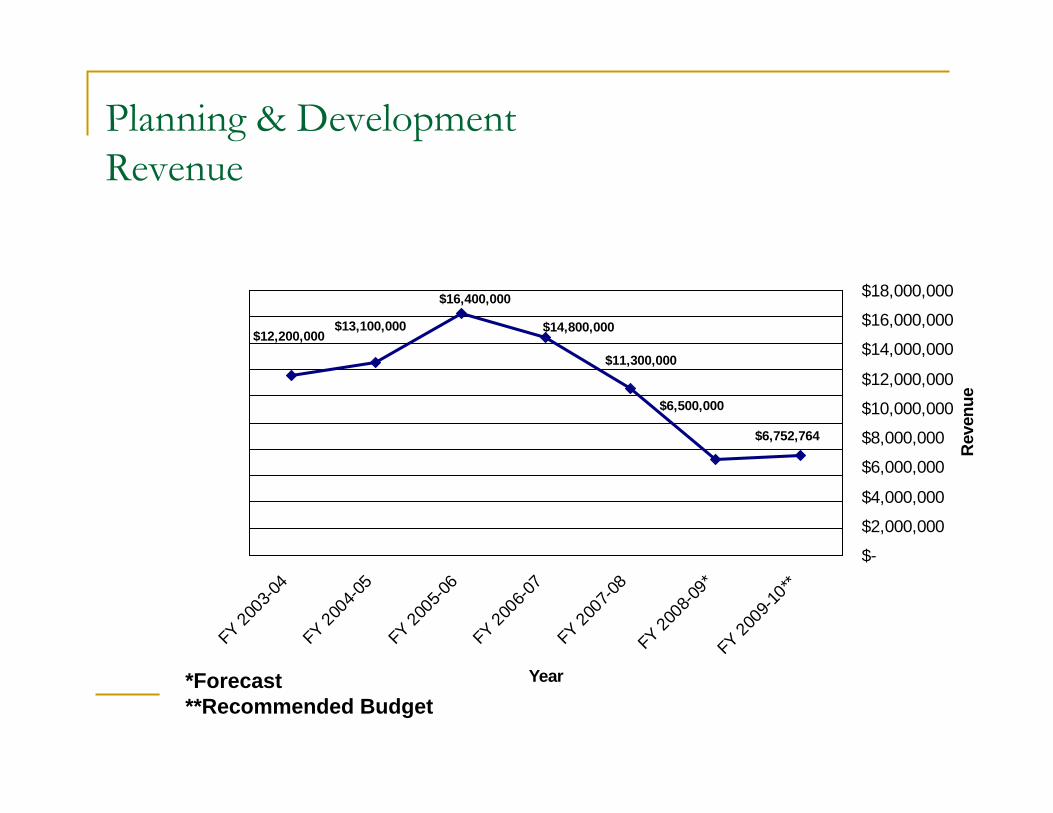
Planning & DevelopmentRevenue
$6,752,764
$6,500,000
$11,300,000
$14,800,000
$16,400,000
$13,100,000$12,200,000
$-$0$0$0$0$1$1$1$1$1$1
FY 20
03-04
FY 2004-0
5
FY 20
05-06
FY 20
06-07
FY 200
7-08
FY 20
08-09
*FY
2009
-10**
Year
$-
$2,000,000
$4,000,000
$6,000,000
$8,000,000
$10,000,000
$12,000,000
$14,000,000
$16,000,000
$18,000,000
Rev
enue
*Forecast**Recommended Budget

State ImpactsCounty Contribution – budgeted at $24.1 m, but was included in budget reconciliation bill vetoed by the Governor; expected to come backHURF Diversion to DPS – estimated impact nearly $6 million per yearOutcome of FMAP savings not entirely clear
$45 million reduction in FY 10 County contribution to long term care (not enacted until after County budget adoption)Refunds expected for FY 09 long term care and FY 09 and FY 10 acute care, but no notification of specific amountsCounty has to treat any FMAP savings as a one-time source

Maricopa County ALTCS Contribution Growth, FY 2002-2010 (excludes FMAP)
$165
$162
$153$145
$130
$126
$102
$115
$110
$90
$110
$130
$150
$170
FY 02 FY 03 FY 04 FY 05 FY 06 FY 07 FY 08 FY 09 FY10
Mill
ions
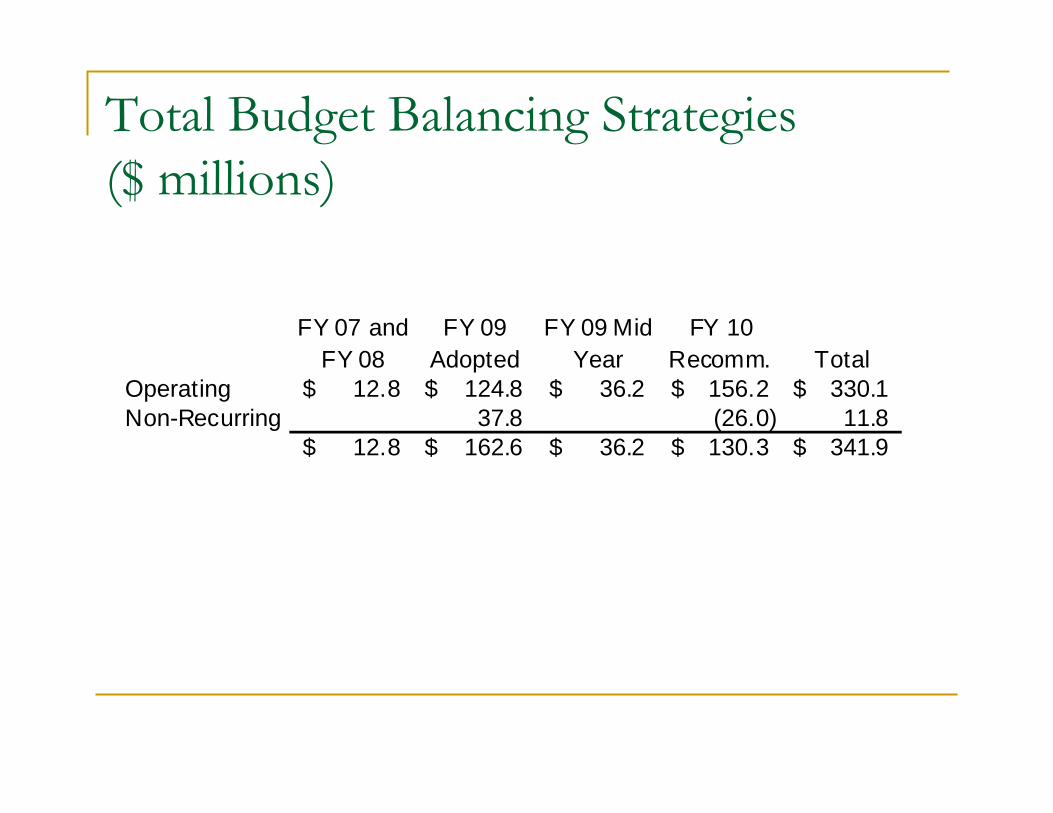
Total Budget Balancing Strategies ($ millions)
FY 07 and FY 08
FY 09 Adopted
FY 09 Mid Year
FY 10 Recomm. Total
Operating 12.8$ 124.8$ 36.2$ 156.2$ 330.1$ Non-Recurring 37.8 (26.0) 11.8
12.8$ 162.6$ 36.2$ 130.3$ 341.9$
Structurally Balanced Budget
Definition: Ongoing revenues meet or exceed ongoing
expenditures

History of Budget BalancingFY 2006-07
Lowered revenue projections and cut spending mid-year
FY 2007-08 Budget PreparationRevenue budgets for State-shared Sales, Jail Excise and Vehicle License Taxes prepared with little or no revenue growthBudget reductions in personnel budgets, court security, overtime, supplies, services

History of Budget Balancing
FY 2007-08 Mid-YearReduced all administrative budgets by 5%Froze hiring and capital expendituresFroze contingency fundsReduced overtime
FY 2008-09 Budget PreparationReduced operating budgets by an average of 5.6%

History of Budget Balancing
FY 2008-09 Mid-YearContinued hiring and capital freezesContinued contingency freezeUsed contingency funds and funds reserved for salary increases to offset $58.4 deficit
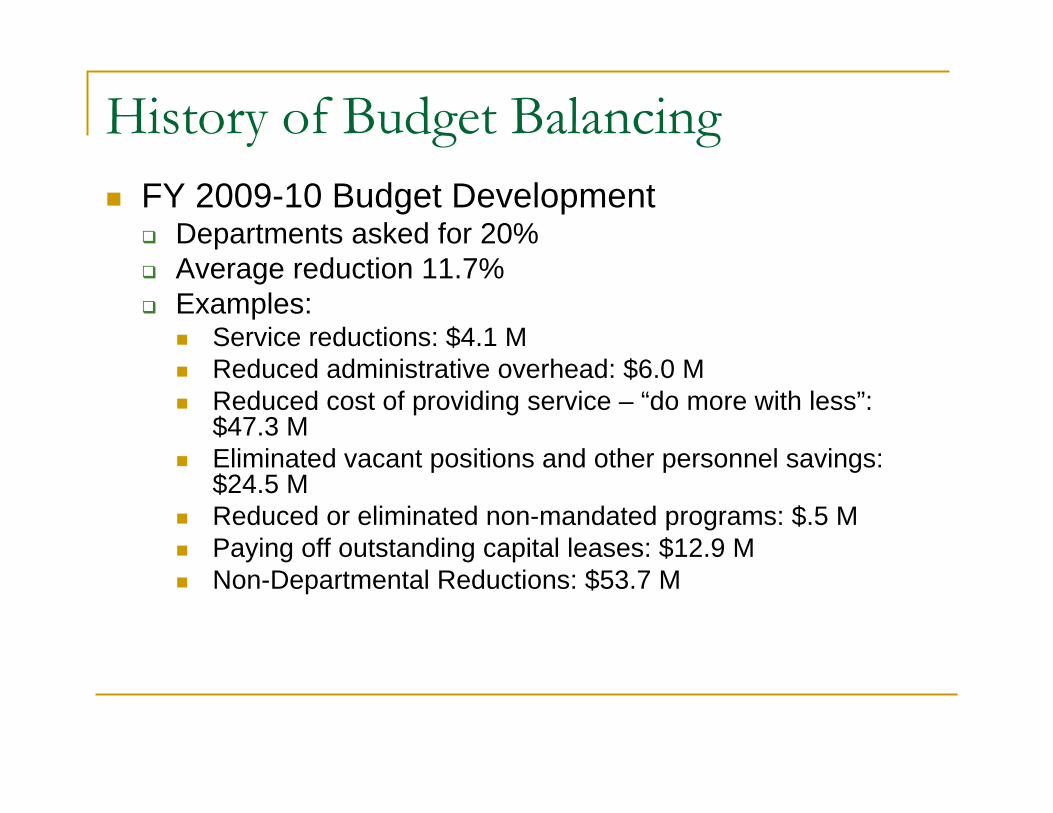
History of Budget BalancingFY 2009-10 Budget Development
Departments asked for 20%Average reduction 11.7%Examples:
Service reductions: $4.1 MReduced administrative overhead: $6.0 MReduced cost of providing service – “do more with less”: $47.3 MEliminated vacant positions and other personnel savings: $24.5 MReduced or eliminated non-mandated programs: $.5 MPaying off outstanding capital leases: $12.9 MNon-Departmental Reductions: $53.7 M

General Fund Expenditure Departmental Reductions (by category)
Public Safety, $ (38.52), 61%
Culture & Recreation, $ (0.73), 1% Education, $ (0.28), 0%
General Government, $ (21.27), 33%
Health, Welfare, & Sanitation, $ (3.36), 5%

FY 2009-10 General Fund Expenditure Departmental Reductions (by type)
Fund Shifts, $(2.75), 4%
Non-Mandated, $(0.27), 0%
Vacancies, $(18.63), 25%
Service Reductions, $(2.36), 3%
Other, $4.53 , 6% Administrative, $(5.41), 7%
Capital Lease, $(5.22), 7%
Efficiencies, $(34.12), 48%
Amounts shown in millions

General Fund Departmental Two YearBudget Reduction Summary
Average Reduction: 13.2%$74.6 million in departmental reductions
Average Appointed Reduction: 13.7%Average Elected Reduction: 13.7%Average Judicial Reduction: 12.1%

Reductions in Staffing
Total Full Time Equivalent Positions Eliminated
FY 08 FY 09 FY 09 FY 10 Total(Mid-Year) Adopted (Mid-Year) To Date (to date)
Filled (43.0) (11.0) (54.0) (209.7) (317.7) Vacant (34.0) (164.2) (91.1) (834.0) (1,123.3) Total (77.0) (175.2) (145.1) (1,043.7) (1,441.0)
Terminations and H ires (FY 08 and FY 09 to date):
Terminations: 3,427 Hires: 1,004 Net Vacancies: 2,423
Does not reflect positions added through ARRA funding.
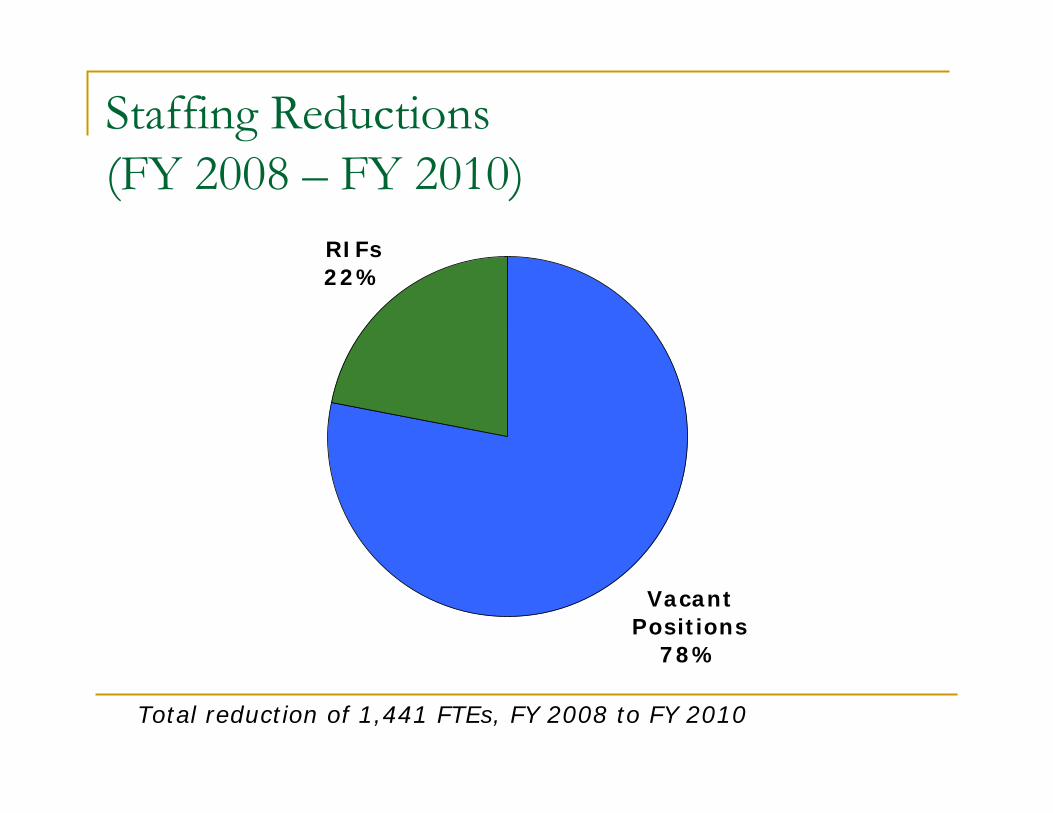
Staffing Reductions (FY 2008 – FY 2010)
Vacant Positions
78%
RIFs22%
Total reduction of 1,441 FTEs, FY 2008 to FY 2010

Trend in General Fund Operating Revenues and Budgeted Expenditures
$1.09$1.09
$1.15$1.16
$1.09
$1.17$1.18
$1.20
$1.00
$1.05
$1.10
$1.15
$1.20
$1.25
FY 2007 FY 2008 FY 2009 FY 2010*
(billio
ns)
Actual Operating RevenuesBudgeted Operating Expenditures
*FY 2010 Budget
Structural imbalance adjusted
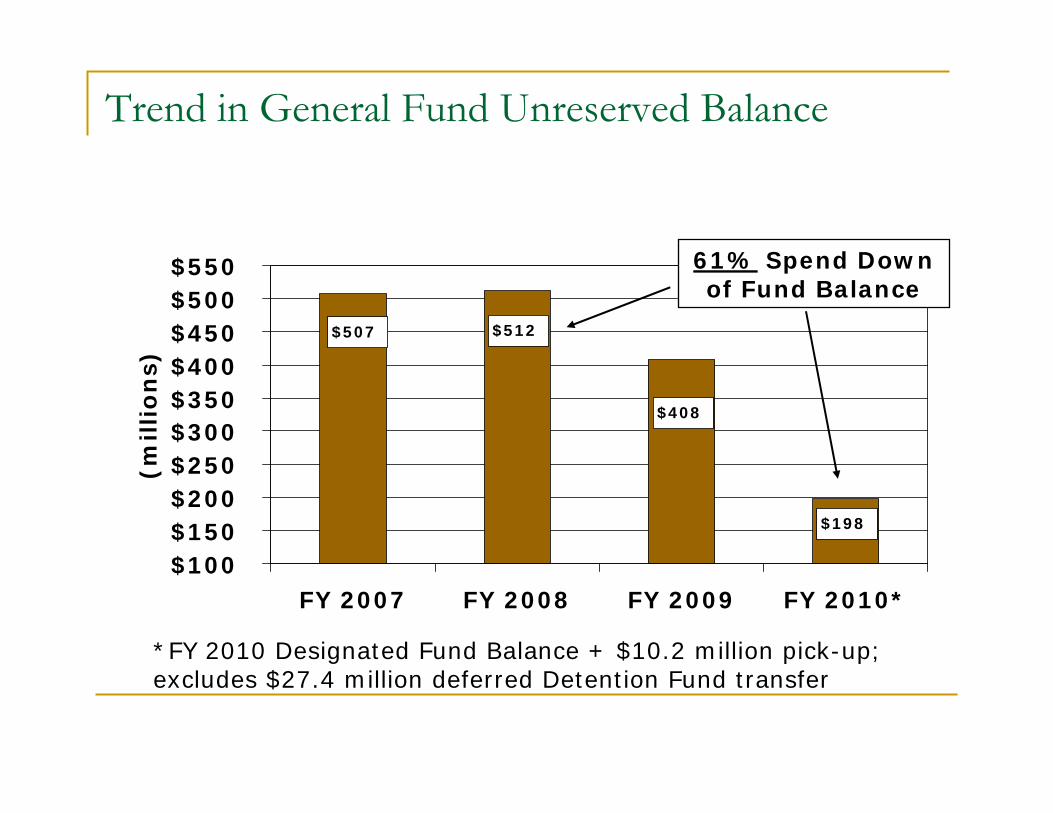
Trend in General Fund Unreserved Balance
$198
$408
$512$507
$100$150$200$250$300$350$400$450$500$550
FY 2007 FY 2008 FY 2009 FY 2010*
(millio
ns)
*FY 2010 Designated Fund Balance + $10.2 million pick-up; excludes $27.4 million deferred Detention Fund transfer
61% Spend Down of Fund Balance
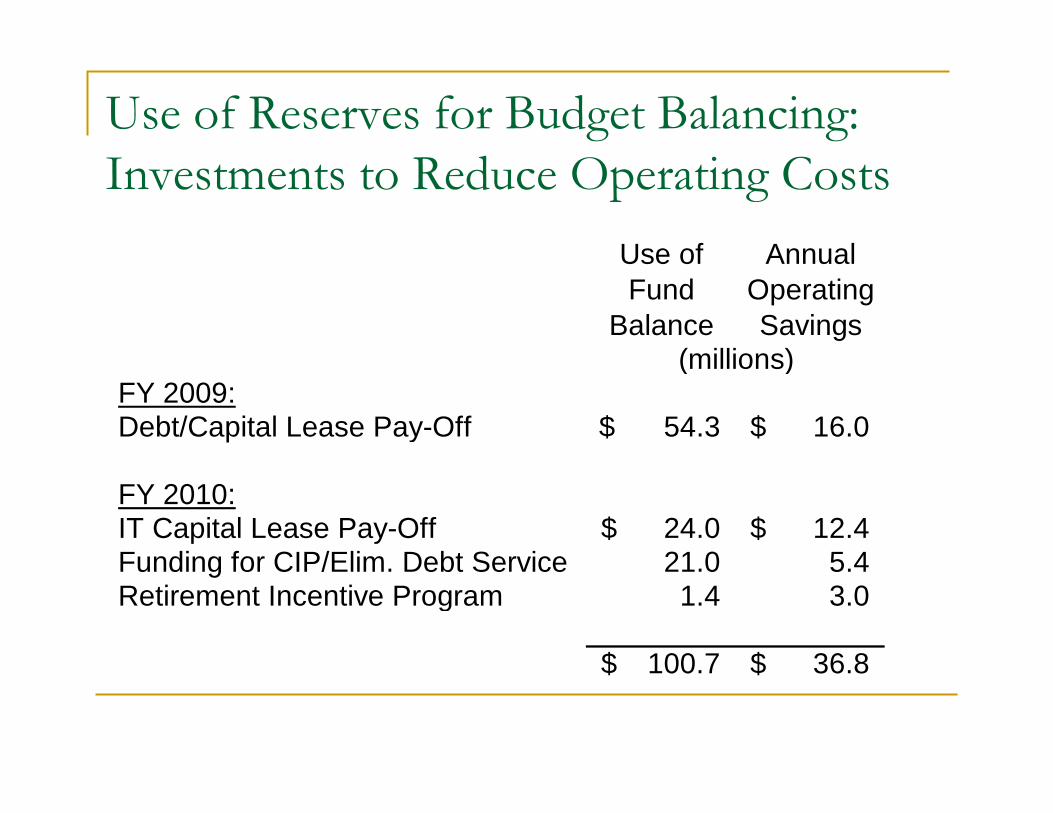
Use of Reserves for Budget Balancing:Investments to Reduce Operating Costs
Use of Fund
Balance
Annual Operating Savings
(millions)FY 2009:Debt/Capital Lease Pay-Off 54.3$ 16.0$
FY 2010:IT Capital Lease Pay-Off 24.0$ 12.4$ Funding for CIP/Elim. Debt Service 21.0 5.4 Retirement Incentive Program 1.4 3.0
100.7$ 36.8$

Moving Forward
Stabilize – continue to use fund balance responsiblySlim down services if revenue declines continueForecast continuously – adjust course as necessary to maintain structural balance

Impact of the ARRA on Budget Process
Globally, Maricopa County did not approach potential ARRA as a budget-balancing strategyOur budget was not balanced on ARRA funding, so we do not need an “exit strategy”County budget reductions focused more on efficiencies rather than service reductions or eliminationsARRA funding is allowing the County to expand services to our residents (particularly in areas where demand is heightened by the recession) and project investments


![Fiscal Issues of Statewide Significance - Washingtonleap.leg.wa.gov/leap/budget/lbns/1993-95partii.pdf · 2008. 3. 17. · Fiscal Issues of Statewide Significance ]HEALTH CARE REFORM](https://img.pdfslide.us/doc/110x75/60d0815c91e68516265617f0/fiscal-issues-of-statewide-significance-2008-3-17-fiscal-issues-of-statewide.jpg)