Embed Size (px)
Citation preview

Maria Masten, PE MnDOT Concrete Engineer
Research Pays OffSeptember 20, 2016

Durability◦ Materials◦ Workmanship
Smoothness ◦ What the travelling
public cares about

Prescriptive…
Thinking outside the prescriptive box…
Performance…

Pavements from the early 80’s were showing premature deterioration
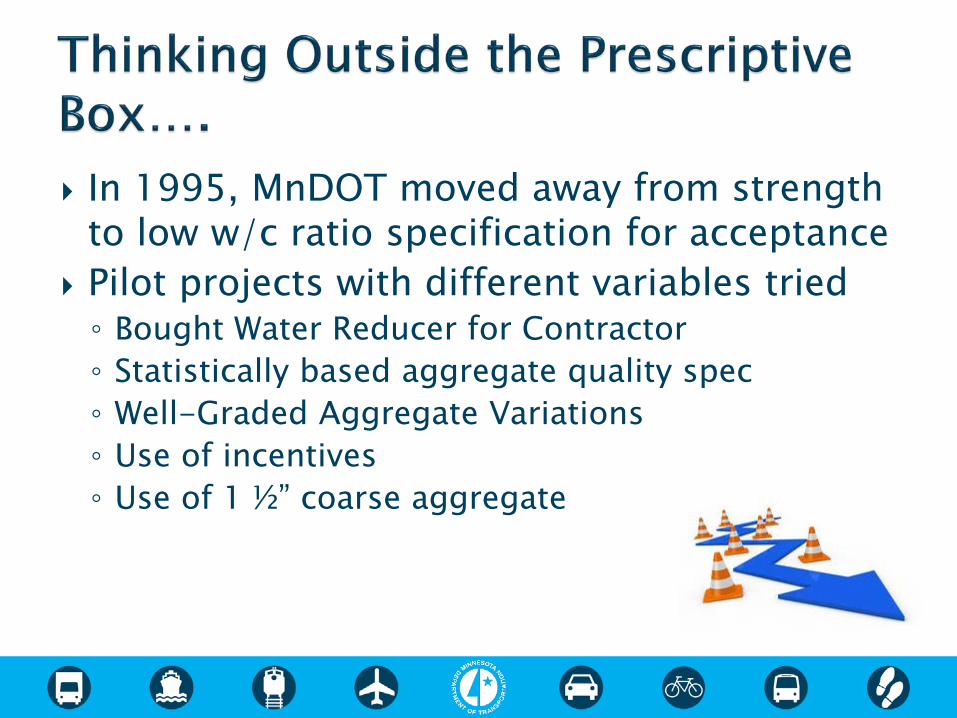
In 1995, MnDOT moved away from strength to low w/c ratio specification for acceptance
Pilot projects with different variables tried◦ Bought Water Reducer for Contractor◦ Statistically based aggregate quality spec◦ Well-Graded Aggregate Variations◦ Use of incentives◦ Use of 1 ½” coarse aggregate
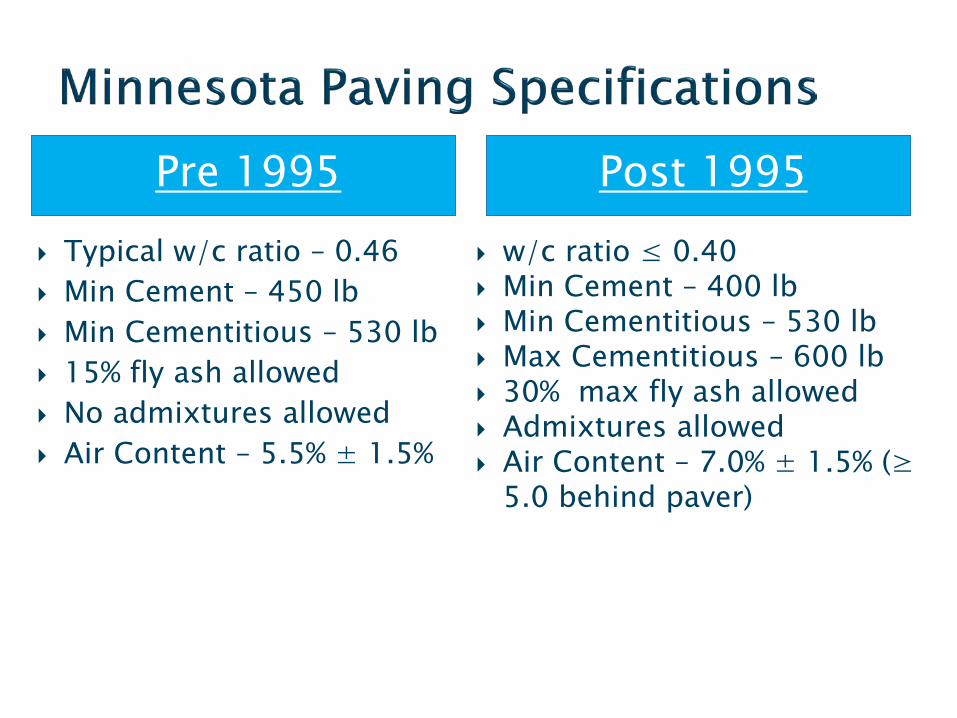
Pre 1995 Typical w/c ratio – 0.46 Min Cement – 450 lb Min Cementitious – 530 lb 15% fly ash allowed No admixtures allowed Air Content – 5.5% ± 1.5%
Post 1995 w/c ratio ≤ 0.40 Min Cement – 400 lb Min Cementitious – 530 lb Max Cementitious – 600 lb 30% max fly ash allowed Admixtures allowed Air Content – 7.0% ± 1.5% (≥
5.0 behind paver)
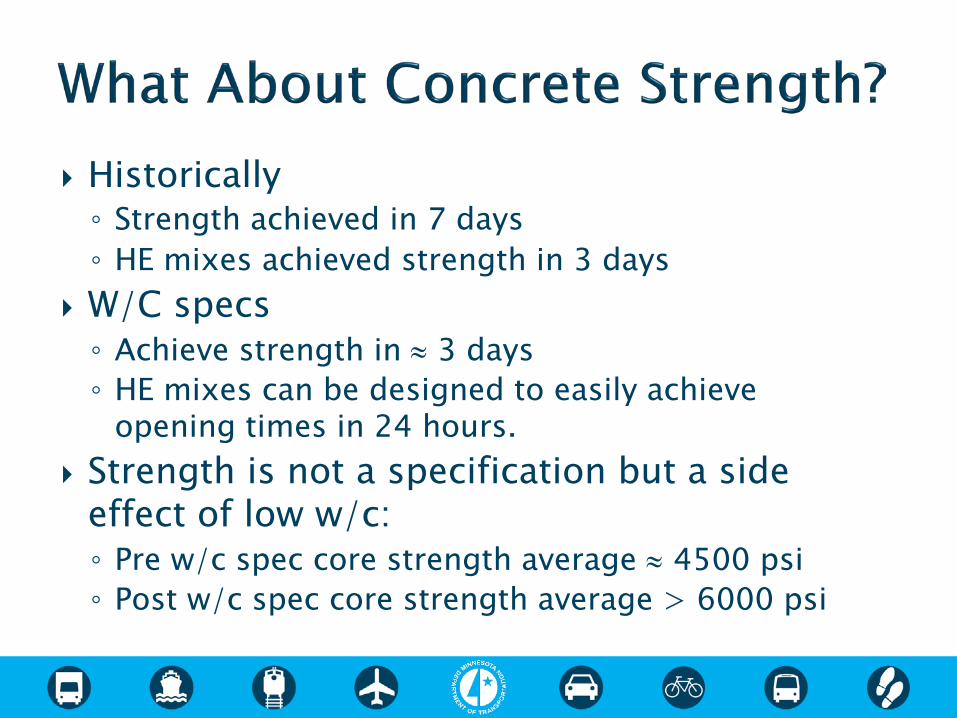
Historically ◦ Strength achieved in 7 days◦ HE mixes achieved strength in 3 days
W/C specs ◦ Achieve strength in ≈ 3 days◦ HE mixes can be designed to easily achieve
opening times in 24 hours. Strength is not a specification but a side
effect of low w/c:◦ Pre w/c spec core strength average ≈ 4500 psi◦ Post w/c spec core strength average > 6000 psi

‣ 3 Principal factors that guide the current spec:◦ Mix durability◦ Incentives/disincentives Max w/c Ratio Coarse Aggregate Quality Well-Graded Aggregate Optional Incentive◦ Curing Practices

Immediate resultsHow? – we cook concrete in the microwavePay off batch tickets as verified by microwave test
Eliminate testing variables related to strengthAssured quality & performance Increased strengths

Do not place concrete mix not meeting the 0.40 water/cement ratio requirement when using fly ash and 0.42 when using slag/ternary in the work.
Water added to the surface of the concrete without the approval of the Engineer, is not eligible for w/c ratio or ride incentives

0
5
10
15
20
% R
ETA
INE
D
SIEVE SIZE
Optional Gradation Incentive Specification (Stay in the Area Between Lines)
20
25
30
35
40
45
0102030405060708090100
Wor
kabi
lity
Fact
or
Coarseness Factor
Coarseness Factor Chart
Workability Box
23
45
1
II
I IIIV0
C
BA

1996-1998
2014

Water reducers Cement Fly ash Sand Aggregate gradation Recycled aggregates Finishing Curing Ride
It’s a “system”

Reward excellence Reward innovation Encourage new ideas Allow for mistakes and failure

Communication!!!◦ Contractors need to know what the objectives are◦ Contractors need to know what has worked and
what hasn’t◦ Contractors need to be given leeway/opportunity
to learn Shared risk More carrot than stick

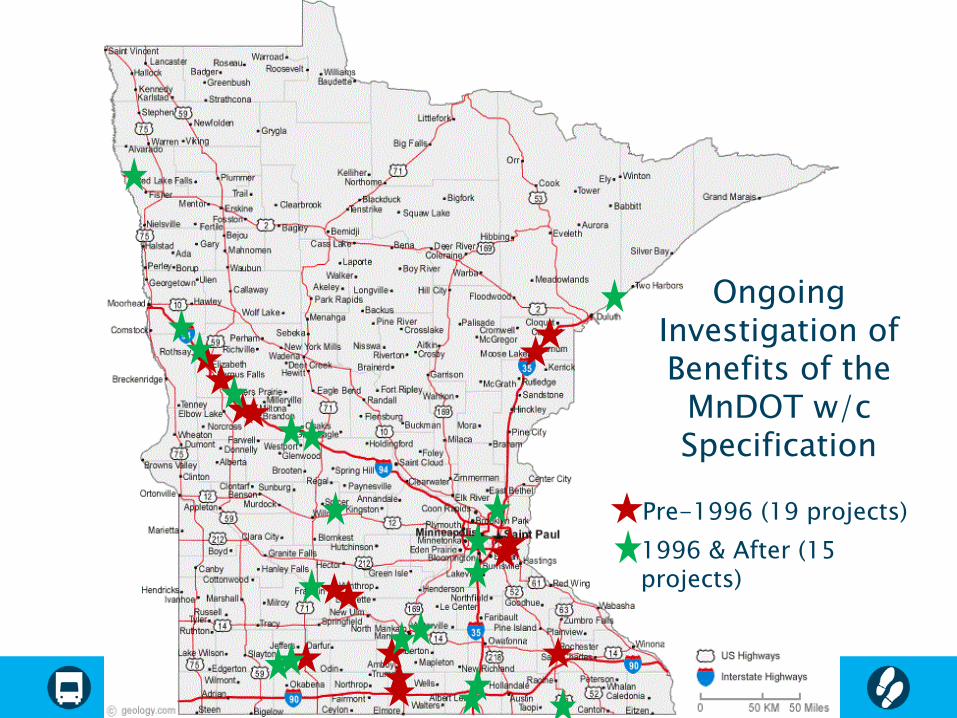
Pre-1996 (19 projects)1996 & After (15 projects)
Ongoing Investigation of Benefits of the
MnDOT w/c Specification

Lower Permeability-Concrete holds less water-Fights the ingress of deicers-Lower critical saturation level-Can’t transport as much water

Contractors believe in and buy into the incentive system.◦ Contractors Will Reduce Their Bids Partially To
Account For Some Of The Expected Incentive To Assure Being The Low Bidder
After 17+ years little signs of deterioration All noticeable defects appear to be
construction related Smoothness has improved Durability has improved

FHWA Initiative – motivated by MAP-21 legislation that focuses on performance
MnDOT currently involved in ETG Implementation needs Champion States:◦ Indiana, Iowa, Michigan, Minnesota, Nebraska,
South Dakota, Wisconsin, Illinois Tollway, Manitoba◦ Paving Industry Representatives participate on the
Champion State phone calls Step 1 – AASHTO Provisional Specification
for Performance Engineered Concrete Mixes

Entered a data gathering mode on concrete paving projects through consultant testing (AET)◦ SAM testing ◦ Box testing◦ Vkelly ball testing◦ Aggregate Voids Testing◦ Resistivity (AET and MnDOT)◦ Formation Factor (MnDOT)

AASHTO Provisional Standard TP 118◦ Modified version of typical pressure meter (ASTM
C231)◦ Two sequential pressurizations of the concrete, the difference between thepressure steps calculates the SAM Number, which is correlated with theaverage spacing between air voids inthe concrete mixture.
Photo courtesy of Dr. Tyler Ley, OSU

0
0.005
0.01
0.015
0.02
0.00 0.10 0.20 0.30 0.40 0.50 0.60
Spac
ing F
acto
r (in
)
SAM Number
Minnesota
CODOT
FHWA
GEIGER
IOWA
MICHIGAN
MIT
NEBRASKA
N. DAKOTA
S. DAKOTA
UDOT
NO
YES!
SAM limit 0.20 – 68% agreementSAM limit 0.25 – 79% agreement
Slide courtesy of Dr. Tyler Ley, OSU

0
0.1
0.2
0.3
0.4
0.5
0.6
0.7
0 2 4 6 8 10 12 14
SAM
Num
ber
Air %
Good void system
Poor void system
Slide courtesy of Dr. Tyler Ley, OSU

A simple test that examines:◦ Response to vibration◦ Filling ability of the grout◦ Ability of the slip formed concrete to hold a sharp
edge (cohesiveness) The Slump test can not tell us this!
Slide courtesy of Dr. Tyler Ley, OSU

In most cases, the box test has proven out very workable concrete mixes
PHOTOGRAPHS
AET PROJECT NO. 29-02229
Photo 1: Photo 2:
Photo 3: Photo 4:
CONSULTANTS · ENVIRONMENTAL · GEOTECHNICAL · MATERIALS · FORENSICS
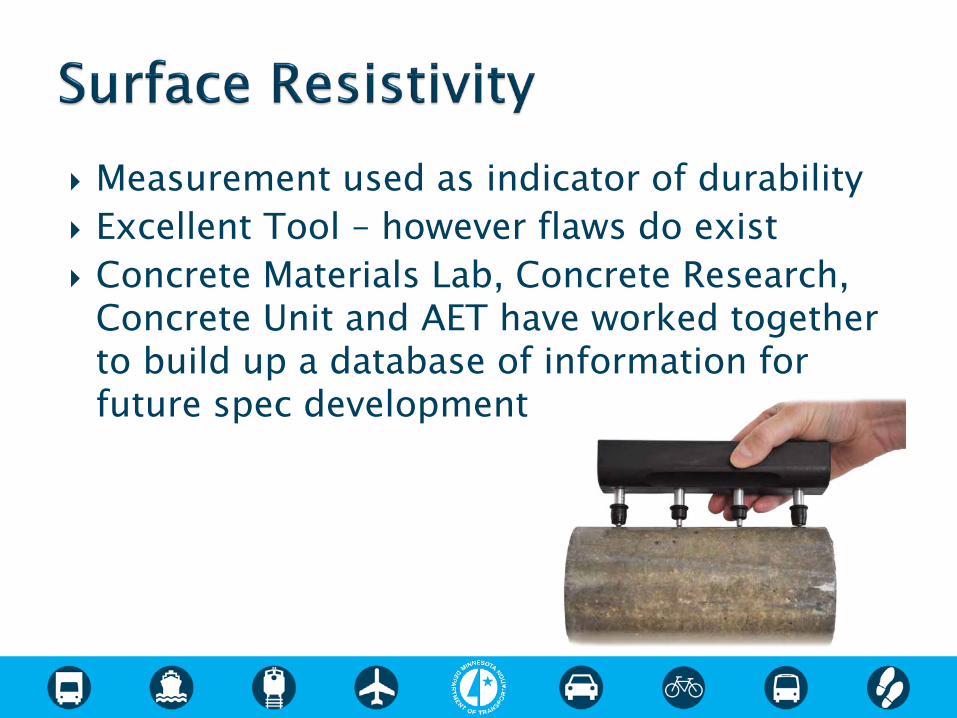
Measurement used as indicator of durability Excellent Tool – however flaws do exist Concrete Materials Lab, Concrete Research,
Concrete Unit and AET have worked together to build up a database of information for future spec development

We can relate obtain the F Factor from resistivityand relate it to depth of chloride penetration
From Weiss et al. 2016c

MnDOT is performing XRF testing on cementitious samples from 2016 paving projects
Entering mix design and chemistry data into the pore solution calculator to see what today’s mixes predict
Intend to test cores from each project for surface resistivity
Taking the remaining cores from the w/c investigation (~ 17 years of service)
Shipping to Oregon State University for them to grind up the concrete and determine the chemistry of the original materials that can correlate to current field performance

Change can be hard for some Balancing risk and reward can be a
challenge for both the Contractor and Agency
Further development of performance mix designs will evolve…the exciting thing is technology is getting to the point where we will have tools that can give us better indications of the long term quality of the concrete…

Questions?