Embed Size (px)
Citation preview
Financial statementsMarch 31, 2020
1
2
• This document has been prepared by Mizrahi-Tefahot Bank Ltd (UMTB) solely for use at the company's presentation.The information contained in this document constitutes information from the bank's 2020 quarterly reports and/ orimmediate reports, as well as the periodic, quarterly and annual reports and/or immediate reports published by the bankin previous years.
• Accordingly, the information contained in this document is only partial, is not exhaustive and does not include the fulldetails regarding the bank and its operations or regarding the risk factors involved in its activity and certainly does notreplace the information included in the periodic, quarterly or immediate reports published by the bank. In order to receivethe full picture regarding the bank's 2020 quarterly reports, the aforesaid reports should be perused fully, as published tothe public.
• None of the company, or any of their employees or representatives shall have any liability whatsoever (in negligence orotherwise) for any loss howsoever arising from any use of this document or its contents or otherwise arising in connectionwith this document.
• The bank's results in practice may be significantly different from those included in the forecasting information, as a resultof a large number of factors, including, inter alia, changes in the domestic and global equity markets, macro-economicchanges, geo-political changes, legislation and regulation changes, and other changes that are not under the bank'scontrol, which may lead to the estimations not realizing and/or to changes in the business plans.
• The forecasting information may change subject to risks and uncertainty, due to being based on the management'sestimations regarding future events, which include, inter alia: global and local economic development forecasts,particularly regarding the economic situation in the market, including the effect of macro-economic and geo-politicalconditions; expectations for changes and developments in the currency and equity markets; forecasts related to othervarious factors affecting exposure to financial risks; forecasts with respect to changes to borrowers' financial strength,public preferences, changes in legislation and the provisions of regulators, competitors' behavior, the status of the bank'sperception, technological developments and human resources developments.
• This document does not constitute an offer to sell, or a solicitation of an offer to buy, or a recommendationof any kind regarding any security or any interest in security.
Disclaimer
3
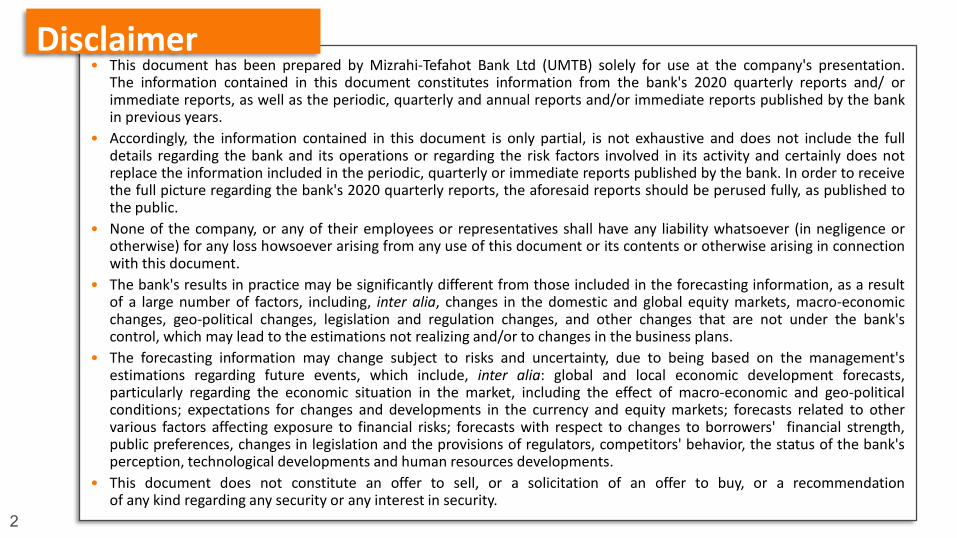
Impact of the Corona virus crisis
Extensive
operational
preparation which
enabled
appropriate service
to bank customers
• At all time branch network remain operational
• Ensuring social distancing and implementation of capsules operation
• Remote operation from home
Response to
customers in
light of social
distancing
limitations and
the economic
situation
• Expansion of all digital branches in order to address clients’ needs An extensive approval of grace periods or bridge loans for customers
• Servicing clients through a mobile branch
Leveraging
business
opportunities
• Core deposits gathering
• Government-guaranteed loans for SMEs and midmarket
• Leveraging the bank’s operational capabilities proven during the crisis period, to continue to recruit quality customers and improve operational efficiency
4
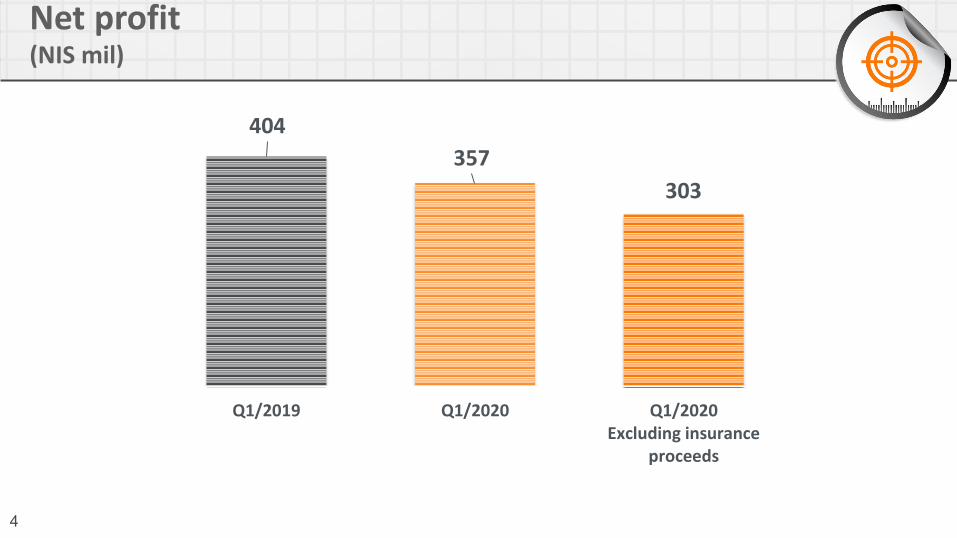
Net profit(NIS mil)
404
357
303
Q1/2019 Q1/2020 Q1/2020Excluding insurance
proceeds
5
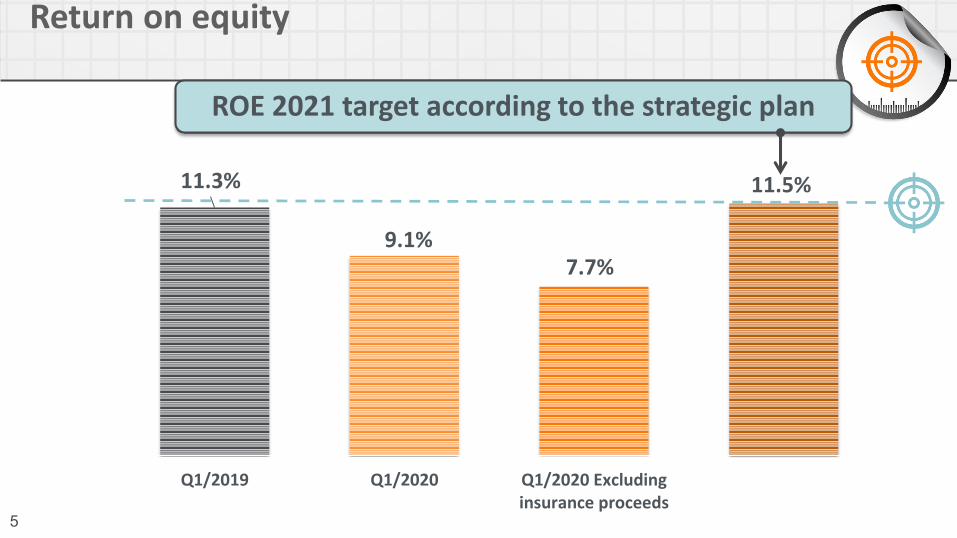
Return on equity
11.3%
9.1%7.7%
11.5%
Q1/2019 Q1/2020 Q1/2020 Excludinginsurance proceeds
ROE 2021 target according to the strategic plan
6
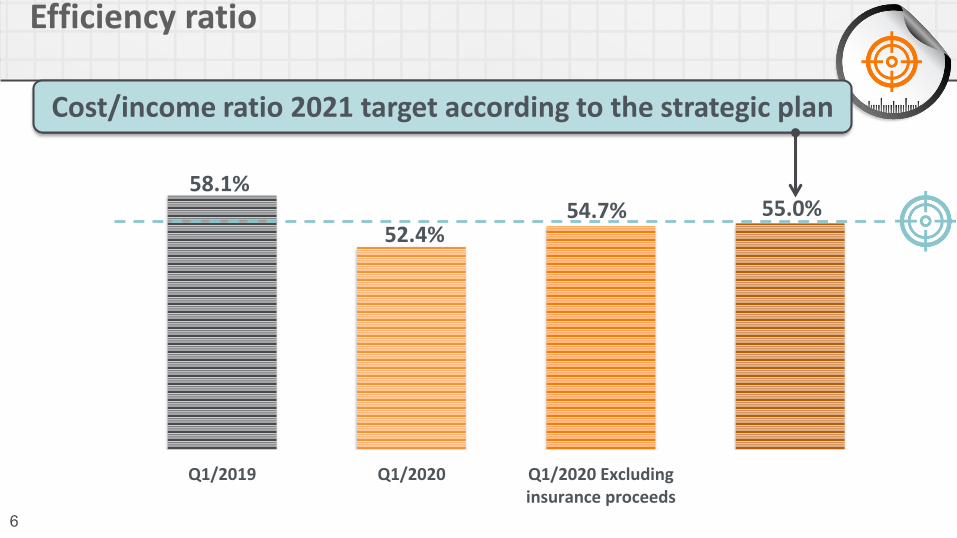
Efficiency ratio
58.1%
52.4%54.7% 55.0%
Q1/2019 Q1/2020 Q1/2020 Excludinginsurance proceeds
Cost/income ratio 2021 target according to the strategic plan
7
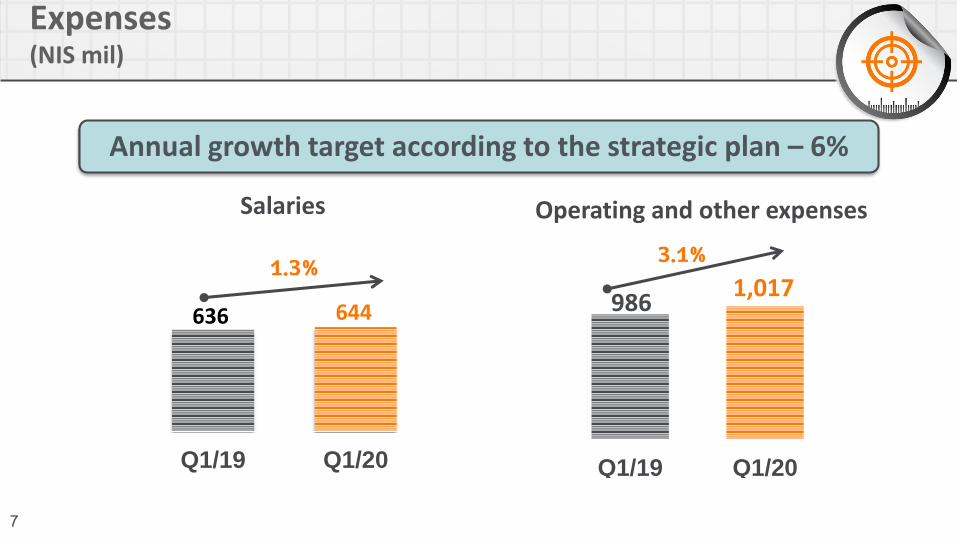
Expenses(NIS mil)
Annual growth target according to the strategic plan – 6%
9861,017
Q1/19 Q1/20
3.1%
Operating and other expenses
1.3%
Salaries
636 644
Q1/19 Q1/20
8
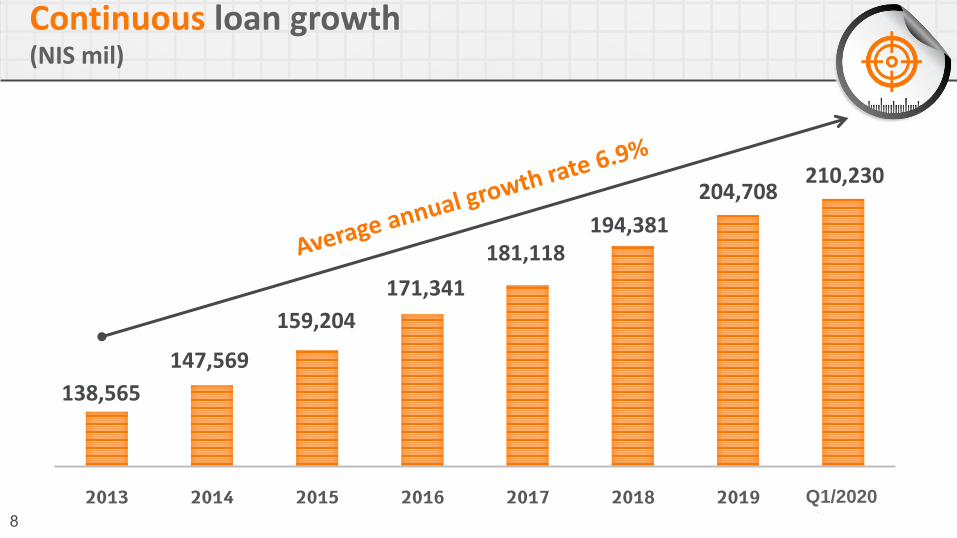
Continuous loan growth(NIS mil)
138,565
147,569
159,204
171,341
181,118194,381
204,708210,230
2013 2014 2015 2016 2017 2018 2019 Q12020Q1/2020
9
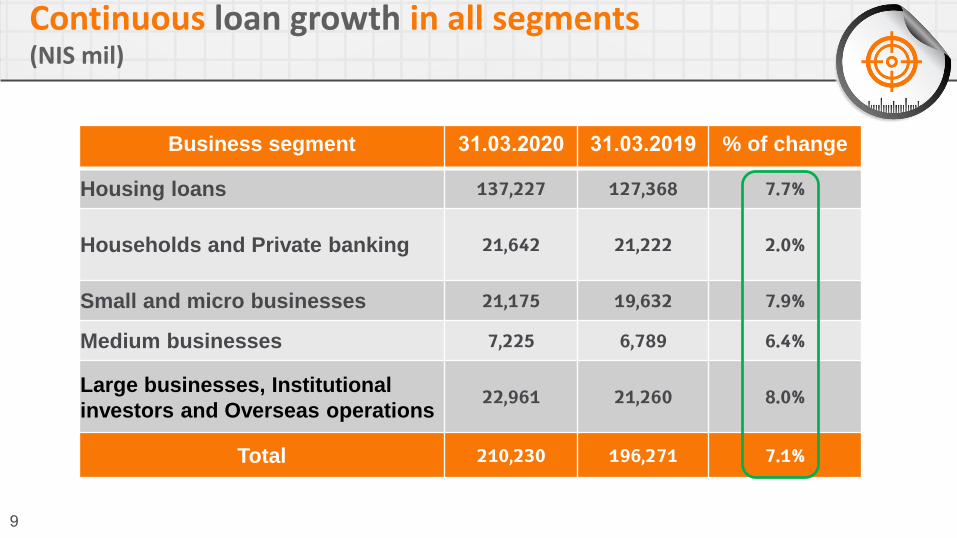
Continuous loan growth in all segments(NIS mil)
% of change31.03.201931.03.2020Business segment
7.7%127,368137,227Housing loans
2.0%21,22221,642Households and Private banking
7.9%19,63221,175Small and micro businesses
6.4%6,7897,225Medium businesses
8.0%21,26022,961Large businesses, Institutional
investors and Overseas operations
7.1%196,271210,230Total
10
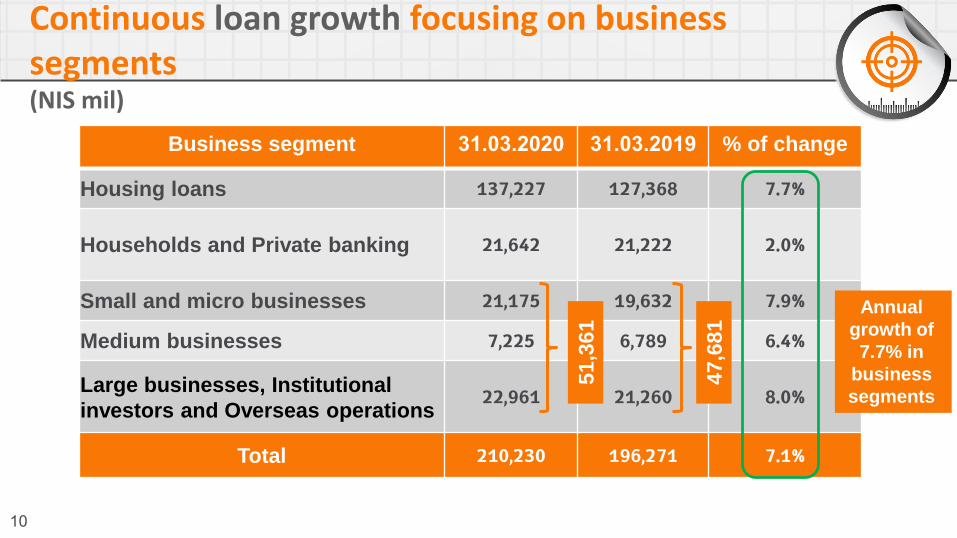
Continuous loan growth focusing on business segments(NIS mil)
% of change31.03.201931.03.2020Business segment
7.7%127,368137,227Housing loans
2.0%21,22221,642Households and Private banking
7.9%19,63221,175Small and micro businesses
6.4%6,7897,225Medium businesses
8.0%21,26022,961Large businesses, Institutional
investors and Overseas operations
7.1%196,271210,230Total
Annual
growth of
7.7% in
business
segments
51
,36
1
47
,68
1
11
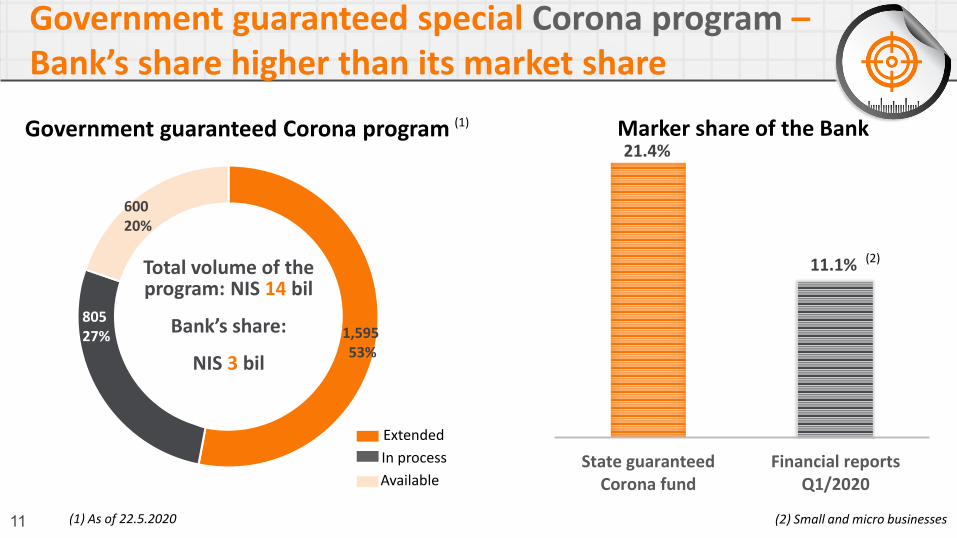
Government guaranteed special Corona program –Bank’s share higher than its market share
1,59553%
80527%
60020%
Total volume of the program: NIS 14 bil
Bank’s share:
NIS 3 bil
(1) As of 22.5.2020
Government guaranteed Corona program Marker share of the Bank21.4%
11.1%
State guaranteedCorona fund
Financial reportsQ1/2020
(1)
Extended
In process
Available
(2)
(2) Small and micro businesses
12
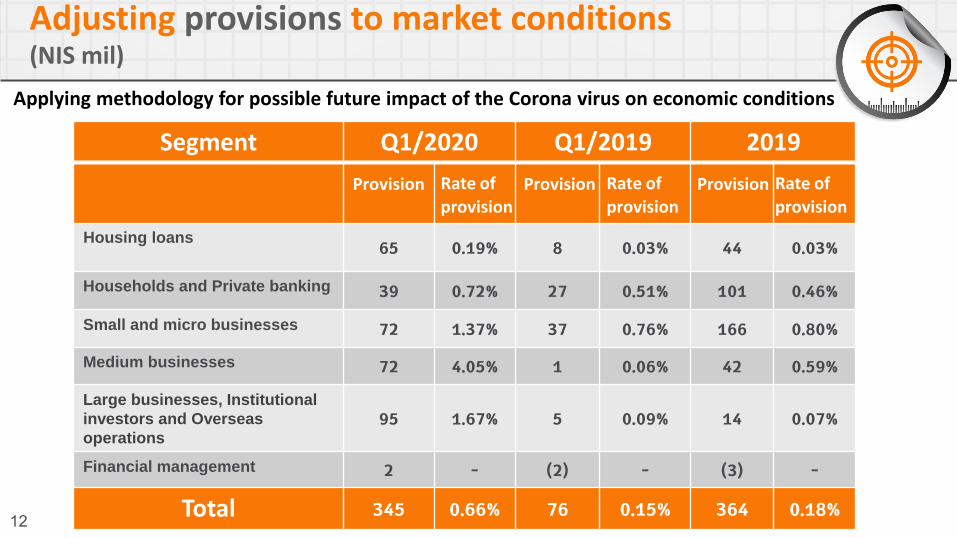
Adjusting provisions to market conditions(NIS mil)
Segment Q1/2020 Q1/2019 2019
Housing loans 65 0.19% 8 0.03% 44 0.03%
Households and Private banking 39 0.72% 27 0.51% 101 0.46%
Small and micro businesses 72 1.37% 37 0.76% 166 0.80%
Medium businesses 72 4.05% 1 0.06% 42 0.59%
Large businesses, Institutional
investors and Overseas
operations
95 1.67% 5 0.09% 14 0.07%
Financial management 2 - (2) - (3) -
Total 345 0.66% 76 0.15% 364 0.18%
Applying methodology for possible future impact of the Corona virus on economic conditions
Provision ProvisionProvisionRate of
provision
Rate of
provision
Rate of
provision
13
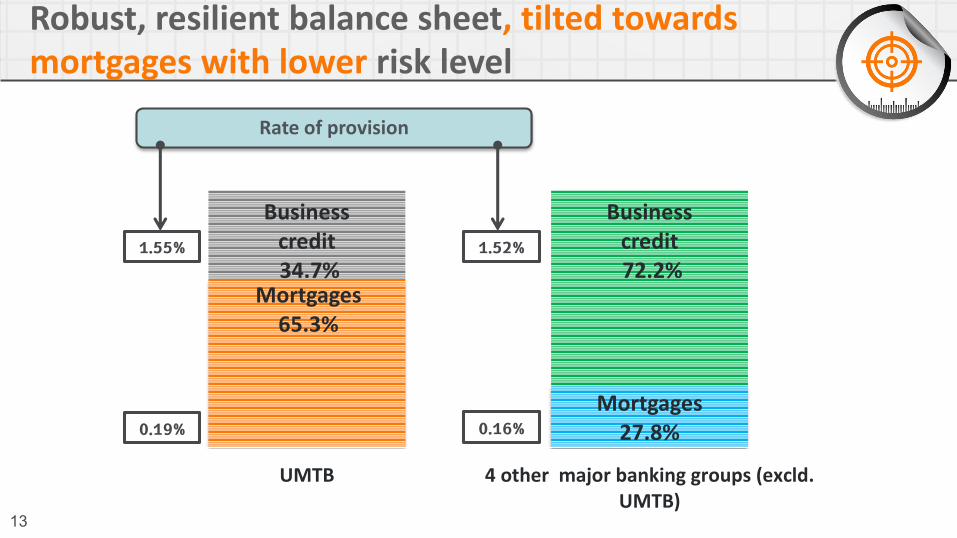
Robust, resilient balance sheet, tilted towards mortgages with lower risk level
Provision ProvisionProvisionRate of
provision
Rate of
provision
Rate of
provision
Mortgages 65.3%
Mortgages 27.8%
Business credit34.7%
Business credit72.2%
UMTB 4 other major banking groups (excld.UMTB)
0.19%
1.55%
0.16%
1.52%
Rate of provision
14
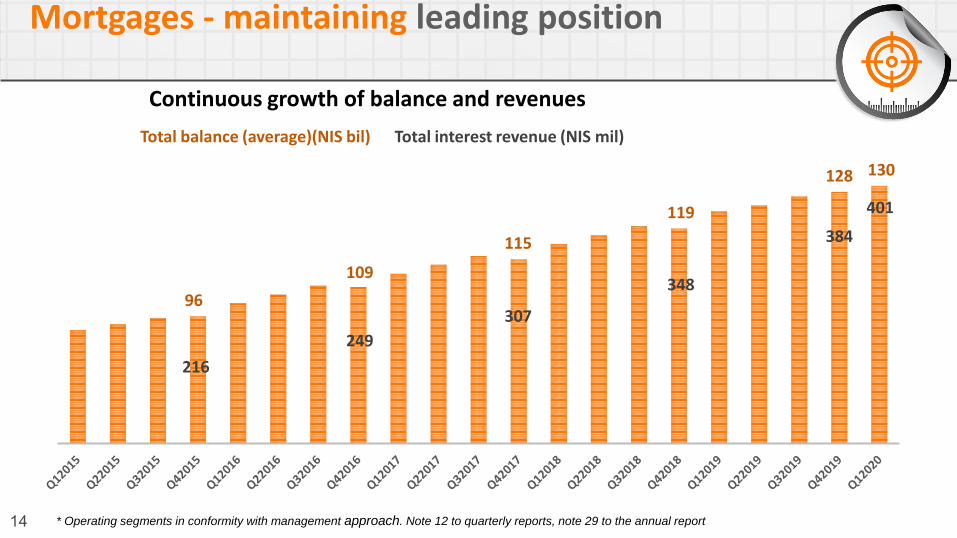
Mortgages - maintaining leading position
Total balance (average)(NIS bil) Total interest revenue (NIS mil)
109
115
119
128
96
249
307
348
384
216
* Operating segments in conformity with management approach. Note 12 to quarterly reports, note 29 to the annual report
130
401
Continuous growth of balance and revenues
15
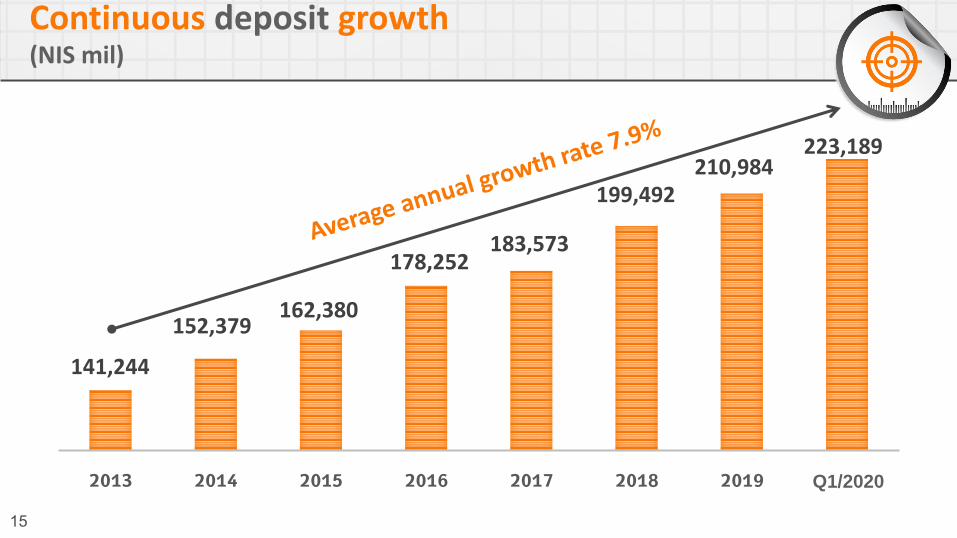
Continuous deposit growth(NIS mil)
141,244
152,379162,380
178,252183,573
199,492210,984
223,189
2013 2014 2015 2016 2017 2018 2019 1Q2020Q1/2020
16
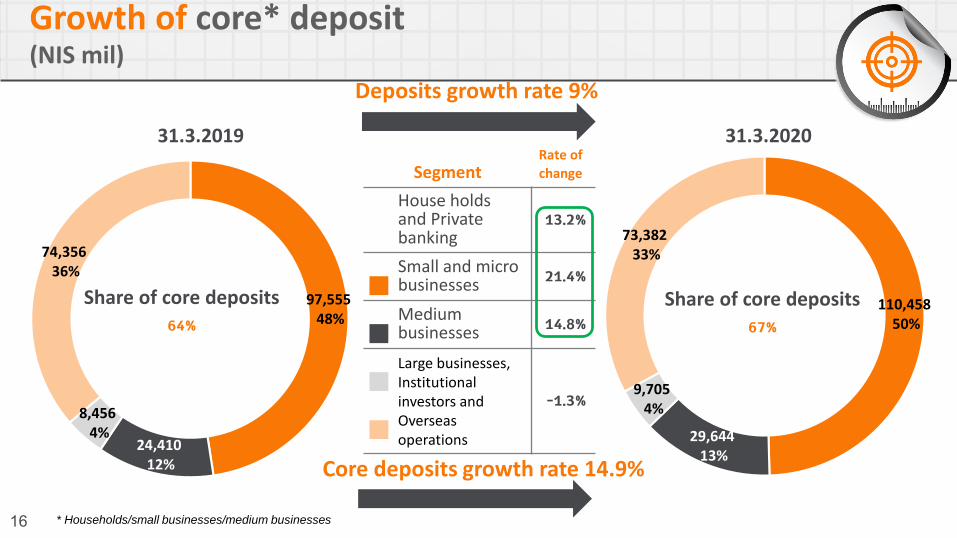
Growth of core* deposit (NIS mil)
* Households/small businesses/medium businesses
97,55548%
24,41012%
8,4564%
74,35636%
Share of core deposits
64%
31.3.2019
110,45850%
29,64413%
9,7054%
73,38233%
31.3.2020
Share of core deposits
67%
SegmentRate of
change
House holds and Private banking
13.2%
Small and micro businesses
21.4%
Medium businesses
14.8%
Large businesses, Institutionalinvestors and Overseas operations
1.3%-
Deposits growth rate 9%
Core deposits growth rate 14.9%
17
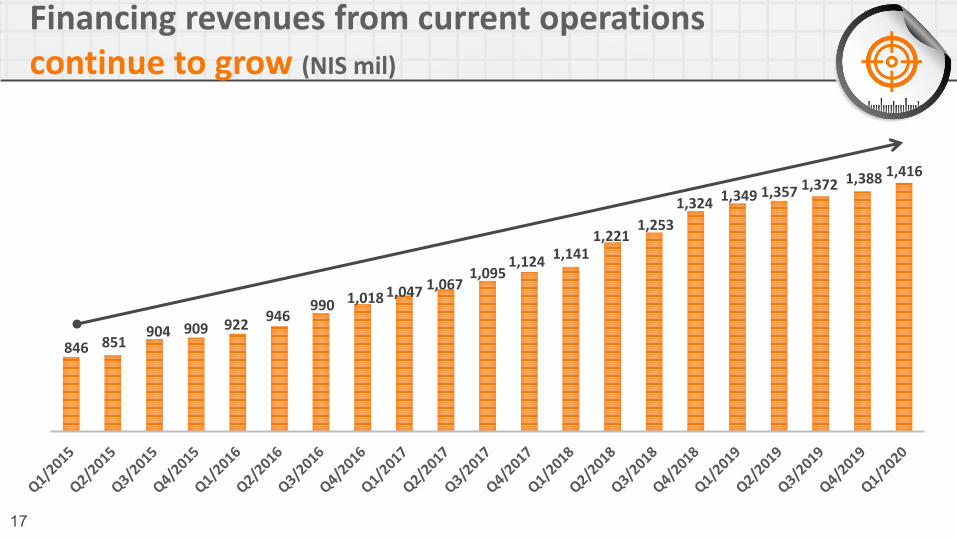
Financing revenues from current operationscontinue to grow (NIS mil)
846 851904 909 922
946990 1,018 1,047 1,067
1,0951,124 1,141
1,2211,253
1,324 1,349 1,357 1,372 1,388 1,416
18
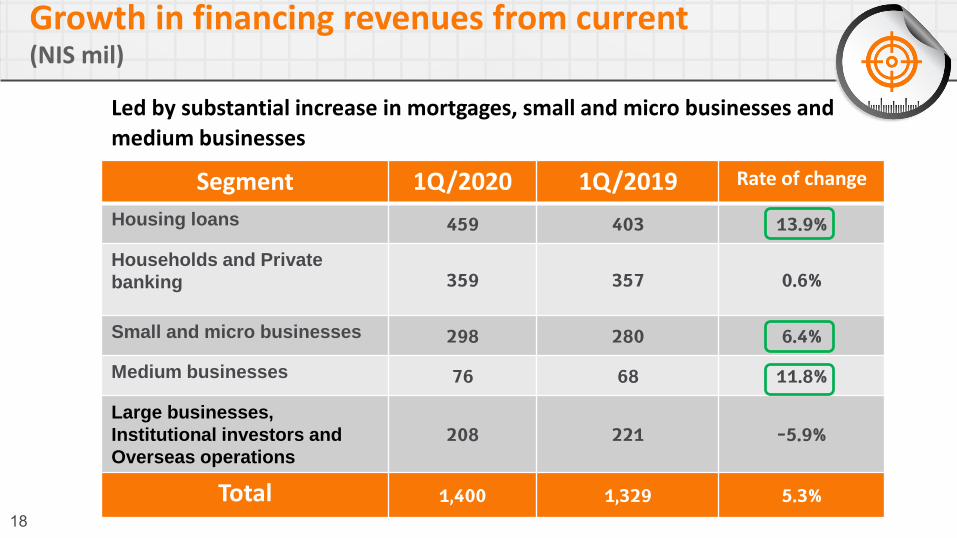
Growth in financing revenues from current (NIS mil)
Segment 1Q/2020 1Q/2019 Rate of change
Housing loans 459 403 13.9%
Households and Private
banking 359 357 0.6%
Small and micro businesses 298 280 6.4%
Medium businesses 76 68 11.8%
Large businesses,
Institutional investors and
Overseas operations
208 221 5.9%-
Total 1,400 1,329 5.3%
Led by substantial increase in mortgages, small and micro businesses and
medium businesses
19
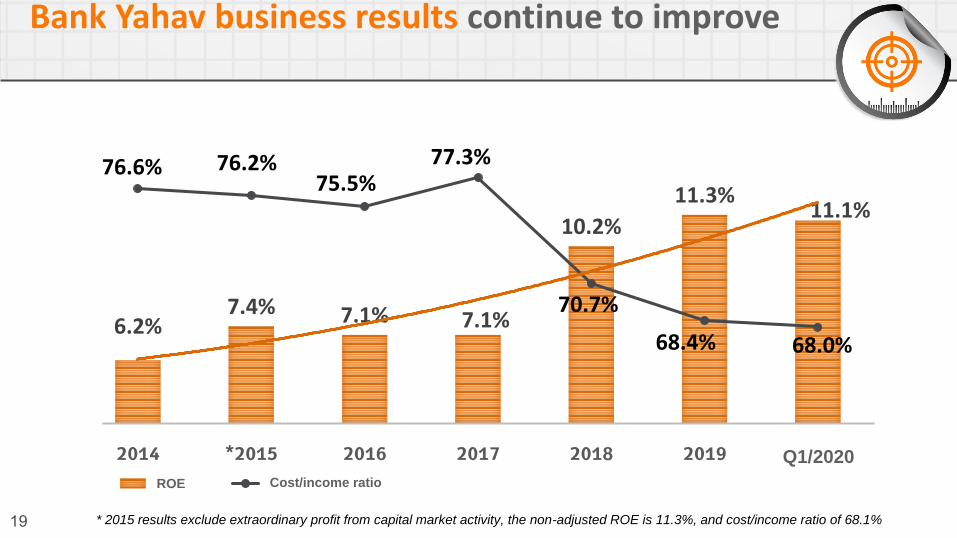
Bank Yahav business results continue to improve
6.2%7.4% 7.1% 7.1%
10.2%
11.3%11.1%
76.6% 76.2%75.5%
77.3%
70.7%
68.4% 68.0%
4%
5%
6%
7%
8%
9%
10%
11%
12%
13%
62%
64%
66%
68%
70%
72%
74%
76%
78%
2014 2015* 2016 2017 2018 2019 1Q2020תשואה להון יחס יעילות
Q1/2020
* 2015 results exclude extraordinary profit from capital market activity, the non-adjusted ROE is 11.3%, and cost/income ratio of 68.1%
ROE Cost/income ratio
20
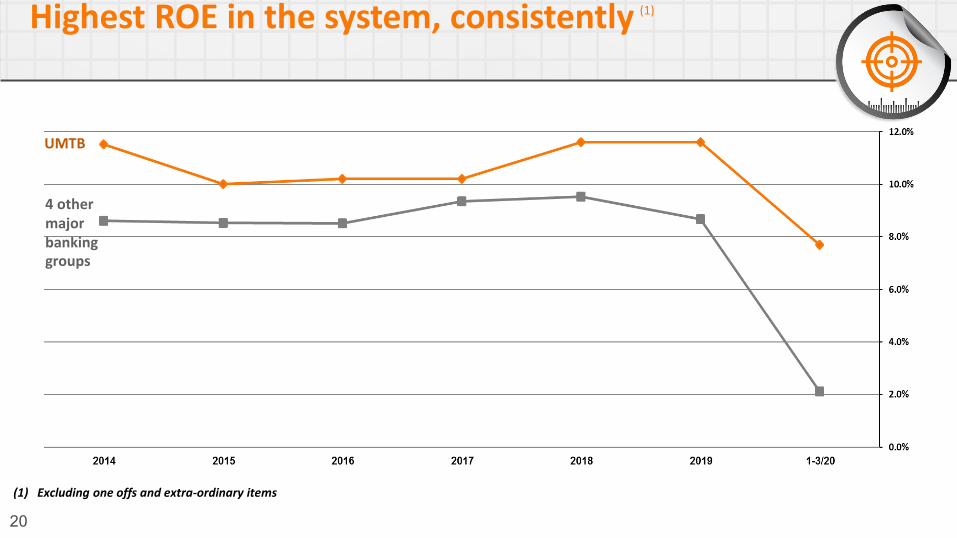
Highest ROE in the system, consistently
(1) Excluding one offs and extra-ordinary items
UMTB
4 other major banking groups
(1)
21
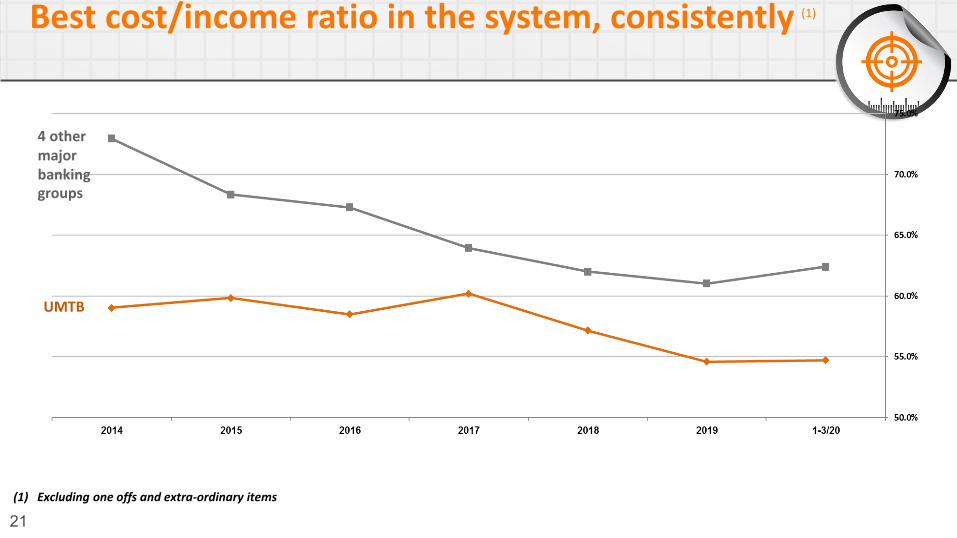
Best cost/income ratio in the system, consistently
UMTB
4 other major banking groups
(1) Excluding one offs and extra-ordinary items
(1)

2019יולי
Financial Statements22
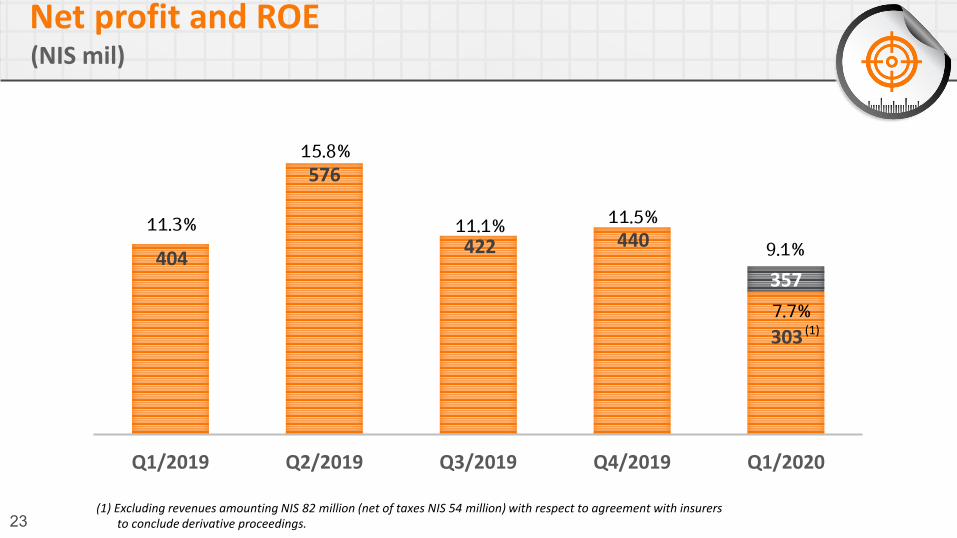
404
576
422 440
303
357
Q1/2019 Q2/2019 Q3/2019 Q4/2019 Q1/2020
23
(NIS mil)
(1)
(1) Excluding revenues amounting NIS 82 million (net of taxes NIS 54 million) with respect to agreement with insurersto conclude derivative proceedings.
11.3%
15.8%
11.1% 11.5%9.1%
7.7%
Net profit and ROE
24
(NIS mil)
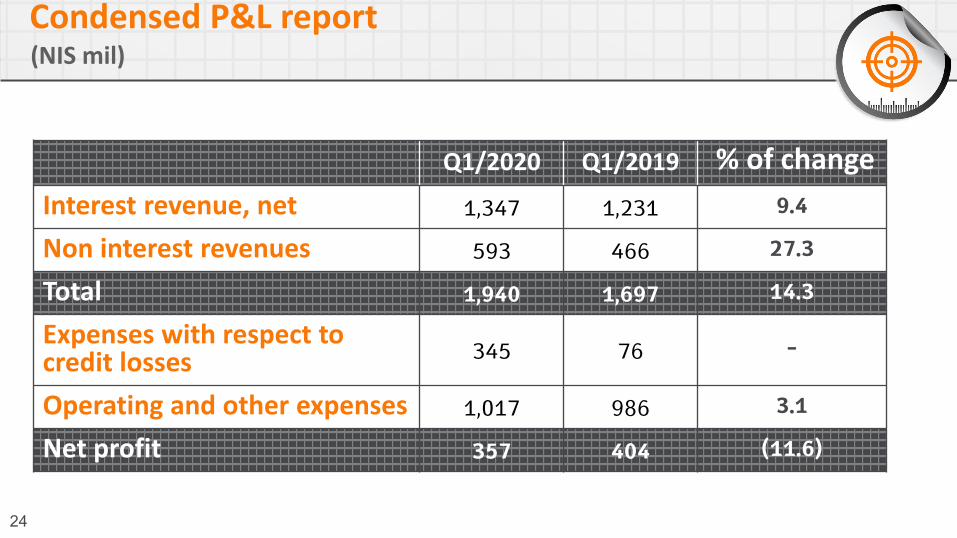
% of changeQ1/2019Q1/2020
9.41,2311,347Interest revenue, net
27.3466593Non interest revenues
14.31,6971,940Total
-76345Expenses with respect tocredit losses
3.19861,017Operating and other expenses
(11.6)404357Net profit
Condensed P&L report
25
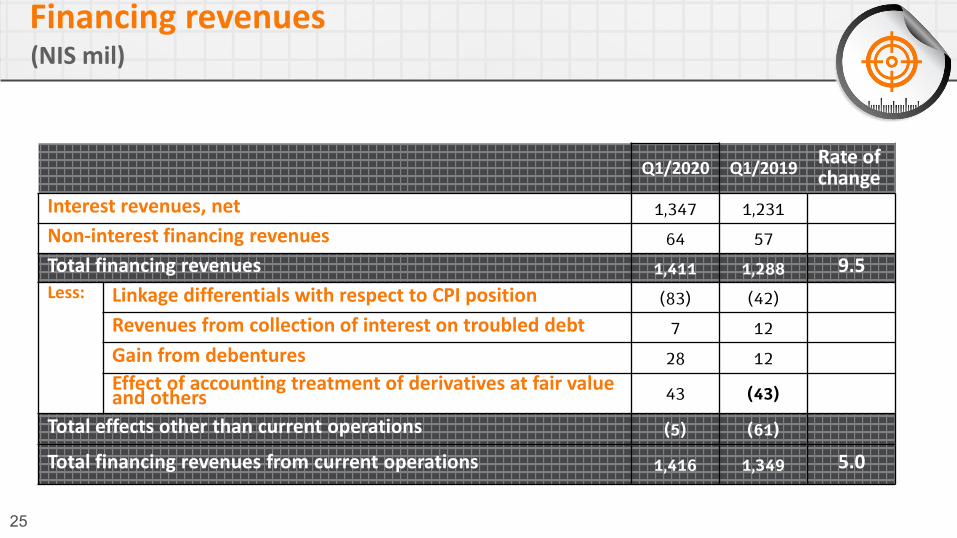
(NIS mil)
Rate of changeQ1/2019Q1/2020
1,2311,347Interest revenues, net
5764Non-interest financing revenues
9.51,2881,411Total financing revenues
(42)(83)Linkage differentials with respect to CPI positionLess:
127Revenues from collection of interest on troubled debt
1228Gain from debentures
(43)43Effect of accounting treatment of derivatives at fair valueand others
(61)(5)Total effects other than current operations
5.01,3491,416Total financing revenues from current operations
Financing revenues
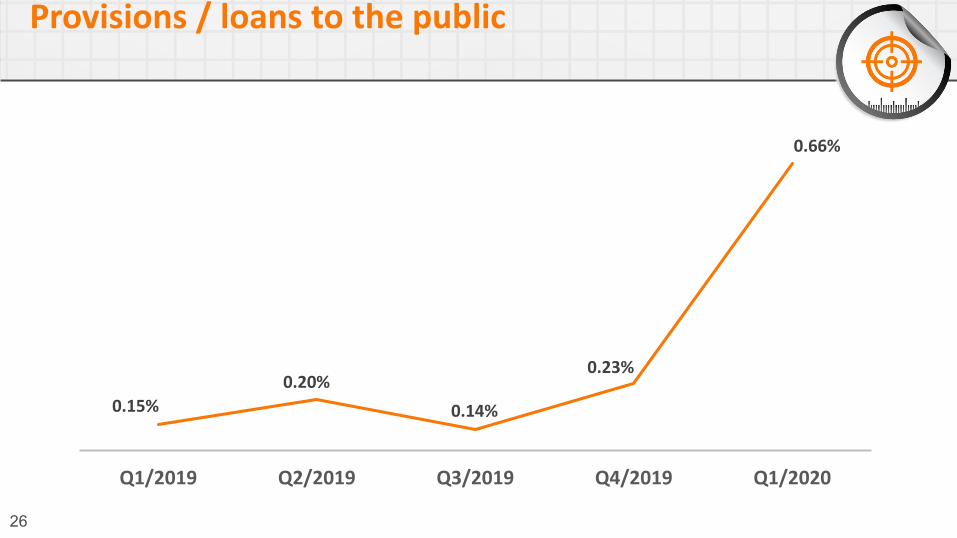
26
0.15%
0.20%
0.14%
0.23%
0.66%
Q1/2019 Q2/2019 Q3/2019 Q4/2019 Q1/2020
Provisions / loans to the public
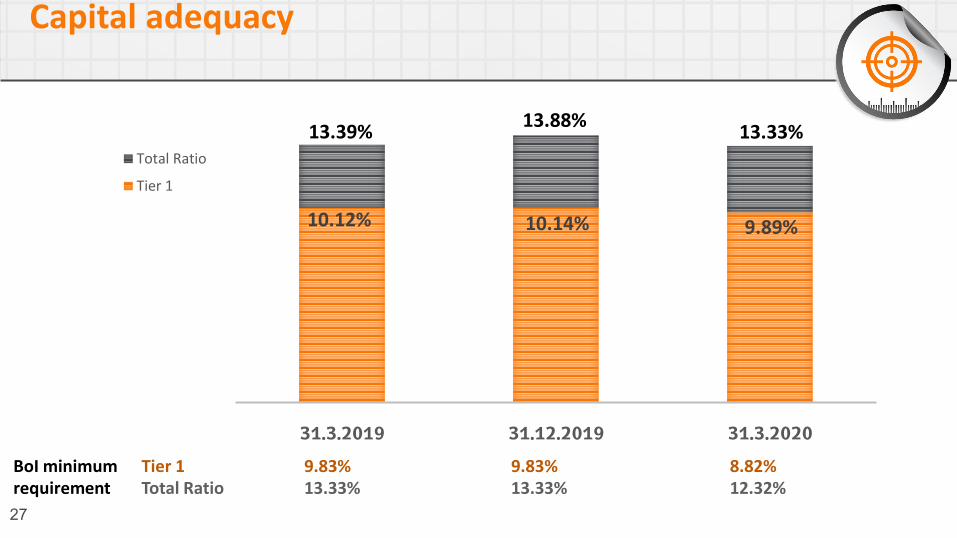
27
10.12% 10.14% 9.89%
13.39%13.88%
13.33%
31.3.2019 31.12.2019 31.3.2020
Total Ratio
Tier 1
Capital adequacy
BoI minimum requirement
Tier 1Total Ratio
9.83%13.33%
9.83%13.33%
8.82%12.32%
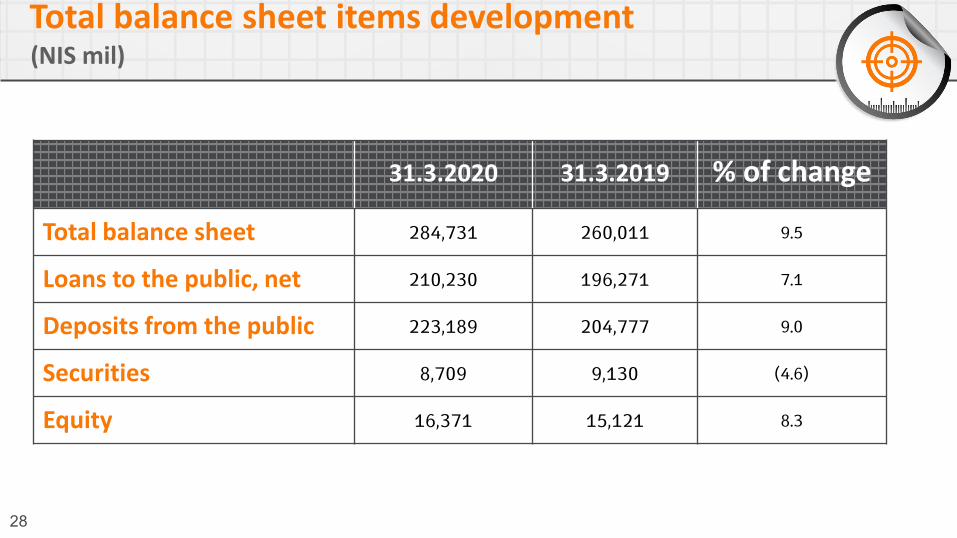
28
(NIS mil)
% of change31.3.201931.3.2020
9.5260,011284,731Total balance sheet
7.1196,271210,230Loans to the public, net
9.0204,777223,189Deposits from the public
(4.6)9,1308,709Securities
8.315,12116,371Equity
Total balance sheet items development
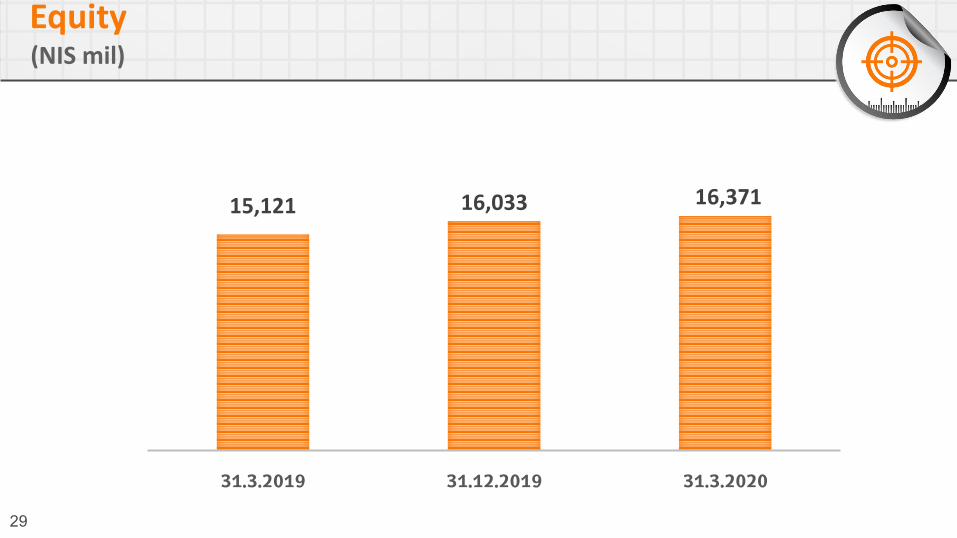
15,121 16,033 16,371
31.3.2019 31.12.2019 31.3.2020
29
(NIS mil)
Equity