Embed Size (px)
Citation preview

Topic Situation/ Performance
Observations Adjustments Needed
Items for Discussion:
Program Review During the February 25th meeting, Capital Cities presented a review of the Program.
See Program Review Presentation dated February, 2015.
As a result of the Program Review findings, the following items have been addressed:
The Program has moved to the least expensive share class of each investment option offered.The Small Cap Growth Fund is slated to be replaced by the Discovery Growth Fund.The Investment Policy Statement has been finalized and executed.Capital Cities has prepared a draft Program Overview piece that could be used by the SIC.Capital Cities, RI Treasury Staff, and AB have collectively worked to remove misclassified funds with Savingforcollege.com.Capital Cities and RI Treasury Staff have started fee discussions with AB regarding the Education Strategies’ stated fees (per contract terms).Capital Cities has distributed a draft Program Manager RFP to the RI Treasury Staff.
None.
Period Ended March 31, 2015Considerations and Observations
CollegeBoundfundfund

Performance & Evaluation Report
Prepared For:
CollegeBoundfund
Contents:
● Education Strategies Portfolios’ Performance
●● Individual Funds’ Performance
●●● Appendix
For Period Ended March 31, 2015
0.95%
-0.72%
3.84% 3.95%5.17%
4.32%
1.98%
6.63%
4.88%
2.28%
12.73%
9.33%
16.09%
13.68%
10.07%
8.21%
4.43%
12.06%
-0.92%
0.79%
-5.0%
0.0%
5.0%
10.0%
15.0%
20.0%
Large CapCore
Large CapValue
Large CapGrowth Mid Cap Core
SMID CapCore
Small CapCore
Small CapValue
Small CapGrowth Developed Intl
EmergingMarkets
Retu
rns
0.52%1.45% 1.61% 1.64% 2.16%
1.06% 1.01% 1.42%2.52%
-4.36%
2.01% 2.33%1.00%
3.58%
5.72%5.36%
6.74%
5.53%6.62%
3.11%2.00%
-9.82%
5.65%
3.08%
-12.5%
-10.0%
-7.5%
-5.0%
-2.5%
0.0%
2.5%
5.0%
7.5%
10.0%
Defensive Intermediate Aggregate Treasury Credit Mortgages Municipals TIPS High Yield Non-Dollar EmergingMkt Debt
LeveragedLoans
Retu
rns
Last Quarter Last One Yr Ended 03/31/15
PERIOD ENDED MARCH 31, 2015MARKET OVERVIEW
1
Style Index Style IndexLarge Cap Core S&P 500 Index Defensive Fixed Income ML 1-3 Year TreasuryLarge Cap Value Russell 1000 Value Intermediate Fixed Income Barclays Intermediate Gov/CrLarge Cap Growth Russell 1000 Growth Core Fixed Income Barclays Aggregate IndexMid Cap Core Russell Mid Cap Index Treasury Sector Barclays Treasury IndexSMID Cap Core Russell 2500 Index Credit Sector Barclays Credit IndexSmall Cap Core Russell 2000 Index Mortgage Sector Barclays Mortgage IndexSmall Cap Value Russell 2000 Value Municipal Fixed Income Barclays Muni Fixed IncomeSmall Cap Growth Russell 2000 Growth Treasury Infl Protected Sec Barclays TIPS IndexDeveloped International MSCI EAFE US$ High Yield Fixed Income Barclays High Yield IndexEmerging Markets MSCI Emerging Markets Non-Dollar Fixed Income Citi World Gov Bd Idx Non US
Emerging Market Debt JPM Emerging Mkts Bd GlLeveraged Loans S&P/LSTA Leveraged Loans
EQ
UIT
YFI
XE
D IN
CO
ME
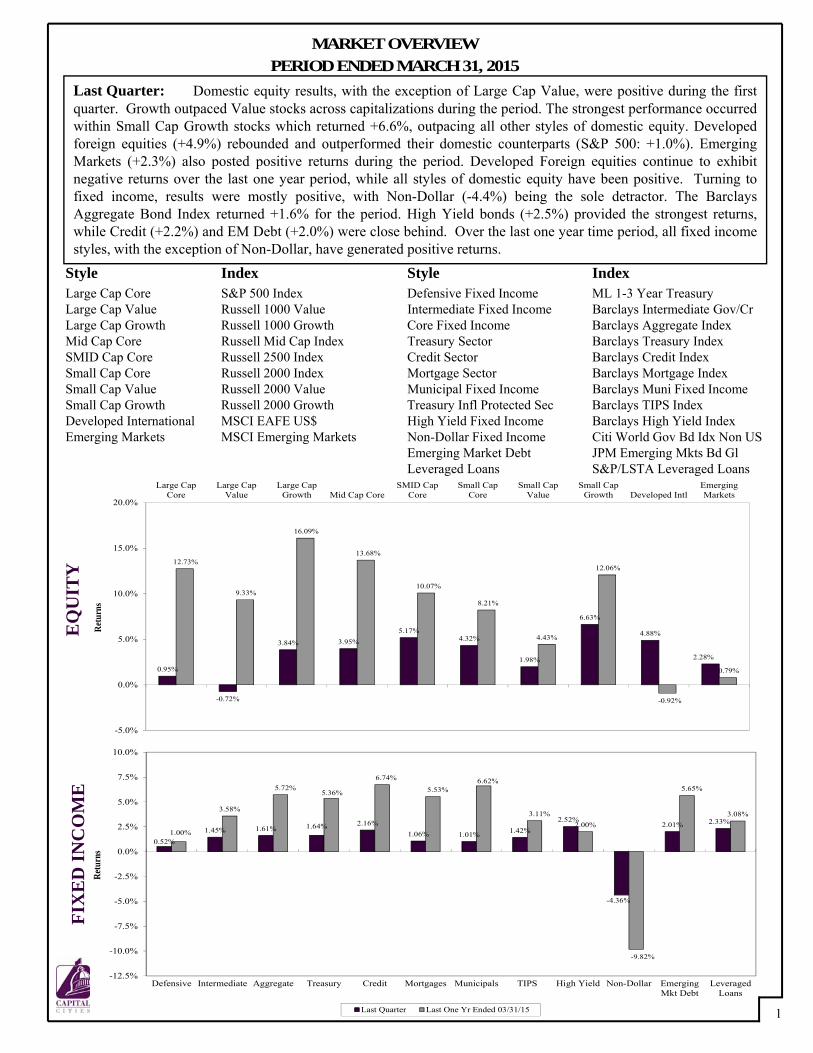
Last Quarter: Domestic equity results, with the exception of Large Cap Value, were positive during the firstquarter. Growth outpaced Value stocks across capitalizations during the period. The strongest performance occurredwithin Small Cap Growth stocks which returned +6.6%, outpacing all other styles of domestic equity. Developedforeign equities (+4.9%) rebounded and outperformed their domestic counterparts (S&P 500: +1.0%). EmergingMarkets (+2.3%) also posted positive returns during the period. Developed Foreign equities continue to exhibitnegative returns over the last one year period, while all styles of domestic equity have been positive. Turning tofixed income, results were mostly positive, with Non-Dollar (-4.4%) being the sole detractor. The BarclaysAggregate Bond Index returned +1.6% for the period. High Yield bonds (+2.5%) provided the strongest returns,while Credit (+2.2%) and EM Debt (+2.0%) were close behind. Over the last one year time period, all fixed incomestyles, with the exception of Non-Dollar, have generated positive returns.
2
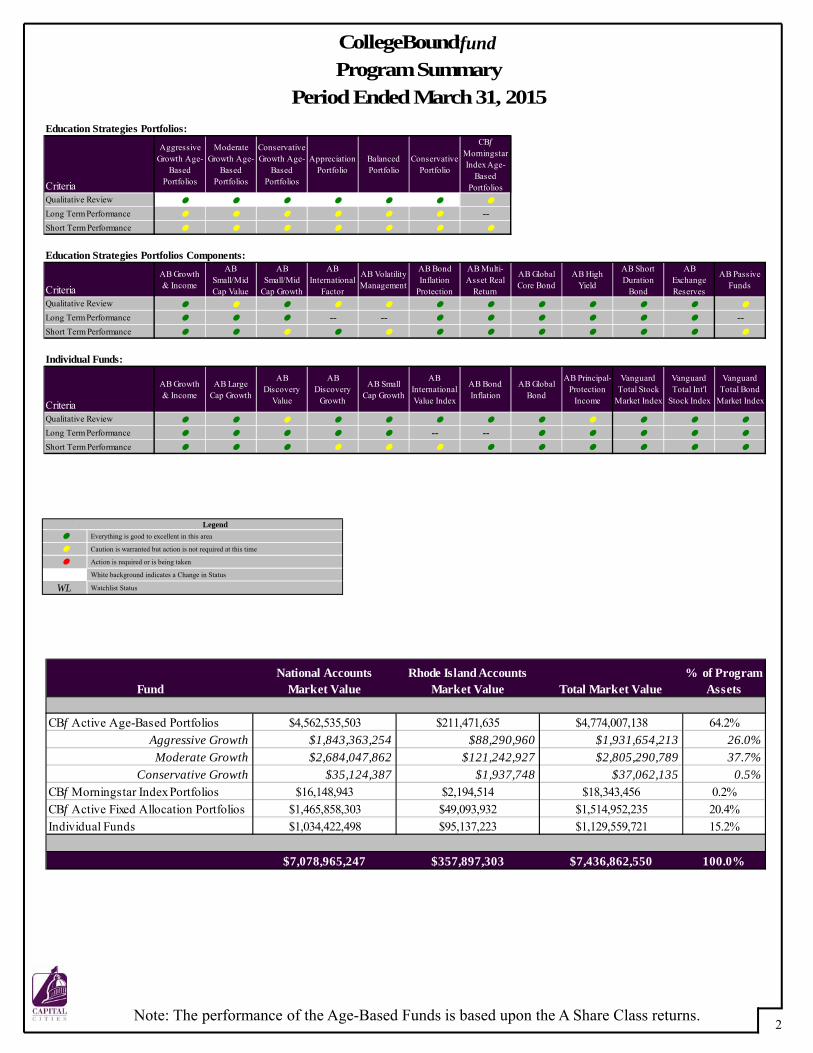
Ranking LegendEverything is good to excellent in this area
Caution is warranted but action is not required at this time
Action is required or is being taken
White background indicates a Change in Status
WL Watchlist Status
Period Ended March 31, 2015Program SummaryCollegeBoundfundfund
Education Strategies Portfolios:
Criteria
Aggressive Growth Age-
Based Portfolios
Moderate Growth Age-
Based Portfolios
Conservative Growth Age-
Based Portfolios
Appreciation Portfolio
Balanced Portfolio
Conservative Portfolio
CBf Morningstar Index Age-
Based Portfolios
Qualitative Review Long Term Performance -- Short Term Performance
Education Strategies Portfolios Components:
CriteriaAB Growth & Income
AB Small/Mid Cap Value
AB Small/Mid
Cap Growth
AB International
Factor
AB Volatility Management
AB Bond Inflation
Protection
AB Multi-Asset Real
Return
AB Global Core Bond
AB High Yield
AB Short Duration
Bond
AB Exchange Reserves
AB Passive Funds
Qualitative Review Long Term Performance -- -- -- Short Term Performance
Individual Funds:
Criteria
AB Growth & Income
AB Large Cap Growth
AB Discovery
Value
AB Discovery
Growth
AB Small Cap Growth
AB International Value Index
AB Bond Inflation
AB Global Bond
AB Principal-Protection
Income
Vanguard Total Stock
Market Index
Vanguard Total Int'l
Stock Index
Vanguard Total Bond
Market Index
Qualitative Review Long Term Performance -- -- Short Term Performance
FundNational Accounts
Market ValueRhode Island Accounts
Market Value Total Market Value% of Program
Assets
CBf Active Age-Based Portfolios $4,562,535,503 $211,471,635 $4,774,007,138 64.2%Aggressive Growth $1,843,363,254 $88,290,960 $1,931,654,213 26.0%Moderate Growth $2,684,047,862 $121,242,927 $2,805,290,789 37.7%
Conservative Growth $35,124,387 $1,937,748 $37,062,135 0.5%CBf Morningstar Index Portfolios $16,148,943 $2,194,514 $18,343,456 0.2%CBf Active Fixed Allocation Portfolios $1,465,858,303 $49,093,932 $1,514,952,235 20.4%Individual Funds $1,034,422,498 $95,137,223 $1,129,559,721 15.2%
$7,078,965,247 $357,897,303 $7,436,862,550 100.0%
Note: The performance of the Age-Based Funds is based upon the A Share Class returns.
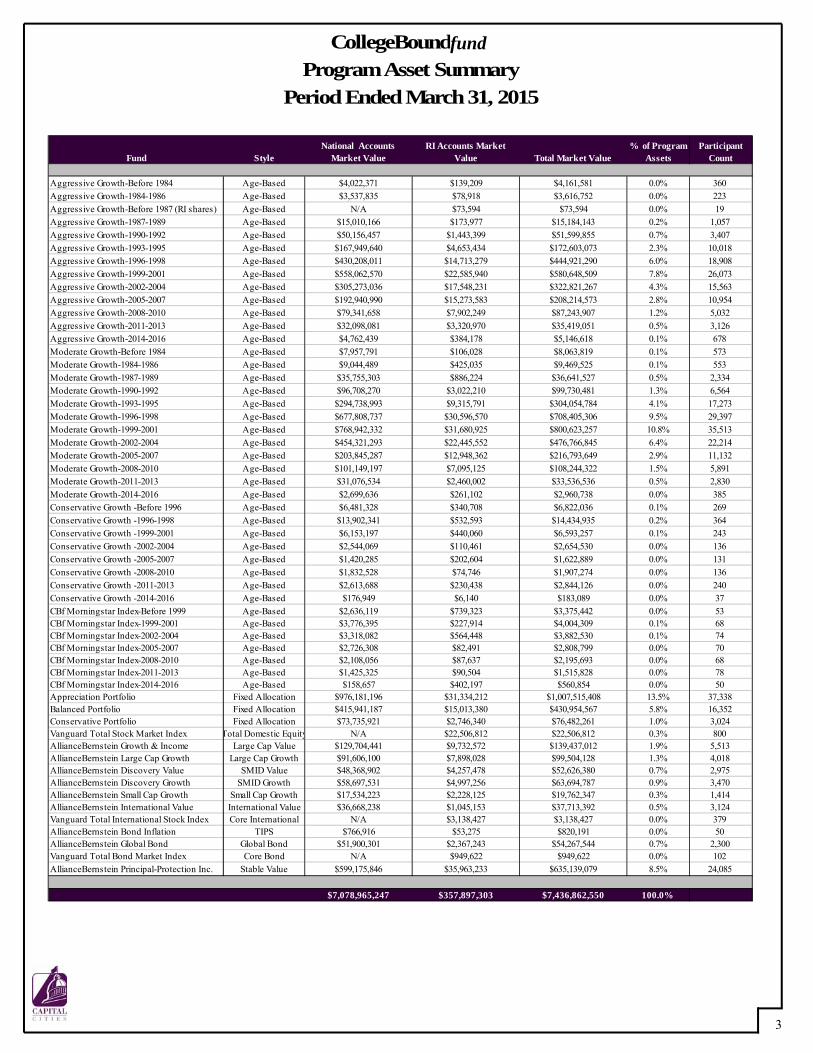
Period Ended March 31, 2015Program Asset Summary
CollegeBoundfund
3
fund
Fund StyleNational Accounts
Market ValueRI Accounts Market
Value Total Market Value% of Program
AssetsParticipant
Count
Aggressive Growth-Before 1984 Age-Based $4,022,371 $139,209 $4,161,581 0.0% 360Aggressive Growth-1984-1986 Age-Based $3,537,835 $78,918 $3,616,752 0.0% 223Aggressive Growth-Before 1987 (RI shares) Age-Based N/A $73,594 $73,594 0.0% 19Aggressive Growth-1987-1989 Age-Based $15,010,166 $173,977 $15,184,143 0.2% 1,057Aggressive Growth-1990-1992 Age-Based $50,156,457 $1,443,399 $51,599,855 0.7% 3,407Aggressive Growth-1993-1995 Age-Based $167,949,640 $4,653,434 $172,603,073 2.3% 10,018Aggressive Growth-1996-1998 Age-Based $430,208,011 $14,713,279 $444,921,290 6.0% 18,908Aggressive Growth-1999-2001 Age-Based $558,062,570 $22,585,940 $580,648,509 7.8% 26,073Aggressive Growth-2002-2004 Age-Based $305,273,036 $17,548,231 $322,821,267 4.3% 15,563Aggressive Growth-2005-2007 Age-Based $192,940,990 $15,273,583 $208,214,573 2.8% 10,954Aggressive Growth-2008-2010 Age-Based $79,341,658 $7,902,249 $87,243,907 1.2% 5,032Aggressive Growth-2011-2013 Age-Based $32,098,081 $3,320,970 $35,419,051 0.5% 3,126Aggressive Growth-2014-2016 Age-Based $4,762,439 $384,178 $5,146,618 0.1% 678Moderate Growth-Before 1984 Age-Based $7,957,791 $106,028 $8,063,819 0.1% 573Moderate Growth-1984-1986 Age-Based $9,044,489 $425,035 $9,469,525 0.1% 553Moderate Growth-1987-1989 Age-Based $35,755,303 $886,224 $36,641,527 0.5% 2,334Moderate Growth-1990-1992 Age-Based $96,708,270 $3,022,210 $99,730,481 1.3% 6,564Moderate Growth-1993-1995 Age-Based $294,738,993 $9,315,791 $304,054,784 4.1% 17,273Moderate Growth-1996-1998 Age-Based $677,808,737 $30,596,570 $708,405,306 9.5% 29,397Moderate Growth-1999-2001 Age-Based $768,942,332 $31,680,925 $800,623,257 10.8% 35,513Moderate Growth-2002-2004 Age-Based $454,321,293 $22,445,552 $476,766,845 6.4% 22,214Moderate Growth-2005-2007 Age-Based $203,845,287 $12,948,362 $216,793,649 2.9% 11,132Moderate Growth-2008-2010 Age-Based $101,149,197 $7,095,125 $108,244,322 1.5% 5,891Moderate Growth-2011-2013 Age-Based $31,076,534 $2,460,002 $33,536,536 0.5% 2,830Moderate Growth-2014-2016 Age-Based $2,699,636 $261,102 $2,960,738 0.0% 385Conservative Growth -Before 1996 Age-Based $6,481,328 $340,708 $6,822,036 0.1% 269Conservative Growth -1996-1998 Age-Based $13,902,341 $532,593 $14,434,935 0.2% 364Conservative Growth -1999-2001 Age-Based $6,153,197 $440,060 $6,593,257 0.1% 243Conservative Growth -2002-2004 Age-Based $2,544,069 $110,461 $2,654,530 0.0% 136Conservative Growth -2005-2007 Age-Based $1,420,285 $202,604 $1,622,889 0.0% 131Conservative Growth -2008-2010 Age-Based $1,832,528 $74,746 $1,907,274 0.0% 136Conservative Growth -2011-2013 Age-Based $2,613,688 $230,438 $2,844,126 0.0% 240Conservative Growth -2014-2016 Age-Based $176,949 $6,140 $183,089 0.0% 37CBf Morningstar Index-Before 1999 Age-Based $2,636,119 $739,323 $3,375,442 0.0% 53CBf Morningstar Index-1999-2001 Age-Based $3,776,395 $227,914 $4,004,309 0.1% 68CBf Morningstar Index-2002-2004 Age-Based $3,318,082 $564,448 $3,882,530 0.1% 74CBf Morningstar Index-2005-2007 Age-Based $2,726,308 $82,491 $2,808,799 0.0% 70CBf Morningstar Index-2008-2010 Age-Based $2,108,056 $87,637 $2,195,693 0.0% 68CBf Morningstar Index-2011-2013 Age-Based $1,425,325 $90,504 $1,515,828 0.0% 78CBf Morningstar Index-2014-2016 Age-Based $158,657 $402,197 $560,854 0.0% 50Appreciation Portfolio Fixed Allocation $976,181,196 $31,334,212 $1,007,515,408 13.5% 37,338Balanced Portfolio Fixed Allocation $415,941,187 $15,013,380 $430,954,567 5.8% 16,352Conservative Portfolio Fixed Allocation $73,735,921 $2,746,340 $76,482,261 1.0% 3,024Vanguard Total Stock Market Index Total Domestic Equity N/A $22,506,812 $22,506,812 0.3% 800AllianceBernstein Growth & Income Large Cap Value $129,704,441 $9,732,572 $139,437,012 1.9% 5,513AllianceBernstein Large Cap Growth Large Cap Growth $91,606,100 $7,898,028 $99,504,128 1.3% 4,018AllianceBernstein Discovery Value SMID Value $48,368,902 $4,257,478 $52,626,380 0.7% 2,975AllianceBernstein Discovery Growth SMID Growth $58,697,531 $4,997,256 $63,694,787 0.9% 3,470AllianceBernstein Small Cap Growth Small Cap Growth $17,534,223 $2,228,125 $19,762,347 0.3% 1,414AllianceBernstein International Value International Value $36,668,238 $1,045,153 $37,713,392 0.5% 3,124Vanguard Total International Stock Index Core International N/A $3,138,427 $3,138,427 0.0% 379AllianceBernstein Bond Inflation TIPS $766,916 $53,275 $820,191 0.0% 50AllianceBernstein Global Bond Global Bond $51,900,301 $2,367,243 $54,267,544 0.7% 2,300Vanguard Total Bond Market Index Core Bond N/A $949,622 $949,622 0.0% 102AllianceBernstein Principal-Protection Inc. Stable Value $599,175,846 $35,963,233 $635,139,079 8.5% 24,085
$7,078,965,247 $357,897,303 $7,436,862,550 100.0%
(4,970,172)
(992,695)
60,770
72,278
454,450
(633,477)
101,258
5,105,860
2,794,046
(1,379,143)
(5,170,520)
(24,579,451)
7,551,314
1,153,009
(43,095,809)
(20,857,712)
(60,000,000) (50,000,000) (40,000,000) (30,000,000) (20,000,000) (10,000,000) 0 10,000,000 20,000,000
1,766,150
960,267
10,144
890,282
964,276
3,131,523
1,398,866
5,016,316
850,513
855,124
8,743,466
19,751,231
170,841
447,689
38,146,975
28,912,552
0 5,000,000 10,000,000 15,000,000 20,000,000 25,000,000 30,000,000 35,000,000 40,000,000 45,000,000
4
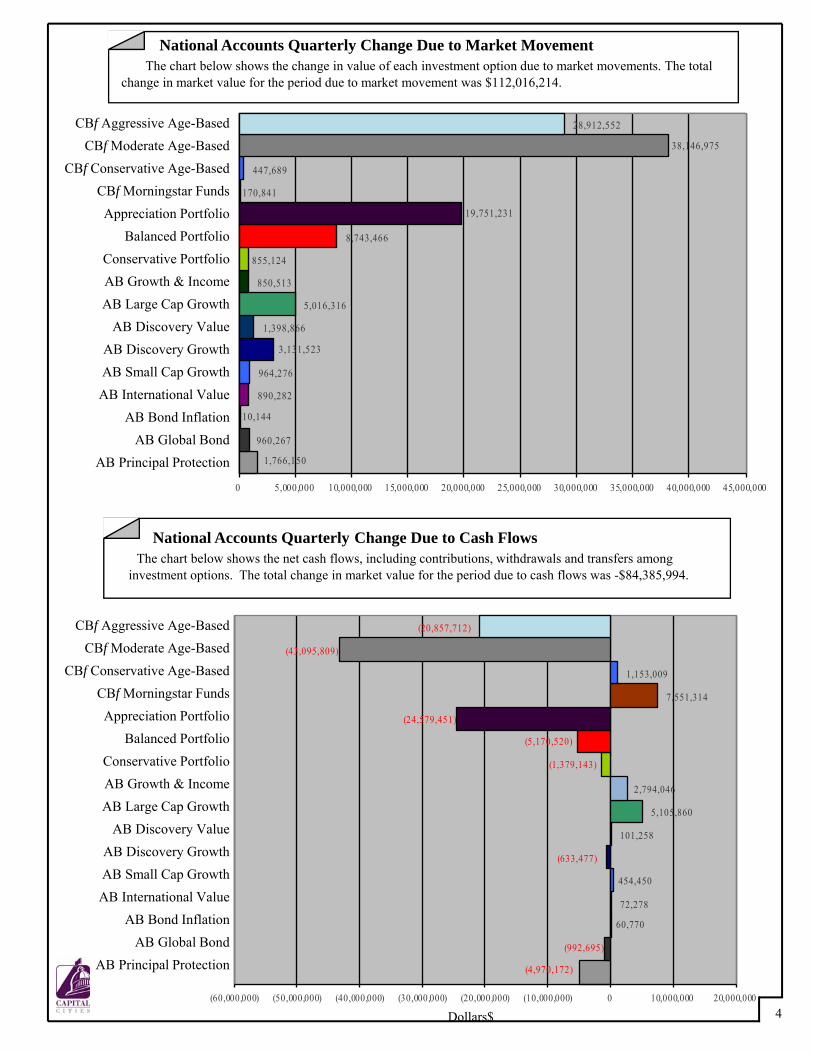
National Accounts Quarterly Change Due to Market MovementThe chart below shows the change in value of each investment option due to market movements. The total
change in market value for the period due to market movement was $112,016,214.
National Accounts Quarterly Change Due to Cash FlowsThe chart below shows the net cash flows, including contributions, withdrawals and transfers among
investment options. The total change in market value for the period due to cash flows was -$84,385,994.
Dollars$
CBf Aggressive Age-BasedCBf Moderate Age-Based
CBf Conservative Age-BasedCBf Morningstar FundsAppreciation Portfolio
Balanced PortfolioConservative PortfolioAB Growth & IncomeAB Large Cap Growth
AB Discovery ValueAB Discovery GrowthAB Small Cap GrowthAB International Value
AB Bond InflationAB Global Bond
AB Principal Protection
(489,076)
63,945
(27,577)20,521
184,373
(90,300)
(163,708)
(187)
(4,945)
200,545
(22,935)
881,850
(124,104)
(61,782)
(449,291)
1,098,859
83,246
(130,667)
514,258
(900,000) (600,000) (300,000) 0 300,000 600,000 900,000 1,200,000 1,500,000
199,396 15,008
41,127
526
119,876
28,754
126,992
279,489
131,683
447,607
78,436
411,601 37,640
244,000
712,381
162,054
33,375
2,052,296
1,669,037
0 500,000 1,000,000 1,500,000 2,000,000 2,500,000
5
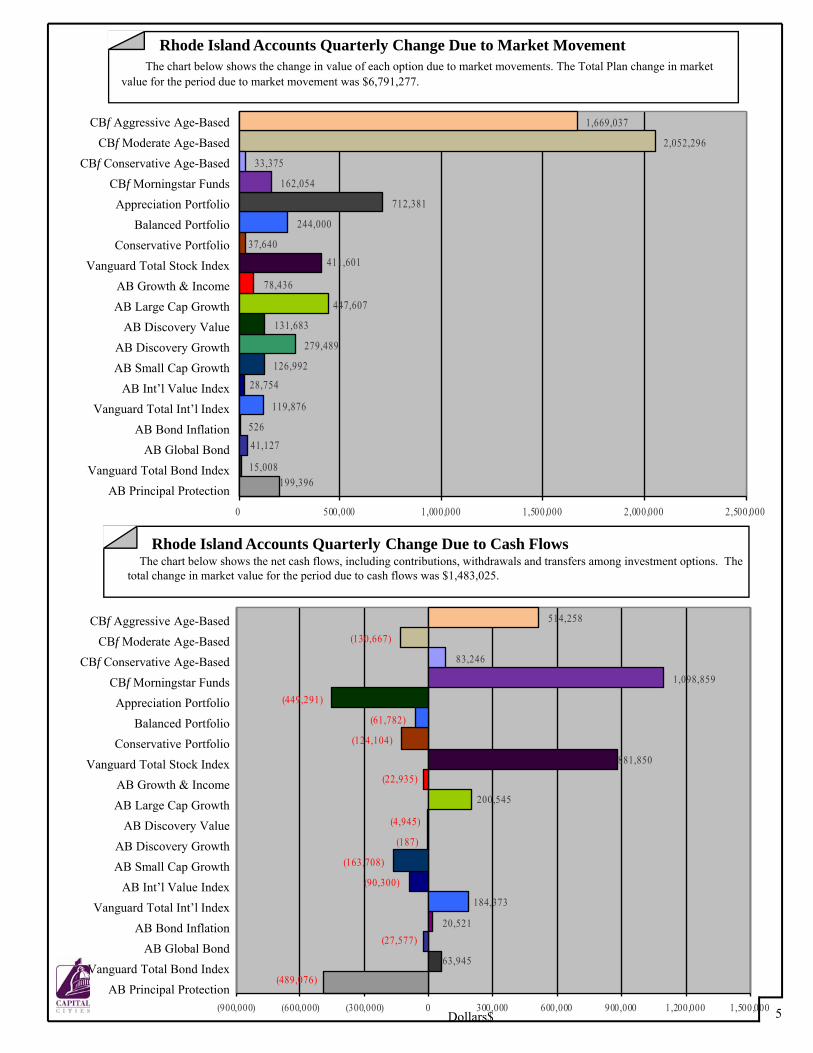
Rhode Island Accounts Quarterly Change Due to Market MovementThe chart below shows the change in value of each option due to market movements. The Total Plan change in market
value for the period due to market movement was $6,791,277.
Rhode Island Accounts Quarterly Change Due to Cash FlowsThe chart below shows the net cash flows, including contributions, withdrawals and transfers among investment options. The
total change in market value for the period due to cash flows was $1,483,025.
Dollars$
CBf Aggressive Age-BasedCBf Moderate Age-Based
CBf Conservative Age-BasedCBf Morningstar FundsAppreciation Portfolio
Balanced PortfolioConservative Portfolio
Vanguard Total Stock IndexAB Growth & IncomeAB Large Cap Growth
AB Discovery ValueAB Discovery GrowthAB Small Cap Growth
AB Int’l Value IndexVanguard Total Int’l Index
AB Bond InflationAB Global Bond
Vanguard Total Bond IndexAB Principal Protection
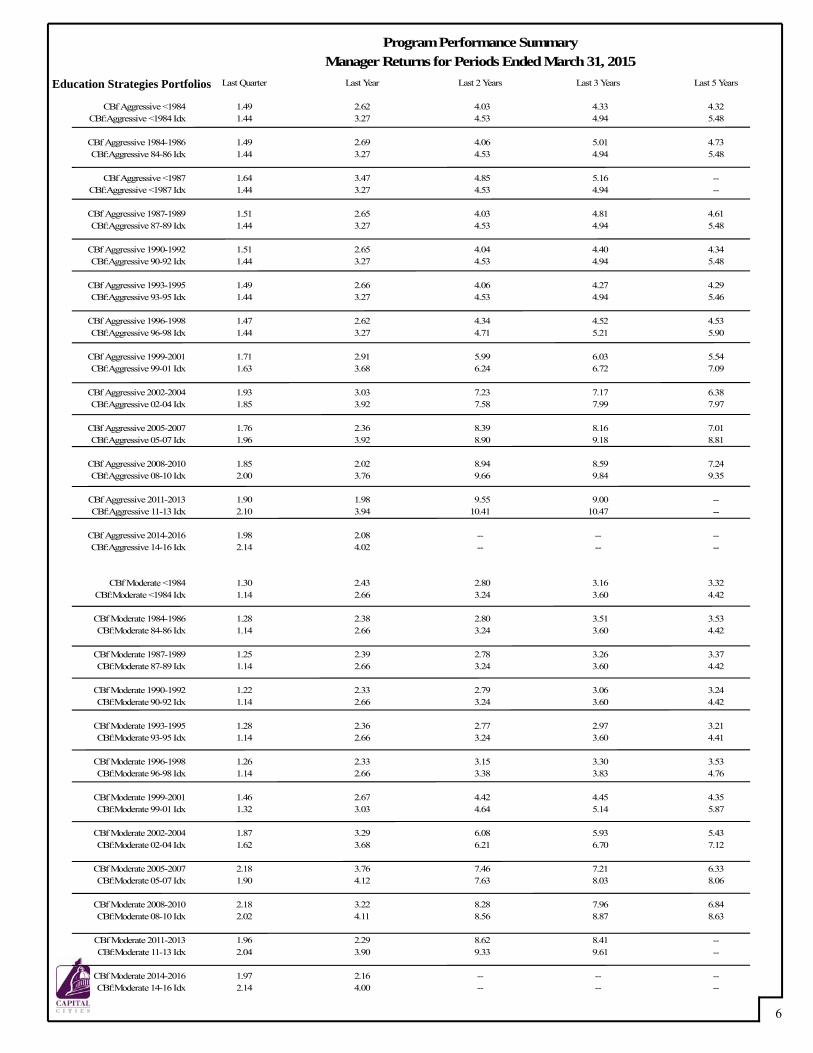
Manager Returns for Periods Ended March 31, 2015Program Performance Summary
Last Quarter Last Year Last 2 Years Last 3 Years Last 5 Years
CBf Aggressive <1984 1.49 2.62 4.03 4.33 4.32CBf:Aggressive <1984 Idx 1.44 3.27 4.53 4.94 5.48
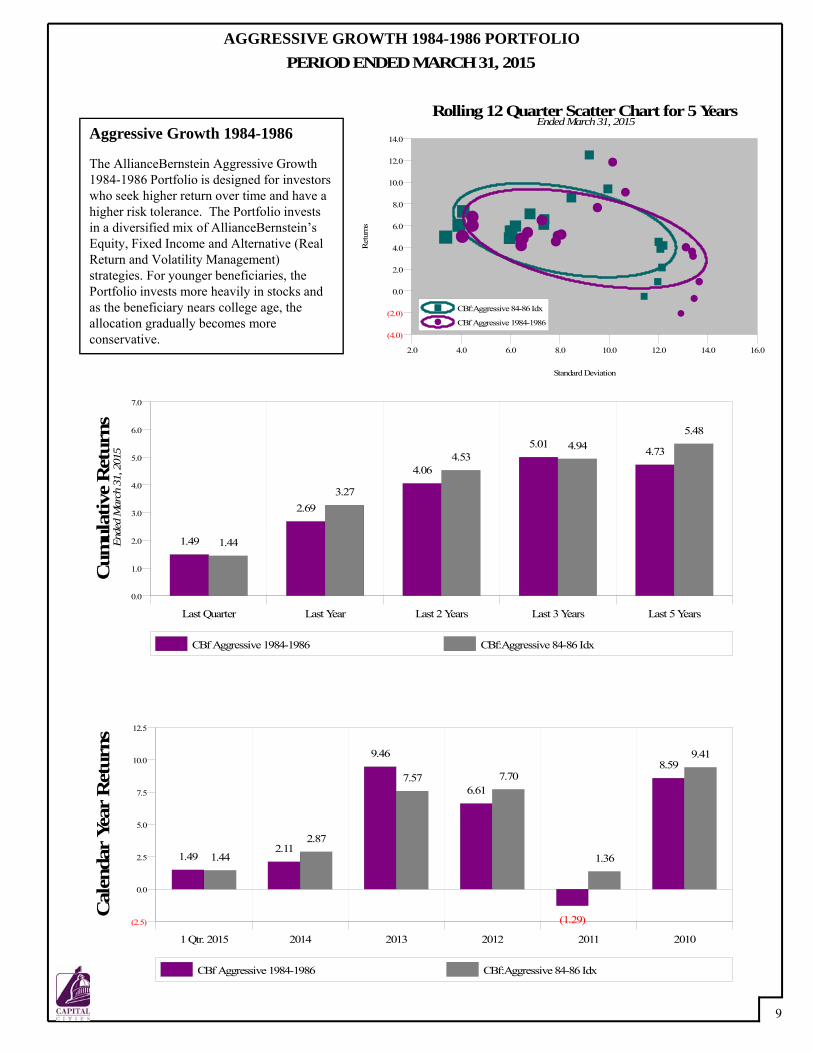
CBf Aggressive 1984-1986 1.49 2.69 4.06 5.01 4.73CBf:Aggressive 84-86 Idx 1.44 3.27 4.53 4.94 5.48
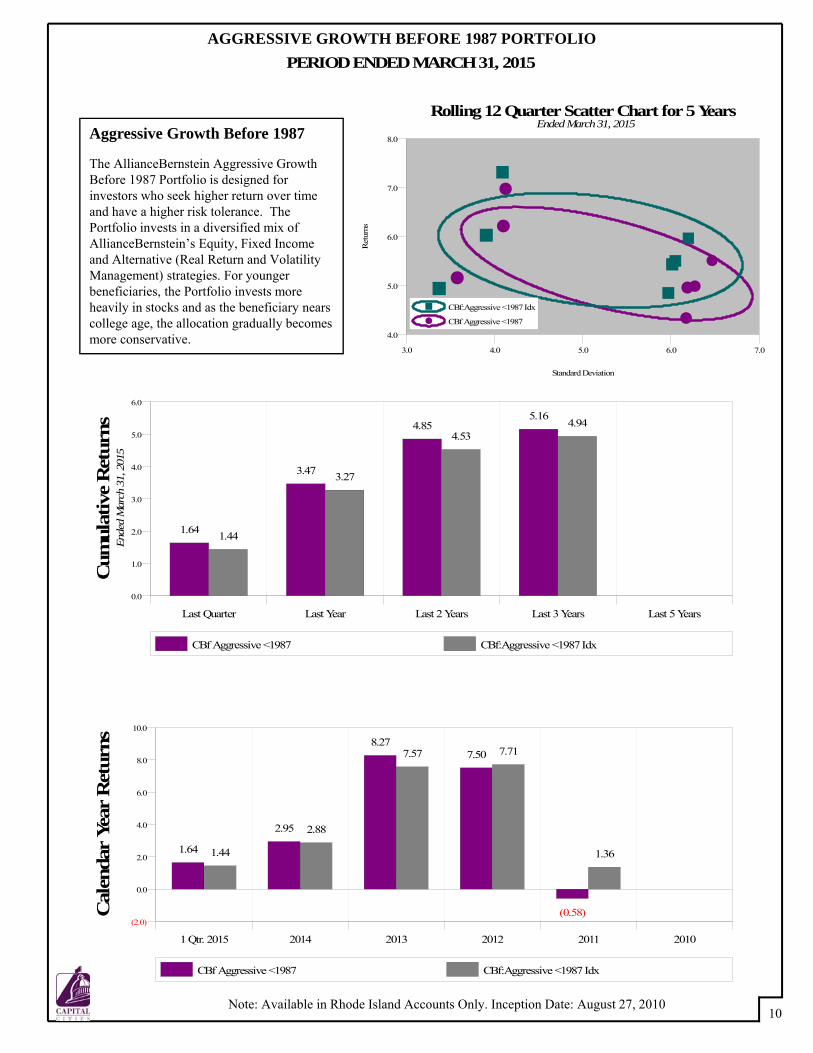
CBf Aggressive <1987 1.64 3.47 4.85 5.16 --CBf:Aggressive <1987 Idx 1.44 3.27 4.53 4.94 --
CBf Aggressive 1987-1989 1.51 2.65 4.03 4.81 4.61CBf:Aggressive 87-89 Idx 1.44 3.27 4.53 4.94 5.48
CBf Aggressive 1990-1992 1.51 2.65 4.04 4.40 4.34CBf:Aggressive 90-92 Idx 1.44 3.27 4.53 4.94 5.48
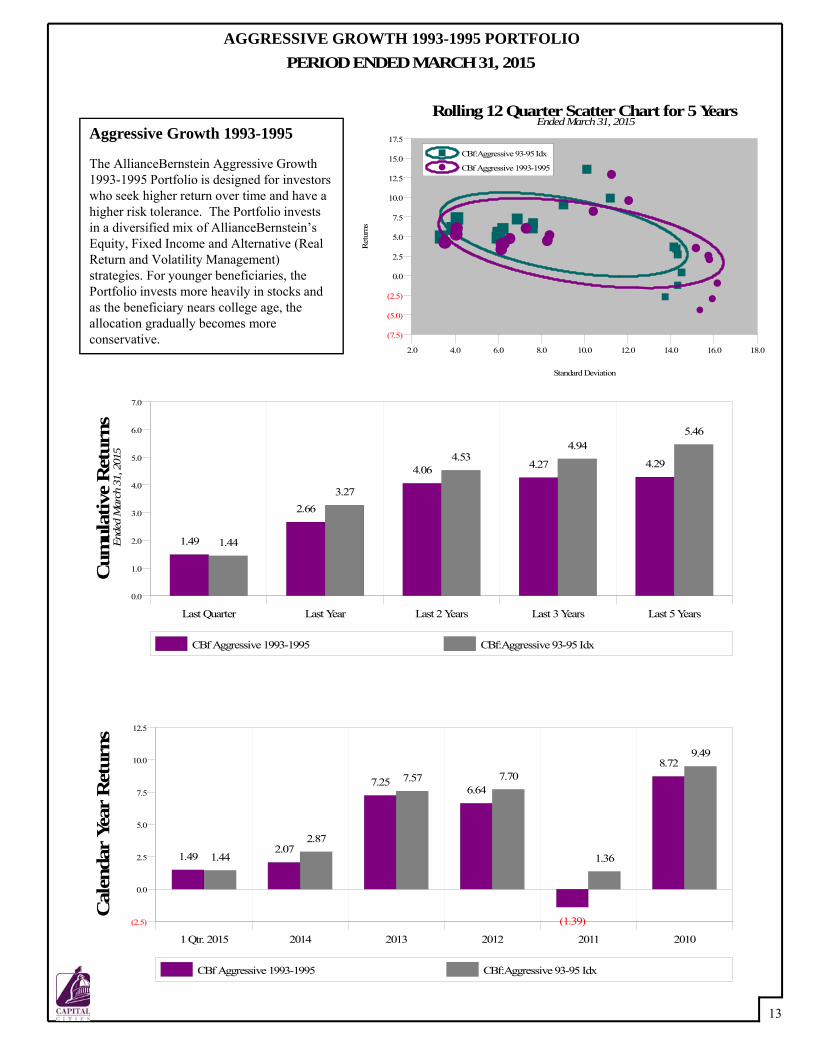
CBf Aggressive 1993-1995 1.49 2.66 4.06 4.27 4.29CBf:Aggressive 93-95 Idx 1.44 3.27 4.53 4.94 5.46
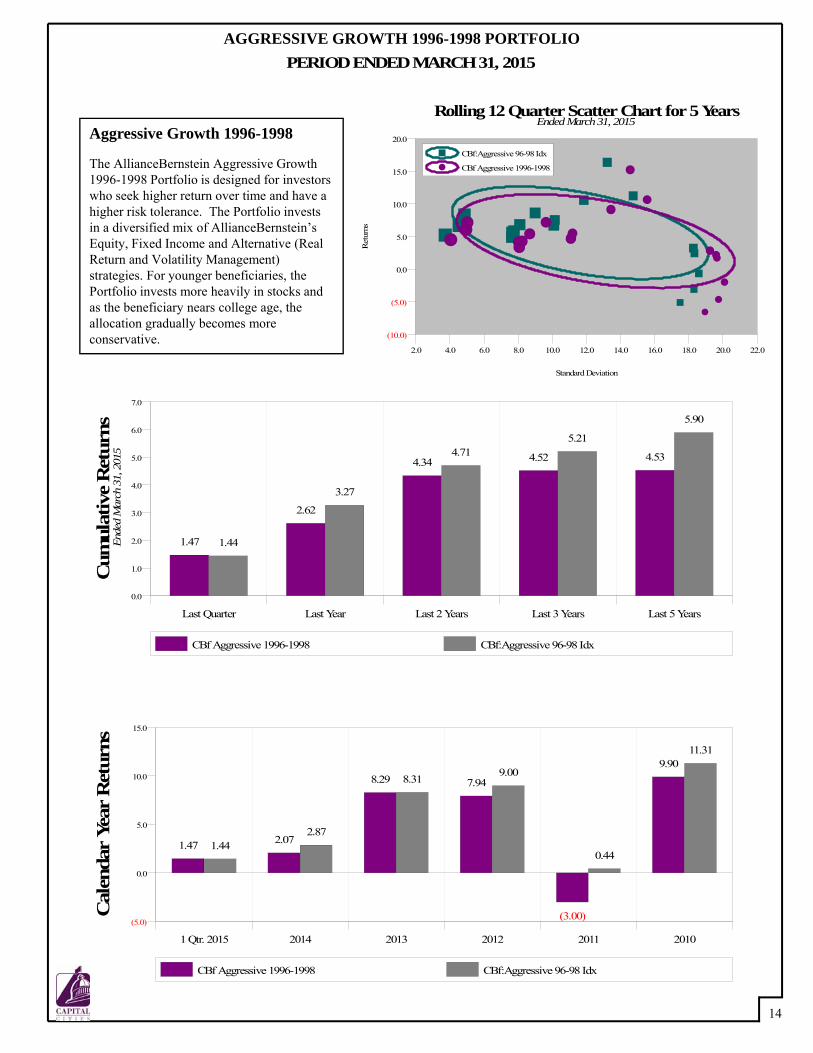
CBf Aggressive 1996-1998 1.47 2.62 4.34 4.52 4.53CBf:Aggressive 96-98 Idx 1.44 3.27 4.71 5.21 5.90
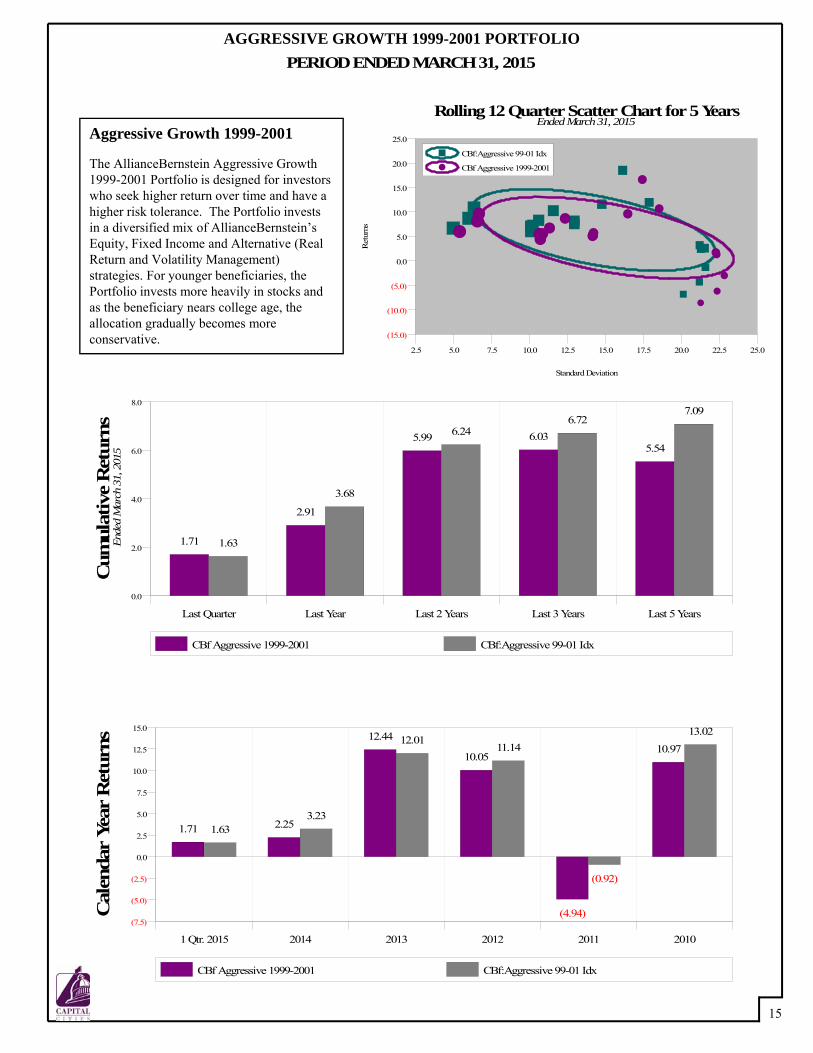
CBf Aggressive 1999-2001 1.71 2.91 5.99 6.03 5.54CBf:Aggressive 99-01 Idx 1.63 3.68 6.24 6.72 7.09
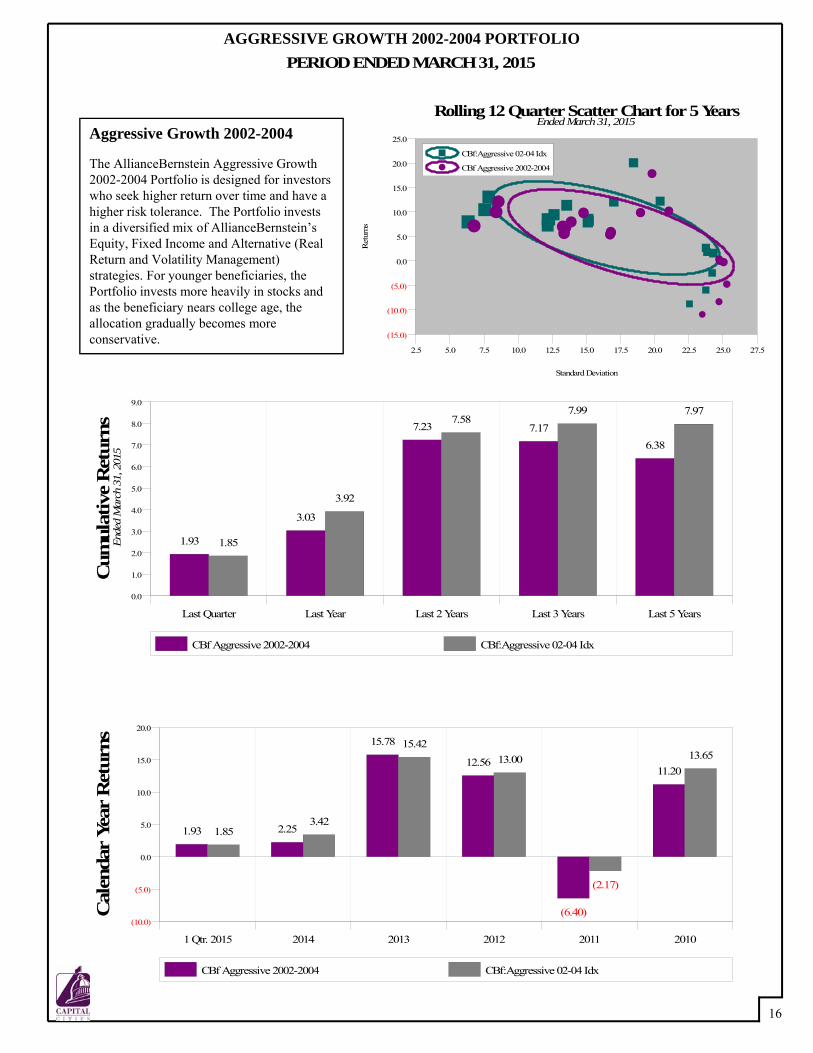
CBf Aggressive 2002-2004 1.93 3.03 7.23 7.17 6.38CBf:Aggressive 02-04 Idx 1.85 3.92 7.58 7.99 7.97
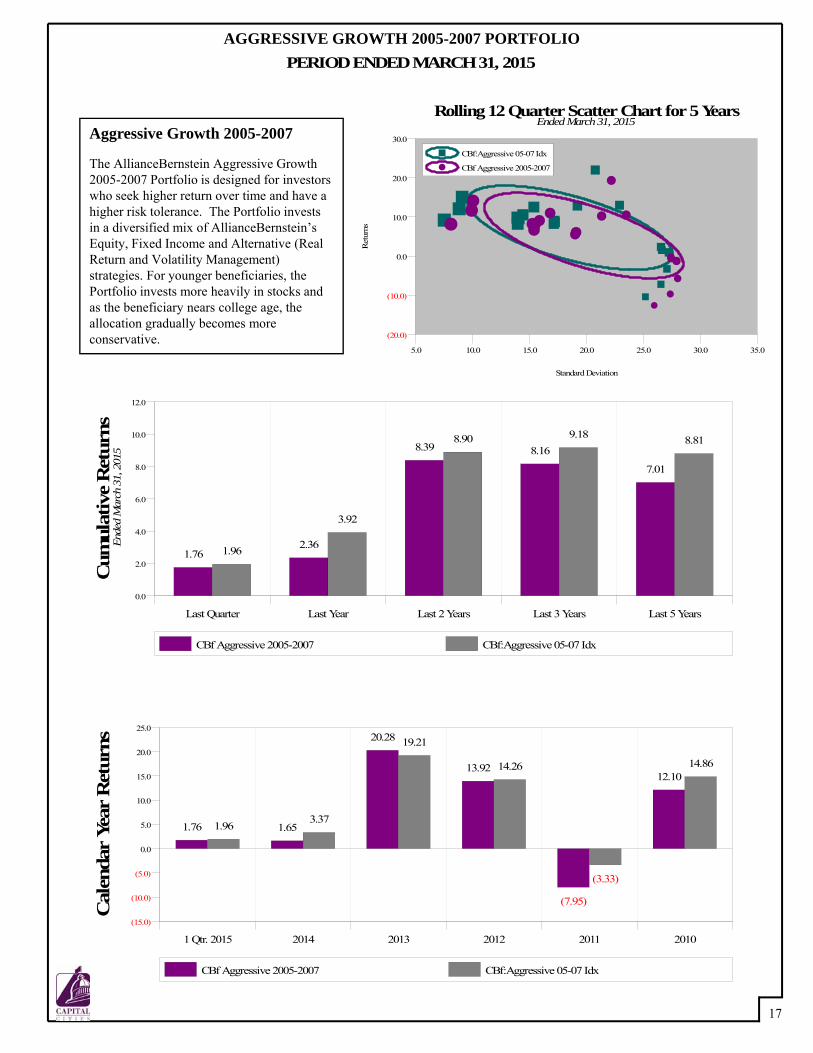
CBf Aggressive 2005-2007 1.76 2.36 8.39 8.16 7.01CBf:Aggressive 05-07 Idx 1.96 3.92 8.90 9.18 8.81
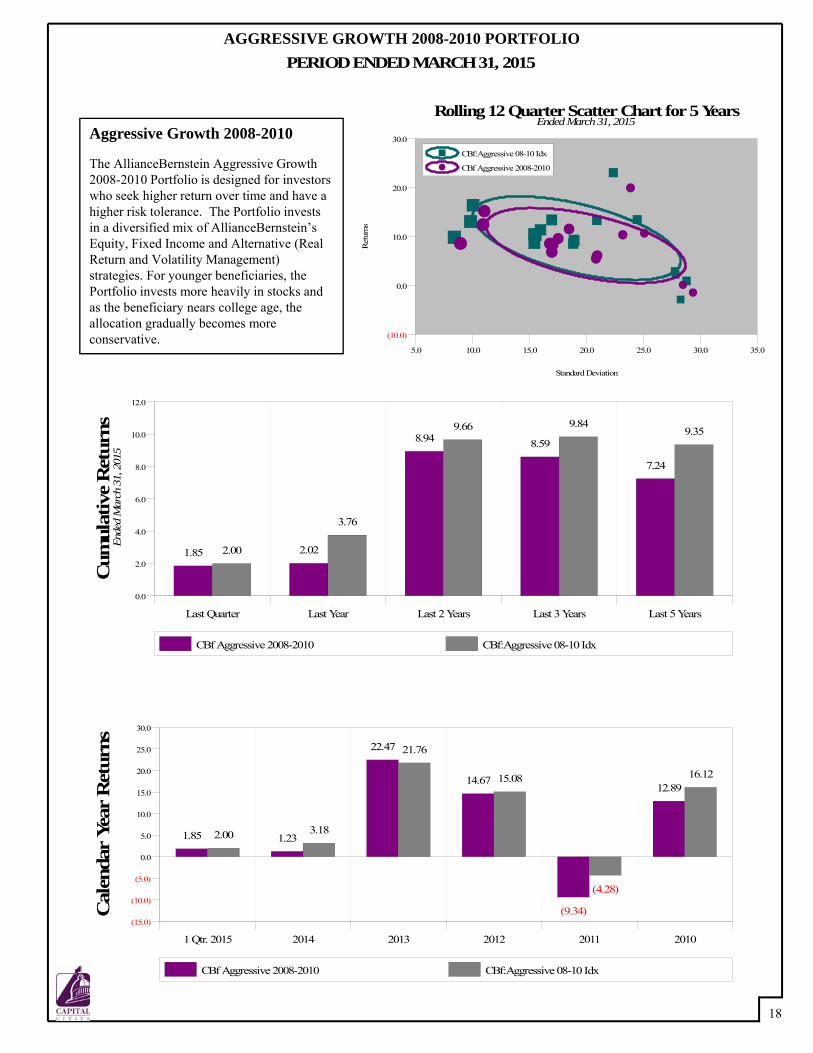
CBf Aggressive 2008-2010 1.85 2.02 8.94 8.59 7.24CBf:Aggressive 08-10 Idx 2.00 3.76 9.66 9.84 9.35
CBf Aggressive 2011-2013 1.90 1.98 9.55 9.00 --CBf:Aggressive 11-13 Idx 2.10 3.94 10.41 10.47 --
CBf Aggressive 2014-2016 1.98 2.08 -- -- --CBf:Aggressive 14-16 Idx 2.14 4.02 -- -- --
CBf Moderate <1984 1.30 2.43 2.80 3.16 3.32CBf:Moderate <1984 Idx 1.14 2.66 3.24 3.60 4.42
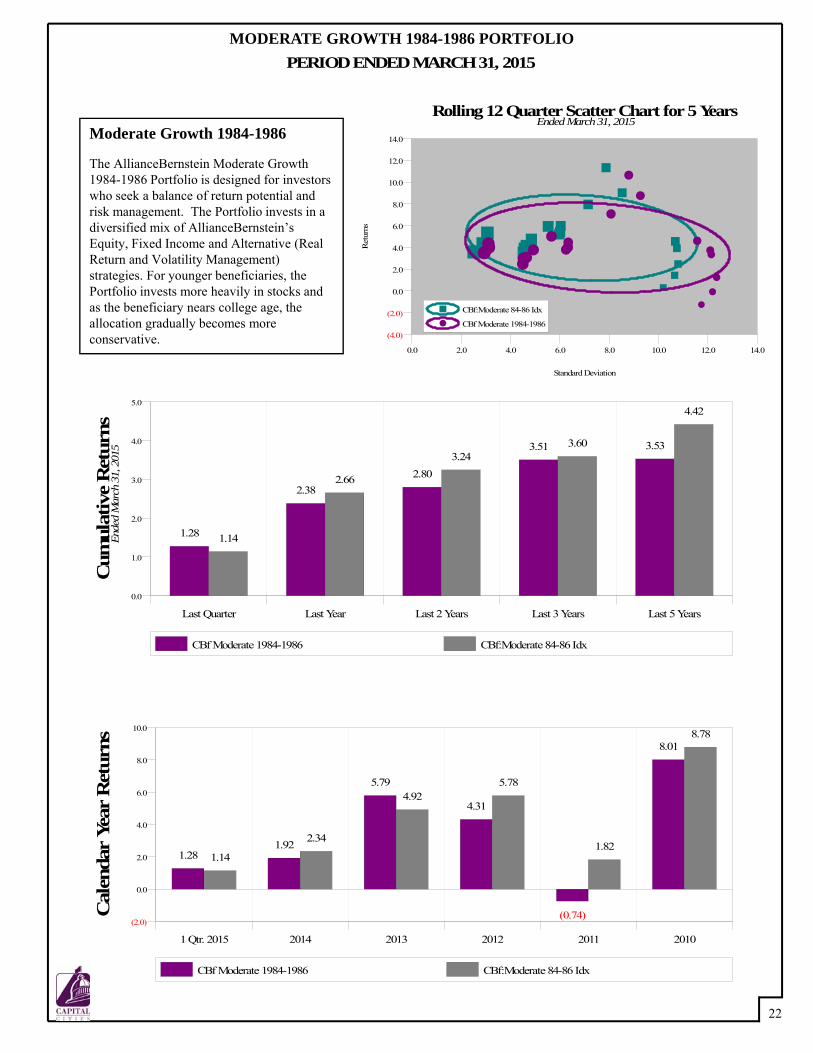
CBf Moderate 1984-1986 1.28 2.38 2.80 3.51 3.53CBf:Moderate 84-86 Idx 1.14 2.66 3.24 3.60 4.42
CBf Moderate 1987-1989 1.25 2.39 2.78 3.26 3.37CBf:Moderate 87-89 Idx 1.14 2.66 3.24 3.60 4.42
CBf Moderate 1990-1992 1.22 2.33 2.79 3.06 3.24CBf:Moderate 90-92 Idx 1.14 2.66 3.24 3.60 4.42
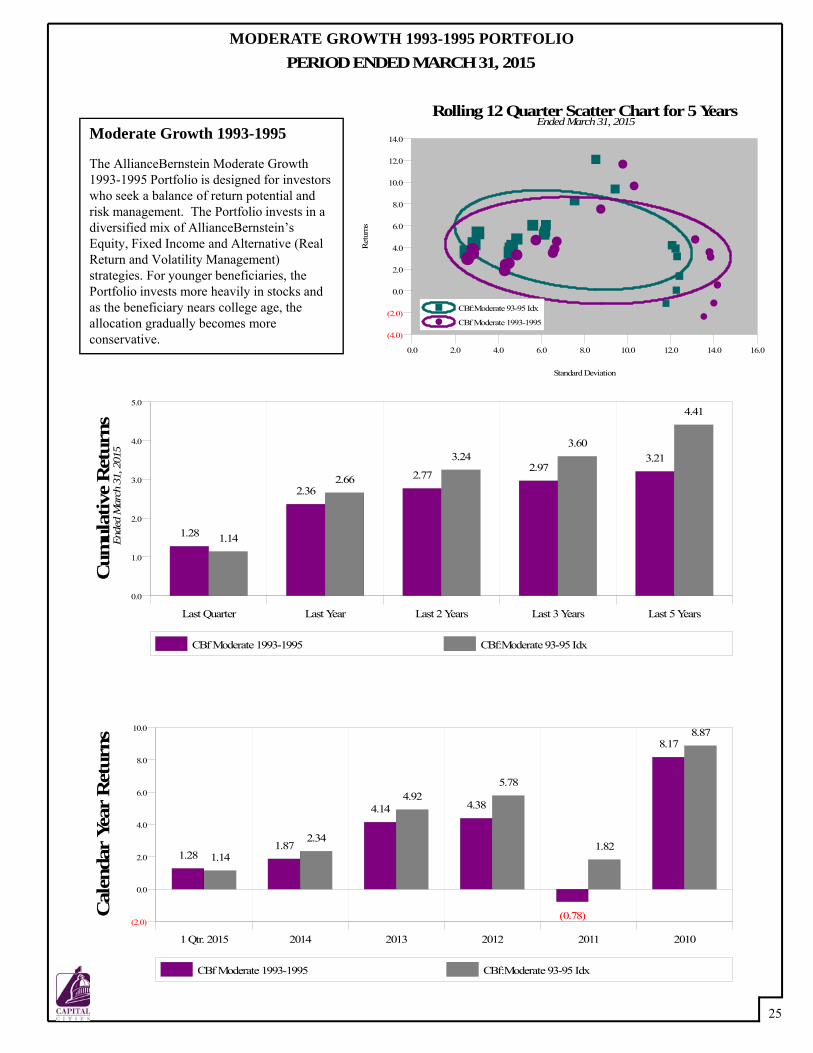
CBf Moderate 1993-1995 1.28 2.36 2.77 2.97 3.21CBf:Moderate 93-95 Idx 1.14 2.66 3.24 3.60 4.41
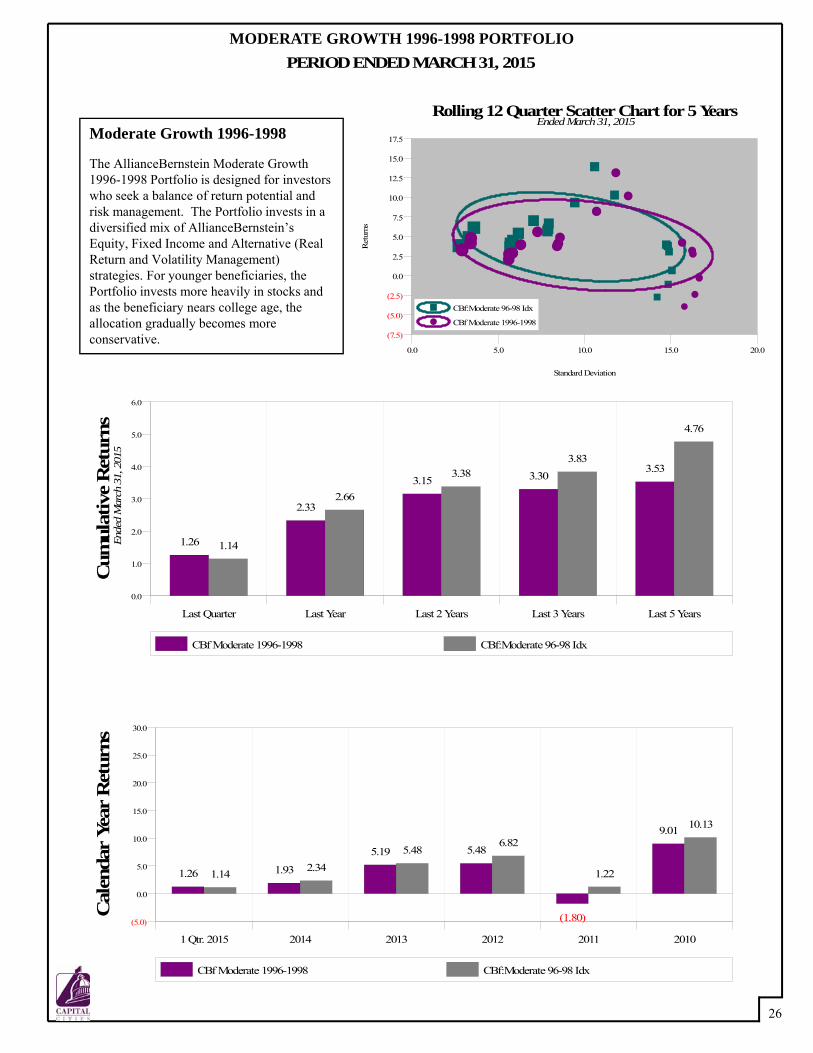
CBf Moderate 1996-1998 1.26 2.33 3.15 3.30 3.53CBf:Moderate 96-98 Idx 1.14 2.66 3.38 3.83 4.76
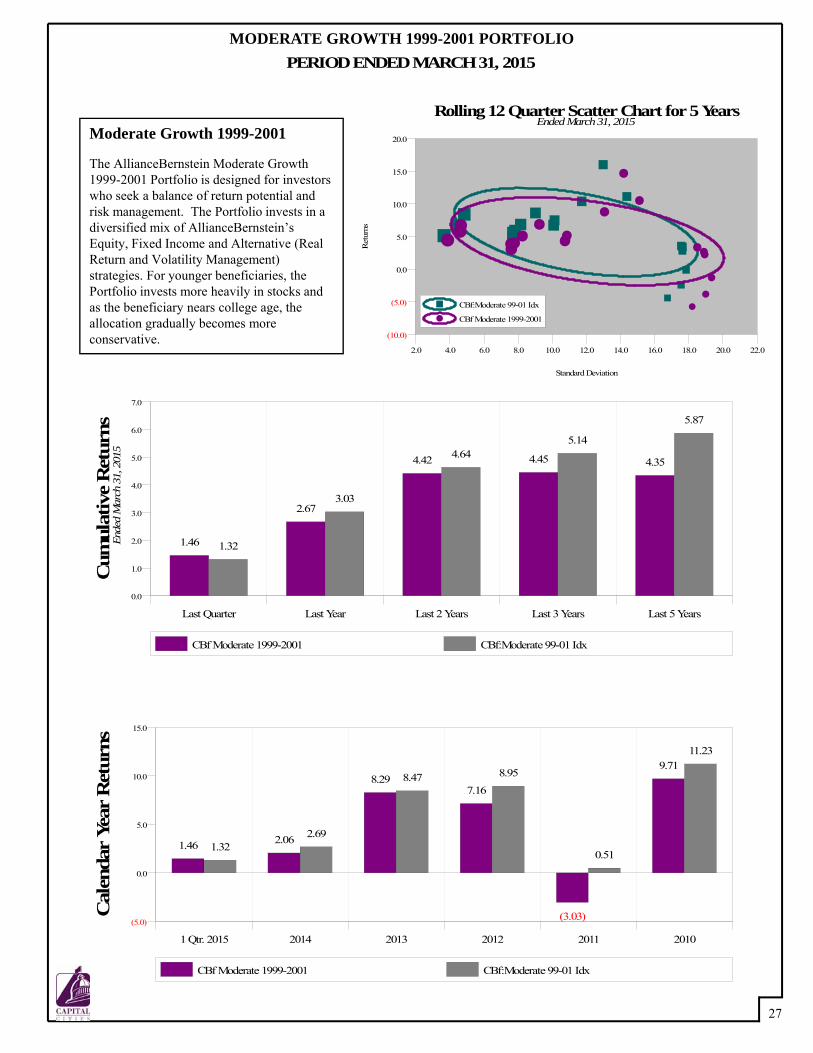
CBf Moderate 1999-2001 1.46 2.67 4.42 4.45 4.35CBf:Moderate 99-01 Idx 1.32 3.03 4.64 5.14 5.87
CBf Moderate 2002-2004 1.87 3.29 6.08 5.93 5.43CBf:Moderate 02-04 Idx 1.62 3.68 6.21 6.70 7.12
CBf Moderate 2005-2007 2.18 3.76 7.46 7.21 6.33CBf:Moderate 05-07 Idx 1.90 4.12 7.63 8.03 8.06
CBf Moderate 2008-2010 2.18 3.22 8.28 7.96 6.84CBf:Moderate 08-10 Idx 2.02 4.11 8.56 8.87 8.63
CBf Moderate 2011-2013 1.96 2.29 8.62 8.41 --CBf:Moderate 11-13 Idx 2.04 3.90 9.33 9.61 --
CBf Moderate 2014-2016 1.97 2.16 -- -- --CBf:Moderate 14-16 Idx 2.14 4.00 -- -- --
6
Education Strategies Portfolios
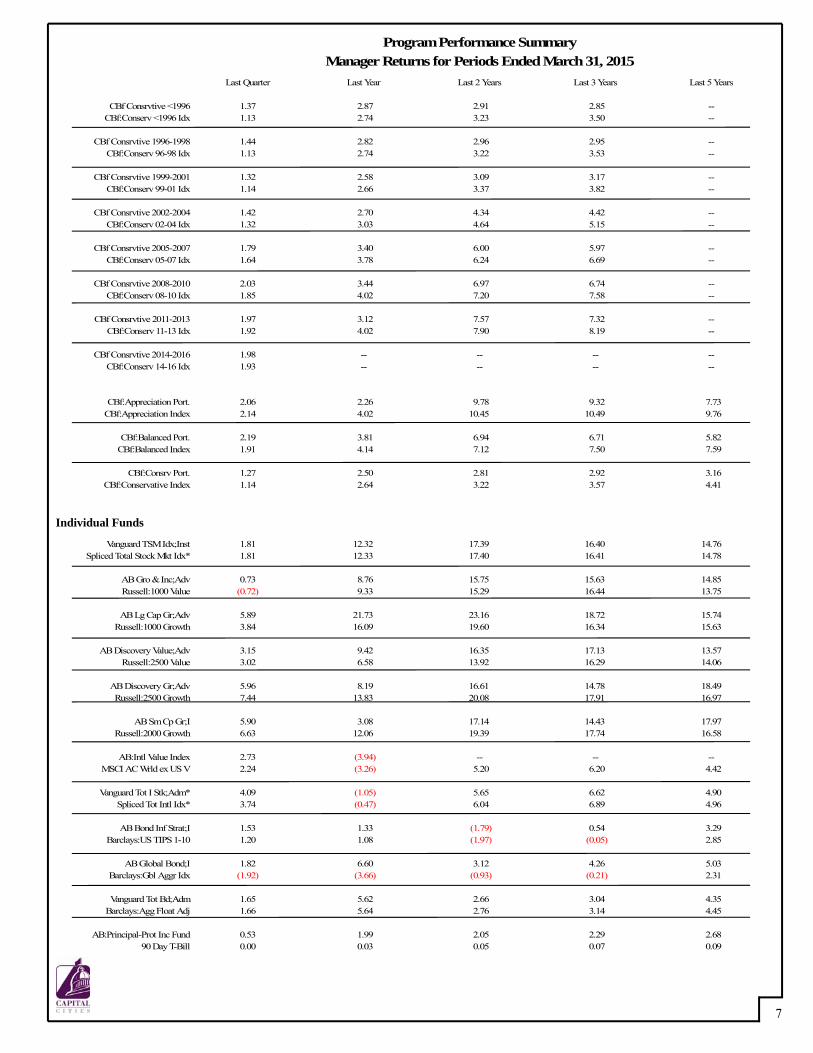
Manager Returns for Periods Ended March 31, 2015Program Performance Summary
Last Quarter Last Year Last 2 Years Last 3 Years Last 5 Years
CBf Consrvtive <1996 1.37 2.87 2.91 2.85 --CBf:Conserv <1996 Idx 1.13 2.74 3.23 3.50 --
CBf Consrvtive 1996-1998 1.44 2.82 2.96 2.95 --CBf:Conserv 96-98 Idx 1.13 2.74 3.22 3.53 --
CBf Consrvtive 1999-2001 1.32 2.58 3.09 3.17 --CBf:Conserv 99-01 Idx 1.14 2.66 3.37 3.82 --
CBf Consrvtive 2002-2004 1.42 2.70 4.34 4.42 --CBf:Conserv 02-04 Idx 1.32 3.03 4.64 5.15 --
CBf Consrvtive 2005-2007 1.79 3.40 6.00 5.97 --CBf:Conserv 05-07 Idx 1.64 3.78 6.24 6.69 --
CBf Consrvtive 2008-2010 2.03 3.44 6.97 6.74 --CBf:Conserv 08-10 Idx 1.85 4.02 7.20 7.58 --
CBf Consrvtive 2011-2013 1.97 3.12 7.57 7.32 --CBf:Conserv 11-13 Idx 1.92 4.02 7.90 8.19 --
CBf Consrvtive 2014-2016 1.98 -- -- -- --CBf:Conserv 14-16 Idx 1.93 -- -- -- --
CBf:Appreciation Port. 2.06 2.26 9.78 9.32 7.73CBf:Appreciation Index 2.14 4.02 10.45 10.49 9.76
CBf:Balanced Port. 2.19 3.81 6.94 6.71 5.82CBf:Balanced Index 1.91 4.14 7.12 7.50 7.59
CBf:Consrv Port. 1.27 2.50 2.81 2.92 3.16CBf:Conservative Index 1.14 2.64 3.22 3.57 4.41
Vanguard TSM Idx;Inst 1.81 12.32 17.39 16.40 14.76Spliced Total Stock Mkt Idx* 1.81 12.33 17.40 16.41 14.78
AB Gro & Inc;Adv 0.73 8.76 15.75 15.63 14.85Russell:1000 Value (0.72) 9.33 15.29 16.44 13.75
AB Lg Cap Gr;Adv 5.89 21.73 23.16 18.72 15.74Russell:1000 Growth 3.84 16.09 19.60 16.34 15.63
AB Discovery Value;Adv 3.15 9.42 16.35 17.13 13.57Russell:2500 Value 3.02 6.58 13.92 16.29 14.06
AB Discovery Gr;Adv 5.96 8.19 16.61 14.78 18.49Russell:2500 Growth 7.44 13.83 20.08 17.91 16.97
AB Sm Cp Gr;I 5.90 3.08 17.14 14.43 17.97Russell:2000 Growth 6.63 12.06 19.39 17.74 16.58
AB:Intl Value Index 2.73 (3.94) -- -- --MSCI AC Wrld ex US V 2.24 (3.26) 5.20 6.20 4.42
Vanguard Tot I Stk;Adm* 4.09 (1.05) 5.65 6.62 4.90Spliced Tot Intl Idx* 3.74 (0.47) 6.04 6.89 4.96
AB Bond Inf Strat;I 1.53 1.33 (1.79) 0.54 3.29Barclays:US TIPS 1-10 1.20 1.08 (1.97) (0.05) 2.85
AB Global Bond;I 1.82 6.60 3.12 4.26 5.03Barclays:Gbl Aggr Idx (1.92) (3.66) (0.93) (0.21) 2.31
Vanguard Tot Bd;Adm 1.65 5.62 2.66 3.04 4.35Barclays:Agg Float Adj 1.66 5.64 2.76 3.14 4.45
AB:Principal-Prot Inc Fund 0.53 1.99 2.05 2.29 2.6890 Day T-Bill 0.00 0.03 0.05 0.07 0.09
7
Individual Funds
1 Qtr. 2015 2014 2013 2012 2011 2010
(4.0)
(2.0)
0.0
2.0
4.0
6.0
8.0
10.0
12.0
Cal
enda
r Ye
ar R
etur
ns
1.49 2.05
7.396.76
(1.42)
8.52
1.442.87
7.57 7.70
1.36
9.41
CBf Aggressive <1984 CBf:Aggressive <1984 Idx
8
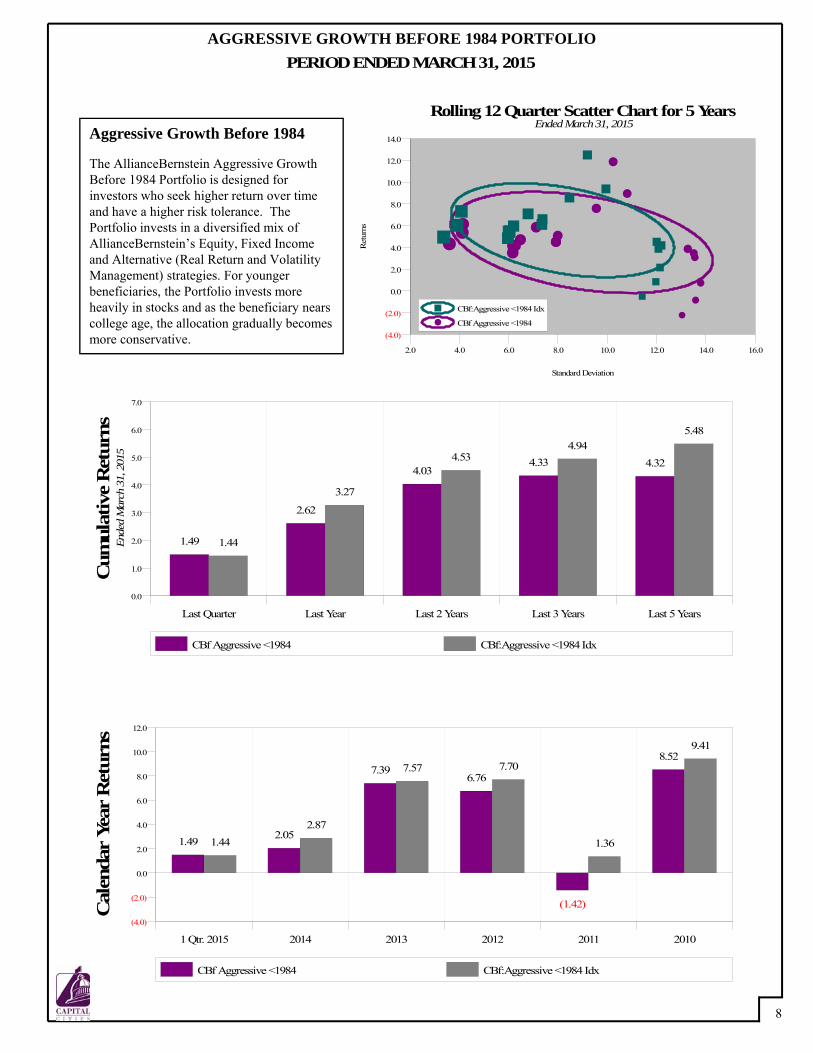
AGGRESSIVE GROWTH BEFORE 1984 PORTFOLIOPERIOD ENDED MARCH 31, 2015
2.0 4.0 6.0 8.0 10.0 12.0 14.0 16.0
(4.0)
(2.0)
0.0
2.0
4.0
6.0
8.0
10.0
12.0
14.0
Standard DeviationR
etur
ns
Rolling 12 Quarter Scatter Chart for 5 Years
CBf:Aggressive <1984 Idx
CBf Aggressive <1984
Ended March 31, 2015
Last Quarter Last Year Last 2 Years Last 3 Years Last 5 Years
0.0
1.0
2.0
3.0
4.0
5.0
6.0
7.0
Cum
ulat
ive
Ret
urns
1.49
2.62
4.034.33 4.32
1.44
3.27
4.534.94
5.48
CBf Aggressive <1984 CBf:Aggressive <1984 Idx
Ende
d M
arch
31,
201
5Aggressive Growth Before 1984
The AllianceBernstein Aggressive Growth Before 1984 Portfolio is designed for investors who seek higher return over time and have a higher risk tolerance. The Portfolio invests in a diversified mix of AllianceBernstein’s Equity, Fixed Income and Alternative (Real Return and Volatility Management) strategies. For younger beneficiaries, the Portfolio invests more heavily in stocks and as the beneficiary nears college age, the allocation gradually becomes more conservative.
1 Qtr. 2015 2014 2013 2012 2011 2010
(2.5)
0.0
2.5
5.0
7.5
10.0
12.5
Cal
enda
r Ye
ar R
etur
ns
1.492.11
9.46
6.61
(1.29)
8.59
1.44
2.87
7.57 7.70
1.36
9.41
CBf Aggressive 1984-1986 CBf:Aggressive 84-86 Idx
2.0 4.0 6.0 8.0 10.0 12.0 14.0 16.0
(4.0)
(2.0)
0.0
2.0
4.0
6.0
8.0
10.0
12.0
14.0
Standard DeviationR
etur
ns
Rolling 12 Quarter Scatter Chart for 5 Years
CBf:Aggressive 84-86 Idx
CBf Aggressive 1984-1986
Ended March 31, 2015
9
AGGRESSIVE GROWTH 1984-1986 PORTFOLIOPERIOD ENDED MARCH 31, 2015
Aggressive Growth 1984-1986
The AllianceBernstein Aggressive Growth 1984-1986 Portfolio is designed for investors who seek higher return over time and have a higher risk tolerance. The Portfolio invests in a diversified mix of AllianceBernstein’sEquity, Fixed Income and Alternative (Real Return and Volatility Management) strategies. For younger beneficiaries, the Portfolio invests more heavily in stocks and as the beneficiary nears college age, the allocation gradually becomes more conservative.
Last Quarter Last Year Last 2 Years Last 3 Years Last 5 Years
0.0
1.0
2.0
3.0
4.0
5.0
6.0
7.0
Cum
ulat
ive
Ret
urns
1.49
2.69
4.06
5.014.73
1.44
3.27
4.534.94
5.48
CBf Aggressive 1984-1986 CBf:Aggressive 84-86 Idx
Ende
d M
arch
31,
201
5
1 Qtr. 2015 2014 2013 2012 2011 2010
(2.0)
0.0
2.0
4.0
6.0
8.0
10.0
Cal
enda
r Ye
ar R
etur
ns
1.64
2.95
8.277.50
(0.58)
1.44
2.88
7.57 7.71
1.36
CBf Aggressive <1987 CBf:Aggressive <1987 Idx
3.0 4.0 5.0 6.0 7.0
4.0
5.0
6.0
7.0
8.0
Standard DeviationR
etur
ns
Rolling 12 Quarter Scatter Chart for 5 Years
CBf:Aggressive <1987 Idx
CBf Aggressive <1987
Ended March 31, 2015
10
AGGRESSIVE GROWTH BEFORE 1987 PORTFOLIOPERIOD ENDED MARCH 31, 2015
Aggressive Growth Before 1987
The AllianceBernstein Aggressive Growth Before 1987 Portfolio is designed for investors who seek higher return over time and have a higher risk tolerance. The Portfolio invests in a diversified mix of AllianceBernstein’s Equity, Fixed Income and Alternative (Real Return and Volatility Management) strategies. For younger beneficiaries, the Portfolio invests more heavily in stocks and as the beneficiary nears college age, the allocation gradually becomes more conservative.
Note: Available in Rhode Island Accounts Only. Inception Date: August 27, 2010
Last Quarter Last Year Last 2 Years Last 3 Years Last 5 Years
0.0
1.0
2.0
3.0
4.0
5.0
6.0
Cum
ulat
ive
Ret
urns
1.64
3.47
4.855.16
1.44
3.27
4.534.94
CBf Aggressive <1987 CBf:Aggressive <1987 Idx
Ende
d M
arch
31,
201
5

1 Qtr. 2015 2014 2013 2012 2011 2010
(2.5)
0.0
2.5
5.0
7.5
10.0
12.5
Cal
enda
r Ye
ar R
etur
ns
1.512.06
8.87
6.67
(1.38)
8.55
1.44
2.87
7.57 7.70
1.36
9.41
CBf Aggressive 1987-1989 CBf:Aggressive 87-89 Idx
2.0 4.0 6.0 8.0 10.0 12.0 14.0 16.0
(4.0)
(2.0)
0.0
2.0
4.0
6.0
8.0
10.0
12.0
14.0
Standard DeviationR
etur
ns
Rolling 12 Quarter Scatter Chart for 5 Years
CBf:Aggressive 87-89 Idx
CBf Aggressive 1987-1989
Ended March 31, 2015
11
AGGRESSIVE GROWTH 1987-1989 PORTFOLIOPERIOD ENDED MARCH 31, 2015
Aggressive Growth 1987-1989
The AllianceBernstein Aggressive Growth 1987-1989 Portfolio is designed for investors who seek higher return over time and have a higher risk tolerance. The Portfolio invests in a diversified mix of AllianceBernstein’sEquity, Fixed Income and Alternative (Real Return and Volatility Management) strategies. For younger beneficiaries, the Portfolio invests more heavily in stocks and as the beneficiary nears college age, the allocation gradually becomes more conservative.
Last Quarter Last Year Last 2 Years Last 3 Years Last 5 Years
0.0
1.0
2.0
3.0
4.0
5.0
6.0
7.0
Cum
ulat
ive
Ret
urns
1.51
2.65
4.03
4.81 4.61
1.44
3.27
4.534.94
5.48
CBf Aggressive 1987-1989 CBf:Aggressive 87-89 Idx
Ende
d M
arch
31,
201
5

1 Qtr. 2015 2014 2013 2012 2011 2010
(2.5)
0.0
2.5
5.0
7.5
10.0
12.5
Cal
enda
r Ye
ar R
etur
ns
1.512.07
7.556.67
(1.37)
8.44
1.44
2.87
7.57 7.70
1.36
9.41
CBf Aggressive 1990-1992 CBf:Aggressive 90-92 Idx
2.0 4.0 6.0 8.0 10.0 12.0 14.0 16.0
(4.0)
(2.0)
0.0
2.0
4.0
6.0
8.0
10.0
12.0
14.0
Standard DeviationR
etur
ns
Rolling 12 Quarter Scatter Chart for 5 Years
CBf:Aggressive 90-92 Idx
CBf Aggressive 1990-1992
Ended March 31, 2015
12
AGGRESSIVE GROWTH 1990-1992 PORTFOLIOPERIOD ENDED MARCH 31, 2015
Aggressive Growth 1990-1992
The AllianceBernstein Aggressive Growth 1990-1992 Portfolio is designed for investors who seek higher return over time and have a higher risk tolerance. The Portfolio invests in a diversified mix of AllianceBernstein’sEquity, Fixed Income and Alternative (Real Return and Volatility Management) strategies. For younger beneficiaries, the Portfolio invests more heavily in stocks and as the beneficiary nears college age, the allocation gradually becomes more conservative.
Last Quarter Last Year Last 2 Years Last 3 Years Last 5 Years
0.0
1.0
2.0
3.0
4.0
5.0
6.0
7.0
Cum
ulat
ive
Ret
urns
1.51
2.65
4.044.40 4.34
1.44
3.27
4.534.94
5.48
CBf Aggressive 1990-1992 CBf:Aggressive 90-92 Idx
Ende
d M
arch
31,
201
5
1 Qtr. 2015 2014 2013 2012 2011 2010
(2.5)
0.0
2.5
5.0
7.5
10.0
12.5
Cal
enda
r Ye
ar R
etur
ns
1.492.07
7.256.64
(1.39)
8.72
1.44
2.87
7.57 7.70
1.36
9.49
CBf Aggressive 1993-1995 CBf:Aggressive 93-95 Idx
2.0 4.0 6.0 8.0 10.0 12.0 14.0 16.0 18.0
(7.5)
(5.0)
(2.5)
0.0
2.5
5.0
7.5
10.0
12.5
15.0
17.5
Standard DeviationR
etur
ns
Rolling 12 Quarter Scatter Chart for 5 Years
CBf:Aggressive 93-95 Idx
CBf Aggressive 1993-1995
Ended March 31, 2015
13
AGGRESSIVE GROWTH 1993-1995 PORTFOLIOPERIOD ENDED MARCH 31, 2015
Aggressive Growth 1993-1995
The AllianceBernstein Aggressive Growth 1993-1995 Portfolio is designed for investors who seek higher return over time and have a higher risk tolerance. The Portfolio invests in a diversified mix of AllianceBernstein’sEquity, Fixed Income and Alternative (Real Return and Volatility Management) strategies. For younger beneficiaries, the Portfolio invests more heavily in stocks and as the beneficiary nears college age, the allocation gradually becomes more conservative.
Last Quarter Last Year Last 2 Years Last 3 Years Last 5 Years
0.0
1.0
2.0
3.0
4.0
5.0
6.0
7.0
Cum
ulat
ive
Ret
urns
1.49
2.66
4.06 4.27 4.29
1.44
3.27
4.534.94
5.46
CBf Aggressive 1993-1995 CBf:Aggressive 93-95 Idx
Ende
d M
arch
31,
201
5
1 Qtr. 2015 2014 2013 2012 2011 2010
(5.0)
0.0
5.0
10.0
15.0
Cal
enda
r Ye
ar R
etur
ns
1.47 2.07
8.29 7.94
(3.00)
9.90
1.442.87
8.31 9.00
0.44
11.31
CBf Aggressive 1996-1998 CBf:Aggressive 96-98 Idx
2.0 4.0 6.0 8.0 10.0 12.0 14.0 16.0 18.0 20.0 22.0
(10.0)
(5.0)
0.0
5.0
10.0
15.0
20.0
Standard DeviationR
etur
ns
Rolling 12 Quarter Scatter Chart for 5 Years
CBf:Aggressive 96-98 Idx
CBf Aggressive 1996-1998
Ended March 31, 2015
14
AGGRESSIVE GROWTH 1996-1998 PORTFOLIOPERIOD ENDED MARCH 31, 2015
Aggressive Growth 1996-1998
The AllianceBernstein Aggressive Growth 1996-1998 Portfolio is designed for investors who seek higher return over time and have a higher risk tolerance. The Portfolio invests in a diversified mix of AllianceBernstein’sEquity, Fixed Income and Alternative (Real Return and Volatility Management) strategies. For younger beneficiaries, the Portfolio invests more heavily in stocks and as the beneficiary nears college age, the allocation gradually becomes more conservative.
Last Quarter Last Year Last 2 Years Last 3 Years Last 5 Years
0.0
1.0
2.0
3.0
4.0
5.0
6.0
7.0
Cum
ulat
ive
Ret
urns
1.47
2.62
4.34 4.52 4.53
1.44
3.27
4.715.21
5.90
CBf Aggressive 1996-1998 CBf:Aggressive 96-98 Idx
Ende
d M
arch
31,
201
5
1 Qtr. 2015 2014 2013 2012 2011 2010
(7.5)
(5.0)
(2.5)
0.0
2.5
5.0
7.5
10.0
12.5
15.0
Cal
enda
r Ye
ar R
etur
ns
1.71 2.25
12.44
10.05
(4.94)
10.97
1.633.23
12.0111.14
(0.92)
13.02
CBf Aggressive 1999-2001 CBf:Aggressive 99-01 Idx
2.5 5.0 7.5 10.0 12.5 15.0 17.5 20.0 22.5 25.0
(15.0)
(10.0)
(5.0)
0.0
5.0
10.0
15.0
20.0
25.0
Standard DeviationR
etur
ns
Rolling 12 Quarter Scatter Chart for 5 Years
CBf:Aggressive 99-01 Idx
CBf Aggressive 1999-2001
Ended March 31, 2015
15
AGGRESSIVE GROWTH 1999-2001 PORTFOLIOPERIOD ENDED MARCH 31, 2015
Aggressive Growth 1999-2001
The AllianceBernstein Aggressive Growth 1999-2001 Portfolio is designed for investors who seek higher return over time and have a higher risk tolerance. The Portfolio invests in a diversified mix of AllianceBernstein’sEquity, Fixed Income and Alternative (Real Return and Volatility Management) strategies. For younger beneficiaries, the Portfolio invests more heavily in stocks and as the beneficiary nears college age, the allocation gradually becomes more conservative.
Last Quarter Last Year Last 2 Years Last 3 Years Last 5 Years
0.0
2.0
4.0
6.0
8.0
Cum
ulat
ive
Ret
urns
1.71
2.91
5.99 6.035.54
1.63
3.68
6.246.72
7.09
CBf Aggressive 1999-2001 CBf:Aggressive 99-01 Idx
Ende
d M
arch
31,
201
5
1 Qtr. 2015 2014 2013 2012 2011 2010
(10.0)
(5.0)
0.0
5.0
10.0
15.0
20.0
Cal
enda
r Ye
ar R
etur
ns
1.93 2.25
15.78
12.56
(6.40)
11.20
1.853.42
15.4213.00
(2.17)
13.65
CBf Aggressive 2002-2004 CBf:Aggressive 02-04 Idx
2.5 5.0 7.5 10.0 12.5 15.0 17.5 20.0 22.5 25.0 27.5
(15.0)
(10.0)
(5.0)
0.0
5.0
10.0
15.0
20.0
25.0
Standard DeviationR
etur
ns
Rolling 12 Quarter Scatter Chart for 5 Years
CBf:Aggressive 02-04 Idx
CBf Aggressive 2002-2004
Ended March 31, 2015
16
AGGRESSIVE GROWTH 2002-2004 PORTFOLIOPERIOD ENDED MARCH 31, 2015
Aggressive Growth 2002-2004
The AllianceBernstein Aggressive Growth 2002-2004 Portfolio is designed for investors who seek higher return over time and have a higher risk tolerance. The Portfolio invests in a diversified mix of AllianceBernstein’sEquity, Fixed Income and Alternative (Real Return and Volatility Management) strategies. For younger beneficiaries, the Portfolio invests more heavily in stocks and as the beneficiary nears college age, the allocation gradually becomes more conservative.
Last Quarter Last Year Last 2 Years Last 3 Years Last 5 Years
0.0
1.0
2.0
3.0
4.0
5.0
6.0
7.0
8.0
9.0
Cum
ulat
ive
Ret
urns
1.93
3.03
7.23 7.176.38
1.85
3.92
7.587.99 7.97
CBf Aggressive 2002-2004 CBf:Aggressive 02-04 Idx
Ende
d M
arch
31,
201
5
1 Qtr. 2015 2014 2013 2012 2011 2010
(15.0)
(10.0)
(5.0)
0.0
5.0
10.0
15.0
20.0
25.0
Cal
enda
r Ye
ar R
etur
ns
1.76 1.65
20.28
13.92
(7.95)
12.10
1.96 3.37
19.21
14.26
(3.33)
14.86
CBf Aggressive 2005-2007 CBf:Aggressive 05-07 Idx
5.0 10.0 15.0 20.0 25.0 30.0 35.0
(20.0)
(10.0)
0.0
10.0
20.0
30.0
Standard DeviationR
etur
ns
Rolling 12 Quarter Scatter Chart for 5 Years
CBf:Aggressive 05-07 Idx
CBf Aggressive 2005-2007
Ended March 31, 2015
17
AGGRESSIVE GROWTH 2005-2007 PORTFOLIOPERIOD ENDED MARCH 31, 2015
Aggressive Growth 2005-2007
The AllianceBernstein Aggressive Growth 2005-2007 Portfolio is designed for investors who seek higher return over time and have a higher risk tolerance. The Portfolio invests in a diversified mix of AllianceBernstein’sEquity, Fixed Income and Alternative (Real Return and Volatility Management) strategies. For younger beneficiaries, the Portfolio invests more heavily in stocks and as the beneficiary nears college age, the allocation gradually becomes more conservative.
Last Quarter Last Year Last 2 Years Last 3 Years Last 5 Years
0.0
2.0
4.0
6.0
8.0
10.0
12.0
Cum
ulat
ive
Ret
urns
1.762.36
8.39 8.16
7.01
1.96
3.92
8.90 9.18 8.81
CBf Aggressive 2005-2007 CBf:Aggressive 05-07 Idx
Ende
d M
arch
31,
201
5
1 Qtr. 2015 2014 2013 2012 2011 2010
(15.0)
(10.0)
(5.0)
0.0
5.0
10.0
15.0
20.0
25.0
30.0
Cal
enda
r Ye
ar R
etur
ns
1.85 1.23
22.47
14.67
(9.34)
12.89
2.00 3.18
21.76
15.08
(4.28)
16.12
CBf Aggressive 2008-2010 CBf:Aggressive 08-10 Idx
5.0 10.0 15.0 20.0 25.0 30.0 35.0
(10.0)
0.0
10.0
20.0
30.0
Standard DeviationR
etur
ns
Rolling 12 Quarter Scatter Chart for 5 Years
CBf:Aggressive 08-10 Idx
CBf Aggressive 2008-2010
Ended March 31, 2015
18
AGGRESSIVE GROWTH 2008-2010 PORTFOLIOPERIOD ENDED MARCH 31, 2015
Aggressive Growth 2008-2010
The AllianceBernstein Aggressive Growth 2008-2010 Portfolio is designed for investors who seek higher return over time and have a higher risk tolerance. The Portfolio invests in a diversified mix of AllianceBernstein’sEquity, Fixed Income and Alternative (Real Return and Volatility Management) strategies. For younger beneficiaries, the Portfolio invests more heavily in stocks and as the beneficiary nears college age, the allocation gradually becomes more conservative.
Last Quarter Last Year Last 2 Years Last 3 Years Last 5 Years
0.0
2.0
4.0
6.0
8.0
10.0
12.0
Cum
ulat
ive
Ret
urns
1.85 2.02
8.94 8.59
7.24
2.00
3.76
9.66 9.849.35
CBf Aggressive 2008-2010 CBf:Aggressive 08-10 Idx
Ende
d M
arch
31,
201
5

1 Qtr. 2015 2014 2013 2012 2011 2010
0.0
5.0
10.0
15.0
20.0
25.0
30.0
Cal
enda
r Ye
ar R
etur
ns
1.90 1.04
24.55
14.57
2.10 3.18
23.82
15.33
CBf Aggressive 2011-2013 CBf:Aggressive 11-13 Idx
8.0 10.0 12.0 14.0 16.0 18.0 20.0
6.0
8.0
10.0
12.0
14.0
16.0
18.0
20.0
Standard DeviationR
etur
ns
Rolling 12 Quarter Scatter Chart for 5 Years
CBf:Aggressive 11-13 Idx
CBf Aggressive 2011-2013
Ended March 31, 2015
19
AGGRESSIVE GROWTH 2011-2013 PORTFOLIOPERIOD ENDED MARCH 31, 2015
Aggressive Growth 2011-2013
The AllianceBernstein Aggressive Growth 2011-2013 Portfolio is designed for investors who seek higher return over time and have a higher risk tolerance. The Portfolio invests in a diversified mix of AllianceBernstein’sEquity, Fixed Income and Alternative (Real Return and Volatility Management) strategies. For younger beneficiaries, the Portfolio invests more heavily in stocks and as the beneficiary nears college age, the allocation gradually becomes more conservative.
Last Quarter Last Year Last 2 Years Last 3 Years Last 5 Years
0.0
2.0
4.0
6.0
8.0
10.0
12.0
Cum
ulat
ive
Ret
urns
1.90 1.98
9.559.00
2.10
3.94
10.41 10.47
CBf Aggressive 2011-2013 CBf:Aggressive 11-13 Idx
Ende
d M
arch
31,
201
5
Inception Date: February 28, 2011

(1.0) (0.5) 0.0 0.5 1.0
(1.0)
(0.5)
0.0
0.5
1.0
Standard DeviationR
etur
ns
Rolling 12 Quarter Scatter Chart for 5 Years
CBf:Aggressive 14-16 Idx
CBf Aggressive 2014-2016
Ended March 31, 2015
1 Qtr. 2015 2014 2013 2012 2011 2010
0.0
0.5
1.0
1.5
2.0
2.5
Cal
enda
r Ye
ar R
etur
ns
1.982.14
CBf Aggressive 2014-2016 CBf:Aggressive 14-16 Idx
20
AGGRESSIVE GROWTH 2014-2016 PORTFOLIOPERIOD ENDED MARCH 31, 2015
Aggressive Growth 2014-2016
The AllianceBernstein Aggressive Growth 2014-2016 Portfolio is designed for investors who seek higher return over time and have a higher risk tolerance. The Portfolio invests in a diversified mix of AllianceBernstein’sEquity, Fixed Income and Alternative (Real Return and Volatility Management) strategies. For younger beneficiaries, the Portfolio invests more heavily in stocks and as the beneficiary nears college age, the allocation gradually becomes more conservative.
Last Quarter Last Year Last 2 Years Last 3 Years Last 5 Years
0.0
0.5
1.0
1.5
2.0
2.5
3.0
3.5
4.0
4.5
Cum
ulat
ive
Ret
urns
1.98 2.082.14
4.02
CBf Aggressive 2014-2016 CBf:Aggressive 14-16 Idx
Ende
d M
arch
31,
201
5
Inception Date: February 18, 2014

1 Qtr. 2015 2014 2013 2012 2011 2010
(2.0)
0.0
2.0
4.0
6.0
8.0
10.0
Cal
enda
r Ye
ar R
etur
ns
1.301.91
4.63 4.34
(0.71)
8.04
1.14
2.34
4.925.78
1.82
8.78
CBf Moderate <1984 CBf:Moderate <1984 Idx
0.0 2.0 4.0 6.0 8.0 10.0 12.0 14.0
(2.5)
0.0
2.5
5.0
7.5
10.0
12.5
15.0
Standard DeviationR
etur
ns
Rolling 12 Quarter Scatter Chart for 5 Years
CBf:Moderate <1984 Idx
CBf Moderate <1984
Ended March 31, 2015
21
MODERATE GROWTH BEFORE 1984 PORTFOLIOPERIOD ENDED MARCH 31, 2015
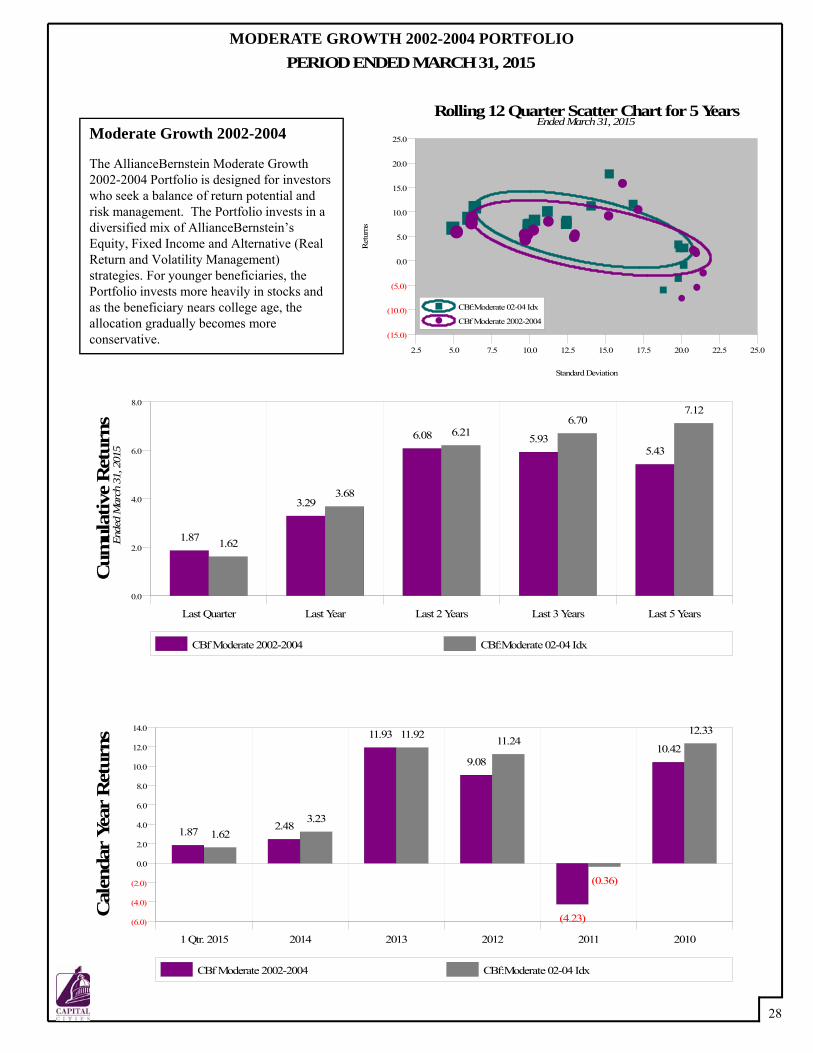
Moderate Growth Before 1984
The AllianceBernstein Moderate Growth Before 1984 Portfolio is designed for investors who seek a balance of return potential and risk management. The Portfolio invests in a diversified mix of AllianceBernstein’s Equity, Fixed Income and Alternative (Real Return and Volatility Management) strategies. For younger beneficiaries, the Portfolio invests more heavily in stocks and as the beneficiary nears college age, the allocation gradually becomes more conservative.
Last Quarter Last Year Last 2 Years Last 3 Years Last 5 Years
0.0
1.0
2.0
3.0
4.0
5.0
Cum
ulat
ive
Ret
urns
1.30
2.432.80
3.16 3.32
CBf Moderate <1984 CBf:Moderate <1984 Idx
1.14
2.66
3.243.60
4.42
Ende
d M
arch
31,
201
5
1 Qtr. 2015 2014 2013 2012 2011 2010
(2.0)
0.0
2.0
4.0
6.0
8.0
10.0
Cal
enda
r Ye
ar R
etur
ns
1.281.92
5.79
4.31
(0.74)
8.01
1.14
2.34
4.925.78
1.82
8.78
CBf Moderate 1984-1986 CBf:Moderate 84-86 Idx
0.0 2.0 4.0 6.0 8.0 10.0 12.0 14.0
(4.0)
(2.0)
0.0
2.0
4.0
6.0
8.0
10.0
12.0
14.0
Standard DeviationR
etur
ns
Rolling 12 Quarter Scatter Chart for 5 Years
CBf:Moderate 84-86 Idx
CBf Moderate 1984-1986
Ended March 31, 2015
22
MODERATE GROWTH 1984-1986 PORTFOLIOPERIOD ENDED MARCH 31, 2015
Moderate Growth 1984-1986
The AllianceBernstein Moderate Growth 1984-1986 Portfolio is designed for investors who seek a balance of return potential and risk management. The Portfolio invests in a diversified mix of AllianceBernstein’sEquity, Fixed Income and Alternative (Real Return and Volatility Management) strategies. For younger beneficiaries, the Portfolio invests more heavily in stocks and as the beneficiary nears college age, the allocation gradually becomes more conservative.
Last Quarter Last Year Last 2 Years Last 3 Years Last 5 Years
0.0
1.0
2.0
3.0
4.0
5.0
Cum
ulat
ive
Ret
urns
1.28
2.382.80
3.51 3.53
CBf Moderate 1984-1986 CBf:Moderate 84-86 Idx
1.14
2.66
3.243.60
4.42
Ende
d M
arch
31,
201
5

1 Qtr. 2015 2014 2013 2012 2011 2010
(2.0)
0.0
2.0
4.0
6.0
8.0
10.0
Cal
enda
r Ye
ar R
etur
ns
1.251.91
5.034.33
(0.68)
7.96
1.14
2.34
4.925.78
1.82
8.78
CBf Moderate 1987-1989 CBf:Moderate 87-89 Idx
0.0 2.0 4.0 6.0 8.0 10.0 12.0 14.0
(4.0)
(2.0)
0.0
2.0
4.0
6.0
8.0
10.0
12.0
14.0
Standard DeviationR
etur
ns
Rolling 12 Quarter Scatter Chart for 5 Years
CBf:Moderate 87-89 Idx
CBf Moderate 1987-1989
Ended March 31, 2015
23
MODERATE GROWTH 1987-1989 PORTFOLIOPERIOD ENDED MARCH 31, 2015
Moderate Growth 1987-1989
The AllianceBernstein Moderate Growth 1987-1989 Portfolio is designed for investors who seek a balance of return potential and risk management. The Portfolio invests in a diversified mix of AllianceBernstein’sEquity, Fixed Income and Alternative (Real Return and Volatility Management) strategies. For younger beneficiaries, the Portfolio invests more heavily in stocks and as the beneficiary nears college age, the allocation gradually becomes more conservative.
Last Quarter Last Year Last 2 Years Last 3 Years Last 5 Years
0.0
1.0
2.0
3.0
4.0
5.0
Cum
ulat
ive
Ret
urns
1.25
2.392.78
3.26 3.37
1.14
2.66
3.243.60
4.42
CBf Moderate 1987-1989 CBf:Moderate 87-89 Idx
Ende
d M
arch
31,
201
5

1 Qtr. 2015 2014 2013 2012 2011 2010
(2.0)
0.0
2.0
4.0
6.0
8.0
10.0
Cal
enda
r Ye
ar R
etur
ns
1.221.94
4.40 4.38
(0.76)
7.93
1.14
2.34
4.925.78
1.82
8.78
CBf Moderate 1990-1992 CBf:Moderate 90-92 Idx
0.0 2.0 4.0 6.0 8.0 10.0 12.0 14.0
(4.0)
(2.0)
0.0
2.0
4.0
6.0
8.0
10.0
12.0
14.0
Standard DeviationR
etur
ns
Rolling 12 Quarter Scatter Chart for 5 Years
CBf:Moderate 90-92 Idx
CBf Moderate 1990-1992
Ended March 31, 2015
24
MODERATE GROWTH 1990-1992 PORTFOLIOPERIOD ENDED MARCH 31, 2015
Moderate Growth 1990-1992
The AllianceBernstein Moderate Growth 1990-1992 Portfolio is designed for investors who seek a balance of return potential and risk management. The Portfolio invests in a diversified mix of AllianceBernstein’sEquity, Fixed Income and Alternative (Real Return and Volatility Management) strategies. For younger beneficiaries, the Portfolio invests more heavily in stocks and as the beneficiary nears college age, the allocation gradually becomes more conservative.
Last Quarter Last Year Last 2 Years Last 3 Years Last 5 Years
0.0
1.0
2.0
3.0
4.0
5.0
Cum
ulat
ive
Ret
urns
1.22
2.33
2.793.06
3.24
1.14
2.66
3.243.60
4.42
CBf Moderate 1990-1992 CBf:Moderate 90-92 Idx
Ende
d M
arch
31,
201
5
1 Qtr. 2015 2014 2013 2012 2011 2010
(2.0)
0.0
2.0
4.0
6.0
8.0
10.0
Cal
enda
r Ye
ar R
etur
ns
1.281.87
4.14 4.38
(0.78)
8.17
1.14
2.34
4.925.78
1.82
8.87
CBf Moderate 1993-1995 CBf:Moderate 93-95 Idx
0.0 2.0 4.0 6.0 8.0 10.0 12.0 14.0 16.0
(4.0)
(2.0)
0.0
2.0
4.0
6.0
8.0
10.0
12.0
14.0
Standard DeviationR
etur
ns
Rolling 12 Quarter Scatter Chart for 5 Years
CBf:Moderate 93-95 Idx
CBf Moderate 1993-1995
Ended March 31, 2015
25
MODERATE GROWTH 1993-1995 PORTFOLIOPERIOD ENDED MARCH 31, 2015
Moderate Growth 1993-1995
The AllianceBernstein Moderate Growth 1993-1995 Portfolio is designed for investors who seek a balance of return potential and risk management. The Portfolio invests in a diversified mix of AllianceBernstein’sEquity, Fixed Income and Alternative (Real Return and Volatility Management) strategies. For younger beneficiaries, the Portfolio invests more heavily in stocks and as the beneficiary nears college age, the allocation gradually becomes more conservative.
Last Quarter Last Year Last 2 Years Last 3 Years Last 5 Years
0.0
1.0
2.0
3.0
4.0
5.0
Cum
ulat
ive
Ret
urns
1.28
2.362.77
2.973.21
1.14
2.66
3.243.60
4.41
CBf Moderate 1993-1995 CBf:Moderate 93-95 Idx
Ende
d M
arch
31,
201
5
1 Qtr. 2015 2014 2013 2012 2011 2010
(5.0)
0.0
5.0
10.0
15.0
20.0
25.0
30.0
Cal
enda
r Ye
ar R
etur
ns
1.26 1.93
5.19 5.48
(1.80)
9.01
1.14 2.34
5.486.82
1.22
10.13
CBf Moderate 1996-1998 CBf:Moderate 96-98 Idx
0.0 5.0 10.0 15.0 20.0
(7.5)
(5.0)
(2.5)
0.0
2.5
5.0
7.5
10.0
12.5
15.0
17.5
Standard DeviationR
etur
ns
Rolling 12 Quarter Scatter Chart for 5 Years
CBf:Moderate 96-98 Idx
CBf Moderate 1996-1998
Ended March 31, 2015
26
MODERATE GROWTH 1996-1998 PORTFOLIOPERIOD ENDED MARCH 31, 2015
Moderate Growth 1996-1998
The AllianceBernstein Moderate Growth 1996-1998 Portfolio is designed for investors who seek a balance of return potential and risk management. The Portfolio invests in a diversified mix of AllianceBernstein’sEquity, Fixed Income and Alternative (Real Return and Volatility Management) strategies. For younger beneficiaries, the Portfolio invests more heavily in stocks and as the beneficiary nears college age, the allocation gradually becomes more conservative.
Last Quarter Last Year Last 2 Years Last 3 Years Last 5 Years
0.0
1.0
2.0
3.0
4.0
5.0
6.0
Cum
ulat
ive
Ret
urns
1.26
2.33
3.15 3.303.53
1.14
2.66
3.383.83
4.76
CBf Moderate 1996-1998 CBf:Moderate 96-98 Idx
Ende
d M
arch
31,
201
5
1 Qtr. 2015 2014 2013 2012 2011 2010
(5.0)
0.0
5.0
10.0
15.0
Cal
enda
r Ye
ar R
etur
ns
1.46 2.06
8.297.16
(3.03)
9.71
1.322.69
8.47 8.95
0.51
11.23
CBf Moderate 1999-2001 CBf:Moderate 99-01 Idx
2.0 4.0 6.0 8.0 10.0 12.0 14.0 16.0 18.0 20.0 22.0
(10.0)
(5.0)
0.0
5.0
10.0
15.0
20.0
Standard DeviationR
etur
ns
Rolling 12 Quarter Scatter Chart for 5 Years
CBf:Moderate 99-01 Idx
CBf Moderate 1999-2001
Ended March 31, 2015
27
MODERATE GROWTH 1999-2001 PORTFOLIOPERIOD ENDED MARCH 31, 2015
Moderate Growth 1999-2001
The AllianceBernstein Moderate Growth 1999-2001 Portfolio is designed for investors who seek a balance of return potential and risk management. The Portfolio invests in a diversified mix of AllianceBernstein’sEquity, Fixed Income and Alternative (Real Return and Volatility Management) strategies. For younger beneficiaries, the Portfolio invests more heavily in stocks and as the beneficiary nears college age, the allocation gradually becomes more conservative.
Last Quarter Last Year Last 2 Years Last 3 Years Last 5 Years
0.0
1.0
2.0
3.0
4.0
5.0
6.0
7.0
Cum
ulat
ive
Ret
urns
1.46
2.67
4.42 4.45 4.35
1.32
3.03
4.645.14
5.87
CBf Moderate 1999-2001 CBf:Moderate 99-01 Idx
Ende
d M
arch
31,
201
5
1 Qtr. 2015 2014 2013 2012 2011 2010
(6.0)
(4.0)
(2.0)
0.0
2.0
4.0
6.0
8.0
10.0
12.0
14.0
Cal
enda
r Ye
ar R
etur
ns
1.87 2.48
11.93
9.08
(4.23)
10.42
1.623.23
11.92 11.24
(0.36)
12.33
CBf Moderate 2002-2004 CBf:Moderate 02-04 Idx
2.5 5.0 7.5 10.0 12.5 15.0 17.5 20.0 22.5 25.0
(15.0)
(10.0)
(5.0)
0.0
5.0
10.0
15.0
20.0
25.0
Standard DeviationR
etur
ns
Rolling 12 Quarter Scatter Chart for 5 Years
CBf:Moderate 02-04 Idx
CBf Moderate 2002-2004
Ended March 31, 2015
28
MODERATE GROWTH 2002-2004 PORTFOLIOPERIOD ENDED MARCH 31, 2015
Moderate Growth 2002-2004
The AllianceBernstein Moderate Growth 2002-2004 Portfolio is designed for investors who seek a balance of return potential and risk management. The Portfolio invests in a diversified mix of AllianceBernstein’sEquity, Fixed Income and Alternative (Real Return and Volatility Management) strategies. For younger beneficiaries, the Portfolio invests more heavily in stocks and as the beneficiary nears college age, the allocation gradually becomes more conservative.
Last Quarter Last Year Last 2 Years Last 3 Years Last 5 Years
0.0
2.0
4.0
6.0
8.0
Cum
ulat
ive
Ret
urns
1.87
3.29
6.08 5.935.43
1.62
3.68
6.216.70
7.12
CBf Moderate 2002-2004 CBf:Moderate 02-04 Idx
Ende
d M
arch
31,
201
5

1 Qtr. 2015 2014 2013 2012 2011 2010
(10.0)
(5.0)
0.0
5.0
10.0
15.0
20.0
Cal
enda
r Ye
ar R
etur
ns
2.18 2.79
15.19
11.16
(5.51)
10.95
1.903.55
15.2412.78
(1.31)
13.20
CBf Moderate 2005-2007 CBf:Moderate 05-07 Idx
2.5 5.0 7.5 10.0 12.5 15.0 17.5 20.0 22.5 25.0 27.5
(15.0)
(10.0)
(5.0)
0.0
5.0
10.0
15.0
20.0
25.0
Standard DeviationR
etur
ns
Rolling 12 Quarter Scatter Chart for 5 Years
CBf:Moderate 05-07 Idx
CBf Moderate 2005-2007
Ended March 31, 2015
29
MODERATE GROWTH 2005-2007 PORTFOLIOPERIOD ENDED MARCH 31, 2015
Moderate Growth 2005-2007
The AllianceBernstein Moderate Growth 2005-2007 Portfolio is designed for investors who seek a balance of return potential and risk management. The Portfolio invests in a diversified mix of AllianceBernstein’sEquity, Fixed Income and Alternative (Real Return and Volatility Management) strategies. For younger beneficiaries, the Portfolio invests more heavily in stocks and as the beneficiary nears college age, the allocation gradually becomes more conservative.
Last Quarter Last Year Last 2 Years Last 3 Years Last 5 Years
0.0
1.0
2.0
3.0
4.0
5.0
6.0
7.0
8.0
9.0
Cum
ulat
ive
Ret
urns
2.18
3.76
7.46 7.21
6.33
1.90
4.12
7.638.03 8.06
CBf Moderate 2005-2007 CBf:Moderate 05-07 Idx
Ende
d M
arch
31,
201
5
1 Qtr. 2015 2014 2013 2012 2011 2010
(10.0)
(5.0)
0.0
5.0
10.0
15.0
20.0
25.0
Cal
enda
r Ye
ar R
etur
ns
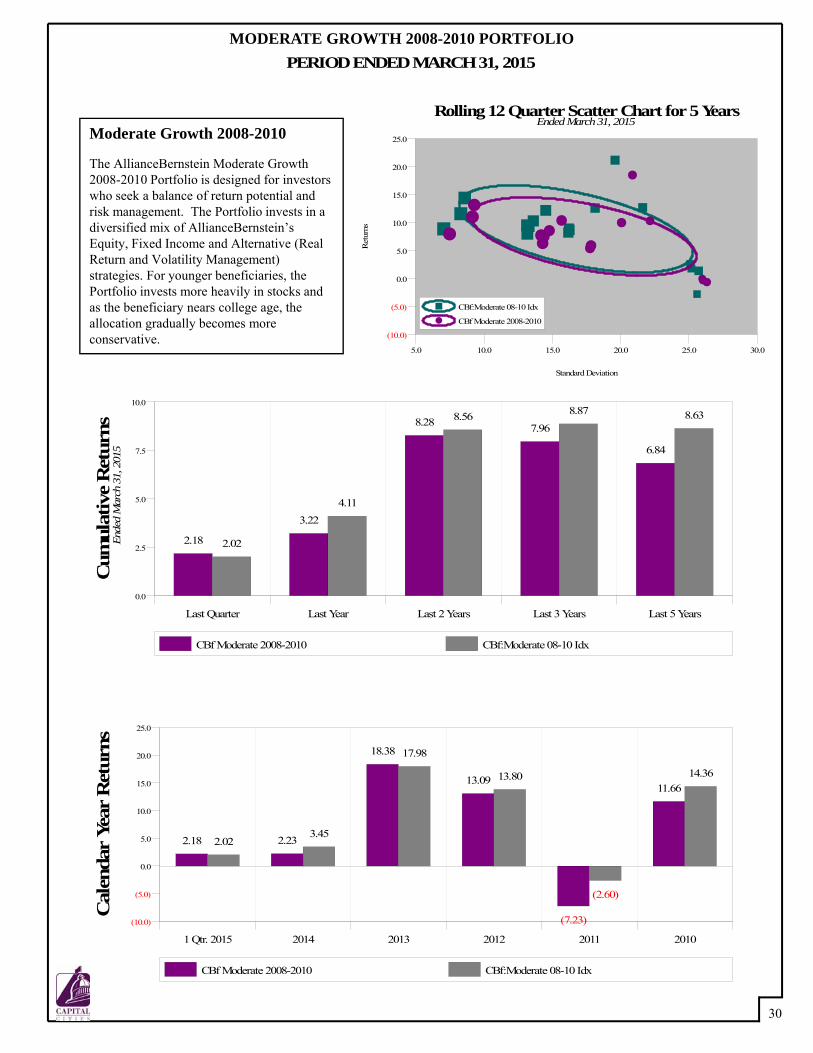
2.18 2.23
18.38
13.09
(7.23)
11.66
2.023.45
17.98
13.80
(2.60)
14.36
CBf Moderate 2008-2010 CBf:Moderate 08-10 Idx
5.0 10.0 15.0 20.0 25.0 30.0
(10.0)
(5.0)
0.0
5.0
10.0
15.0
20.0
25.0
Standard DeviationR
etur
ns
Rolling 12 Quarter Scatter Chart for 5 Years
CBf:Moderate 08-10 Idx
CBf Moderate 2008-2010
Ended March 31, 2015
30
MODERATE GROWTH 2008-2010 PORTFOLIOPERIOD ENDED MARCH 31, 2015
Moderate Growth 2008-2010
The AllianceBernstein Moderate Growth 2008-2010 Portfolio is designed for investors who seek a balance of return potential and risk management. The Portfolio invests in a diversified mix of AllianceBernstein’sEquity, Fixed Income and Alternative (Real Return and Volatility Management) strategies. For younger beneficiaries, the Portfolio invests more heavily in stocks and as the beneficiary nears college age, the allocation gradually becomes more conservative.
Last Quarter Last Year Last 2 Years Last 3 Years Last 5 Years
0.0
2.5
5.0
7.5
10.0
Cum
ulat
ive
Ret
urns
2.18
3.22
8.28 7.96
6.84
2.02
4.11
8.56 8.87 8.63
CBf Moderate 2008-2010 CBf:Moderate 08-10 Idx
Ende
d M
arch
31,
201
5

1 Qtr. 2015 2014 2013 2012 2011 2010
0.0
5.0
10.0
15.0
20.0
25.0
Cal
enda
r Ye
ar R
etur
ns
1.96 1.41
21.11
14.63
2.043.29
20.57
14.95
CBf Moderate 2011-2013 CBf:Moderate 11-13 Idx
6.0 8.0 10.0 12.0 14.0 16.0 18.0
6.0
8.0
10.0
12.0
14.0
16.0
18.0
Standard DeviationR
etur
ns
Rolling 12 Quarter Scatter Chart for 5 Years
CBf:Moderate 11-13 Idx
CBf Moderate 2011-2013
Ended March 31, 2015
31
MODERATE GROWTH 2011-2013 PORTFOLIOPERIOD ENDED MARCH 31, 2015
Moderate Growth 2011-2013
The AllianceBernstein Moderate Growth 2011-2013 Portfolio is designed for investors who seek a balance of return potential and risk management. The Portfolio invests in a diversified mix of AllianceBernstein’sEquity, Fixed Income and Alternative (Real Return and Volatility Management) strategies. For younger beneficiaries, the Portfolio invests more heavily in stocks and as the beneficiary nears college age, the allocation gradually becomes more conservative.
Last Quarter Last Year Last 2 Years Last 3 Years Last 5 Years
0.0
2.0
4.0
6.0
8.0
10.0
12.0
Cum
ulat
ive
Ret
urns
1.96 2.29
8.62 8.41
2.04
3.90
9.33 9.61
CBf Moderate 2011-2013 CBf:Moderate 11-13 Idx
Ende
d M
arch
31,
201
5
Inception Date: March 8, 2011
1 Qtr. 2015 2014 2013 2012 2011 2010
0.0
0.5
1.0
1.5
2.0
2.5
Cal
enda
r Ye
ar R
etur
ns
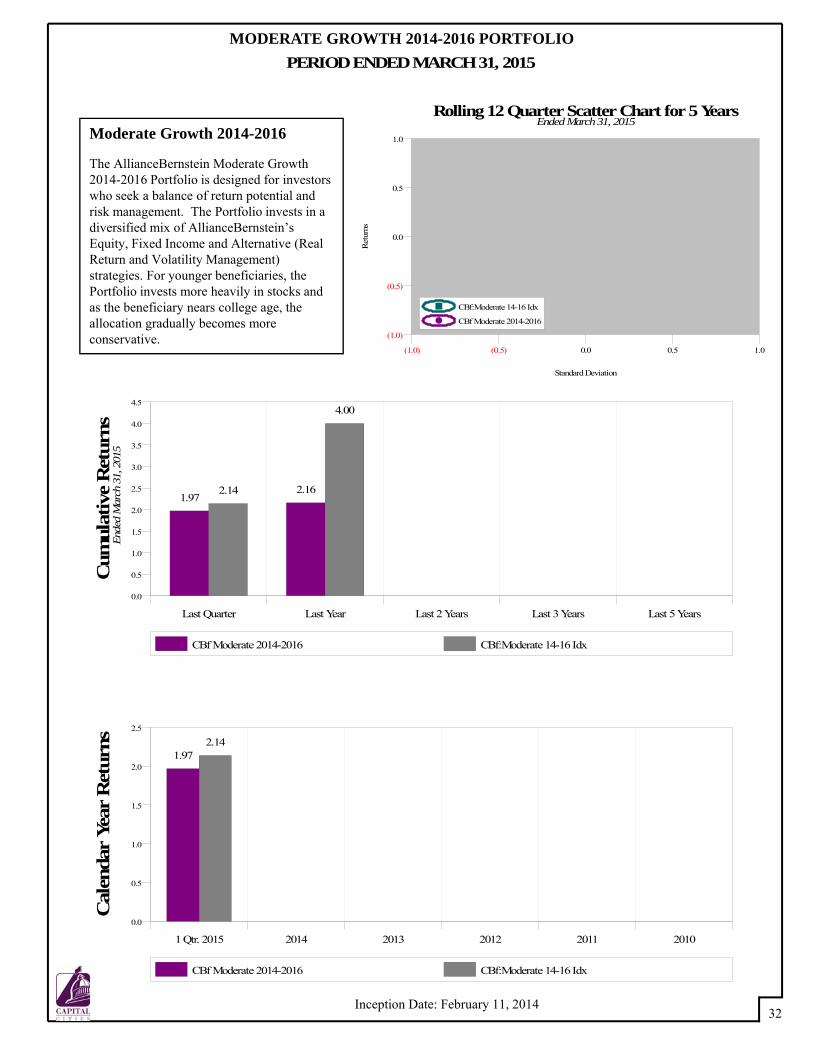
1.972.14
CBf Moderate 2014-2016 CBf:Moderate 14-16 Idx
(1.0) (0.5) 0.0 0.5 1.0
(1.0)
(0.5)
0.0
0.5
1.0
Standard DeviationR
etur
ns
Rolling 12 Quarter Scatter Chart for 5 Years
CBf:Moderate 14-16 Idx
CBf Moderate 2014-2016
Ended March 31, 2015
32
MODERATE GROWTH 2014-2016 PORTFOLIOPERIOD ENDED MARCH 31, 2015
Moderate Growth 2014-2016
The AllianceBernstein Moderate Growth 2014-2016 Portfolio is designed for investors who seek a balance of return potential and risk management. The Portfolio invests in a diversified mix of AllianceBernstein’sEquity, Fixed Income and Alternative (Real Return and Volatility Management) strategies. For younger beneficiaries, the Portfolio invests more heavily in stocks and as the beneficiary nears college age, the allocation gradually becomes more conservative.
Last Quarter Last Year Last 2 Years Last 3 Years Last 5 Years
0.0
0.5
1.0
1.5
2.0
2.5
3.0
3.5
4.0
4.5
Cum
ulat
ive
Ret
urns
1.972.162.14
4.00
CBf Moderate 2014-2016 CBf:Moderate 14-16 Idx
Ende
d M
arch
31,
201
5
Inception Date: February 11, 2014
1 Qtr. 2015 2014 2013 2012 2011 2010
0.0
1.0
2.0
3.0
4.0
5.0
6.0
7.0
Cal
enda
r Ye
ar R
etur
ns
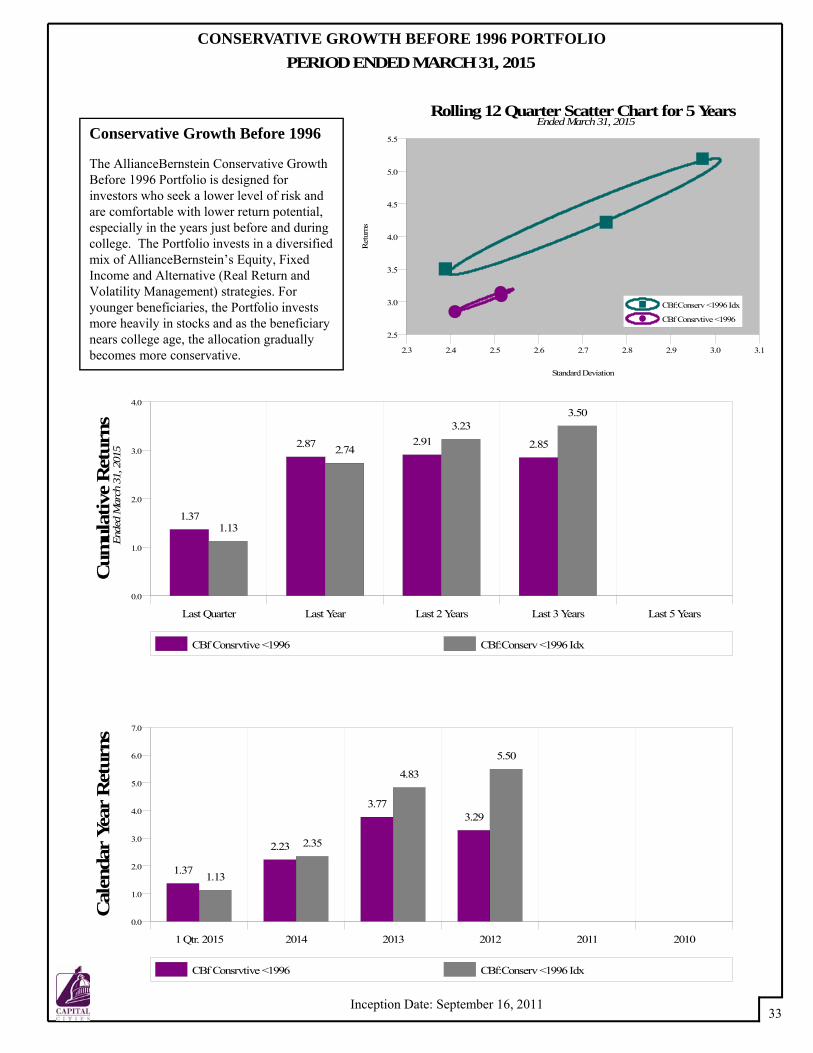
1.37
2.23
3.773.29
1.13
2.35
4.83
5.50
CBf Consrvtive <1996 CBf:Conserv <1996 Idx
2.3 2.4 2.5 2.6 2.7 2.8 2.9 3.0 3.1
2.5
3.0
3.5
4.0
4.5
5.0
5.5
Standard DeviationR
etur
ns
Rolling 12 Quarter Scatter Chart for 5 Years
CBf:Conserv <1996 Idx
CBf Consrvtive <1996
Ended March 31, 2015
33
CONSERVATIVE GROWTH BEFORE 1996 PORTFOLIOPERIOD ENDED MARCH 31, 2015
Conservative Growth Before 1996
The AllianceBernstein Conservative Growth Before 1996 Portfolio is designed for investors who seek a lower level of risk and are comfortable with lower return potential, especially in the years just before and during college. The Portfolio invests in a diversified mix of AllianceBernstein’s Equity, Fixed Income and Alternative (Real Return and Volatility Management) strategies. For younger beneficiaries, the Portfolio invests more heavily in stocks and as the beneficiary nears college age, the allocation gradually becomes more conservative.
Last Quarter Last Year Last 2 Years Last 3 Years Last 5 Years
0.0
1.0
2.0
3.0
4.0
Cum
ulat
ive
Ret
urns
1.37
2.87 2.91 2.85
1.13
2.74
3.233.50
CBf Consrvtive <1996 CBf:Conserv <1996 Idx
Ende
d M
arch
31,
201
5
Inception Date: September 16, 2011
1 Qtr. 2015 2014 2013 2012 2011 2010
0.0
1.0
2.0
3.0
4.0
5.0
6.0
7.0
Cal
enda
r Ye
ar R
etur
ns
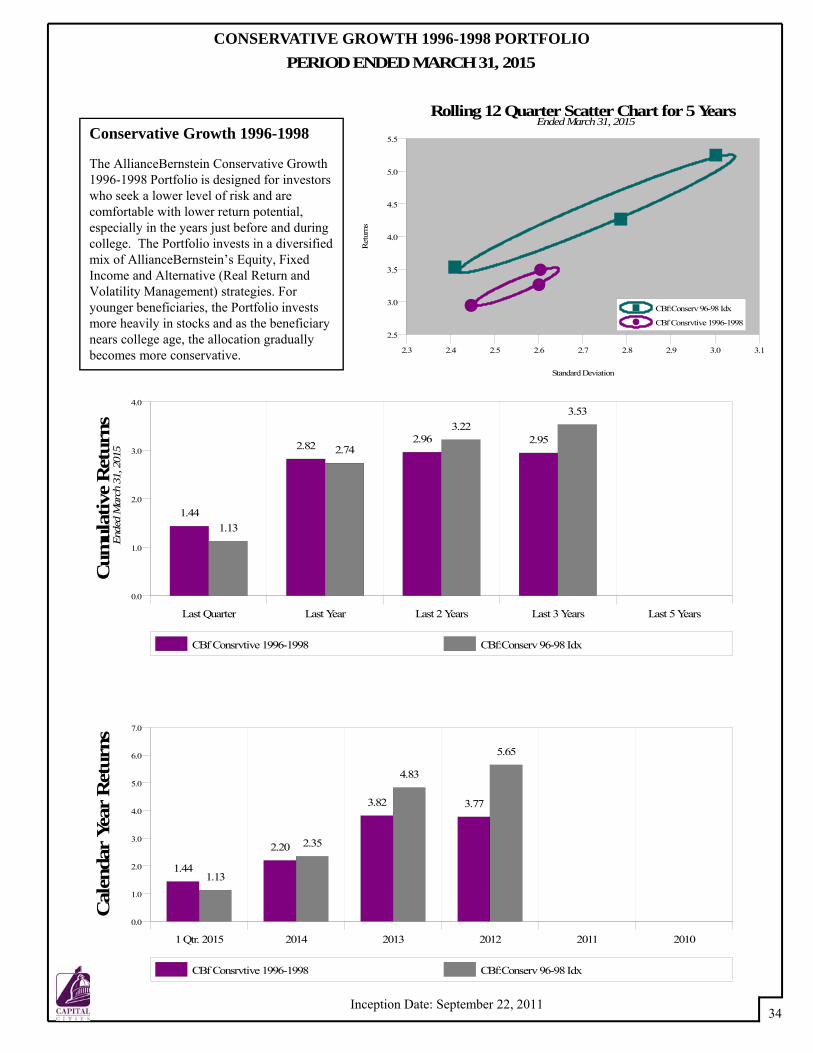
1.44
2.20
3.82 3.77
1.13
2.35
4.83
5.65
CBf Consrvtive 1996-1998 CBf:Conserv 96-98 Idx
2.3 2.4 2.5 2.6 2.7 2.8 2.9 3.0 3.1
2.5
3.0
3.5
4.0
4.5
5.0
5.5
Standard DeviationR
etur
ns
Rolling 12 Quarter Scatter Chart for 5 Years
CBf:Conserv 96-98 Idx
CBf Consrvtive 1996-1998
Ended March 31, 2015
34
CONSERVATIVE GROWTH 1996-1998 PORTFOLIOPERIOD ENDED MARCH 31, 2015
Conservative Growth 1996-1998
The AllianceBernstein Conservative Growth 1996-1998 Portfolio is designed for investors who seek a lower level of risk and are comfortable with lower return potential, especially in the years just before and during college. The Portfolio invests in a diversified mix of AllianceBernstein’s Equity, Fixed Income and Alternative (Real Return and Volatility Management) strategies. For younger beneficiaries, the Portfolio invests more heavily in stocks and as the beneficiary nears college age, the allocation gradually becomes more conservative.
Last Quarter Last Year Last 2 Years Last 3 Years Last 5 Years
0.0
1.0
2.0
3.0
4.0
Cum
ulat
ive
Ret
urns
1.44
2.82 2.96 2.95
1.13
2.74
3.223.53
CBf Consrvtive 1996-1998 CBf:Conserv 96-98 Idx
Ende
d M
arch
31,
201
5
Inception Date: September 22, 2011
1 Qtr. 2015 2014 2013 2012 2011 2010
0.0
2.0
4.0
6.0
8.0
Cal
enda
r Ye
ar R
etur
ns
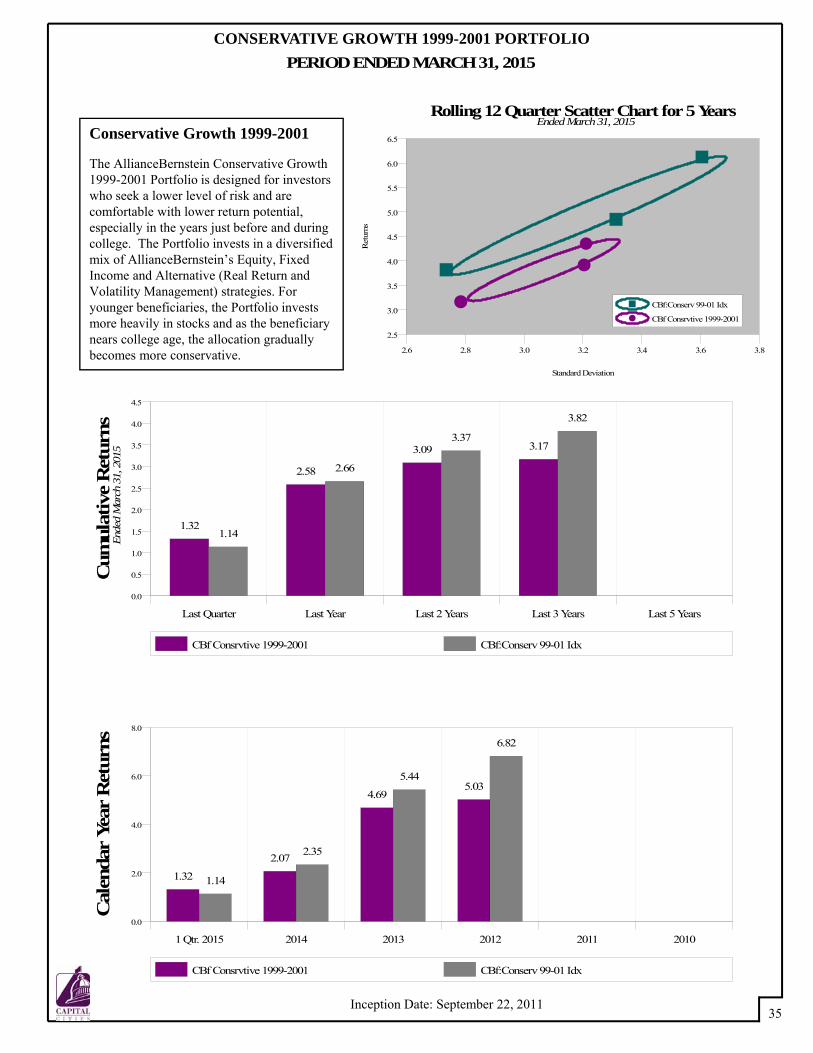
1.32
2.07
4.695.03
1.14
2.35
5.44
6.82
CBf Consrvtive 1999-2001 CBf:Conserv 99-01 Idx
2.6 2.8 3.0 3.2 3.4 3.6 3.8
2.5
3.0
3.5
4.0
4.5
5.0
5.5
6.0
6.5
Standard DeviationR
etur
ns
Rolling 12 Quarter Scatter Chart for 5 Years
CBf:Conserv 99-01 Idx
CBf Consrvtive 1999-2001
Ended March 31, 2015
35
CONSERVATIVE GROWTH 1999-2001 PORTFOLIOPERIOD ENDED MARCH 31, 2015
Conservative Growth 1999-2001
The AllianceBernstein Conservative Growth 1999-2001 Portfolio is designed for investors who seek a lower level of risk and are comfortable with lower return potential, especially in the years just before and during college. The Portfolio invests in a diversified mix of AllianceBernstein’s Equity, Fixed Income and Alternative (Real Return and Volatility Management) strategies. For younger beneficiaries, the Portfolio invests more heavily in stocks and as the beneficiary nears college age, the allocation gradually becomes more conservative.
Last Quarter Last Year Last 2 Years Last 3 Years Last 5 Years
0.0
0.5
1.0
1.5
2.0
2.5
3.0
3.5
4.0
4.5
Cum
ulat
ive
Ret
urns
1.32
2.58
3.09 3.17
1.14
2.66
3.37
3.82
CBf Consrvtive 1999-2001 CBf:Conserv 99-01 Idx
Ende
d M
arch
31,
201
5
Inception Date: September 22, 2011
1 Qtr. 2015 2014 2013 2012 2011 2010
0.0
2.5
5.0
7.5
10.0
Cal
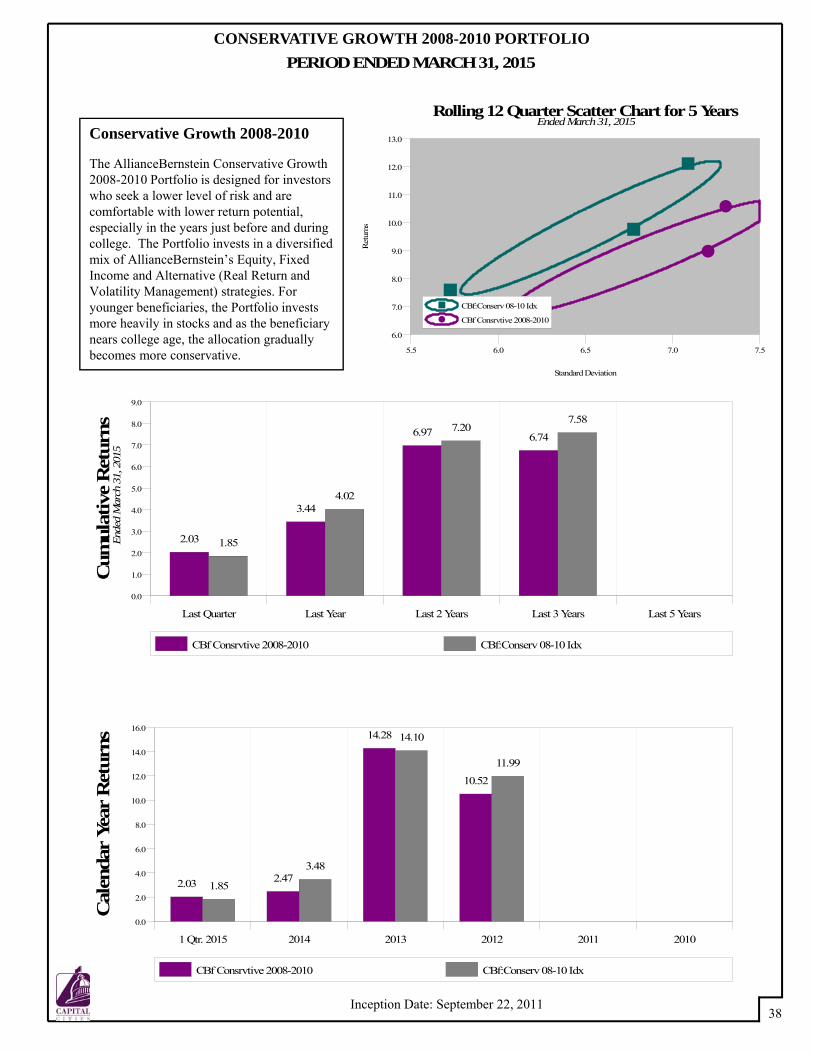
enda
r Ye
ar R
etur
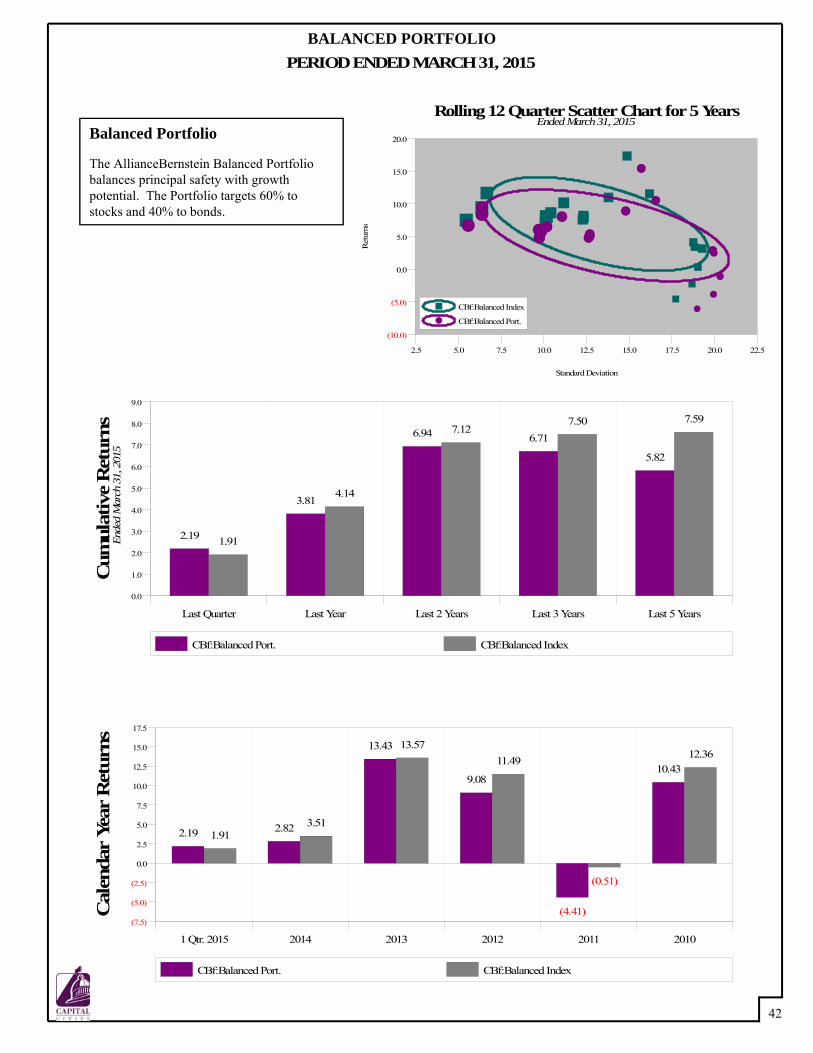
ns
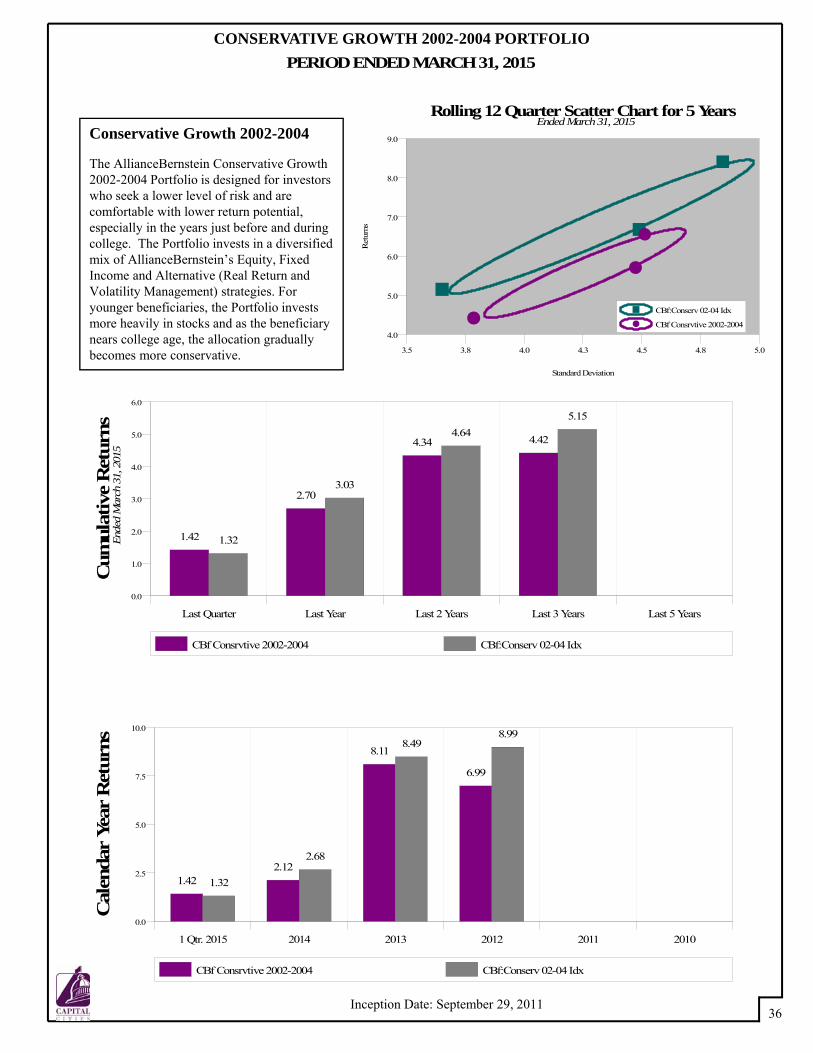
1.422.12
8.11
6.99
1.32
2.68
8.498.99
CBf Consrvtive 2002-2004 CBf:Conserv 02-04 Idx
3.5 3.8 4.0 4.3 4.5 4.8 5.0
4.0
5.0
6.0
7.0
8.0
9.0
Standard DeviationR
etur
ns
Rolling 12 Quarter Scatter Chart for 5 Years
CBf:Conserv 02-04 Idx
CBf Consrvtive 2002-2004
Ended March 31, 2015
36
CONSERVATIVE GROWTH 2002-2004 PORTFOLIOPERIOD ENDED MARCH 31, 2015
Conservative Growth 2002-2004
The AllianceBernstein Conservative Growth 2002-2004 Portfolio is designed for investors who seek a lower level of risk and are comfortable with lower return potential, especially in the years just before and during college. The Portfolio invests in a diversified mix of AllianceBernstein’s Equity, Fixed Income and Alternative (Real Return and Volatility Management) strategies. For younger beneficiaries, the Portfolio invests more heavily in stocks and as the beneficiary nears college age, the allocation gradually becomes more conservative.
Last Quarter Last Year Last 2 Years Last 3 Years Last 5 Years
0.0
1.0
2.0
3.0
4.0
5.0
6.0
Cum
ulat
ive
Ret
urns
1.42
2.70
4.34 4.42
1.32
3.03
4.645.15
CBf Consrvtive 2002-2004 CBf:Conserv 02-04 Idx
Ende
d M
arch
31,
201
5
Inception Date: September 29, 2011
1 Qtr. 2015 2014 2013 2012 2011 2010
0.0
2.0
4.0
6.0
8.0
10.0
12.0
14.0
Cal
enda
r Ye
ar R
etur
ns
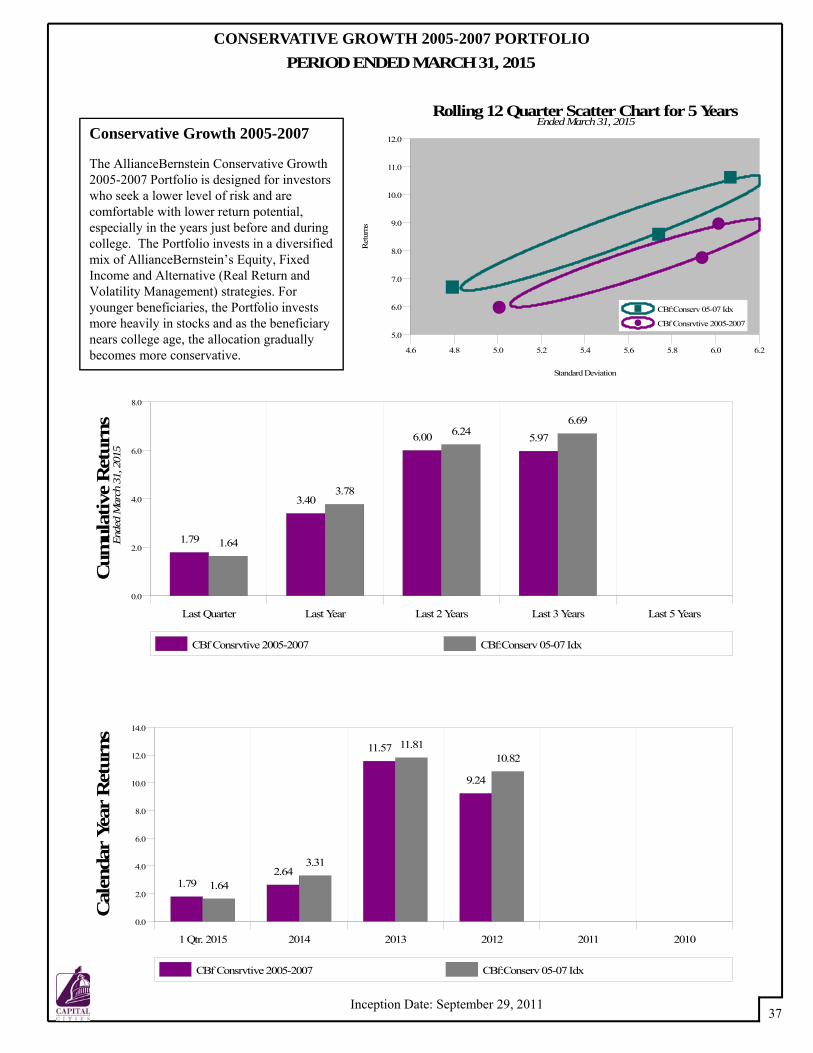
1.792.64
11.57
9.24
1.64
3.31
11.8110.82
CBf Consrvtive 2005-2007 CBf:Conserv 05-07 Idx
4.6 4.8 5.0 5.2 5.4 5.6 5.8 6.0 6.2
5.0
6.0
7.0
8.0
9.0
10.0
11.0
12.0
Standard DeviationR
etur
ns
Rolling 12 Quarter Scatter Chart for 5 Years
CBf:Conserv 05-07 Idx
CBf Consrvtive 2005-2007
Ended March 31, 2015
37
CONSERVATIVE GROWTH 2005-2007 PORTFOLIOPERIOD ENDED MARCH 31, 2015
Conservative Growth 2005-2007
The AllianceBernstein Conservative Growth 2005-2007 Portfolio is designed for investors who seek a lower level of risk and are comfortable with lower return potential, especially in the years just before and during college. The Portfolio invests in a diversified mix of AllianceBernstein’s Equity, Fixed Income and Alternative (Real Return and Volatility Management) strategies. For younger beneficiaries, the Portfolio invests more heavily in stocks and as the beneficiary nears college age, the allocation gradually becomes more conservative.
Last Quarter Last Year Last 2 Years Last 3 Years Last 5 Years
0.0
2.0
4.0
6.0
8.0
Cum
ulat
ive
Ret
urns
1.79
3.40
6.00 5.97
1.64
3.78
6.246.69
CBf Consrvtive 2005-2007 CBf:Conserv 05-07 Idx
Ende
d M
arch
31,
201
5
Inception Date: September 29, 2011
1 Qtr. 2015 2014 2013 2012 2011 2010
0.0
2.0
4.0
6.0
8.0
10.0
12.0
14.0
16.0
Cal
enda
r Ye
ar R
etur
ns
2.03 2.47
14.28
10.52
1.85
3.48
14.10
11.99
CBf Consrvtive 2008-2010 CBf:Conserv 08-10 Idx
5.5 6.0 6.5 7.0 7.5
6.0
7.0
8.0
9.0
10.0
11.0
12.0
13.0
Standard DeviationR
etur
ns
Rolling 12 Quarter Scatter Chart for 5 Years
CBf:Conserv 08-10 Idx
CBf Consrvtive 2008-2010
Ended March 31, 2015
38
CONSERVATIVE GROWTH 2008-2010 PORTFOLIOPERIOD ENDED MARCH 31, 2015
Conservative Growth 2008-2010
The AllianceBernstein Conservative Growth 2008-2010 Portfolio is designed for investors who seek a lower level of risk and are comfortable with lower return potential, especially in the years just before and during college. The Portfolio invests in a diversified mix of AllianceBernstein’s Equity, Fixed Income and Alternative (Real Return and Volatility Management) strategies. For younger beneficiaries, the Portfolio invests more heavily in stocks and as the beneficiary nears college age, the allocation gradually becomes more conservative.
Last Quarter Last Year Last 2 Years Last 3 Years Last 5 Years
0.0
1.0
2.0
3.0
4.0
5.0
6.0
7.0
8.0
9.0
Cum
ulat
ive
Ret
urns
2.03
3.44
6.97 6.74
1.85
4.02
7.207.58
CBf Consrvtive 2008-2010 CBf:Conserv 08-10 Idx
Ende
d M
arch
31,
201
5
Inception Date: September 22, 2011
1 Qtr. 2015 2014 2013 2012 2011 2010
0.0
2.0
4.0
6.0
8.0
10.0
12.0
14.0
16.0
18.0
Cal
enda
r Ye
ar R
etur
ns
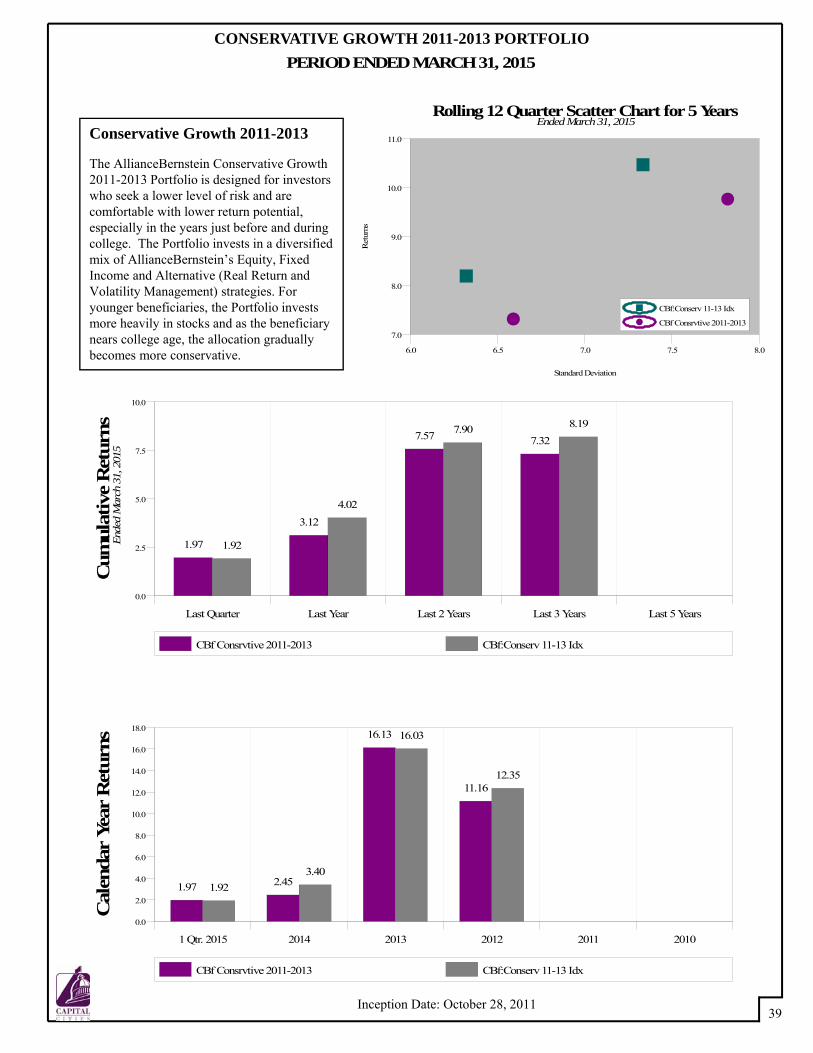
1.97 2.45
16.13
11.16
1.923.40
16.03
12.35
CBf Consrvtive 2011-2013 CBf:Conserv 11-13 Idx
6.0 6.5 7.0 7.5 8.0
7.0
8.0
9.0
10.0
11.0
Standard DeviationR
etur
ns
Rolling 12 Quarter Scatter Chart for 5 Years
CBf:Conserv 11-13 Idx
CBf Consrvtive 2011-2013
Ended March 31, 2015
39
CONSERVATIVE GROWTH 2011-2013 PORTFOLIOPERIOD ENDED MARCH 31, 2015
Conservative Growth 2011-2013
The AllianceBernstein Conservative Growth 2011-2013 Portfolio is designed for investors who seek a lower level of risk and are comfortable with lower return potential, especially in the years just before and during college. The Portfolio invests in a diversified mix of AllianceBernstein’s Equity, Fixed Income and Alternative (Real Return and Volatility Management) strategies. For younger beneficiaries, the Portfolio invests more heavily in stocks and as the beneficiary nears college age, the allocation gradually becomes more conservative.
Last Quarter Last Year Last 2 Years Last 3 Years Last 5 Years
0.0
2.5
5.0
7.5
10.0
Cum
ulat
ive
Ret
urns
1.97
3.12
7.57 7.32
1.92
4.02
7.90 8.19
CBf Consrvtive 2011-2013 CBf:Conserv 11-13 Idx
Ende
d M
arch
31,
201
5
Inception Date: October 28, 2011
1 Qtr. 2015 2014 2013 2012 2011 2010
0.0
0.3
0.5
0.8
1.0
1.3
1.5
1.8
2.0
2.3
Cal
enda
r Ye
ar R
etur
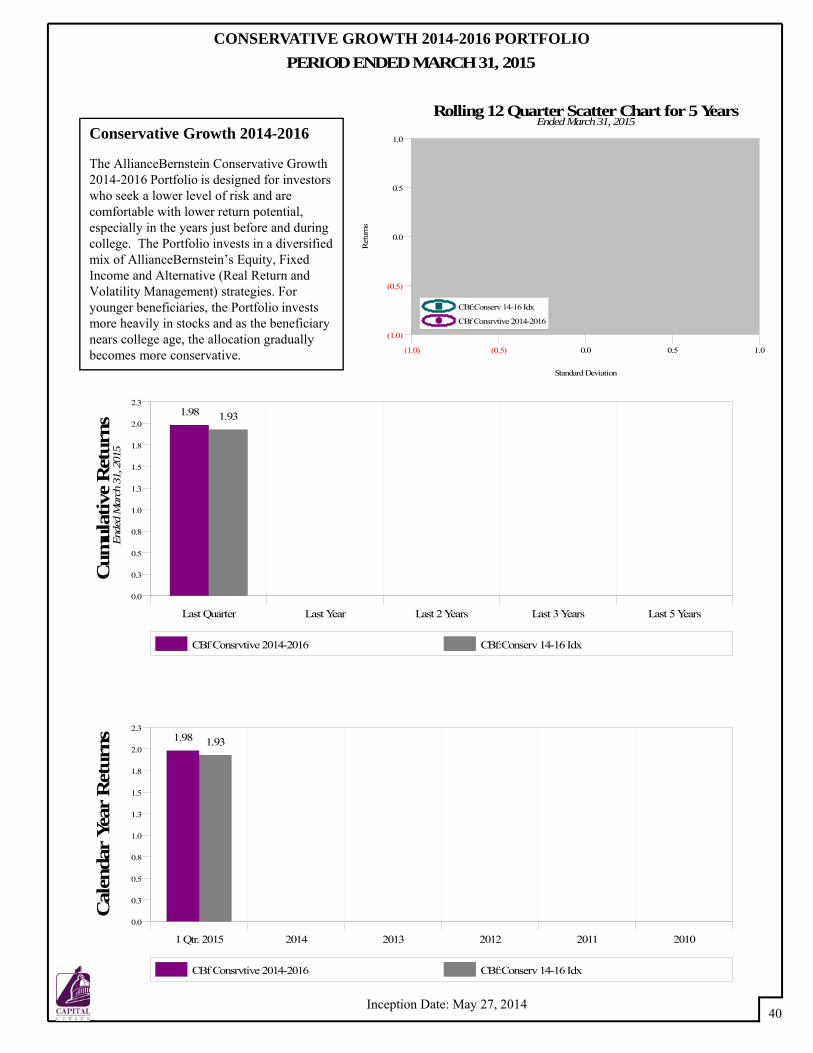
ns 1.98 1.93
CBf Consrvtive 2014-2016 CBf:Conserv 14-16 Idx
(1.0) (0.5) 0.0 0.5 1.0
(1.0)
(0.5)
0.0
0.5
1.0
Standard DeviationR
etur
ns
Rolling 12 Quarter Scatter Chart for 5 Years
CBf:Conserv 14-16 Idx
CBf Consrvtive 2014-2016
Ended March 31, 2015
40
CONSERVATIVE GROWTH 2014-2016 PORTFOLIOPERIOD ENDED MARCH 31, 2015
Conservative Growth 2014-2016
The AllianceBernstein Conservative Growth 2014-2016 Portfolio is designed for investors who seek a lower level of risk and are comfortable with lower return potential, especially in the years just before and during college. The Portfolio invests in a diversified mix of AllianceBernstein’s Equity, Fixed Income and Alternative (Real Return and Volatility Management) strategies. For younger beneficiaries, the Portfolio invests more heavily in stocks and as the beneficiary nears college age, the allocation gradually becomes more conservative.
Last Quarter Last Year Last 2 Years Last 3 Years Last 5 Years
0.0
0.3
0.5
0.8
1.0
1.3
1.5
1.8
2.0
2.3
Cum
ulat
ive
Ret
urns
1.98 1.93
CBf Consrvtive 2014-2016 CBf:Conserv 14-16 Idx
Ende
d M
arch
31,
201
5
Inception Date: May 27, 2014
1 Qtr. 2015 2014 2013 2012 2011 2010
(15.0)
(10.0)
(5.0)
0.0
5.0
10.0
15.0
20.0
25.0
30.0
Cal
enda
r Ye
ar R
etur
ns
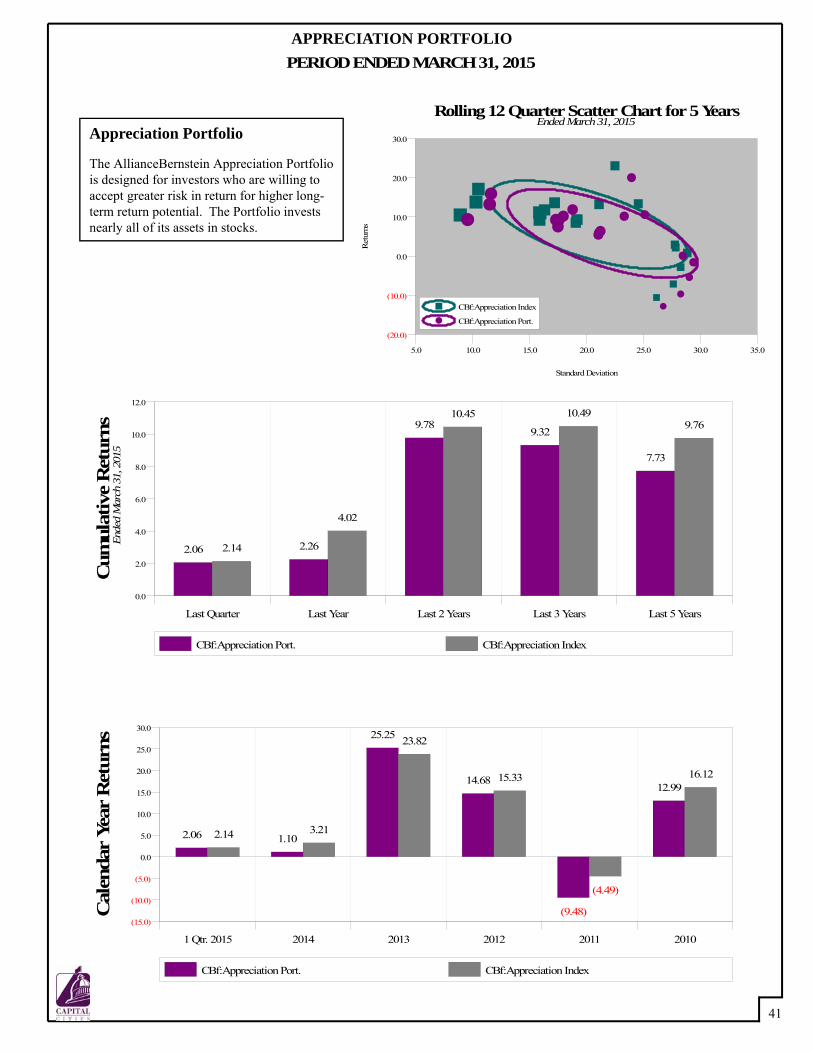
2.06 1.10
25.25
14.68
(9.48)
12.99
2.14 3.21
23.82
15.33
(4.49)
16.12
CBf:Appreciation Port. CBf:Appreciation Index
5.0 10.0 15.0 20.0 25.0 30.0 35.0
(20.0)
(10.0)
0.0
10.0
20.0
30.0
Standard DeviationR
etur
ns
Rolling 12 Quarter Scatter Chart for 5 Years
CBf:Appreciation Index
CBf:Appreciation Port.
Ended March 31, 2015
41
APPRECIATION PORTFOLIOPERIOD ENDED MARCH 31, 2015
Appreciation Portfolio
The AllianceBernstein Appreciation Portfolio is designed for investors who are willing to accept greater risk in return for higher long-term return potential. The Portfolio invests nearly all of its assets in stocks.
Last Quarter Last Year Last 2 Years Last 3 Years Last 5 Years
0.0
2.0
4.0
6.0
8.0
10.0
12.0
Cum
ulat
ive
Ret
urns
2.06 2.26
9.789.32
7.73
2.14
4.02
10.45 10.499.76
CBf:Appreciation Port. CBf:Appreciation Index
Ende
d M
arch
31,
201
5
1 Qtr. 2015 2014 2013 2012 2011 2010
(7.5)
(5.0)
(2.5)
0.0
2.5
5.0
7.5
10.0
12.5
15.0
17.5
Cal
enda
r Ye
ar R
etur
ns
2.19 2.82
13.43
9.08
(4.41)
10.43
1.913.51
13.5711.49
(0.51)
12.36
CBf:Balanced Port. CBf:Balanced Index
2.5 5.0 7.5 10.0 12.5 15.0 17.5 20.0 22.5
(10.0)
(5.0)
0.0
5.0
10.0
15.0
20.0
Standard DeviationR
etur
ns
Rolling 12 Quarter Scatter Chart for 5 Years
CBf:Balanced Index
CBf:Balanced Port.
Ended March 31, 2015
42
BALANCED PORTFOLIOPERIOD ENDED MARCH 31, 2015
Last Quarter Last Year Last 2 Years Last 3 Years Last 5 Years
0.0
1.0
2.0
3.0
4.0
5.0
6.0
7.0
8.0
9.0
Cum
ulat
ive
Ret
urns
2.19
3.81
6.94 6.71
5.82
1.91
4.14
7.127.50 7.59
CBf:Balanced Port. CBf:Balanced Index
Ende
d M
arch
31,
201
5
Balanced Portfolio
The AllianceBernstein Balanced Portfolio balances principal safety with growth potential. The Portfolio targets 60% to stocks and 40% to bonds.
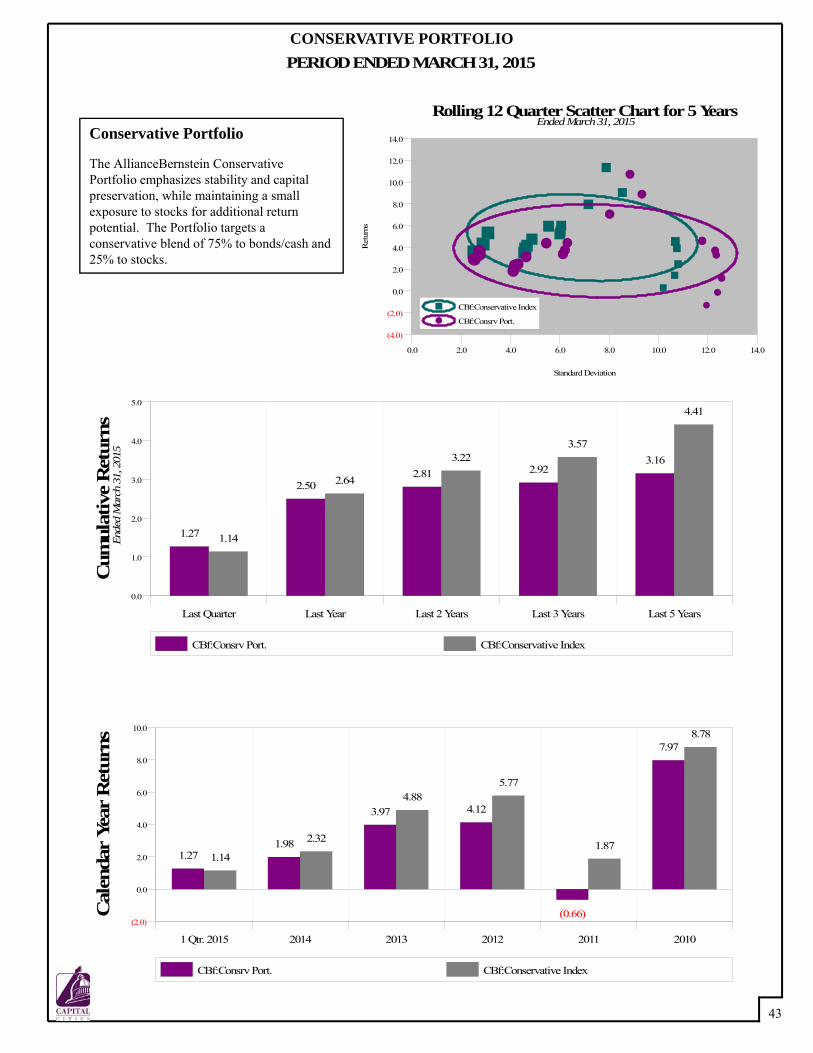
1 Qtr. 2015 2014 2013 2012 2011 2010
(2.0)
0.0
2.0
4.0
6.0
8.0
10.0
Cal
enda
r Ye
ar R
etur
ns
1.271.98
3.97 4.12
(0.66)
7.97
1.14
2.32
4.885.77
1.87
8.78
CBf:Consrv Port. CBf:Conservative Index
0.0 2.0 4.0 6.0 8.0 10.0 12.0 14.0
(4.0)
(2.0)
0.0
2.0
4.0
6.0
8.0
10.0
12.0
14.0
Standard DeviationR
etur
ns
Rolling 12 Quarter Scatter Chart for 5 Years
CBf:Conservative Index
CBf:Consrv Port.
Ended March 31, 2015
43
CONSERVATIVE PORTFOLIOPERIOD ENDED MARCH 31, 2015
Last Quarter Last Year Last 2 Years Last 3 Years Last 5 Years
0.0
1.0
2.0
3.0
4.0
5.0
Cum
ulat
ive
Ret
urns
1.27
2.502.81 2.92
3.16
1.14
2.64
3.223.57
4.41
CBf:Consrv Port. CBf:Conservative Index
Ende
d M
arch
31,
201
5
Conservative Portfolio
The AllianceBernstein Conservative Portfolio emphasizes stability and capital preservation, while maintaining a small exposure to stocks for additional return potential. The Portfolio targets a conservative blend of 75% to bonds/cash and 25% to stocks.
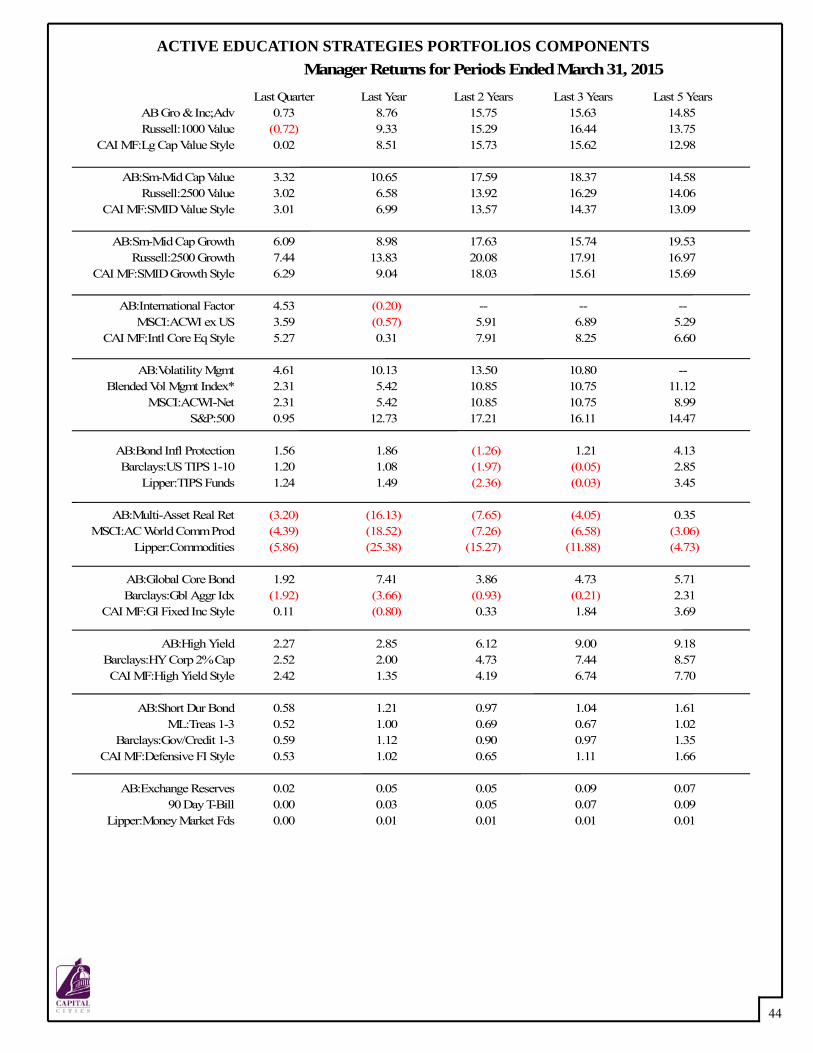
Manager Returns for Periods Ended March 31, 2015
Last Quarter Last Year Last 2 Years Last 3 Years Last 5 YearsAB Gro & Inc;Adv 0.73 8.76 15.75 15.63 14.85Russell:1000 Value (0.72) 9.33 15.29 16.44 13.75
CAI MF:Lg Cap Value Style 0.02 8.51 15.73 15.62 12.98
AB:Sm-Mid Cap Value 3.32 10.65 17.59 18.37 14.58Russell:2500 Value 3.02 6.58 13.92 16.29 14.06
CAI MF:SMID Value Style 3.01 6.99 13.57 14.37 13.09
AB:Sm-Mid Cap Growth 6.09 8.98 17.63 15.74 19.53Russell:2500 Growth 7.44 13.83 20.08 17.91 16.97
CAI MF:SMID Growth Style 6.29 9.04 18.03 15.61 15.69
AB:International Factor 4.53 (0.20) -- -- --MSCI:ACWI ex US 3.59 (0.57) 5.91 6.89 5.29
CAI MF:Intl Core Eq Style 5.27 0.31 7.91 8.25 6.60
AB:Volatility Mgmt 4.61 10.13 13.50 10.80 --Blended Vol Mgmt Index* 2.31 5.42 10.85 10.75 11.12
MSCI:ACWI-Net 2.31 5.42 10.85 10.75 8.99S&P:500 0.95 12.73 17.21 16.11 14.47
AB:Bond Infl Protection 1.56 1.86 (1.26) 1.21 4.13Barclays:US TIPS 1-10 1.20 1.08 (1.97) (0.05) 2.85
Lipper:TIPS Funds 1.24 1.49 (2.36) (0.03) 3.45
AB:Multi-Asset Real Ret (3.20) (16.13) (7.65) (4.05) 0.35MSCI:AC World Comm Prod (4.39) (18.52) (7.26) (6.58) (3.06)
Lipper:Commodities (5.86) (25.38) (15.27) (11.88) (4.73)
AB:Global Core Bond 1.92 7.41 3.86 4.73 5.71Barclays:Gbl Aggr Idx (1.92) (3.66) (0.93) (0.21) 2.31
CAI MF:Gl Fixed Inc Style 0.11 (0.80) 0.33 1.84 3.69
AB:High Yield 2.27 2.85 6.12 9.00 9.18Barclays:HY Corp 2% Cap 2.52 2.00 4.73 7.44 8.57CAI MF:High Yield Style 2.42 1.35 4.19 6.74 7.70
AB:Short Dur Bond 0.58 1.21 0.97 1.04 1.61ML:Treas 1-3 0.52 1.00 0.69 0.67 1.02
Barclays:Gov/Credit 1-3 0.59 1.12 0.90 0.97 1.35CAI MF:Defensive FI Style 0.53 1.02 0.65 1.11 1.66
AB:Exchange Reserves 0.02 0.05 0.05 0.09 0.0790 Day T-Bill 0.00 0.03 0.05 0.07 0.09
Lipper:Money Market Fds 0.00 0.01 0.01 0.01 0.01
44
ACTIVE EDUCATION STRATEGIES PORTFOLIOS COMPONENTS
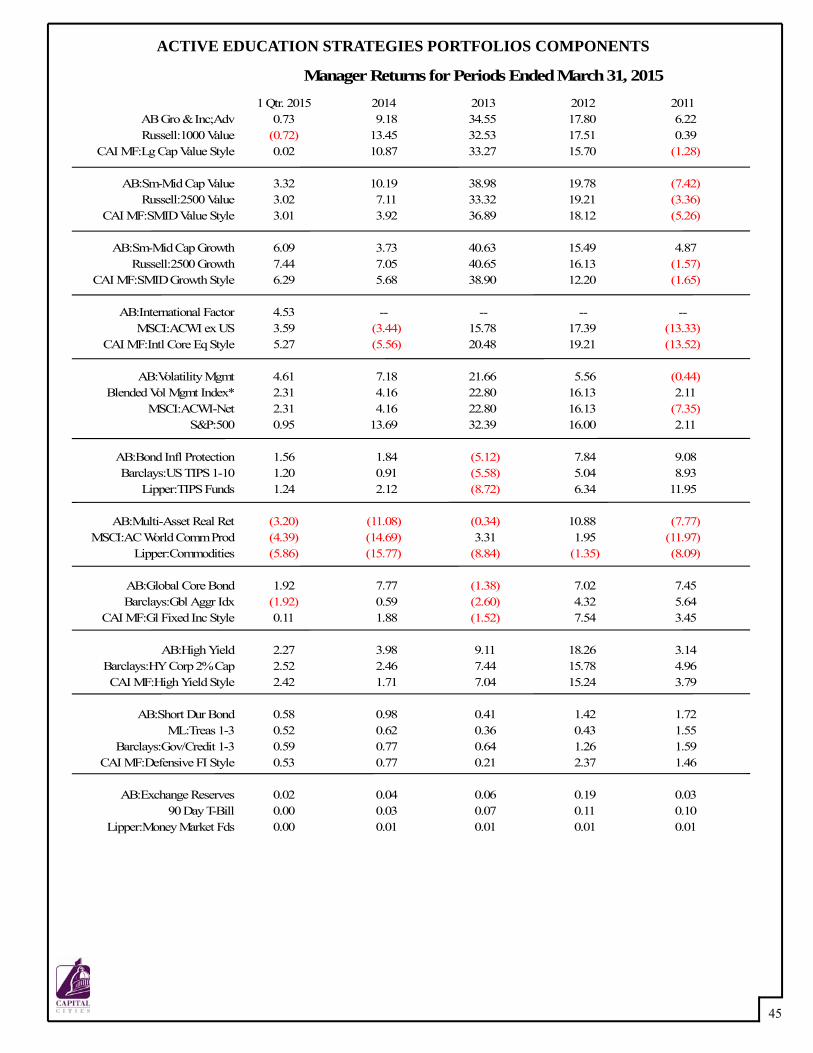
Manager Returns for Periods Ended March 31, 2015
1 Qtr. 2015 2014 2013 2012 2011AB Gro & Inc;Adv 0.73 9.18 34.55 17.80 6.22Russell:1000 Value (0.72) 13.45 32.53 17.51 0.39
CAI MF:Lg Cap Value Style 0.02 10.87 33.27 15.70 (1.28)
AB:Sm-Mid Cap Value 3.32 10.19 38.98 19.78 (7.42)Russell:2500 Value 3.02 7.11 33.32 19.21 (3.36)
CAI MF:SMID Value Style 3.01 3.92 36.89 18.12 (5.26)
AB:Sm-Mid Cap Growth 6.09 3.73 40.63 15.49 4.87Russell:2500 Growth 7.44 7.05 40.65 16.13 (1.57)
CAI MF:SMID Growth Style 6.29 5.68 38.90 12.20 (1.65)
AB:International Factor 4.53 -- -- -- --MSCI:ACWI ex US 3.59 (3.44) 15.78 17.39 (13.33)
CAI MF:Intl Core Eq Style 5.27 (5.56) 20.48 19.21 (13.52)
AB:Volatility Mgmt 4.61 7.18 21.66 5.56 (0.44)Blended Vol Mgmt Index* 2.31 4.16 22.80 16.13 2.11
MSCI:ACWI-Net 2.31 4.16 22.80 16.13 (7.35)S&P:500 0.95 13.69 32.39 16.00 2.11
AB:Bond Infl Protection 1.56 1.84 (5.12) 7.84 9.08Barclays:US TIPS 1-10 1.20 0.91 (5.58) 5.04 8.93
Lipper:TIPS Funds 1.24 2.12 (8.72) 6.34 11.95
AB:Multi-Asset Real Ret (3.20) (11.08) (0.34) 10.88 (7.77)MSCI:AC World Comm Prod (4.39) (14.69) 3.31 1.95 (11.97)
Lipper:Commodities (5.86) (15.77) (8.84) (1.35) (8.09)
AB:Global Core Bond 1.92 7.77 (1.38) 7.02 7.45Barclays:Gbl Aggr Idx (1.92) 0.59 (2.60) 4.32 5.64
CAI MF:Gl Fixed Inc Style 0.11 1.88 (1.52) 7.54 3.45
AB:High Yield 2.27 3.98 9.11 18.26 3.14Barclays:HY Corp 2% Cap 2.52 2.46 7.44 15.78 4.96CAI MF:High Yield Style 2.42 1.71 7.04 15.24 3.79
AB:Short Dur Bond 0.58 0.98 0.41 1.42 1.72ML:Treas 1-3 0.52 0.62 0.36 0.43 1.55
Barclays:Gov/Credit 1-3 0.59 0.77 0.64 1.26 1.59CAI MF:Defensive FI Style 0.53 0.77 0.21 2.37 1.46
AB:Exchange Reserves 0.02 0.04 0.06 0.19 0.0390 Day T-Bill 0.00 0.03 0.07 0.11 0.10
Lipper:Money Market Fds 0.00 0.01 0.01 0.01 0.01
45
ACTIVE EDUCATION STRATEGIES PORTFOLIOS COMPONENTS
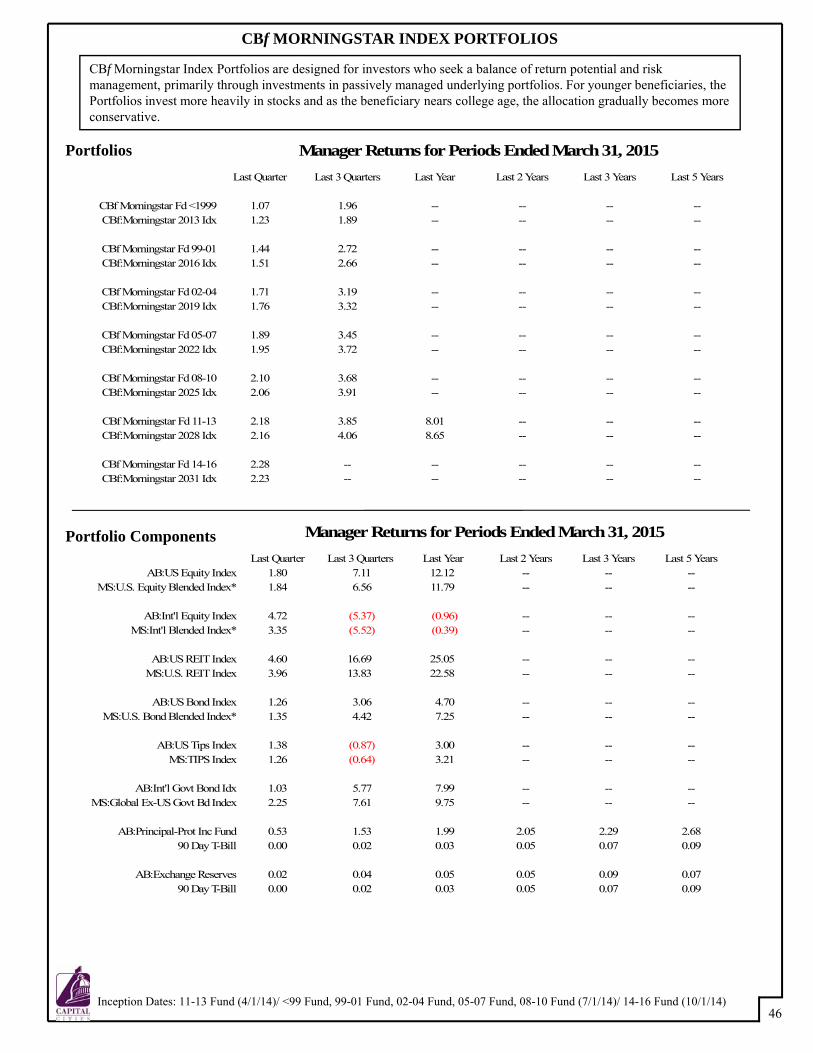
Manager Returns for Periods Ended March 31, 2015Last Quarter Last 3 Quarters Last Year Last 2 Years Last 3 Years Last 5 Years
CBf Morningstar Fd <1999 1.07 1.96 -- -- -- --CBf:Morningstar 2013 Idx 1.23 1.89 -- -- -- --
CBf Morningstar Fd 99-01 1.44 2.72 -- -- -- --CBf:Morningstar 2016 Idx 1.51 2.66 -- -- -- --
CBf Morningstar Fd 02-04 1.71 3.19 -- -- -- --CBf:Morningstar 2019 Idx 1.76 3.32 -- -- -- --
CBf Morningstar Fd 05-07 1.89 3.45 -- -- -- --CBf:Morningstar 2022 Idx 1.95 3.72 -- -- -- --
CBf Morningstar Fd 08-10 2.10 3.68 -- -- -- --CBf:Morningstar 2025 Idx 2.06 3.91 -- -- -- --
CBf Morningstar Fd 11-13 2.18 3.85 8.01 -- -- --CBf:Morningstar 2028 Idx 2.16 4.06 8.65 -- -- --
CBf Morningstar Fd 14-16 2.28 -- -- -- -- --CBf:Morningstar 2031 Idx 2.23 -- -- -- -- --
Manager Returns for Periods Ended March 31, 2015Last Quarter Last 3 Quarters Last Year Last 2 Years Last 3 Years Last 5 Years
AB:US Equity Index 1.80 7.11 12.12 -- -- --MS:U.S. Equity Blended Index* 1.84 6.56 11.79 -- -- --
AB:Int'l Equity Index 4.72 (5.37) (0.96) -- -- --MS:Int'l Blended Index* 3.35 (5.52) (0.39) -- -- --
AB:US REIT Index 4.60 16.69 25.05 -- -- --MS:U.S. REIT Index 3.96 13.83 22.58 -- -- --
AB:US Bond Index 1.26 3.06 4.70 -- -- --MS:U.S. Bond Blended Index* 1.35 4.42 7.25 -- -- --
AB:US Tips Index 1.38 (0.87) 3.00 -- -- --MS:TIPS Index 1.26 (0.64) 3.21 -- -- --
AB:Int'l Govt Bond Idx 1.03 5.77 7.99 -- -- --MS:Global Ex-US Govt Bd Index 2.25 7.61 9.75 -- -- --
AB:Principal-Prot Inc Fund 0.53 1.53 1.99 2.05 2.29 2.6890 Day T-Bill 0.00 0.02 0.03 0.05 0.07 0.09
AB:Exchange Reserves 0.02 0.04 0.05 0.05 0.09 0.0790 Day T-Bill 0.00 0.02 0.03 0.05 0.07 0.09
46
CBf MORNINGSTAR INDEX PORTFOLIOS
CBf Morningstar Index Portfolios are designed for investors who seek a balance of return potential and risk management, primarily through investments in passively managed underlying portfolios. For younger beneficiaries, the Portfolios invest more heavily in stocks and as the beneficiary nears college age, the allocation gradually becomes more conservative.
Portfolios
Portfolio Components
Inception Dates: 11-13 Fund (4/1/14)/ <99 Fund, 99-01 Fund, 02-04 Fund, 05-07 Fund, 08-10 Fund (7/1/14)/ 14-16 Fund (10/1/14)
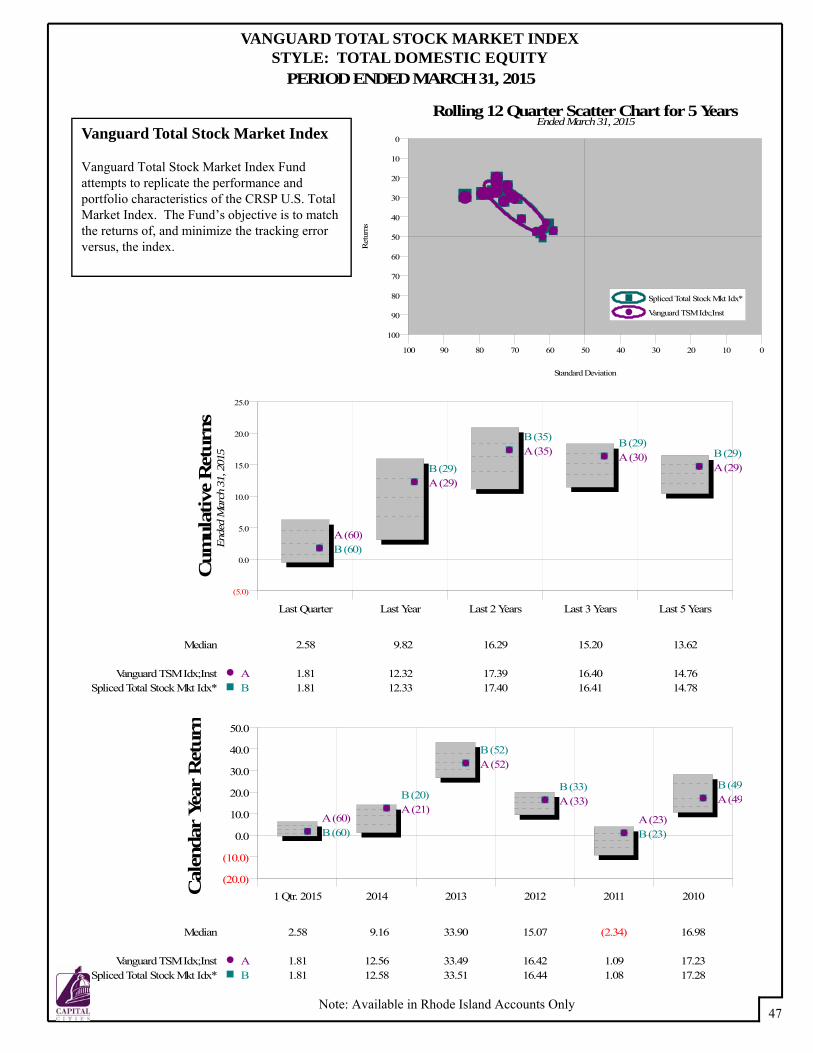
1 Qtr. 2015 2014 2013 2012 2011 2010(20.0)
(10.0)
0.0
10.0
20.0
30.0
40.0
50.0
Median 2.58 9.16 33.90 15.07 (2.34) 16.98
Vanguard TSM Idx;Inst A 1.81 12.56 33.49 16.42 1.09 17.23Spliced Total Stock Mkt Idx* B 1.81 12.58 33.51 16.44 1.08 17.28
Cal
enda
r Ye
ar R
etur
n
B (60)
B (20)
B (52)
B (33)
B (23)
B (49)
A (60)A (21)
A (52)
A (33)
A (23)
A (49
100 90 80 70 60 50 40 30 20 10 0
100
90
80
70
60
50
40
30
20
10
0
Standard DeviationR
etur
ns
Rolling 12 Quarter Scatter Chart for 5 Years
Spliced Total Stock Mkt Idx*
Vanguard TSM Idx;Inst
Ended March 31, 2015
47
VANGUARD TOTAL STOCK MARKET INDEXSTYLE: TOTAL DOMESTIC EQUITY
PERIOD ENDED MARCH 31, 2015
Last Quarter Last Year Last 2 Years Last 3 Years Last 5 Years
(5.0)
0.0
5.0
10.0
15.0
20.0
25.0
Median 2.58 9.82 16.29 15.20 13.62
Vanguard TSM Idx;Inst A 1.81 12.32 17.39 16.40 14.76Spliced Total Stock Mkt Idx* B 1.81 12.33 17.40 16.41 14.78
Cum
ulat
ive
Ret
urns
Ende
d M
arch
31,
201
5
B (60)
B (29)
B (35) B (29)B (29)
A (60)
A (29)
A (35) A (30)A (29)
Note: Available in Rhode Island Accounts Only
Vanguard Total Stock Market Index
Vanguard Total Stock Market Index Fund attempts to replicate the performance and portfolio characteristics of the CRSP U.S. Total Market Index. The Fund’s objective is to match the returns of, and minimize the tracking error versus, the index.
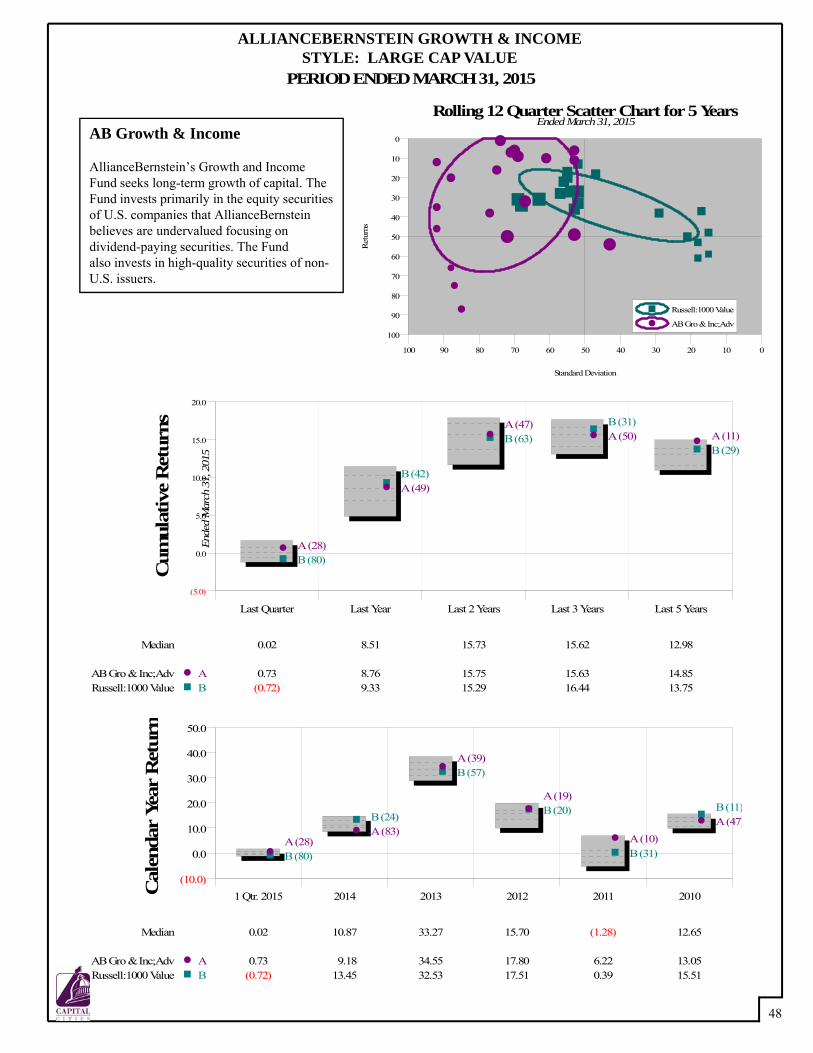
1 Qtr. 2015 2014 2013 2012 2011 2010(10.0)
0.0
10.0
20.0
30.0
40.0
50.0
Median 0.02 10.87 33.27 15.70 (1.28) 12.65
AB Gro & Inc;Adv A 0.73 9.18 34.55 17.80 6.22 13.05Russell:1000 Value B (0.72) 13.45 32.53 17.51 0.39 15.51
Cal
enda
r Ye
ar R
etur
n
B (80)
B (24)
B (57)
B (20)
B (31)
B (11)
A (28)A (83)
A (39)
A (19)
A (10)A (47)
100 90 80 70 60 50 40 30 20 10 0
100
90
80
70
60
50
40
30
20
10
0
Standard DeviationR
etur
ns
Rolling 12 Quarter Scatter Chart for 5 Years
Russell:1000 Value
AB Gro & Inc;Adv
Ended March 31, 2015
48
ALLIANCEBERNSTEIN GROWTH & INCOMESTYLE: LARGE CAP VALUE
PERIOD ENDED MARCH 31, 2015
Last Quarter Last Year Last 2 Years Last 3 Years Last 5 Years
(5.0)
0.0
5.0
10.0
15.0
20.0
Median 0.02 8.51 15.73 15.62 12.98
AB Gro & Inc;Adv A 0.73 8.76 15.75 15.63 14.85Russell:1000 Value B (0.72) 9.33 15.29 16.44 13.75
Cum
ulat
ive
Ret
urns
Ende
d M
arch
31,
201
5
B (80)
B (42)
B (63)B (31)
B (29)
A (28)
A (49)
A (47)A (50) A (11)
AB Growth & Income
AllianceBernstein’s Growth and Income Fund seeks long-term growth of capital. The Fund invests primarily in the equity securities of U.S. companies that AllianceBernsteinbelieves are undervalued focusing on dividend-paying securities. The Fundalso invests in high-quality securities of non-U.S. issuers.
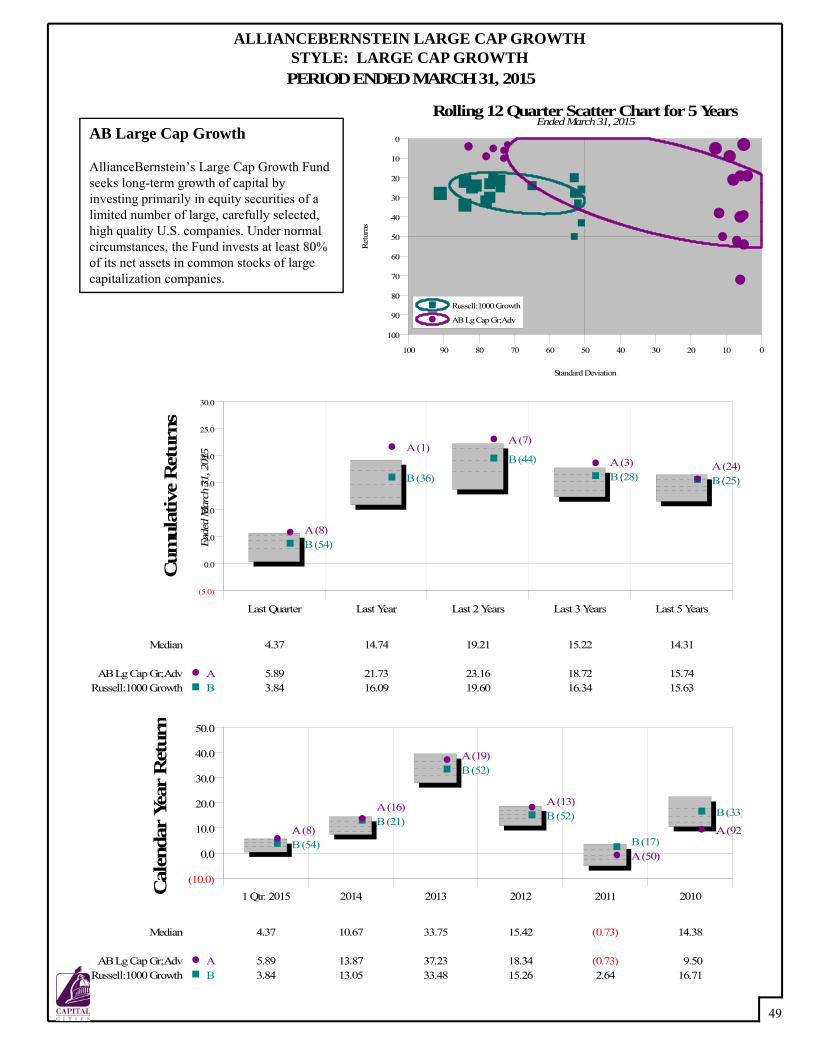
1 Qtr. 2015 2014 2013 2012 2011 2010(10.0)
0.0
10.0
20.0
30.0
40.0
50.0
Median 4.37 10.67 33.75 15.42 (0.73) 14.38
AB Lg Cap Gr;Adv A 5.89 13.87 37.23 18.34 (0.73) 9.50Russell:1000 Growth B 3.84 13.05 33.48 15.26 2.64 16.71
Cal
enda
r Ye
ar R
etur
n
B (54)
B (21)
B (52)
B (52)
B (17)
B (33)
A (8)
A (16)
A (19)
A (13)
A (50)
A (92)
100 90 80 70 60 50 40 30 20 10 0
100
90
80
70
60
50
40
30
20
10
0
Standard DeviationR
etur
ns
Rolling 12 Quarter Scatter Chart for 5 Years
Russell:1000 Growth
AB Lg Cap Gr;Adv
Ended March 31, 2015
49
ALLIANCEBERNSTEIN LARGE CAP GROWTHSTYLE: LARGE CAP GROWTHPERIOD ENDED MARCH 31, 2015
Last Quarter Last Year Last 2 Years Last 3 Years Last 5 Years
(5.0)
0.0
5.0
10.0
15.0
20.0
25.0
30.0
Median 4.37 14.74 19.21 15.22 14.31
AB Lg Cap Gr;Adv A 5.89 21.73 23.16 18.72 15.74Russell:1000 Growth B 3.84 16.09 19.60 16.34 15.63
Cum
ulat
ive
Ret
urns
Ende
d M
arch
31,
201
5
B (54)
B (36)
B (44)
B (28) B (25)
A (8)
A (1)A (7)
A (3) A (24)
AB Large Cap Growth
AllianceBernstein’s Large Cap Growth Fund seeks long-term growth of capital by investing primarily in equity securities of a limited number of large, carefully selected, high quality U.S. companies. Under normal circumstances, the Fund invests at least 80% of its net assets in common stocks of large capitalization companies.
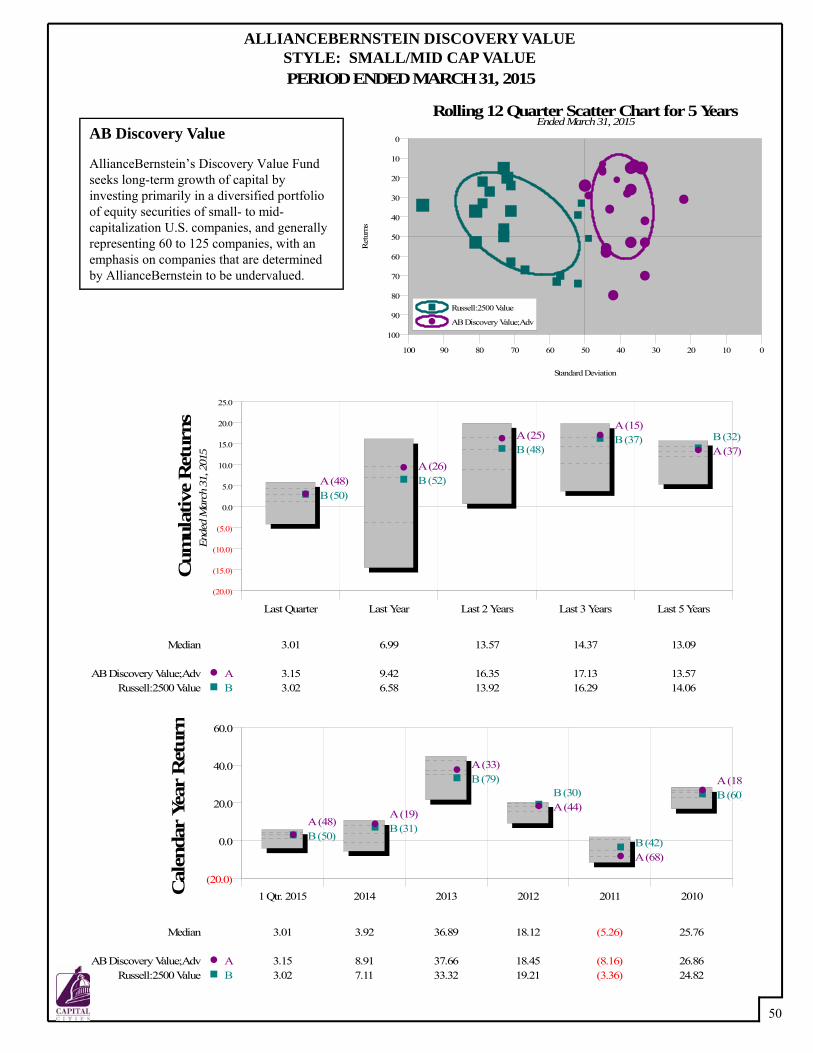
1 Qtr. 2015 2014 2013 2012 2011 2010(20.0)
0.0
20.0
40.0
60.0
Median 3.01 3.92 36.89 18.12 (5.26) 25.76
AB Discovery Value;Adv A 3.15 8.91 37.66 18.45 (8.16) 26.86Russell:2500 Value B 3.02 7.11 33.32 19.21 (3.36) 24.82
Cal
enda
r Ye
ar R
etur
n
B (50)B (31)
B (79)B (30)
B (42)
B (60)
A (48)A (19)
A (33)
A (44)
A (68)
A (18)
100 90 80 70 60 50 40 30 20 10 0
100
90
80
70
60
50
40
30
20
10
0
Standard DeviationR
etur
ns
Rolling 12 Quarter Scatter Chart for 5 Years
Russell:2500 Value
AB Discovery Value;Adv
Ended March 31, 2015
50
ALLIANCEBERNSTEIN DISCOVERY VALUESTYLE: SMALL/MID CAP VALUEPERIOD ENDED MARCH 31, 2015
Last Quarter Last Year Last 2 Years Last 3 Years Last 5 Years
(20.0)
(15.0)
(10.0)
(5.0)
0.0
5.0
10.0
15.0
20.0
25.0
Median 3.01 6.99 13.57 14.37 13.09
AB Discovery Value;Adv A 3.15 9.42 16.35 17.13 13.57Russell:2500 Value B 3.02 6.58 13.92 16.29 14.06
Cum
ulat
ive
Ret
urns
Ende
d M
arch
31,
201
5
B (50)B (52)
B (48)B (37) B (32)
A (48)A (26)
A (25)A (15)
A (37)
AB Discovery Value
AllianceBernstein’s Discovery Value Fund seeks long-term growth of capital by investing primarily in a diversified portfolio of equity securities of small- to mid-capitalization U.S. companies, and generally representing 60 to 125 companies, with an emphasis on companies that are determined by AllianceBernstein to be undervalued.
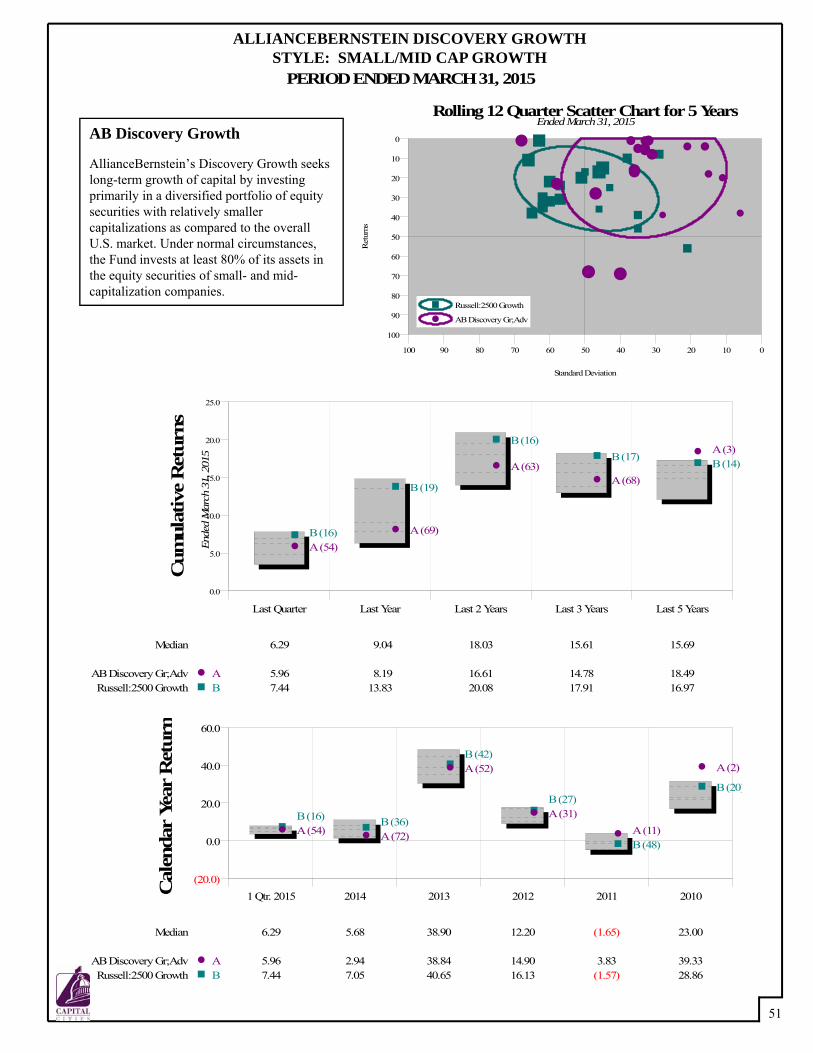
1 Qtr. 2015 2014 2013 2012 2011 2010(20.0)
0.0
20.0
40.0
60.0
Median 6.29 5.68 38.90 12.20 (1.65) 23.00
AB Discovery Gr;Adv A 5.96 2.94 38.84 14.90 3.83 39.33Russell:2500 Growth B 7.44 7.05 40.65 16.13 (1.57) 28.86
Cal
enda
r Ye
ar R
etur
n
B (16) B (36)
B (42)
B (27)
B (48)
B (20)
A (54) A (72)
A (52)
A (31)A (11)
A (2)
100 90 80 70 60 50 40 30 20 10 0
100
90
80
70
60
50
40
30
20
10
0
Standard DeviationR
etur
ns
Rolling 12 Quarter Scatter Chart for 5 Years
Russell:2500 Growth
AB Discovery Gr;Adv
Ended March 31, 2015
51
ALLIANCEBERNSTEIN DISCOVERY GROWTHSTYLE: SMALL/MID CAP GROWTH
PERIOD ENDED MARCH 31, 2015
Last Quarter Last Year Last 2 Years Last 3 Years Last 5 Years
0.0
5.0
10.0
15.0
20.0
25.0
Median 6.29 9.04 18.03 15.61 15.69
AB Discovery Gr;Adv A 5.96 8.19 16.61 14.78 18.49Russell:2500 Growth B 7.44 13.83 20.08 17.91 16.97
Cum
ulat
ive
Ret
urns
Ende
d M
arch
31,
201
5
B (16)
B (19)
B (16)B (17)
B (14)
A (54)A (69)
A (63)A (68)
A (3)
AB Discovery Growth
AllianceBernstein’s Discovery Growth seeks long-term growth of capital by investing primarily in a diversified portfolio of equity securities with relatively smaller capitalizations as compared to the overall U.S. market. Under normal circumstances, the Fund invests at least 80% of its assets inthe equity securities of small- and mid-capitalization companies.
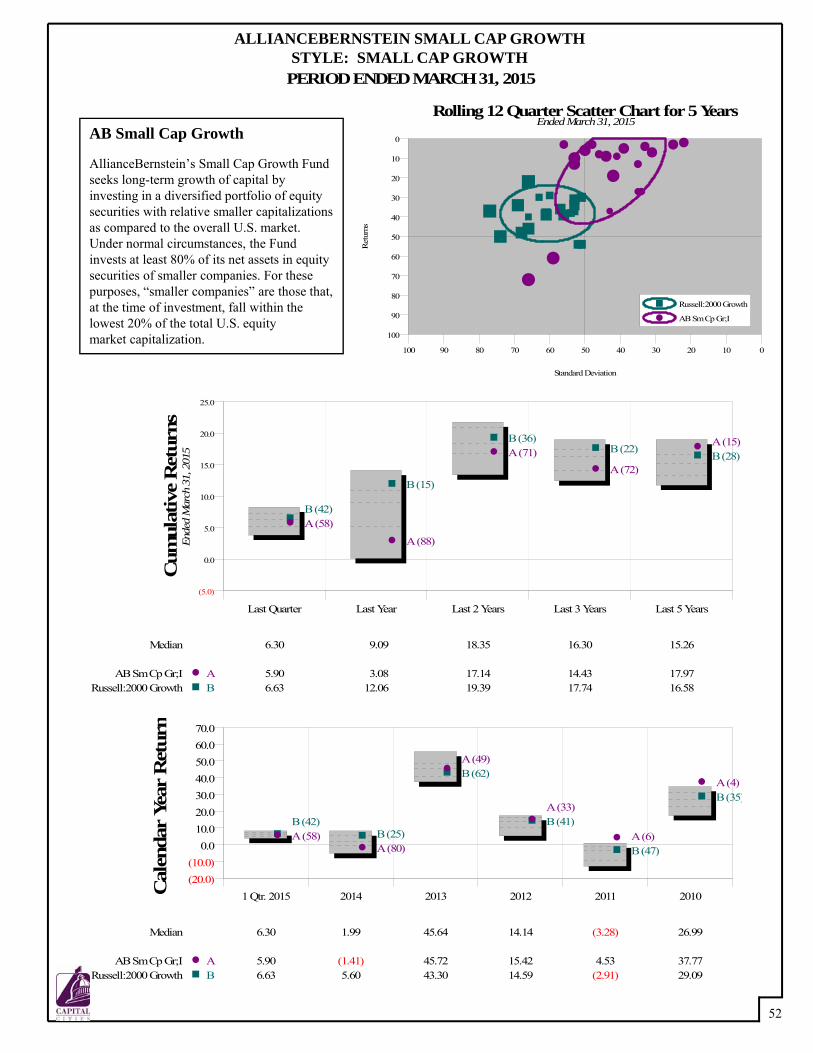
1 Qtr. 2015 2014 2013 2012 2011 2010(20.0)(10.0)
0.010.020.030.040.050.060.070.0
Median 6.30 1.99 45.64 14.14 (3.28) 26.99
AB Sm Cp Gr;I A 5.90 (1.41) 45.72 15.42 4.53 37.77Russell:2000 Growth B 6.63 5.60 43.30 14.59 (2.91) 29.09
Cal
enda
r Ye
ar R
etur
n
B (42)B (25)
B (62)
B (41)
B (47)
B (35)
A (58)A (80)
A (49)
A (33)
A (6)
A (4)
100 90 80 70 60 50 40 30 20 10 0
100
90
80
70
60
50
40
30
20
10
0
Standard DeviationR
etur
ns
Rolling 12 Quarter Scatter Chart for 5 Years
Russell:2000 Growth
AB Sm Cp Gr;I
Ended March 31, 2015
52
ALLIANCEBERNSTEIN SMALL CAP GROWTHSTYLE: SMALL CAP GROWTH
PERIOD ENDED MARCH 31, 2015
Last Quarter Last Year Last 2 Years Last 3 Years Last 5 Years
(5.0)
0.0
5.0
10.0
15.0
20.0
25.0
Median 6.30 9.09 18.35 16.30 15.26
AB Sm Cp Gr;I A 5.90 3.08 17.14 14.43 17.97Russell:2000 Growth B 6.63 12.06 19.39 17.74 16.58
Cum
ulat
ive
Ret
urns
Ende
d M
arch
31,
201
5
B (42)
B (15)
B (36)B (22)
B (28)
A (58)
A (88)
A (71)A (72)
A (15)
AB Small Cap Growth
AllianceBernstein’s Small Cap Growth Fund seeks long-term growth of capital by investing in a diversified portfolio of equity securities with relative smaller capitalizations as compared to the overall U.S. market. Under normal circumstances, the Fund invests at least 80% of its net assets in equity securities of smaller companies. For these purposes, “smaller companies” are those that, at the time of investment, fall within the lowest 20% of the total U.S. equitymarket capitalization.
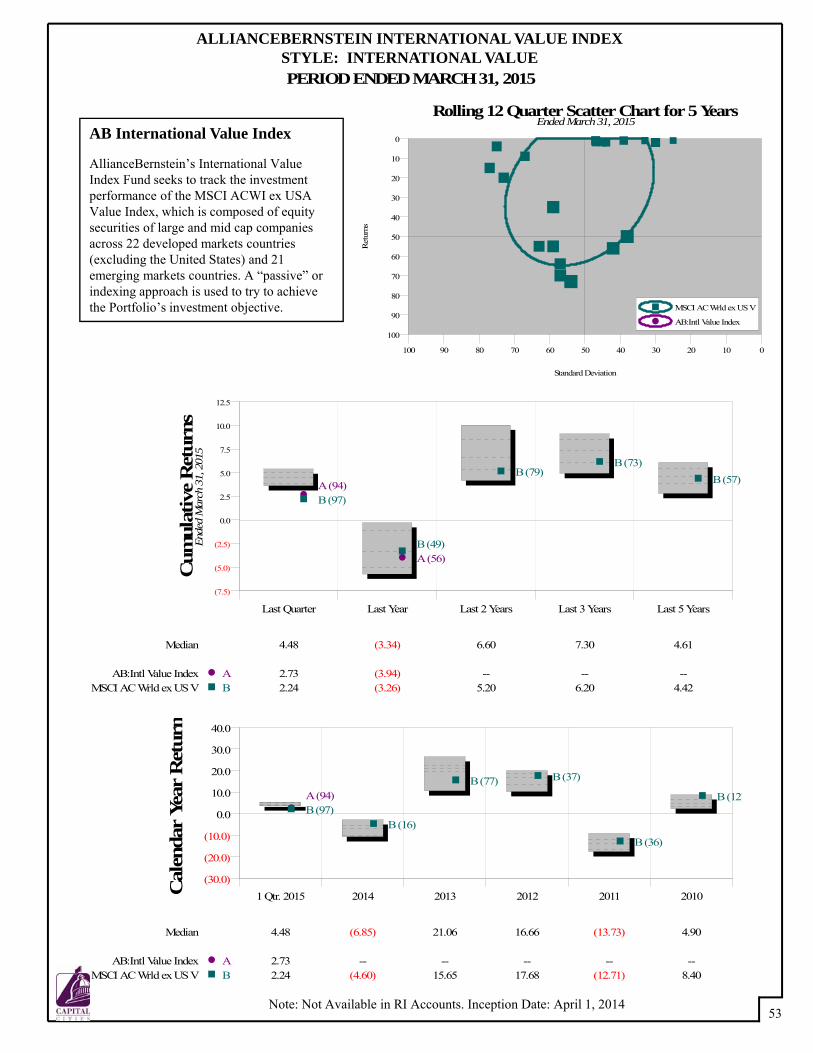
1 Qtr. 2015 2014 2013 2012 2011 2010(30.0)
(20.0)
(10.0)
0.0
10.0
20.0
30.0
40.0
Median 4.48 (6.85) 21.06 16.66 (13.73) 4.90
AB:Intl Value Index A 2.73 -- -- -- -- --MSCI AC Wrld ex US V B 2.24 (4.60) 15.65 17.68 (12.71) 8.40
Cal
enda
r Ye
ar R
etur
n
A (94)B (97)
B (16)
B (77) B (37)
B (36)
B (12)
100 90 80 70 60 50 40 30 20 10 0
100
90
80
70
60
50
40
30
20
10
0
Standard DeviationR
etur
ns
Rolling 12 Quarter Scatter Chart for 5 Years
MSCI AC Wrld ex US V
AB:Intl Value Index
Ended March 31, 2015
53
ALLIANCEBERNSTEIN INTERNATIONAL VALUE INDEXSTYLE: INTERNATIONAL VALUEPERIOD ENDED MARCH 31, 2015
Note: Not Available in RI Accounts. Inception Date: April 1, 2014
Last Quarter Last Year Last 2 Years Last 3 Years Last 5 Years
(7.5)
(5.0)
(2.5)
0.0
2.5
5.0
7.5
10.0
12.5
Median 4.48 (3.34) 6.60 7.30 4.61
AB:Intl Value Index A 2.73 (3.94) -- -- --MSCI AC Wrld ex US V B 2.24 (3.26) 5.20 6.20 4.42
Cum
ulat
ive
Ret
urns
Ende
d M
arch
31,
201
5
A (94)
A (56)
B (97)
B (49)
B (79)B (73)
B (57)
AB International Value Index
AllianceBernstein’s International Value Index Fund seeks to track the investment performance of the MSCI ACWI ex USA Value Index, which is composed of equity securities of large and mid cap companies across 22 developed markets countries (excluding the United States) and 21 emerging markets countries. A “passive” or indexing approach is used to try to achieve the Portfolio’s investment objective.
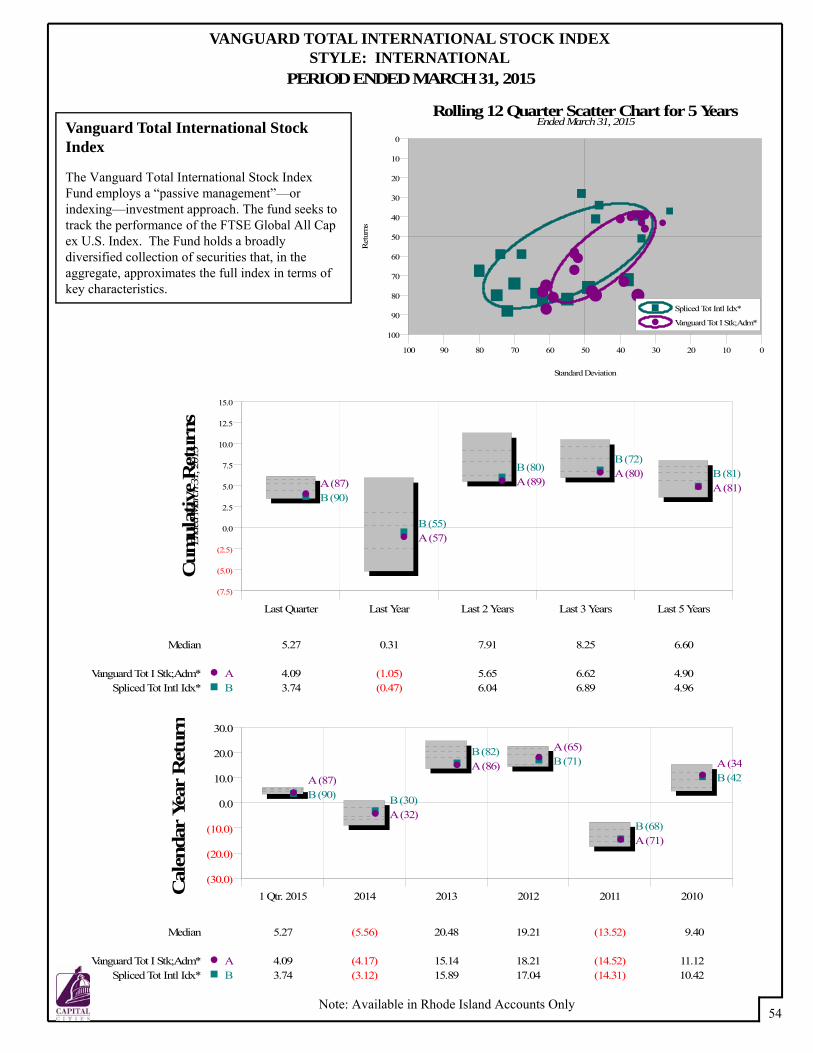
1 Qtr. 2015 2014 2013 2012 2011 2010(30.0)
(20.0)
(10.0)
0.0
10.0
20.0
30.0
Median 5.27 (5.56) 20.48 19.21 (13.52) 9.40
Vanguard Tot I Stk;Adm* A 4.09 (4.17) 15.14 18.21 (14.52) 11.12Spliced Tot Intl Idx* B 3.74 (3.12) 15.89 17.04 (14.31) 10.42
Cal
enda
r Ye
ar R
etur
n
B (90) B (30)
B (82)B (71)
B (68)
B (42)A (87)
A (32)
A (86)
A (65)
A (71)
A (34)
100 90 80 70 60 50 40 30 20 10 0
100
90
80
70
60
50
40
30
20
10
0
Standard DeviationR
etur
ns
Rolling 12 Quarter Scatter Chart for 5 Years
Spliced Tot Intl Idx*
Vanguard Tot I Stk;Adm*
Ended March 31, 2015
54
VANGUARD TOTAL INTERNATIONAL STOCK INDEXSTYLE: INTERNATIONAL
PERIOD ENDED MARCH 31, 2015
Note: Available in Rhode Island Accounts Only
Last Quarter Last Year Last 2 Years Last 3 Years Last 5 Years
(7.5)
(5.0)
(2.5)
0.0
2.5
5.0
7.5
10.0
12.5
15.0
Median 5.27 0.31 7.91 8.25 6.60
Vanguard Tot I Stk;Adm* A 4.09 (1.05) 5.65 6.62 4.90Spliced Tot Intl Idx* B 3.74 (0.47) 6.04 6.89 4.96
Cum
ulat
ive
Ret
urns
Ende
d M
arch
31,
201
5
B (90)
B (55)
B (80)B (72)
B (81)A (87)
A (57)
A (89)A (80)
A (81)
Vanguard Total International Stock Index
The Vanguard Total International Stock Index Fund employs a “passive management”—or indexing—investment approach. The fund seeks to track the performance of the FTSE Global All Cap ex U.S. Index. The Fund holds a broadly diversified collection of securities that, in the aggregate, approximates the full index in terms of key characteristics.
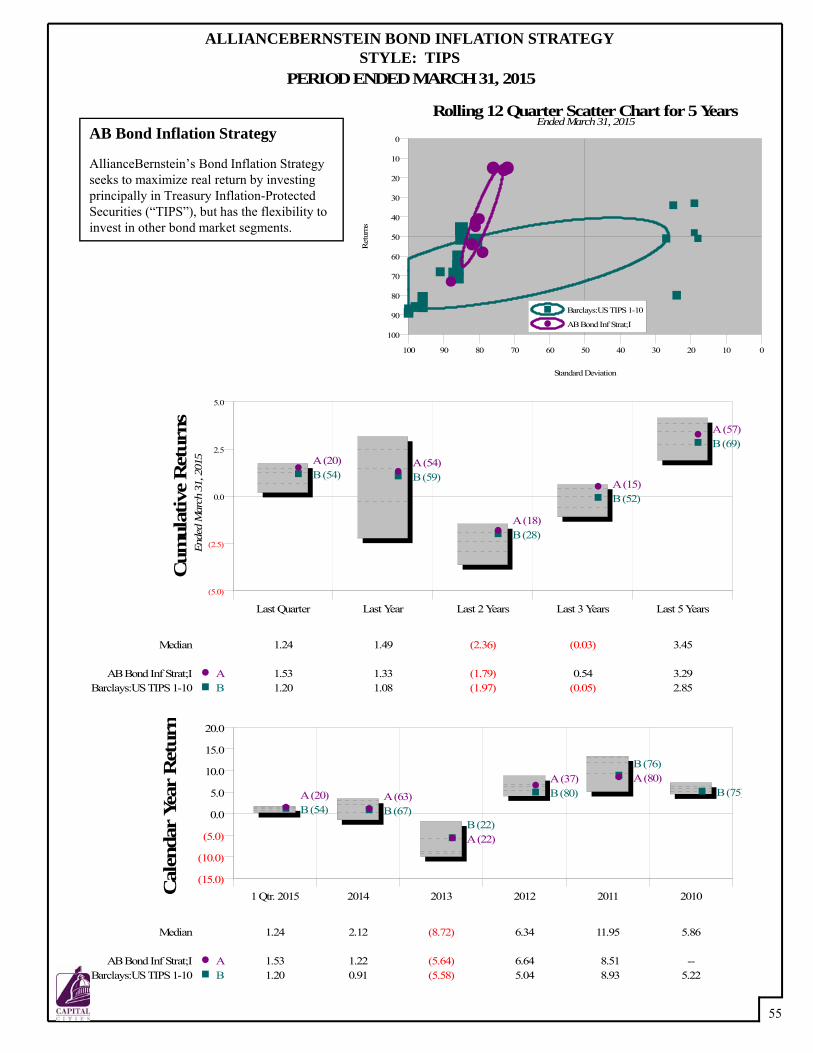
1 Qtr. 2015 2014 2013 2012 2011 2010(15.0)
(10.0)
(5.0)
0.0
5.0
10.0
15.0
20.0
Median 1.24 2.12 (8.72) 6.34 11.95 5.86
AB Bond Inf Strat;I A 1.53 1.22 (5.64) 6.64 8.51 --Barclays:US TIPS 1-10 B 1.20 0.91 (5.58) 5.04 8.93 5.22
Cal
enda
r Ye
ar R
etur
n
B (54) B (67)B (22)
B (80)
B (76)
B (75)A (20) A (63)
A (22)
A (37) A (80)
100 90 80 70 60 50 40 30 20 10 0
100
90
80
70
60
50
40
30
20
10
0
Standard DeviationR
etur
ns
Rolling 12 Quarter Scatter Chart for 5 Years
Barclays:US TIPS 1-10
AB Bond Inf Strat;I
Ended March 31, 2015
55
ALLIANCEBERNSTEIN BOND INFLATION STRATEGYSTYLE: TIPS
PERIOD ENDED MARCH 31, 2015
Last Quarter Last Year Last 2 Years Last 3 Years Last 5 Years
(5.0)
(2.5)
0.0
2.5
5.0
Median 1.24 1.49 (2.36) (0.03) 3.45
AB Bond Inf Strat;I A 1.53 1.33 (1.79) 0.54 3.29Barclays:US TIPS 1-10 B 1.20 1.08 (1.97) (0.05) 2.85
Cum
ulat
ive
Ret
urns
Ende
d M
arch
31,
201
5
B (54) B (59)
B (28)
B (52)
B (69)A (20) A (54)
A (18)
A (15)
A (57)
AB Bond Inflation Strategy
AllianceBernstein’s Bond Inflation Strategy seeks to maximize real return by investing principally in Treasury Inflation-ProtectedSecurities (“TIPS”), but has the flexibility to invest in other bond market segments.
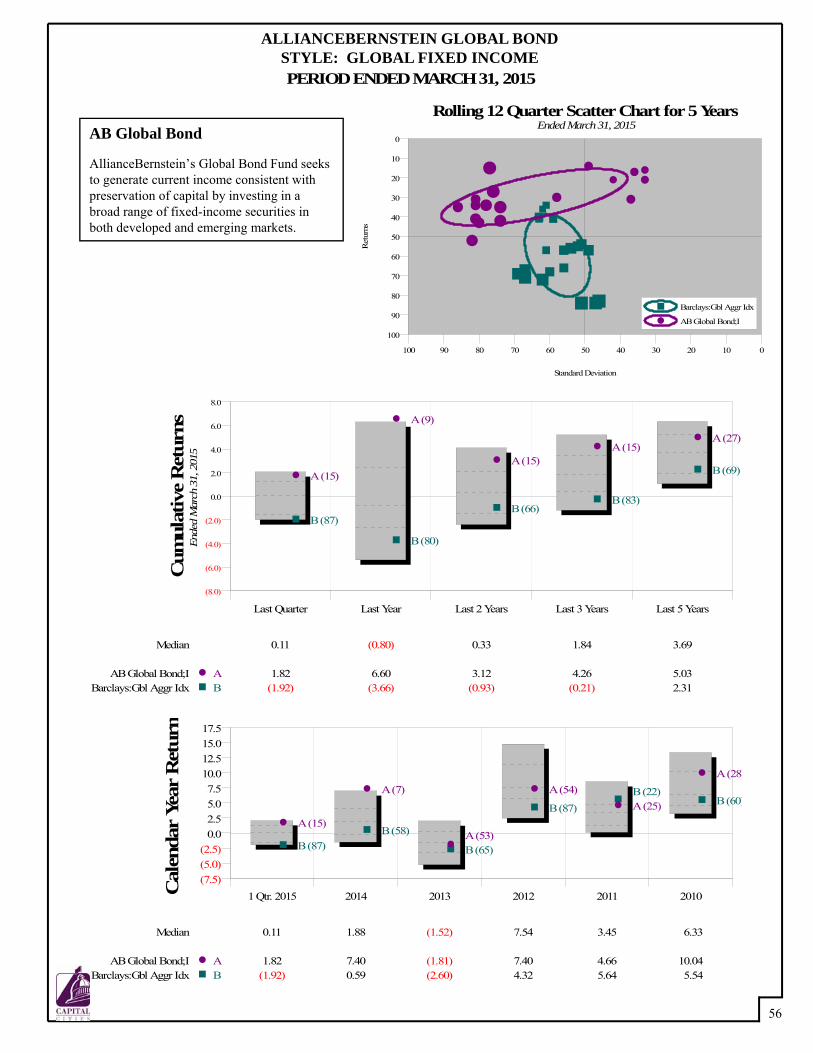
1 Qtr. 2015 2014 2013 2012 2011 2010(7.5)(5.0)(2.5)
0.02.55.07.5
10.012.515.017.5
Median 0.11 1.88 (1.52) 7.54 3.45 6.33
AB Global Bond;I A 1.82 7.40 (1.81) 7.40 4.66 10.04Barclays:Gbl Aggr Idx B (1.92) 0.59 (2.60) 4.32 5.64 5.54
Cal
enda
r Ye
ar R
etur
n
B (87)B (58)
B (65)
B (87)B (22)
B (60)
A (15)
A (7)
A (53)
A (54)A (25)
A (28)
100 90 80 70 60 50 40 30 20 10 0
100
90
80
70
60
50
40
30
20
10
0
Standard DeviationR
etur
ns
Rolling 12 Quarter Scatter Chart for 5 Years
Barclays:Gbl Aggr Idx
AB Global Bond;I
Ended March 31, 2015
56
ALLIANCEBERNSTEIN GLOBAL BONDSTYLE: GLOBAL FIXED INCOMEPERIOD ENDED MARCH 31, 2015
Last Quarter Last Year Last 2 Years Last 3 Years Last 5 Years
(8.0)
(6.0)
(4.0)
(2.0)
0.0
2.0
4.0
6.0
8.0
Median 0.11 (0.80) 0.33 1.84 3.69
AB Global Bond;I A 1.82 6.60 3.12 4.26 5.03Barclays:Gbl Aggr Idx B (1.92) (3.66) (0.93) (0.21) 2.31
Cum
ulat
ive
Ret
urns
Ende
d M
arch
31,
201
5
B (87)
B (80)
B (66)B (83)
B (69)A (15)
A (9)
A (15)A (15)
A (27)
AB Global Bond
AllianceBernstein’s Global Bond Fund seeks to generate current income consistent with preservation of capital by investing in a broad range of fixed-income securities in both developed and emerging markets.
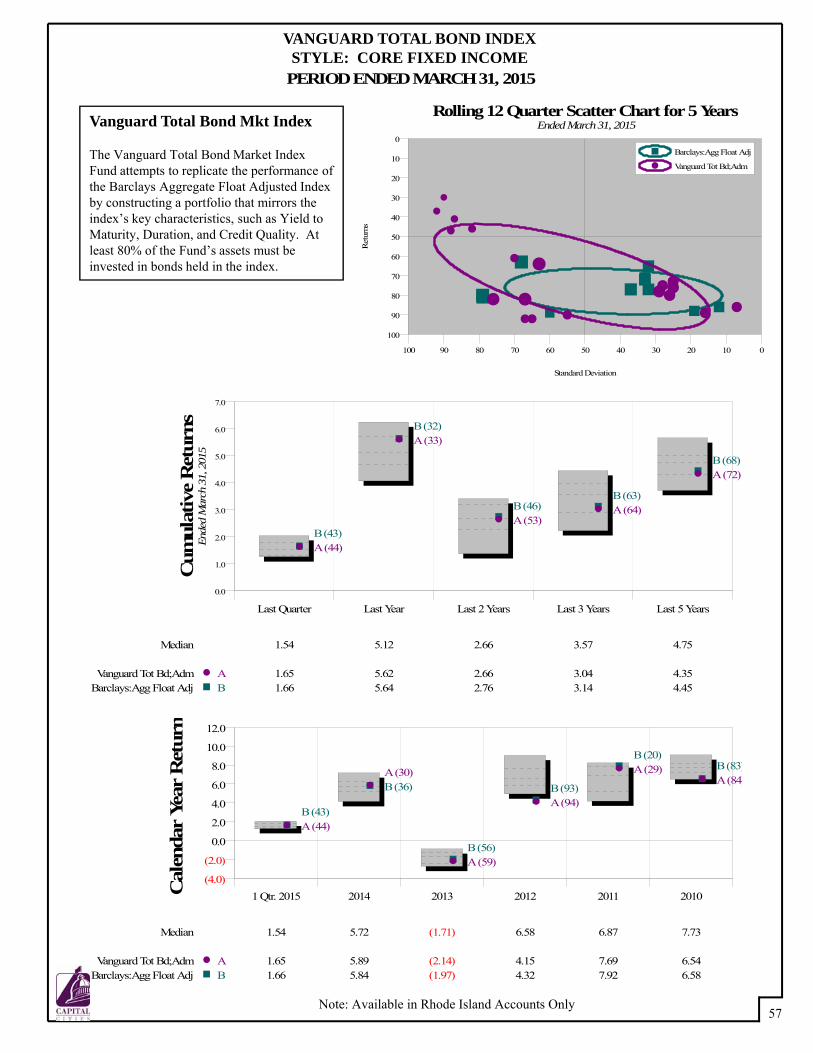
1 Qtr. 2015 2014 2013 2012 2011 2010(4.0)
(2.0)
0.0
2.0
4.0
6.0
8.0
10.0
12.0
Median 1.54 5.72 (1.71) 6.58 6.87 7.73
Vanguard Tot Bd;Adm A 1.65 5.89 (2.14) 4.15 7.69 6.54Barclays:Agg Float Adj B 1.66 5.84 (1.97) 4.32 7.92 6.58
Cal
enda
r Ye
ar R
etur
n
B (43)
B (36)
B (56)
B (93)
B (20)B (83)
A (44)
A (30)
A (59)
A (94)
A (29)A (84)
100 90 80 70 60 50 40 30 20 10 0
100
90
80
70
60
50
40
30
20
10
0
Standard DeviationR
etur
ns
Rolling 12 Quarter Scatter Chart for 5 Years
Barclays:Agg Float Adj
Vanguard Tot Bd;Adm
Ended March 31, 2015
57
VANGUARD TOTAL BOND INDEXSTYLE: CORE FIXED INCOME
PERIOD ENDED MARCH 31, 2015
Note: Available in Rhode Island Accounts Only
Last Quarter Last Year Last 2 Years Last 3 Years Last 5 Years
0.0
1.0
2.0
3.0
4.0
5.0
6.0
7.0
Median 1.54 5.12 2.66 3.57 4.75
Vanguard Tot Bd;Adm A 1.65 5.62 2.66 3.04 4.35Barclays:Agg Float Adj B 1.66 5.64 2.76 3.14 4.45
Cum
ulat
ive
Ret
urns
Ende
d M
arch
31,
201
5
B (43)
B (32)
B (46)B (63)
B (68)
A (44)
A (33)
A (53)A (64)
A (72)
Vanguard Total Bond Mkt Index
The Vanguard Total Bond Market Index Fund attempts to replicate the performance of the Barclays Aggregate Float Adjusted Index by constructing a portfolio that mirrors the index’s key characteristics, such as Yield to Maturity, Duration, and Credit Quality. At least 80% of the Fund’s assets must be invested in bonds held in the index.
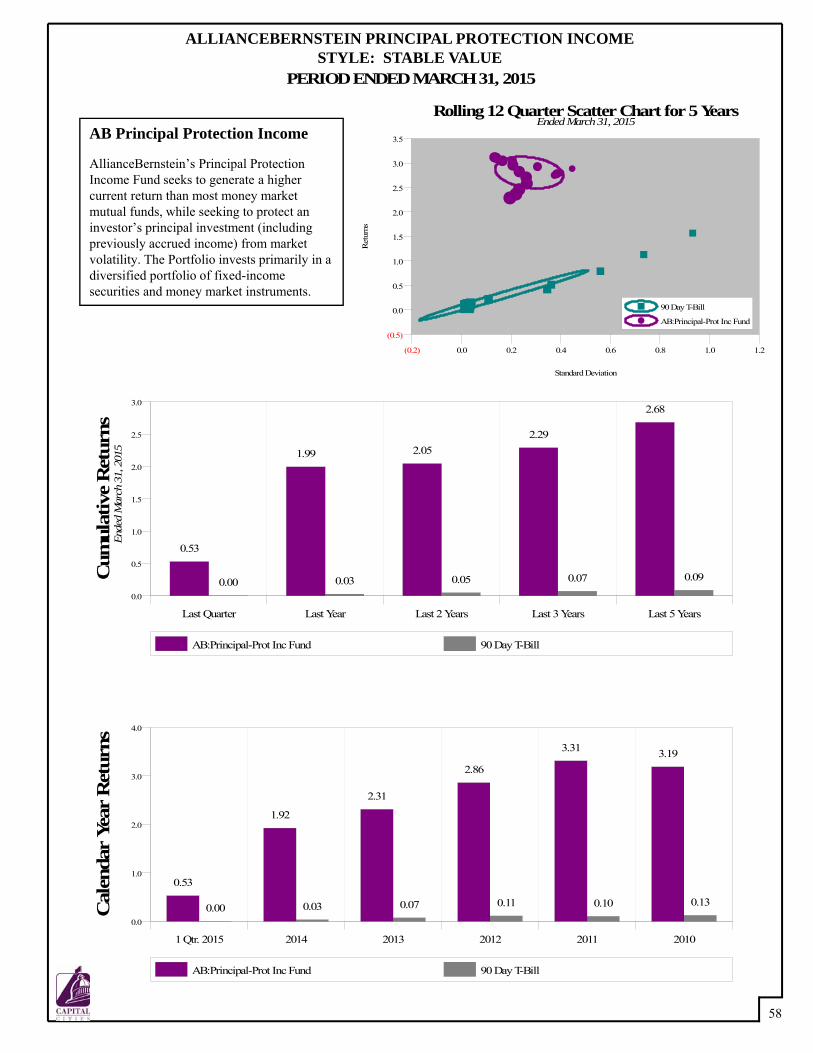
1 Qtr. 2015 2014 2013 2012 2011 2010
0.0
1.0
2.0
3.0
4.0
Cal
enda
r Ye
ar R
etur
ns
0.53
1.92
2.31
2.86
3.31 3.19
0.00 0.03 0.07 0.11 0.10 0.13
AB:Principal-Prot Inc Fund 90 Day T-Bill
(0.2) 0.0 0.2 0.4 0.6 0.8 1.0 1.2
(0.5)
0.0
0.5
1.0
1.5
2.0
2.5
3.0
3.5
Standard DeviationR
etur
ns
Rolling 12 Quarter Scatter Chart for 5 Years
90 Day T-Bill
AB:Principal-Prot Inc Fund
Ended March 31, 2015
58
ALLIANCEBERNSTEIN PRINCIPAL PROTECTION INCOMESTYLE: STABLE VALUE
PERIOD ENDED MARCH 31, 2015
Last Quarter Last Year Last 2 Years Last 3 Years Last 5 Years
0.0
0.5
1.0
1.5
2.0
2.5
3.0
Cum
ulat
ive
Ret
urns
0.53
1.99 2.052.29
2.68
AB:Principal-Prot Inc Fund 90 Day T-Bill
0.00 0.03 0.05 0.07 0.09
Ende
d M
arch
31,
201
5AB Principal Protection Income
AllianceBernstein’s Principal Protection Income Fund seeks to generate a higher current return than most money market mutual funds, while seeking to protect an investor’s principal investment (including previously accrued income) from market volatility. The Portfolio invests primarily in a diversified portfolio of fixed-income securities and money market instruments.
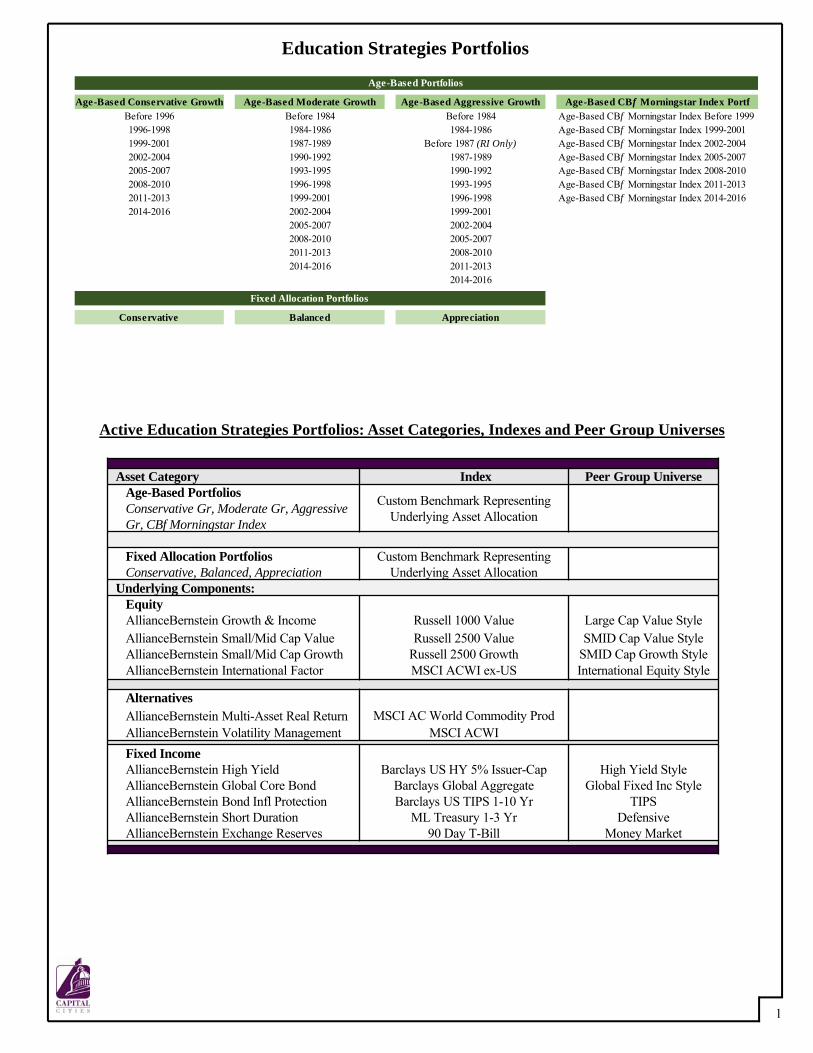
1
Education Strategies Portfolios
Active Education Strategies Portfolios: Asset Categories, Indexes and Peer Group Universes
Asset Category Index Peer Group UniverseAge-Based PortfoliosConservative Gr, Moderate Gr, Aggressive Gr, CBf Morningstar Index
Custom Benchmark Representing Underlying Asset Allocation
Fixed Allocation PortfoliosConservative, Balanced, Appreciation
Custom Benchmark Representing Underlying Asset Allocation
Underlying Components:EquityAllianceBernstein Growth & Income Russell 1000 Value Large Cap Value StyleAllianceBernstein Small/Mid Cap Value Russell 2500 Value SMID Cap Value StyleAllianceBernstein Small/Mid Cap Growth Russell 2500 Growth SMID Cap Growth StyleAllianceBernstein International Factor MSCI ACWI ex-US International Equity Style
AlternativesAllianceBernstein Multi-Asset Real Return MSCI AC World Commodity ProdAllianceBernstein Volatility Management MSCI ACWIFixed IncomeAllianceBernstein High YieldAllianceBernstein Global Core BondAllianceBernstein Bond Infl ProtectionAllianceBernstein Short DurationAllianceBernstein Exchange Reserves
Barclays US HY 5% Issuer-CapBarclays Global AggregateBarclays US TIPS 1-10 Yr
ML Treasury 1-3 Yr90 Day T-Bill
High Yield StyleGlobal Fixed Inc Style
TIPSDefensive
Money Market
Age-Based Conservative Growth Age-Based Moderate Growth Age-Based Aggressive Growth Age-Based CBf Morningstar Index PortfBefore 1996 Before 1984 Before 1984 Age-Based CBf Morningstar Index Before 19991996-1998 1984-1986 1984-1986 Age-Based CBf Morningstar Index 1999-20011999-2001 1987-1989 Before 1987 (RI Only) Age-Based CBf Morningstar Index 2002-20042002-2004 1990-1992 1987-1989 Age-Based CBf Morningstar Index 2005-20072005-2007 1993-1995 1990-1992 Age-Based CBf Morningstar Index 2008-20102008-2010 1996-1998 1993-1995 Age-Based CBf Morningstar Index 2011-20132011-2013 1999-2001 1996-1998 Age-Based CBf Morningstar Index 2014-20162014-2016 2002-2004 1999-2001
2005-2007 2002-20042008-2010 2005-20072011-2013 2008-20102014-2016 2011-2013
2014-2016
Conservative Balanced Appreciation
Age-Based Portfolios
Fixed Allocation Portfolios
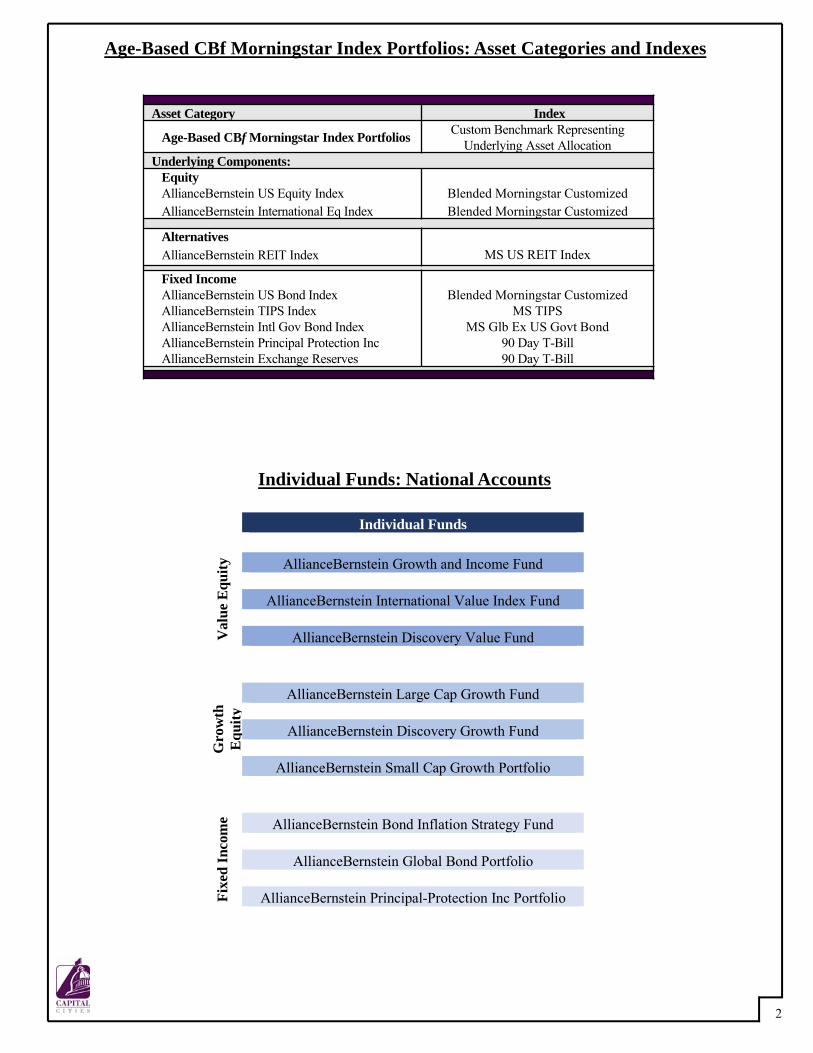
2
Age-Based CBf Morningstar Index Portfolios: Asset Categories and Indexes
Individual Funds: National Accounts
Individual Funds
Val
ue E
quity
AllianceBernstein Growth and Income Fund
AllianceBernstein International Value Index Fund
AllianceBernstein Discovery Value Fund
Gro
wth
E
quity
AllianceBernstein Large Cap Growth Fund
AllianceBernstein Discovery Growth Fund
AllianceBernstein Small Cap Growth Portfolio
Fixe
d In
com
e AllianceBernstein Bond Inflation Strategy Fund
AllianceBernstein Global Bond Portfolio
AllianceBernstein Principal-Protection Inc Portfolio
Asset Category Index
Age-Based CBf Morningstar Index Portfolios Custom Benchmark Representing Underlying Asset Allocation
Underlying Components:EquityAllianceBernstein US Equity Index Blended Morningstar CustomizedAllianceBernstein International Eq Index Blended Morningstar Customized
AlternativesAllianceBernstein REIT Index MS US REIT Index
Fixed IncomeAllianceBernstein US Bond IndexAllianceBernstein TIPS IndexAllianceBernstein Intl Gov Bond IndexAllianceBernstein Principal Protection IncAllianceBernstein Exchange Reserves
Blended Morningstar Customized MS TIPS
MS Glb Ex US Govt Bond90 Day T-Bill90 Day T-Bill
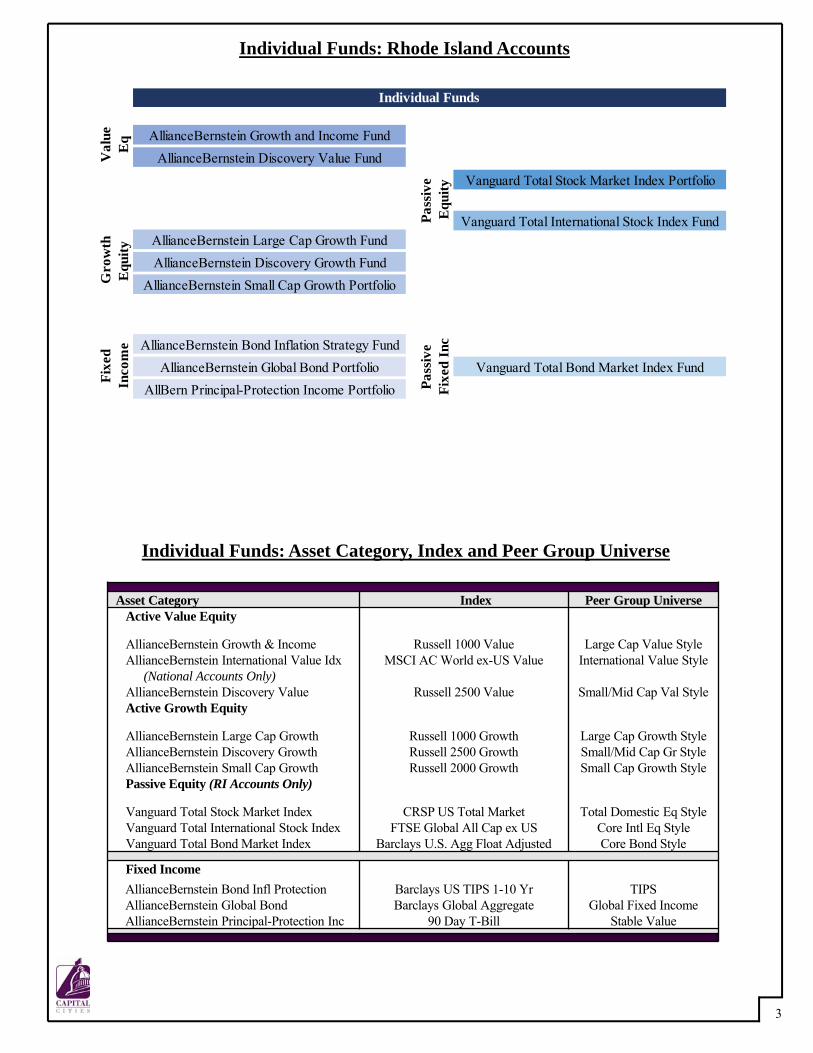
3
Individual Funds: Rhode Island Accounts
Individual Funds: Asset Category, Index and Peer Group Universe
Asset Category Index Peer Group UniverseActive Value Equity
AllianceBernstein Growth & Income Russell 1000 Value Large Cap Value StyleAllianceBernstein International Value Idx
(National Accounts Only)MSCI AC World ex-US Value International Value Style
AllianceBernstein Discovery Value Russell 2500 Value Small/Mid Cap Val StyleActive Growth Equity
AllianceBernstein Large Cap Growth Russell 1000 Growth Large Cap Growth StyleAllianceBernstein Discovery Growth Russell 2500 Growth Small/Mid Cap Gr StyleAllianceBernstein Small Cap Growth Russell 2000 Growth Small Cap Growth StylePassive Equity (RI Accounts Only)
Vanguard Total Stock Market Index CRSP US Total Market Total Domestic Eq StyleVanguard Total International Stock Index FTSE Global All Cap ex US Core Intl Eq StyleVanguard Total Bond Market Index Barclays U.S. Agg Float Adjusted Core Bond Style
Fixed IncomeAllianceBernstein Bond Infl ProtectionAllianceBernstein Global BondAllianceBernstein Principal-Protection Inc
Barclays US TIPS 1-10 YrBarclays Global Aggregate
90 Day T-Bill
TIPSGlobal Fixed Income
Stable Value
AllianceBernstein Growth and Income FundAllianceBernstein Discovery Value Fund
Vanguard Total Stock Market Index Portfolio
Vanguard Total International Stock Index FundAllianceBernstein Large Cap Growth FundAllianceBernstein Discovery Growth Fund
AllianceBernstein Small Cap Growth Portfolio
AllianceBernstein Bond Inflation Strategy FundAllianceBernstein Global Bond Portfolio Vanguard Total Bond Market Index Fund
AllBern Principal-Protection Income Portfolio
Fixe
d In
com
eV
alue
E
q
Individual Funds
Pass
ive
Equ
ity
Gro
wth
E
quity
Pass
ive
Fixe
d In
c
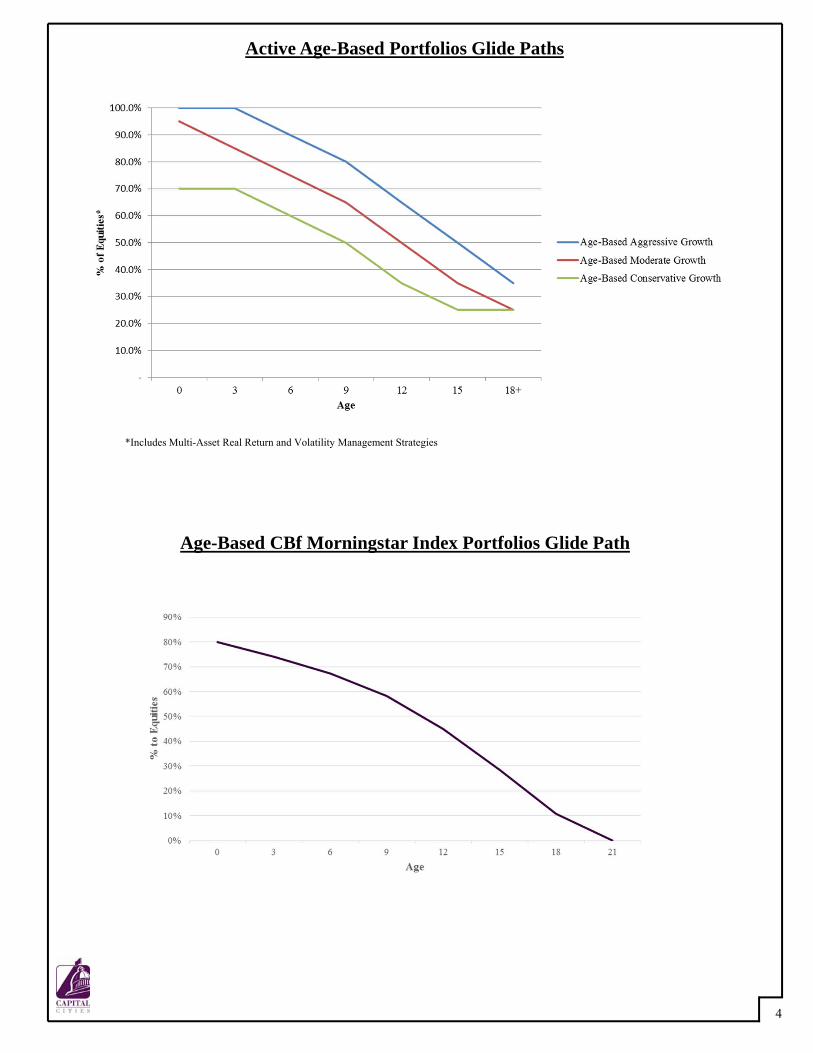
4
Active Age-Based Portfolios Glide Paths
*Includes Multi-Asset Real Return and Volatility Management Strategies
Age-Based CBf Morningstar Index Portfolios Glide Path
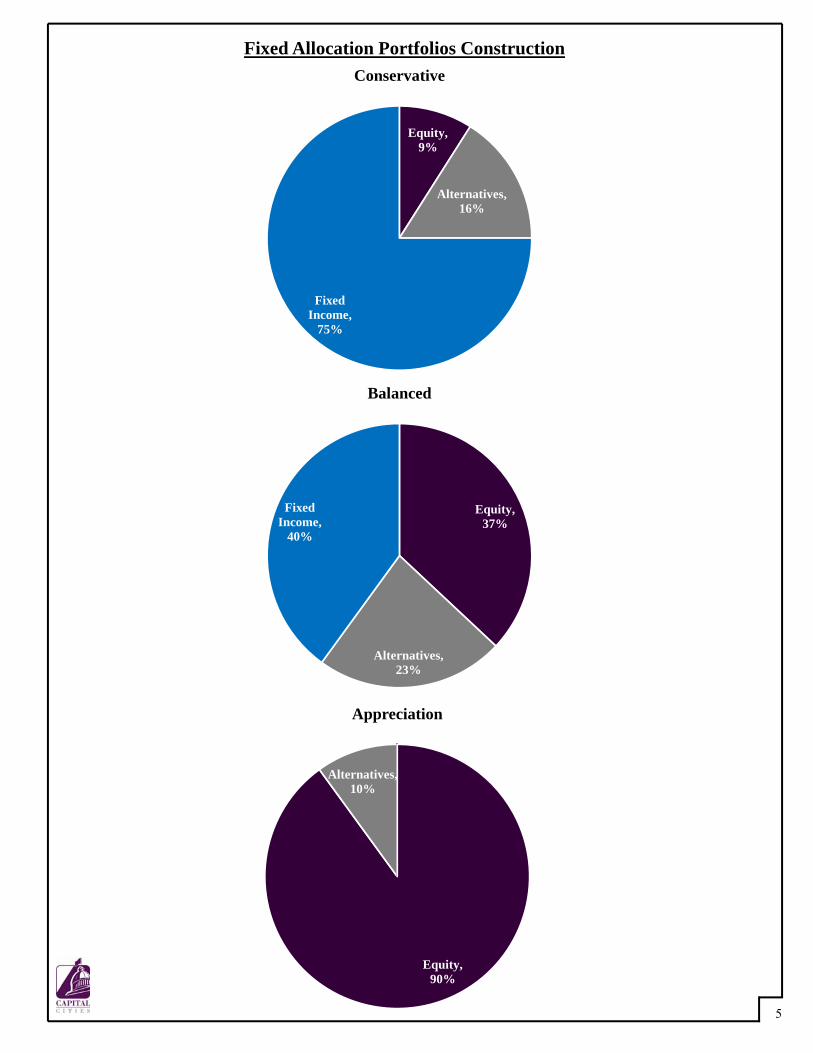
5
Fixed Allocation Portfolios Construction
Equity, 9%
Alternatives, 16%
Fixed Income,
75%
Conservative
Equity, 37%
Alternatives, 23%
Fixed Income,
40%
Balanced
Equity, 90%
Alternatives, 10%
Appreciation

6
Education Strategies Portfolios Fee Schedule
Style National AccountsMedian Peer
Group Fee RI AccountsMedian Peer
Group FeeAge-Based Portfolios
Fixed Allocation Portfolios
Balanced
Conservative
CBf Morningstar Index
Conservative Growth
Moderate Growth
Aggressive Growth
Appreciation
Age-Based 74-94 basis points 81 basis points
Age-Based 72-82 basis points 81 basis points
Age-Based 72-92 basis points 81 basis points
20 basis points
20 basis points
20 basis points
Fixed Allocation 72 basis points 81 basis points
Fixed Allocation 80 basis points 80 basis points
108 basis points
Fixed Allocation 94 basis points 94 basis points
Age-Based 45-56 basis points
108 basis points
81 basis points
81 basis points
16 basis points
72 basis points
37 basis points
108 basis points
108 basis points
108 basis points
75 basis points
108 basis points
*Median Peer Group Fees are based on “Morningstar Names Best 529 College-Savings Plans for 2014” dated October 21, 2014.
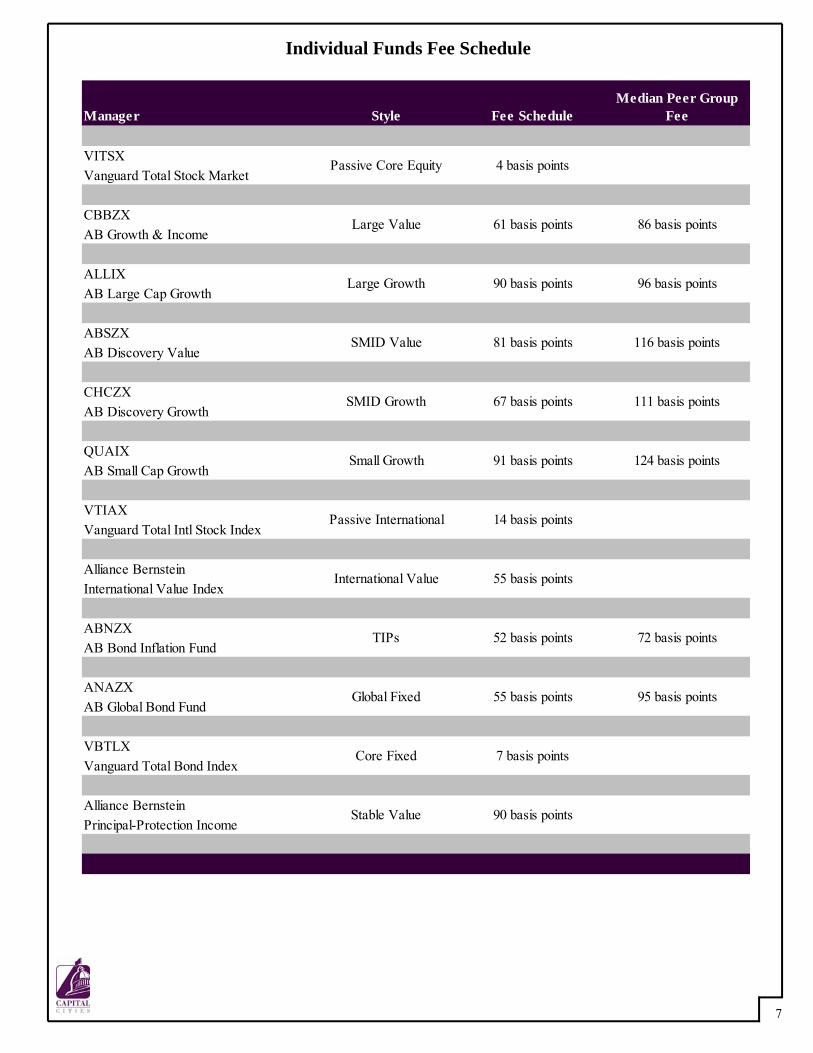
7
Individual Funds Fee Schedule
Manager Style Fee ScheduleMedian Peer Group
Fee
VITSXVanguard Total Stock Market
CBBZXAB Growth & Income
ALLIXAB Large Cap Growth
ABSZXAB Discovery Value
CHCZXAB Discovery Growth
QUAIXAB Small Cap Growth
VTIAXVanguard Total Intl Stock Index
Alliance BernsteinInternational Value Index
ABNZXAB Bond Inflation Fund
ANAZXAB Global Bond Fund
VBTLXVanguard Total Bond Index
Alliance BernsteinPrincipal-Protection Income
Core Fixed 7 basis points
Stable Value 90 basis points
TIPs 52 basis points 72 basis points
Global Fixed 55 basis points 95 basis points
Passive International 14 basis points
International Value 55 basis points
Small Growth 91 basis points 124 basis points
SMID Growth 67 basis points 111 basis points
SMID Value 81 basis points 116 basis points
Large Growth 90 basis points 96 basis points
Large Value 61 basis points 86 basis points
Passive Core Equity 4 basis points
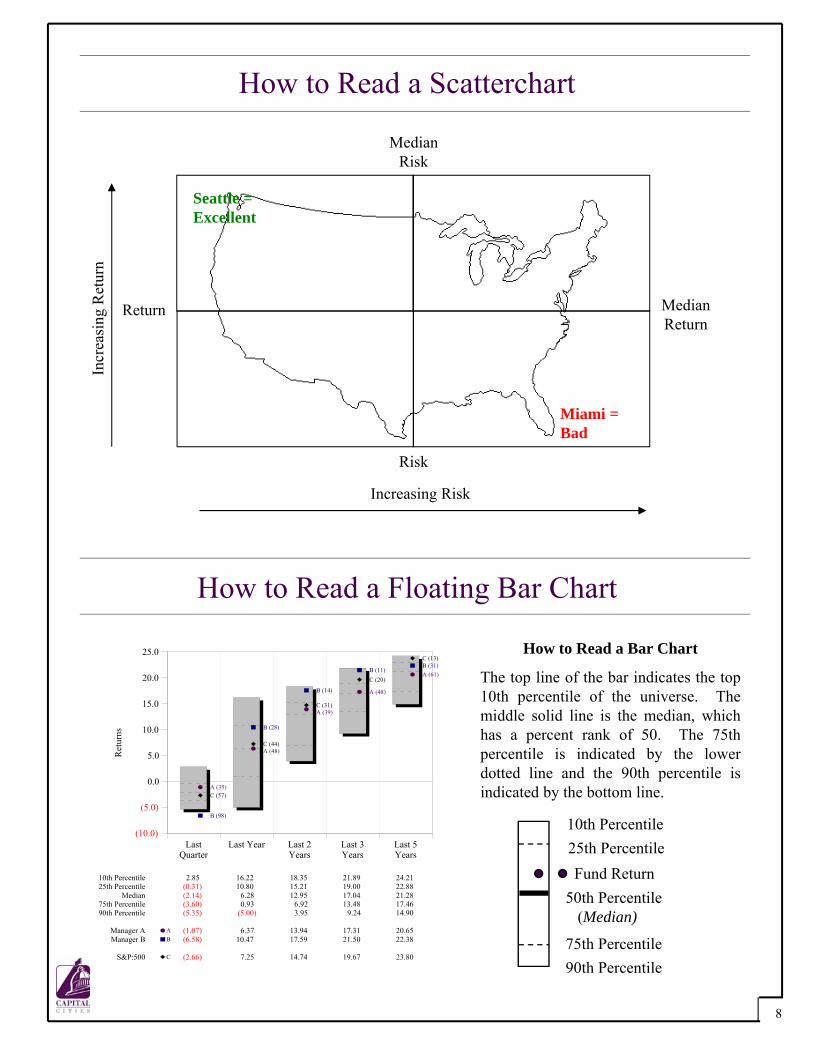
How to Read a Floating Bar Chart
QuarterLast Last Year
YearsLast 2
YearsLast 3
YearsLast 5
(10.0)
(5.0)
0.0
5.0
10.0
15.0
20.0
25.0
10th Percentile 2.85 16.22 18.35 21.89 24.2125th Percentile (0.31) 10.80 15.21 19.00 22.88
Median (2.14) 6.28 12.95 17.04 21.2875th Percentile (3.60) 0.93 6.92 13.48 17.4690th Percentile (5.35) (5.00) 3.95 9.24 14.90
Manager A A (1.07) 6.37 13.94 17.31 20.65Manager B B (6.58) 10.47 17.59 21.50 22.38
S&P:500 C (2.66) 7.25 14.74 19.67 23.80
Ret
urns
A (35)
A (48)
A (39)
A (48)
A (61)
B (98)
B (28)
B (14)
B (11)B (31)
C (57)
C (44)
C (31)
C (20)
C (13)
10th Percentile25th Percentile
50th Percentile(Median)
75th Percentile
Fund Return
How to Read a Scatterchart
Return Median Return
Median Risk
Risk
Increasing Risk
Incr
easi
ng R
etur
n
Seattle = Excellent
Miami = Bad
How to Read a Bar Chart
The top line of the bar indicates the top10th percentile of the universe. Themiddle solid line is the median, whichhas a percent rank of 50. The 75thpercentile is indicated by the lowerdotted line and the 90th percentile isindicated by the bottom line.
90th Percentile
8

![Untitled-1 [] · 16. Those members who have so far not en-cashed their Final Dividend for the years March 31, 2009, March 31, 2010, March 31, 2011, March 31, 2012 March 31, 2013 March](https://img.pdfslide.us/doc/110x75/5f0a630d7e708231d42b62a6/untitled-1-16-those-members-who-have-so-far-not-en-cashed-their-final-dividend.jpg)