Embed Size (px)
Citation preview

Solutions for Today | Options for Tomorrow
Preliminary Cost and Performance Results for a Natural Gas-fired Direct sCO2 Power PlantCharles W. White, Nathan T. Weiland
6th International Supercritical CO2 Power Cycles Symposium
March 27th, 2018
March 27, 2017

2
Sulfinol
Illinois No. 6
• Direct combustion of fuels (NG, coal-derived syngas) and oxygen in sCO2 working fluid
• sCO2 and water from combustion expanded in turbine to generate power
• Moderate pressure ratio (8-10), relatively high turbine inlet temperatures (Tin = 1200 °C)
• Cycle limited by recuperator inlet temperature at turbine exhaust, requires expensive alloys to achieve higher TIT
• Recuperation of heat to sCO2 recycled to the combustor significantly improves efficiency
• High purity CO2 purge stream ready for storage or EOR
• Near-complete carbon capture at storage pressure• Low or no water consumption
• Water condensed from the primarily sCO2 exhaust• Water producing cycle if dry cooling is used
Technology Overview – Direct sCO2 CyclesCharacteristics and Benefits
ASUAirN2
O2
SHELL SGC QuenchCOS
S Cap
H2S
S
Dryer
Air
Q
3
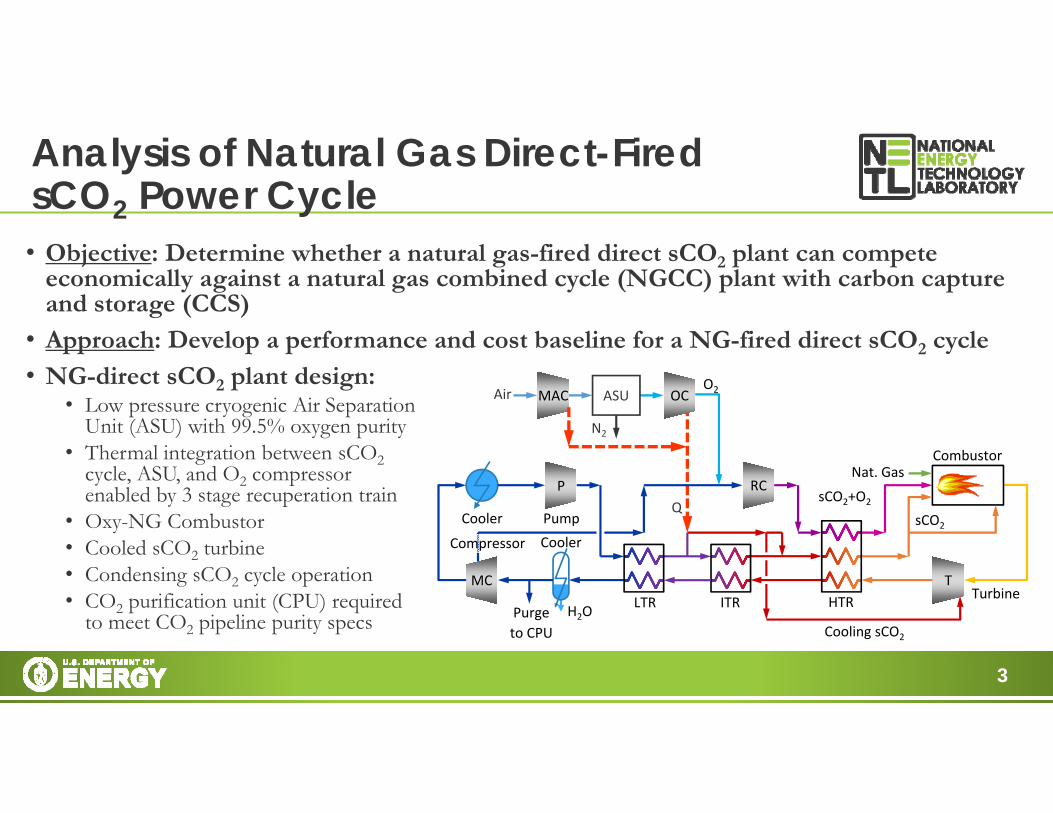
• Objective: Determine whether a natural gas-fired direct sCO2 plant can compete economically against a natural gas combined cycle (NGCC) plant with carbon capture and storage (CCS)
• Approach: Develop a performance and cost baseline for a NG-fired direct sCO2 cycle
• NG-direct sCO2 plant design:• Low pressure cryogenic Air Separation
Unit (ASU) with 99.5% oxygen purity • Thermal integration between sCO2
cycle, ASU, and O2 compressor enabled by 3 stage recuperation train
• Oxy-NG Combustor• Cooled sCO2 turbine• Condensing sCO2 cycle operation • CO2 purification unit (CPU) required
to meet CO2 pipeline purity specs
Analysis of Natural Gas Direct-Fired sCO2 Power Cycle
Purgeto CPU
P
TMC
CoolerCooler
O2
H2O
Combustor
Compressor
Pump
Turbine
ASU
N2
Air
LTR HTR
Cooling sCO2
sCO2+O2
MAC
QsCO2
Nat. Gas
ITR
OC
RC

4
• Modeled two thermally-integrated Shell gasifier/ direct sCO2 plants with carbon capture1,2
• Net plant thermal efficiency of 40.6% (HHV) with 99% carbon capture
• 20% Cost of Electricity (COE) improvement over Shell IGCC system with carbon capture, mostly due to higher thermal efficiency
• Future gasification/direct sCO2 analyses will consider different gasifier types and/or syngas cleanup strategies to improve plant efficiency
• Catalytic gasification, GE quench and radiant gasifiers• In-situ syngas cleanup (i.e. 8 Rivers’ approach) may improve
efficiency to ~44%
BackgroundNETL’s Integrated Gasification Direct sCO2 Cycle Study1,2
Shell Gasifier GE Gasifier
37.740.6 39.6
31.232.6
35.738.0
20
25
30
35
40
45
Net
Pla
nt E
ffici
ency
(%, H
HV)
sCO2
IGCC
1 Weiland, N.T., Shelton, W., Shultz. T., White, C.W., and Gray, D. "Performance and Cost Assessment of a Coal Gasification Power Plant Integrated with a Direct‐Fired sCO2 Brayton Cycle," Report: NETL‐PUB‐21435, 2017. 2 Weiland, N.T., and White, C.W., "Techno‐economic Analysis of an Integrated Gasification Direct‐Fired Supercritical CO2 Power Cycle," Fuel, 212:613‐625, 2018.
5
CO2Storage
Cooler
RecuperatorCooler
Natural Gas
Oxygen
sCO2
H2O
Combustor
Turbine
Compressor
Pump
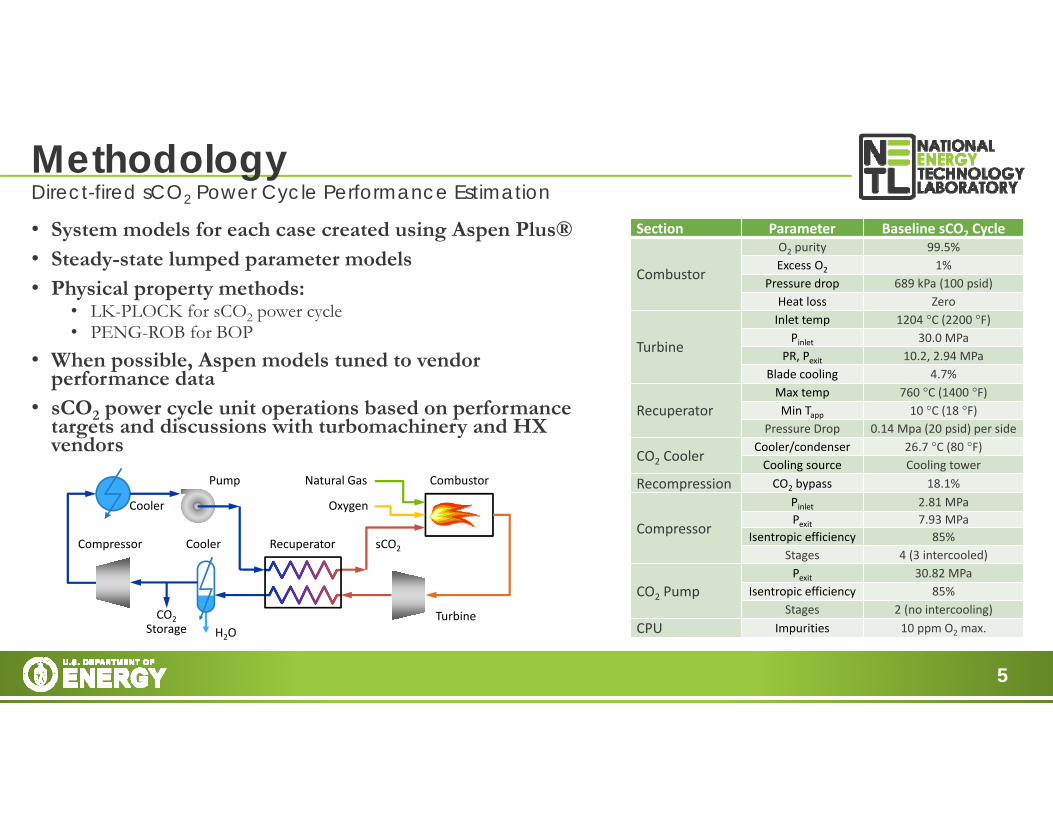
• System models for each case created using Aspen Plus®• Steady-state lumped parameter models• Physical property methods:
• LK-PLOCK for sCO2 power cycle• PENG-ROB for BOP
• When possible, Aspen models tuned to vendor performance data
• sCO2 power cycle unit operations based on performance targets and discussions with turbomachinery and HX vendors
MethodologyDirect-fired sCO2 Power Cycle Performance Estimation
Section Parameter Baseline sCO2 Cycle
Combustor
O2 purity 99.5%Excess O2 1%
Pressure drop 689 kPa (100 psid)Heat loss Zero
Turbine
Inlet temp 1204 °C (2200 °F)Pinlet 30.0 MPa
PR, Pexit 10.2, 2.94 MPaBlade cooling 4.7%
RecuperatorMax temp 760 °C (1400 °F)Min Tapp 10 °C (18 °F)
Pressure Drop 0.14 Mpa (20 psid) per side
CO2 CoolerCooler/condenser 26.7 °C (80 °F)Cooling source Cooling tower
Recompression CO2 bypass 18.1%
Compressor
Pinlet 2.81 MPaPexit 7.93 MPa
Isentropic efficiency 85%Stages 4 (3 intercooled)
CO2 PumpPexit 30.82 MPa
Isentropic efficiency 85%Stages 2 (no intercooling)
CPU Impurities 10 ppm O2 max.
6
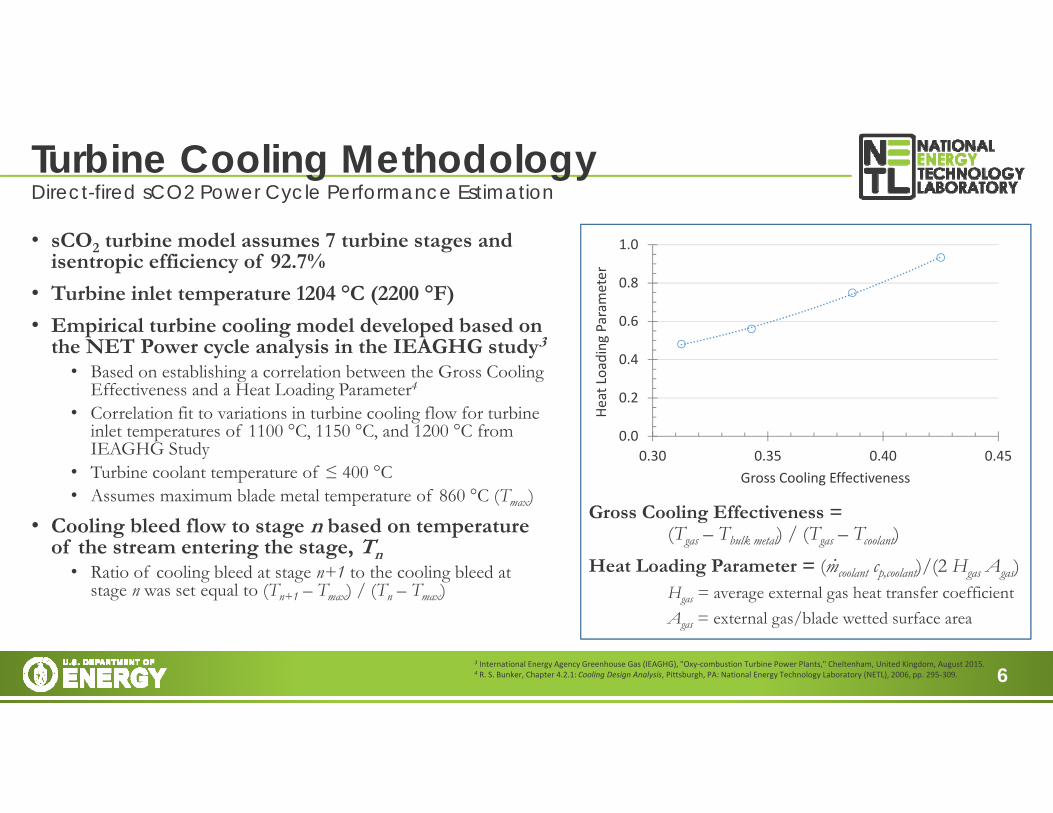
• sCO2 turbine model assumes 7 turbine stages and isentropic efficiency of 92.7%
• Turbine inlet temperature 1204 °C (2200 °F)
• Empirical turbine cooling model developed based on the NET Power cycle analysis in the IEAGHG study3
• Based on establishing a correlation between the Gross Cooling Effectiveness and a Heat Loading Parameter4
• Correlation fit to variations in turbine cooling flow for turbine inlet temperatures of 1100 °C, 1150 °C, and 1200 °C from IEAGHG Study
• Turbine coolant temperature of ≤ 400 °C• Assumes maximum blade metal temperature of 860 °C (Tmax)
• Cooling bleed flow to stage n based on temperature of the stream entering the stage, Tn
• Ratio of cooling bleed at stage n+1 to the cooling bleed at stage n was set equal to (Tn+1 – Tmax) / (Tn – Tmax)
Turbine Cooling MethodologyDirect-fired sCO2 Power Cycle Performance Estimation
3 International Energy Agency Greenhouse Gas (IEAGHG), "Oxy‐combustion Turbine Power Plants," Cheltenham, United Kingdom, August 2015.4 R. S. Bunker, Chapter 4.2.1: Cooling Design Analysis, Pittsburgh, PA: National Energy Technology Laboratory (NETL), 2006, pp. 295‐309.
0.0
0.2
0.4
0.6
0.8
1.0
0.30 0.35 0.40 0.45
Heat Loading
Param
eter
Gross Cooling Effectiveness
Gross Cooling Effectiveness = (Tgas – Tbulk metal) / (Tgas – Tcoolant)
Heat Loading Parameter = (mcoolant cp,coolant)/(2 Hgas Agas)Hgas = average external gas heat transfer coefficientAgas = external gas/blade wetted surface area

7
Baseline Natural Gas Direct sCO2 PlantSelect State Point Data
Purgeto CPU
P
TMC
Cooler
Cooler
O2
H2O
Combustor
Compressor
Pump
Turbine
ASU
N2
Air
LTR HTR
Cooling sCO2
sCO2+O2
MAC
QsCO2
Nat. Gas
ITR
OC
RC
757 °C29.4 bar
237 °C
736 °C
736 °C227 °C
227 °C 221 °C
183 °C19.3%
118 °C76 °C27 °C28.1 bar
27 °C
43 °C79.3 bar
43 °C308.2 bar
105 °C
300 °C64.1 bar
56 °C 227 °C307.6 bar
166.7 MWt 225.9 MWt
844.3 MWt
240.1 MWt
1084.4 MWt
56.2 MW
41.6 MW74.8 MW
32.1 MWt9.6 MWt
948.5 MW
49.7 MW
88.0 MW183 °C
1204 °C299.9 bar
27 °C64.1 bar18.1%
36.8 MWt
4.9 MWtN2 Heater
4.7 MWt
1204 °C
0.0%
8
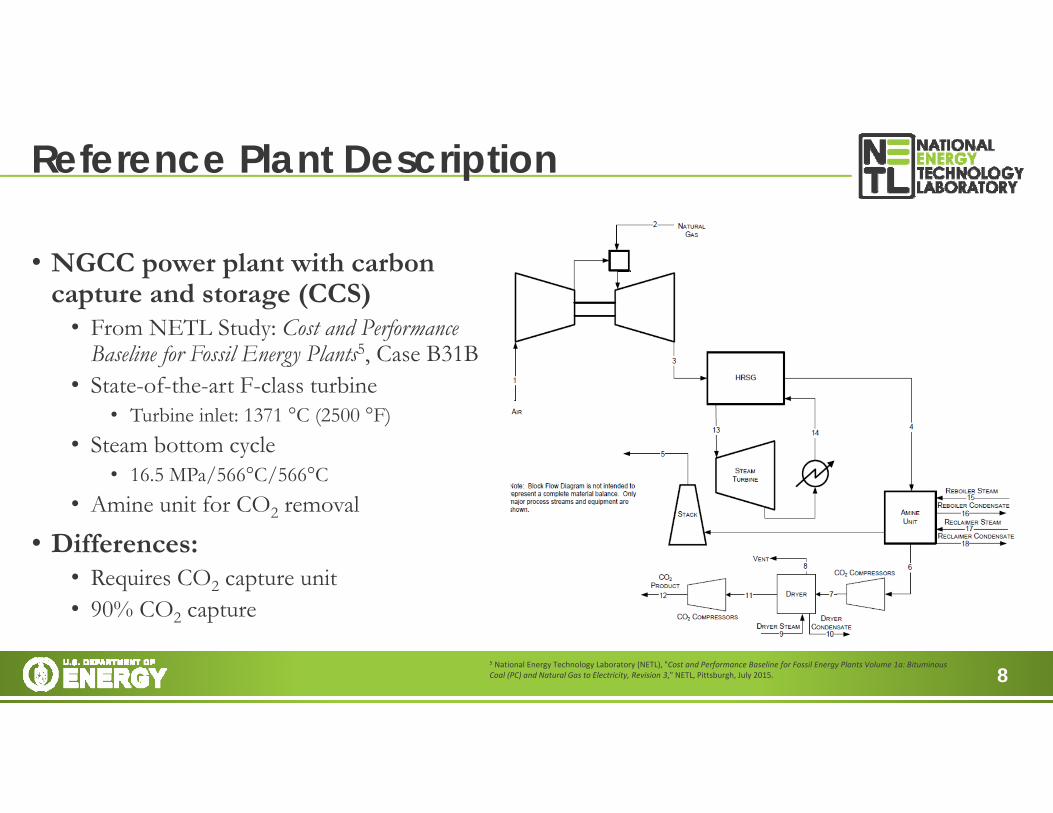
• NGCC power plant with carbon capture and storage (CCS)
• From NETL Study: Cost and Performance Baseline for Fossil Energy Plants5, Case B31B
• State-of-the-art F-class turbine• Turbine inlet: 1371 °C (2500 °F)
• Steam bottom cycle• 16.5 MPa/566°C/566°C
• Amine unit for CO2 removal
• Differences:• Requires CO2 capture unit• 90% CO2 capture
Reference Plant Description
5 National Energy Technology Laboratory (NETL), "Cost and Performance Baseline for Fossil Energy Plants Volume 1a: Bituminous Coal (PC) and Natural Gas to Electricity, Revision 3," NETL, Pittsburgh, July 2015.

9
Natural Gas Direct sCO2 PerformanceBaseline sCO2 Compared to NGCC w/CCS
• sCO2 plant produces an additional 31 MWe (6%) net power output for the same natural gas fuel input
• sCO2 plant has large auxiliary power loads associated with the ASU and the sCO2 Oxygen Compressor
• Overall sCO2 plant auxiliary power requirement is 3.5 times higher than for the NGCC plant with CCS
Parameter NGCC5 sCO2 CyclePower Summary (MW)
Combustion Turbine Power 428 949Steam Turbine Power 182 ‐‐‐CO2 Pre‐compressor Power ‐‐‐ ‐88CO2 Pump Power ‐‐‐ ‐50CO2 Recycle Compressor Power ‐‐‐ ‐56Generator Loss ‐9 ‐16Total Gross Power 601 738
Auxiliary Load Summary (MWe)ASU Main Air Compressor ‐‐‐ 74.8Natural Gas Compressor ‐‐‐ 12.7sCO2 Oxygen Compressor ‐‐‐ 41.6CO2 Capture/Removal Auxiliaries 13.0 ‐‐‐CPU & CO2 Compression 15.0 8.7Feedwater Pumps 3.6 ‐‐‐Circulating Water Pumps 4.3 4.2Cooling Tower Fans 2.2 2.2Transformer Losses 1.8 2.6Miscellaneous Balance of Plant 1.8 1.5Total Auxiliaries 42 148Net Power 559 590
5 National Energy Technology Laboratory (NETL), "Cost and Performance Baseline for Fossil Energy Plants Volume 1a: Bituminous Coal (PC) and Natural Gas to Electricity, Revision 3," NETL, Pittsburgh, July 2015.

10
Natural Gas Direct sCO2 PerformanceBaseline sCO2 Compared to NGCC w/CCS
• sCO2 plant achieves greater HHV efficiency, 48.2% vs. 45.7%, due to cycle efficiency differences
• sCO2 plant captures more carbon (98.2%) than the NGCC plant
• NGCC limited to 90.7% carbon capture by amine process
• sCO2 plant consumes 17% less water
Parameter NGCC5 sCO2 CycleNatural Gas Feed Flow, kg/hr 84,134 84,134HHV Thermal Input, MWth 1,223 1,223LHV Thermal Input, MWth 1,105 1,105Total Gross Power, MWe 601 738Total Auxiliaries, MWe 42 148Total Net Power, MWe 559 590HHV Net Plant Efficiency, % 45.7 48.2HHV CT/sCO2 Cycle Efficiency, % 34.5 58.6LHV Net Plant Efficiency, % 50.6 53.4LHV CT/sCO2 Cycle Efficiency, % 38.1 66.8Steam Turbine Cycle Efficiency, % 43.5 ‐‐‐Condenser/sCO2 Cooler Duty, GJ/hr 888 1,978Raw Water Withdrawal, (m3/min)/MWnet 0.027 0.023Raw Water Consumption, (m3/min)/MWnet 0.020 0.016Carbon Capture Fraction, % 90.7 98.2Captured CO2 Purity, mol% 99.93 100.00
5 National Energy Technology Laboratory (NETL), "Cost and Performance Baseline for Fossil Energy Plants Volume 1a: Bituminous Coal (PC) and Natural Gas to Electricity, Revision 3," NETL, Pittsburgh, July 2015.

11
Natural Gas Direct sCO2 PerformanceBaseline sCO2 Compared to Other NGCC w/CCS
• sCO2 plant performance compared to advanced NGCC plants
• NETL 2013 Report: Current and Future Technologies for Natural Gas Combined Cycle (NGCC) Power Plants6
• Considers larger gas turbine frame sizes, higher firing temperatures, and exhaust gas recirculation (EGR)
• sCO2 cycle between H-frame and J-frame NGCC cases, with higher carbon capture fraction
• Economic assumptions slightly different, thus Cost of Electricity (COE) is not compared
6 National Energy Technology Laboratory (NETL), "Current and Future Technologies for Natural Gas Combined Cycle (NGCC) Power Plants," NETL, Pittsburgh, June 2013.
ParametersCO2Cycle
NGCC Cases with CO2 Capture6
SOTA7FA.05
SOTA7FA.05+EGR
SOTAH‐frame
Adv.J‐frame
Turbine Inlet Temperature, °C 1204 1359 1363 1487 1621
Turbine Pressure Ratio 10.2 17 17 20 23
HHV Thermal Input, MWth 1223 1223 1233 1528 1737
Gas/sCO2 Turbine Power, MWe 738 421 419 551 690
Steam Turbine Power, MWe ‐‐ 186 197 235 252
Total Auxiliaries, MWe 148 54 52 66 72
Total Net Power, MWe 590 553 563 721 870
HHV Net Plant Efficiency, % 48.2 45.2 45.7 47.2 50.1
Carbon Capture Fraction, % 98.2 90.0 90.0 90.0 90.0

12
Natural Gas Direct sCO2 PerformanceRecuperator T-Q Diagram
0
100
200
300
400
500
600
700
800
0 200 400 600 800 1000 1200 1400
Tempe
rature (°C)
Duty (MW)
Hot Side
Cold Side
LTR ITR HTR
• Minimum Tapproachoccurs at the hot end of the ITR
• Large Tapproach at the cold end of LTR due to water condensation on the hot side
• Average Tapproach just above 25 °C
• Average LMDT is a little below 18 °C

13
• Oxy-combustor Turbine• Assumes inner and outer casings, similar to Toshiba’s design• Outer casing based cost for a similarly-sized HP steam turbine• Balance of turbine and combustor analogous to conventional
gas turbine without compressor (-18%)• sCO2 Recuperators and Coolers
• Based on vendor recuperator estimates for a utility-scale recompression sCO2 cycle, adjusted for total duty and driving force
• For CO2 coolers, LTR, and ITR: $0.294/(W/K)• For HTR, assume two units with different materials, installed in series:
• For hot side temperature < 600 °C: $0.253/(W/K)• For hot side temperature > 600 °C: $1.318/(W/K)
• Economic sensitivity to recuperator specific costs performed• Compressor and Pump
• Based on vendor quote data for the main and bypass compressors for a utility-scale recompression Brayton sCO2 cycle
• Scaling algorithm divides the equipment cost into required power (60%), inlet volumetric flow rate (20%), and inlet temperature (20%)
• New compressor scaling algorithm under development
Methodology – Economic AnalysissCO2 Power Cycle Component Capital Cost Estimation
CO2Storage
Cooler
RecuperatorCooler
Natural Gas
Oxygen
sCO2
H2O
Combustor
Turbine
Compressor
Pump
Turbine19%
CO₂ Compressor23%
CO₂ Pump6% CO₂
Recompressor8%
O₂ Compressor21%
Nat. Gas Compressor
2%
HTR11%
ITR3%
LTR1%CO₂ pre‐cooler
1%
CO₂ cooler/ condenser
1%
Piping2%
Foundations2%

14
• Capital Cost Estimation• Costs estimated for a nth-of-a-kind (NOAK) plant• Total Plant Cost includes estimated costs for equipment,
installation, contractor fees, and contingencies Total overnight cost (TOC) calculated as sum of TPC and Owner’s Costs
• Typically -15% to +30% accuracy for NETL Baseline studies, but higher for this study due to early stage of direct sCO2 technology
• Operation and Maintenance (O&M) Costs• Scaled based on cost algorithms used in coal gasification/direct
sCO2 study1
• Assumptions: • Capacity Factor (CF) = 85%• Operating Labor = 6 operators/shift• Natural Gas Price = $6.13/MMBtu
• Cost of Electricity (COE)• TOC annualized using capital charge factor (CCF) assuming a 3
year construction period and 30 year operating lifetime• COE = sum of annualized capital cost, O&M costs, and T&S
costs, normalized to net plant output ($/MWh)
Methodology – Economic AnalysisStandardized NETL Economic Analysis Methodology7
· ·
·1 Weiland, N.T., Shelton, W., Shultz. T., White, C.W., and Gray, D. "Performance and Cost Assessment of a Coal Gasification Power Plant Integrated with a Direct‐Fired sCO2 Brayton Cycle," Report: NETL‐PUB‐21435, 2017. 7 National Energy Technology Laboratory (NETL), "Quality Guidelines for Energy System Studies, Cost Estimation Methodology for NETL Assessments of Power Plant Performance," NETL, Pittsburgh, January 2013.
15
Baseline Direct sCO2 Economic AnalysisBaseline sCO2 Capital Costs Compared to NGCC w/CCS
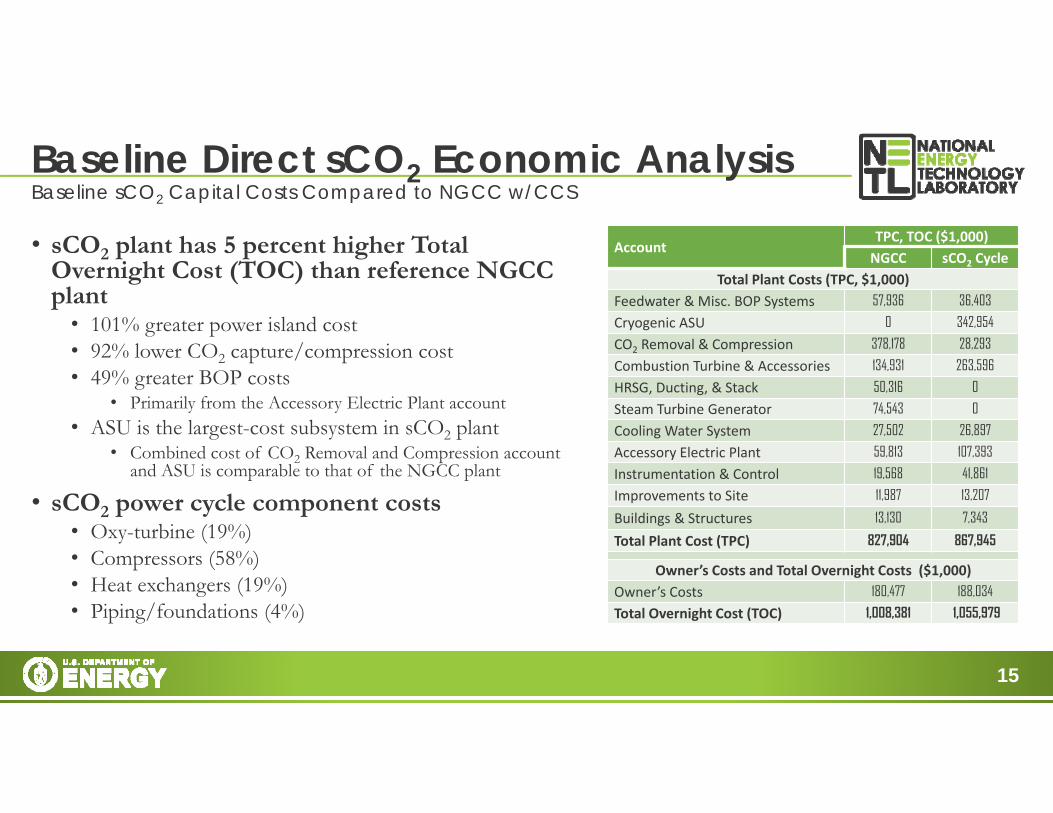
• sCO2 plant has 5 percent higher Total Overnight Cost (TOC) than reference NGCC plant
• 101% greater power island cost• 92% lower CO2 capture/compression cost• 49% greater BOP costs
• Primarily from the Accessory Electric Plant account• ASU is the largest-cost subsystem in sCO2 plant
• Combined cost of CO2 Removal and Compression account and ASU is comparable to that of the NGCC plant
• sCO2 power cycle component costs• Oxy-turbine (19%)• Compressors (58%)• Heat exchangers (19%)• Piping/foundations (4%)
AccountTPC, TOC ($1,000)NGCC sCO2 Cycle
Total Plant Costs (TPC, $1,000)Feedwater & Misc. BOP Systems 57,936 36,403
Cryogenic ASU 0 342,954
CO2 Removal & Compression 378,178 28,293
Combustion Turbine & Accessories 134,931 263,596
HRSG, Ducting, & Stack 50,316 0
Steam Turbine Generator 74,543 0
Cooling Water System 27,502 26,897
Accessory Electric Plant 59,813 107,393
Instrumentation & Control 19,568 41,861
Improvements to Site 11,987 13,207
Buildings & Structures 13,130 7,343
Total Plant Cost (TPC) 827,904 867,945
Owner’s Costs and Total Overnight Costs ($1,000)Owner’s Costs 180,477 188,034
Total Overnight Cost (TOC) 1,008,381 1,055,979
16
Baseline Direct sCO2 Economic AnalysisBaseline sCO2 COE Compared to NGCC w/CCS
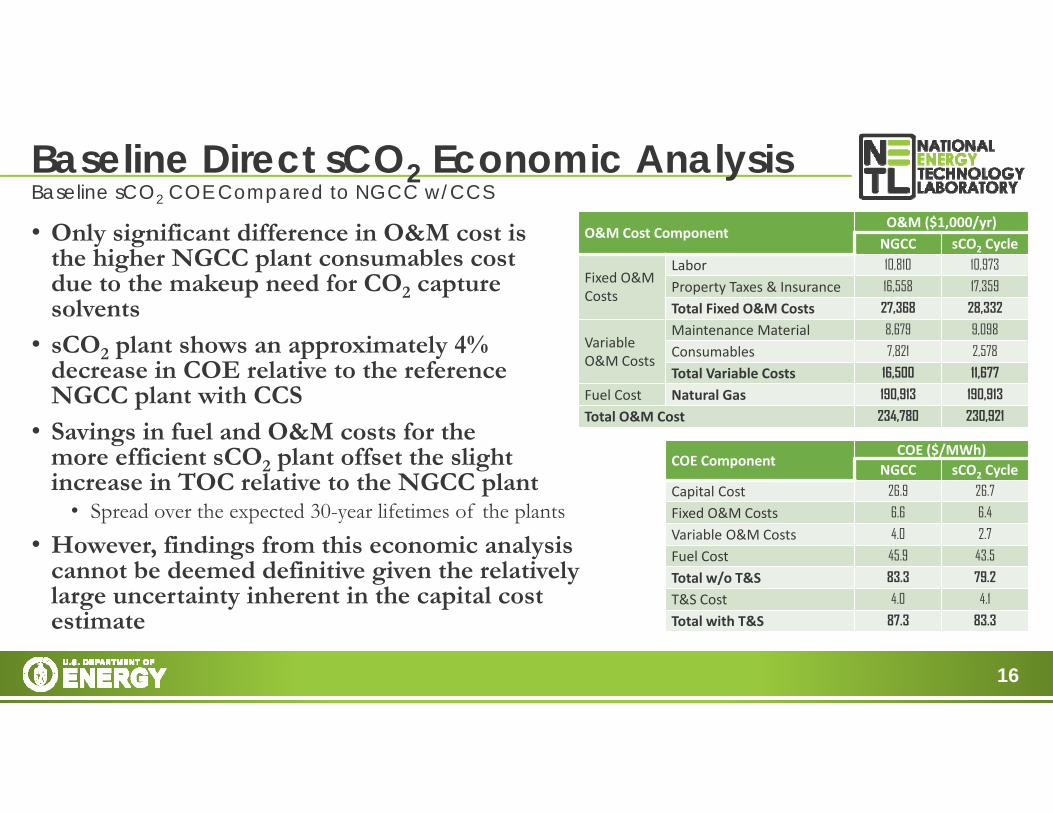
• Only significant difference in O&M cost is the higher NGCC plant consumables cost due to the makeup need for CO2 capture solvents
• sCO2 plant shows an approximately 4% decrease in COE relative to the reference NGCC plant with CCS
• Savings in fuel and O&M costs for the more efficient sCO2 plant offset the slight increase in TOC relative to the NGCC plant
• Spread over the expected 30-year lifetimes of the plants• However, findings from this economic analysis
cannot be deemed definitive given the relatively large uncertainty inherent in the capital cost estimate
COE ComponentCOE ($/MWh)
NGCC sCO2 CycleCapital Cost 26.9 26.7
Fixed O&M Costs 6.6 6.4
Variable O&M Costs 4.0 2.7
Fuel Cost 45.9 43.5
Total w/o T&S 83.3 79.2
T&S Cost 4.0 4.1
Total with T&S 87.3 83.3
O&M Cost ComponentO&M ($1,000/yr)NGCC sCO2 Cycle
Fixed O&M Costs
Labor 10,810 10,973
Property Taxes & Insurance 16,558 17,359
Total Fixed O&M Costs 27,368 28,332
Variable O&M Costs
Maintenance Material 8,679 9,098
Consumables 7,821 2,578
Total Variable Costs 16,500 11,677
Fuel Cost Natural Gas 190,913 190,913
Total O&M Cost 234,780 230,921

17
Comparison with Other StudiesPlant Design and Performance Comparison
Item Units This Study
8 Rivers Capital8 IEAGHG9 EPRI10 Scaccabarozzi
et al11
Turbine Inlet Temp °C 1204 1150 1150 1150 1127.7Turbine Pressure Ratio 10.2 10 8.8 8.8 6.1Turbine Cooling Flow % 4.7 11.5 11.5 6.6Turbine Coolant Temp °C 183 <400 400 400 164
Thermal Input (HHV) MWth 1223 1701 1374 851
Net Plant Power MWe 590 846 664 425Net Plant Efficiency %, HHV 48.2 53.1 49.9 48.4 50.0Specific Power kJ/kg 334.2 300.0 290.8 267.4CO2 capture % 98.2% 100.0% 90.0% 90.1%CO2 purity % 100% 94% 99.8% 99.6%Specific Plant Cost $/kWe† 1471 ~1000* 1651 1555
†2011 dollar year basis; *target
• Efficiency of the system in this study is slightly low compared to thermal efficiencies obtained in other studies
• Primarily a result of the higher CO2capture fraction and purity
• Specific power in this study is higher than other studies
• Specific Power = PowerNet Plant / turbine exit flow
• Increased Specific Power due to:• Higher pressure ratio• Higher turbine inlet temperature • Lower turbine cooling flow
• Contributes to the lower specific plant cost relative to the IEAGHG and EPRI studies
8 R. Allam, M. Palmer, G. J. Brown, J. Fetvedt, D. Freed, H. Nomoto, M. Itoh, N. Okita and C. Jones Jr., "High Efficiency and Low Cost of Electricity Generation from Fossil Fuels While Eliminating Atmospheric Emissions, Including Carbon Dioxide," Energy Procedia, 37:1135‐1149, 2013. 9 International Energy Agency Greenhouse Gas (IEAGHG), "Oxy‐combustion Turbine Power Plants," Cheltenham, United Kingdom, August 2015. 10 Electric Power Research Institute (EPRI), "Oxy‐Fired Coal and Natural Gas Power Plants – 2016 Detailed Feasibility Study," 3002008148, Palo Alto, CA, 2017. 11 R. Scaccabarozzi, M. Gatti and E. Martelli, "Thermodynamic optimization and part‐load analysis of the NET Power Cycle," Energy Procedia, 114:551‐560, 2017.
18
Sensitivity to Recuperator Cost Estimates
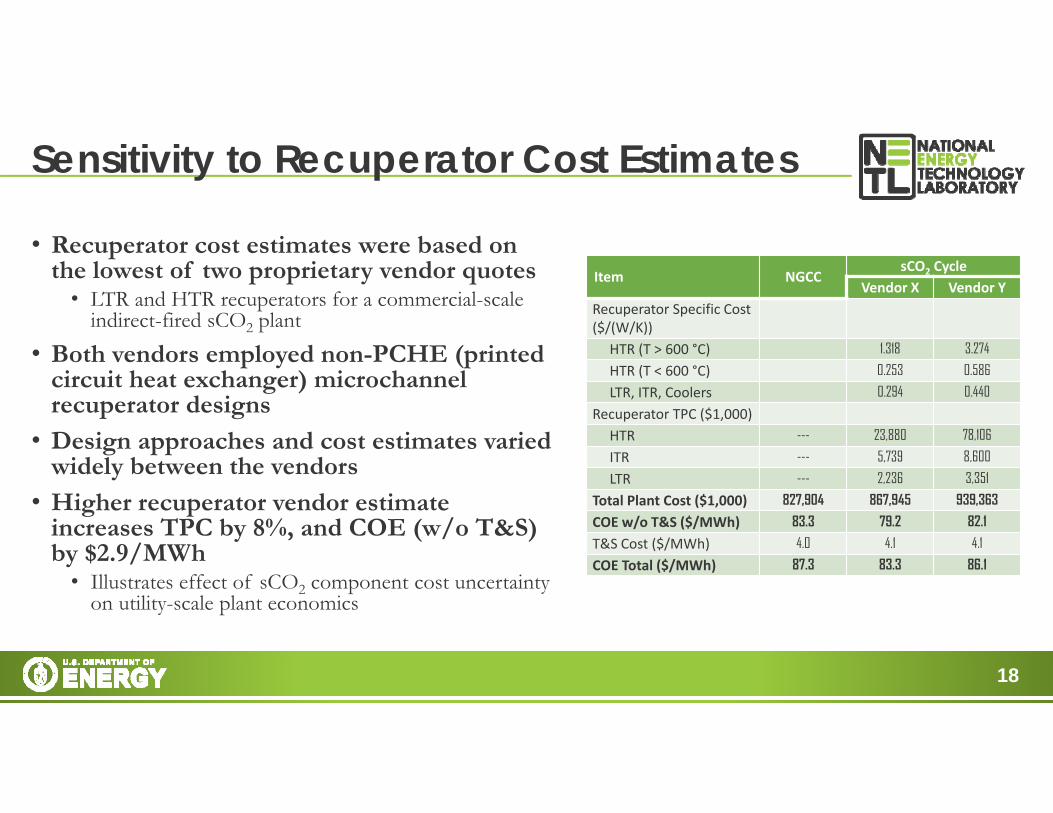
• Recuperator cost estimates were based on the lowest of two proprietary vendor quotes
• LTR and HTR recuperators for a commercial-scale indirect-fired sCO2 plant
• Both vendors employed non-PCHE (printed circuit heat exchanger) microchannel recuperator designs
• Design approaches and cost estimates varied widely between the vendors
• Higher recuperator vendor estimate increases TPC by 8%, and COE (w/o T&S) by $2.9/MWh
• Illustrates effect of sCO2 component cost uncertainty on utility-scale plant economics
Item NGCCsCO2 Cycle
Vendor X Vendor YRecuperator Specific Cost ($/(W/K))
HTR (T > 600 °C) 1.318 3.274
HTR (T < 600 °C) 0.253 0.586
LTR, ITR, Coolers 0.294 0.440
Recuperator TPC ($1,000)HTR --- 23,880 78,106
ITR --- 5,739 8,600
LTR --- 2,236 3,351
Total Plant Cost ($1,000) 827,904 867,945 939,363
COE w/o T&S ($/MWh) 83.3 79.2 82.1
T&S Cost ($/MWh) 4.0 4.1 4.1
COE Total ($/MWh) 87.3 83.3 86.1

19
• A simple incomplete combustion model was developed to determine its effect on cycle and plant performance
• Results thus far all assume complete combustion of natural gas and oxygen to combustion products• Modeled as CO production, which may result from:
• Incomplete fuel/air mixing or combustion instabilities• Slow combustion kinetics relative to combustor residence time• CO2 dissociation at high flame temperatures
• Feed to the combustor consists of four streams: • Natural gas fuel• Preheated, oxygen/sCO2 mixture with 30% oxygen by volume• Recycle sCO2 flow to primary combustion zone• Recycle bypass sCO2 flow to the combustor dilution zone
• 2-Stage Incomplete Combustion Model:• Primary combustion zone:
• Completely oxidizes fuel hydrogen content• Partially oxidizes fuel carbon content using the remaining oxygen to form CO/O2/CO2 equilibrium products• Temperature and equilibrium products represent average flame conditions
• sCO2 flow to the dilution stage simulates a quenching process with perfect mixing and no further chemical reactions occurring
Sensitivity to Incomplete CombustionCombustor Modeling Methodology
Primary Combustion Zone
Dilution Zone
CxHy + (x/2 + y/4) O2 x CO + y/2 H2OCO + ½ O2 CO2
Bypass
20
Sensitivity to Incomplete CombustionCombustor Flame Temperature & CO, O2 Mole Fractions
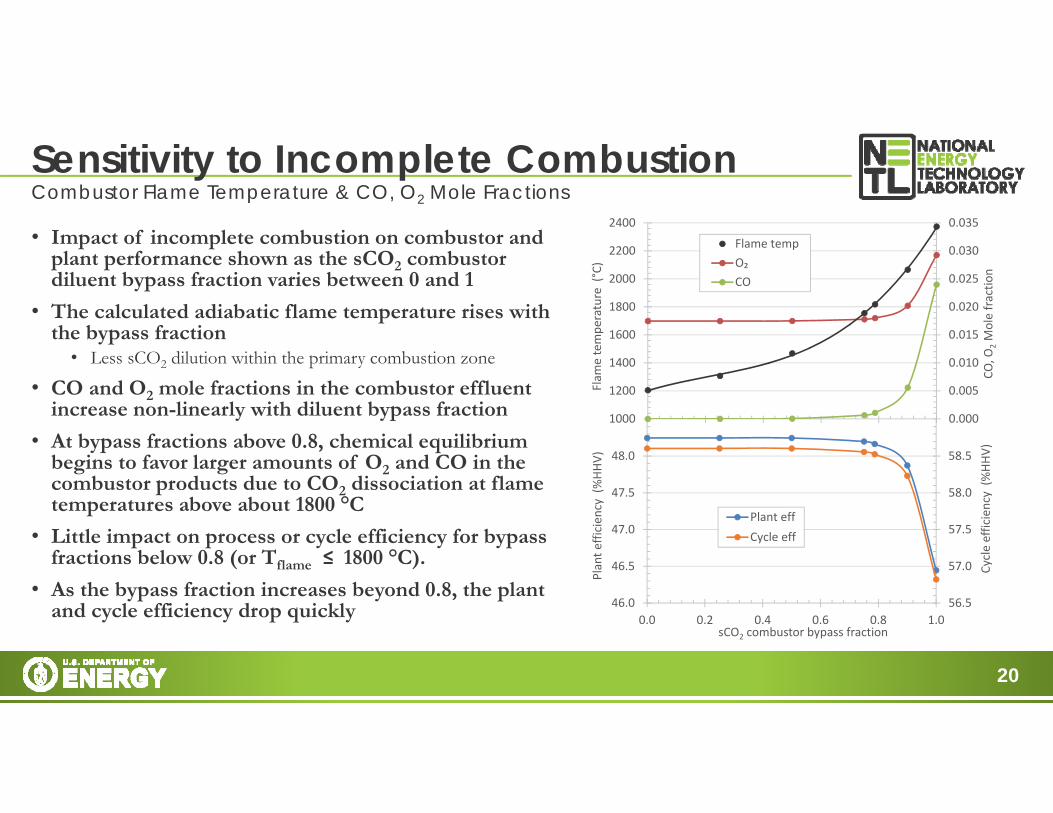
• Impact of incomplete combustion on combustor and plant performance shown as the sCO2 combustor diluent bypass fraction varies between 0 and 1
• The calculated adiabatic flame temperature rises with the bypass fraction
• Less sCO2 dilution within the primary combustion zone
• CO and O2 mole fractions in the combustor effluent increase non-linearly with diluent bypass fraction
• At bypass fractions above 0.8, chemical equilibrium begins to favor larger amounts of O2 and CO in the combustor products due to CO2 dissociation at flame temperatures above about 1800 °C
• Little impact on process or cycle efficiency for bypass fractions below 0.8 (or Tflame ≤ 1800 °C).
• As the bypass fraction increases beyond 0.8, the plant and cycle efficiency drop quickly 56.5
57.0
57.5
58.0
58.5
46.0
46.5
47.0
47.5
48.0
0.0 0.2 0.4 0.6 0.8 1.0
Cycle efficiency (%
HHV)
Plant e
fficien
cy (%HH
V)
sCO2 combustor bypass fraction
Plant effCycle eff
0.000
0.005
0.010
0.015
0.020
0.025
0.030
0.035
1000
1200
1400
1600
1800
2000
2200
2400
CO, O
2Mole fractio
n
Flam
e tempe
rature (°C)
Flame tempO₂CO
21
Sensitivity to Incomplete CombustionProcess & Cycle Efficiency versus CO Mole Fraction
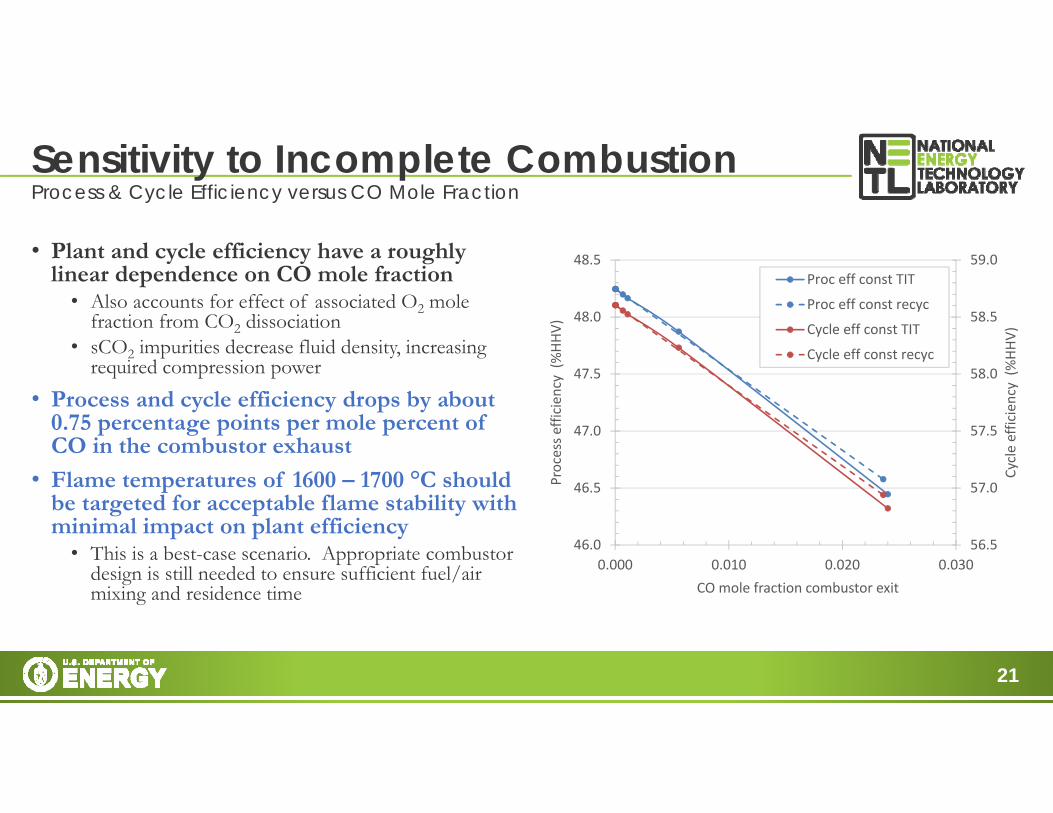
• Plant and cycle efficiency have a roughly linear dependence on CO mole fraction
• Also accounts for effect of associated O2 mole fraction from CO2 dissociation
• sCO2 impurities decrease fluid density, increasing required compression power
• Process and cycle efficiency drops by about 0.75 percentage points per mole percent of CO in the combustor exhaust
• Flame temperatures of 1600 – 1700 °C should be targeted for acceptable flame stability with minimal impact on plant efficiency
• This is a best-case scenario. Appropriate combustor design is still needed to ensure sufficient fuel/air mixing and residence time
56.5
57.0
57.5
58.0
58.5
59.0
46.0
46.5
47.0
47.5
48.0
48.5
0.000 0.010 0.020 0.030
Cycle efficiency (%
HHV)
Process e
fficien
cy (%HH
V)
CO mole fraction combustor exit
Proc eff const TIT
Proc eff const recyc
Cycle eff const TIT
Cycle eff const recyc
22
Sensitivity to Incomplete CombustionConclusions
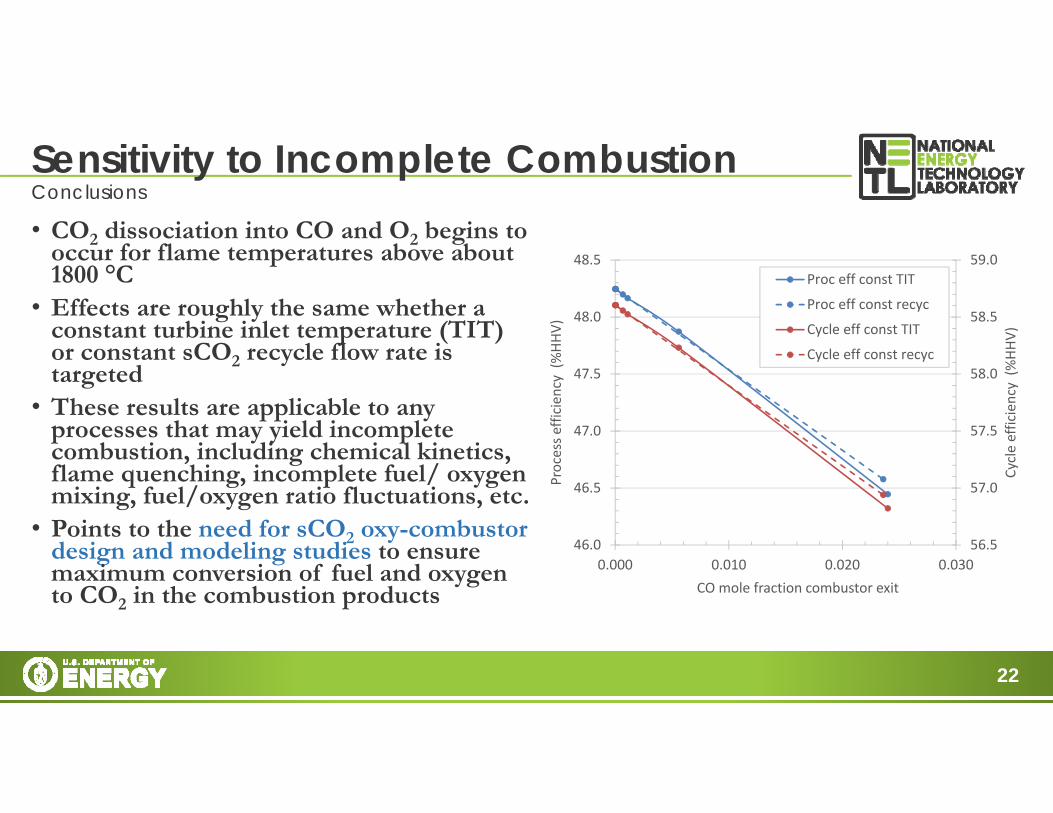
• CO2 dissociation into CO and O2 begins to occur for flame temperatures above about 1800 °C
• Effects are roughly the same whether a constant turbine inlet temperature (TIT) or constant sCO2 recycle flow rate is targeted
• These results are applicable to any processes that may yield incomplete combustion, including chemical kinetics, flame quenching, incomplete fuel/ oxygen mixing, fuel/oxygen ratio fluctuations, etc.
• Points to the need for sCO2 oxy-combustor design and modeling studies to ensure maximum conversion of fuel and oxygen to CO2 in the combustion products
56.5
57.0
57.5
58.0
58.5
59.0
46.0
46.5
47.0
47.5
48.0
48.5
0.000 0.010 0.020 0.030
Cycle efficiency (%
HHV)
Process e
fficien
cy (%HH
V)
CO mole fraction combustor exit
Proc eff const TIT
Proc eff const recyc
Cycle eff const TIT
Cycle eff const recyc

23
Baseline sCO2 Techno-economic AnalysisConclusions
• Plant design and performance is similar to other studies, but evolved organically out of the basic framework of direct sCO2 power cycles and earlier work on coal-fueled direct sCO2 power plants
• Baseline sCO2 plant thermal efficiency of 48.2% (HHV) with 98.2% carbon capture• Significant improvement over the reference NGCC plant with CCS, which has an efficiency of 45.7% and 90.7% carbon
capture• The total plant cost for the baseline sCO2 plant
is comparable to the reference NGCC plant on a $/kW basis
• The increased fuel efficiency leads to a 3.6% lower COE for the sCO2 plant, excluding CO2 T&S costs
• Additional contributions of this work:• A new model to determine sCO2 turbine cooling flow
requirements as a function of the coolant temperature• An incomplete combustion model to assess the effects
of combustion-derived sCO2 impurities on the overall performance of the plant
• A component-level cost estimate for the plant• A COE calculation consistent with other NETL
studies
Parameter NGCC5 sCO2 CycleHHV Thermal Input, MWth 1,223 1,223Total Gross Power, MWe 601 738Total Auxiliaries, MWe 42 148Total Net Power, MWe 559 590HHV Net Plant Efficiency, % 45.7 48.2Carbon Capture Fraction, % 90.7 98.2Captured CO2 Purity, mol% 99.93 100.00Total Plant Cost (TPC) ($1,000s) 1,008,381 1,055,979Specific Total Plant Cost ($/kW) 1,481 1,471COE w/o CO2 T&S 83.3 79.2COE with CO2 T&S 87.3 83.3
24
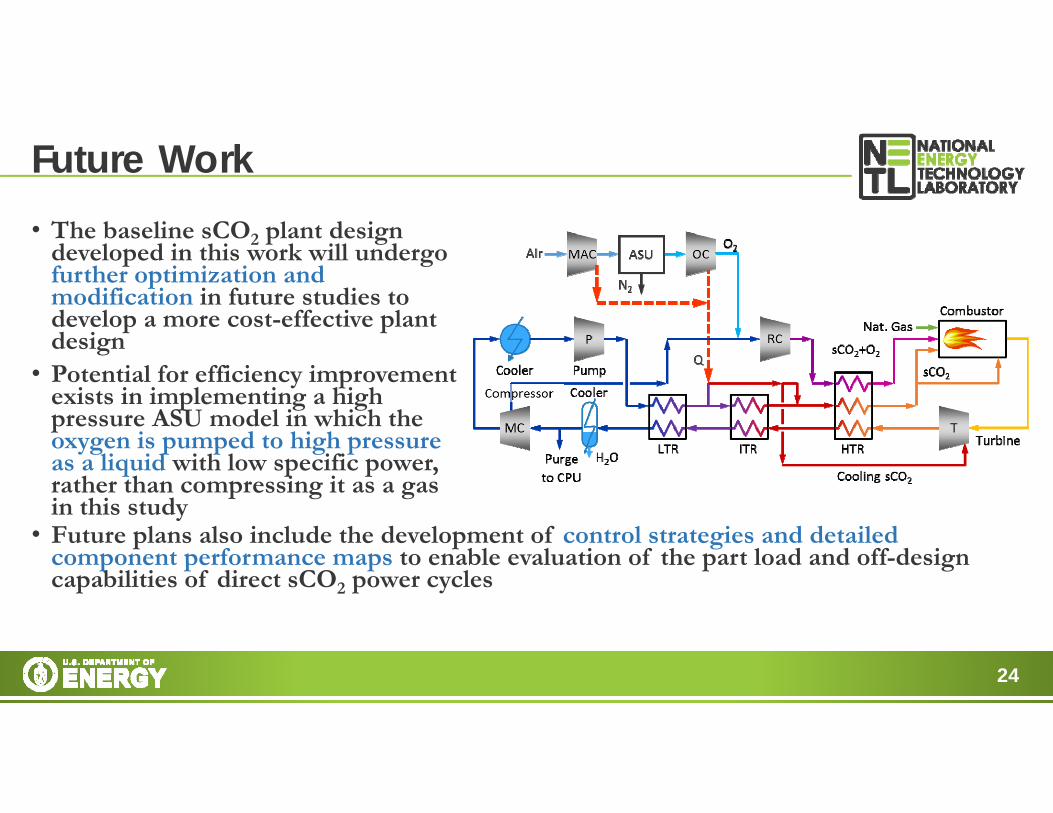
Future Work• The baseline sCO2 plant design
developed in this work will undergo further optimization and modification in future studies to develop a more cost-effective plant design
• Potential for efficiency improvement exists in implementing a high pressure ASU model in which the oxygen is pumped to high pressure as a liquid with low specific power, rather than compressing it as a gas in this study
• Future plans also include the development of control strategies and detailed component performance maps to enable evaluation of the part load and off-design capabilities of direct sCO2 power cycles

25
Questions?
26
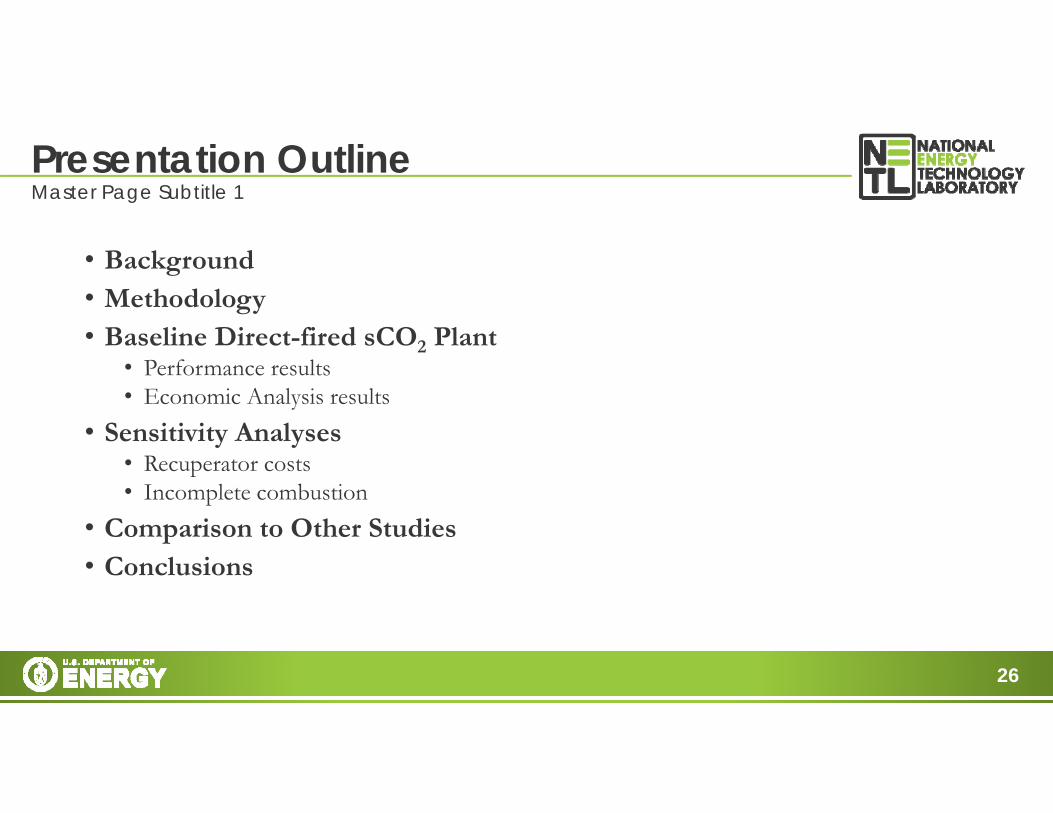
• Background• Methodology • Baseline Direct-fired sCO2 Plant
• Performance results• Economic Analysis results
• Sensitivity Analyses• Recuperator costs• Incomplete combustion
• Comparison to Other Studies• Conclusions
Presentation OutlineMaster Page Subtitle 1
27
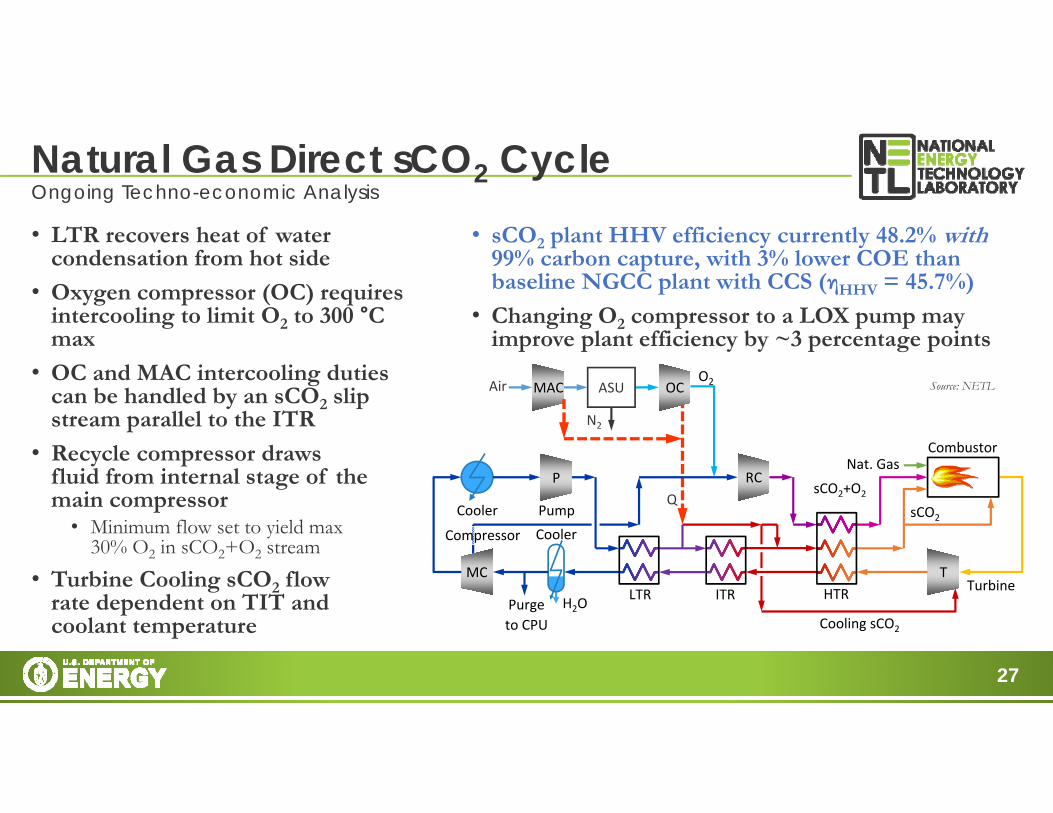
• sCO2 plant HHV efficiency currently 48.2% with99% carbon capture, with 3% lower COE than baseline NGCC plant with CCS (ηHHV = 45.7%)
• Changing O2 compressor to a LOX pump may improve plant efficiency by ~3 percentage points
Natural Gas Direct sCO2 CycleOngoing Techno-economic Analysis
Source: NETL
Purgeto CPU
P
TMC
CoolerCooler
O2
H2O
Combustor
Compressor
Pump
Turbine
ASU
N2
Air
LTR HTR
Cooling sCO2
sCO2+O2
MAC
QsCO2
Nat. Gas
ITR
OC
RC
• LTR recovers heat of water condensation from hot side
• Oxygen compressor (OC) requires intercooling to limit O2 to 300 °C max
• OC and MAC intercooling duties can be handled by an sCO2 slip stream parallel to the ITR
• Recycle compressor draws fluid from internal stage of the main compressor
• Minimum flow set to yield max 30% O2 in sCO2+O2 stream
• Turbine Cooling sCO2 flow rate dependent on TIT and coolant temperature
28
CO2Storage
Cooler
RecuperatorCooler
Natural Gas
Oxygen
sCO2
H2O
Combustor
Turbine
Compressor
Pump
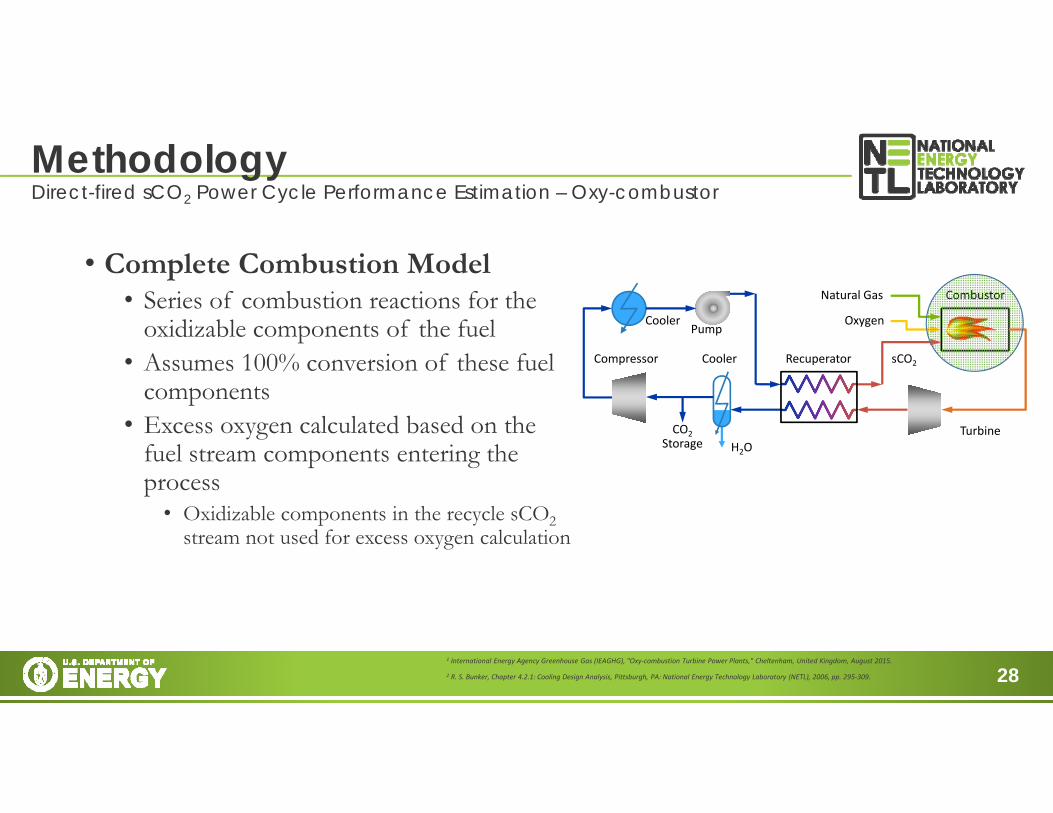
• Complete Combustion Model• Series of combustion reactions for the
oxidizable components of the fuel • Assumes 100% conversion of these fuel
components• Excess oxygen calculated based on the
fuel stream components entering the process
• Oxidizable components in the recycle sCO2stream not used for excess oxygen calculation
MethodologyDirect-fired sCO2 Power Cycle Performance Estimation – Oxy-combustor
1 International Energy Agency Greenhouse Gas (IEAGHG), "Oxy‐combustion Turbine Power Plants," Cheltenham, United Kingdom, August 2015.
2 R. S. Bunker, Chapter 4.2.1: Cooling Design Analysis, Pittsburgh, PA: National Energy Technology Laboratory (NETL), 2006, pp. 295‐309.
29
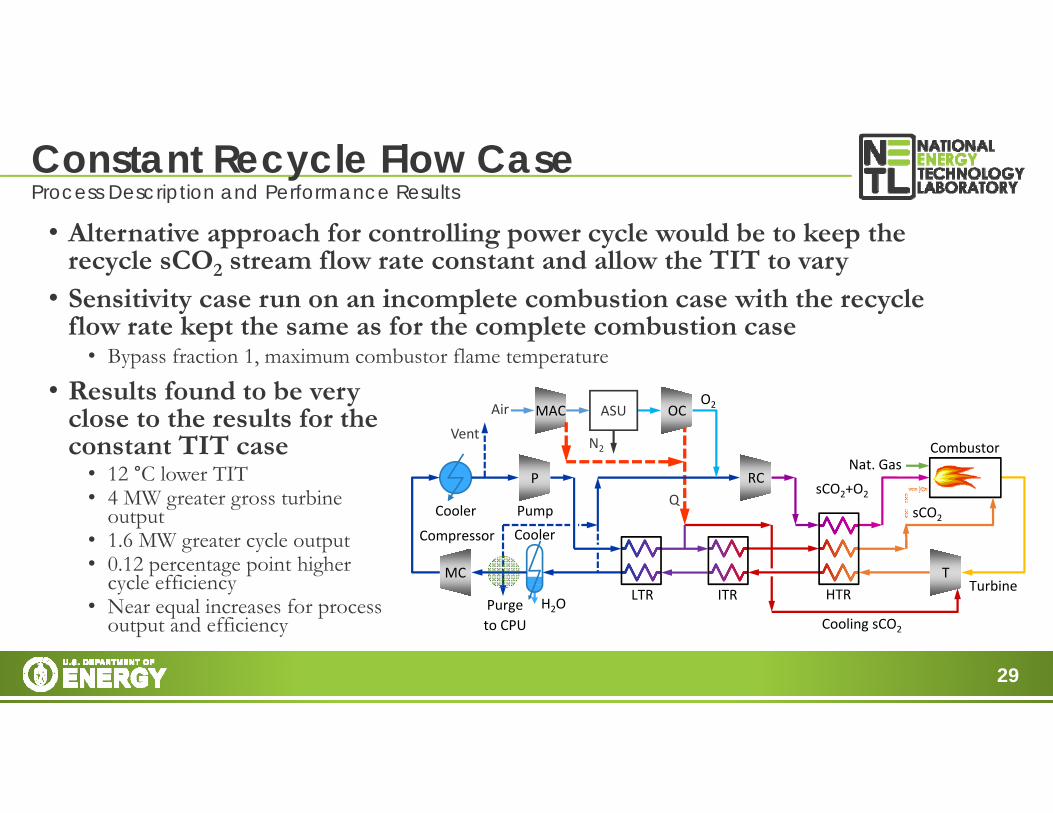
• Alternative approach for controlling power cycle would be to keep the recycle sCO2 stream flow rate constant and allow the TIT to vary
• Sensitivity case run on an incomplete combustion case with the recycle flow rate kept the same as for the complete combustion case
• Bypass fraction 1, maximum combustor flame temperature
• Results found to be very close to the results for the constant TIT case
• 12 °C lower TIT• 4 MW greater gross turbine
output• 1.6 MW greater cycle output• 0.12 percentage point higher
cycle efficiency• Near equal increases for process
output and efficiency
Constant Recycle Flow Case
Purgeto CPU
P
TMC
CoolerCooler
O2
H2O
Combustor
Compressor
Pump
Turbine
ASU
N2
Air
LTR HTR
Cooling sCO2
sCO2+O2
MAC
QsCO2
Nat. Gas
ITR
OC
RC
Process Description and Performance Results
Vent

30
Constant Recycle Flow CaseProcess & Cycle Efficiency versus CO Mole Fraction
• Plot shows process (blue) and cycle (red) efficiency as a function of CO mole fraction
• Solid lines correspond to constant TIT
• Dashed lines correspond to constant recycle flow rate
• Little difference in efficiency dependence on CO mole fraction for constant TIT versus constant recycle flow rate
• Results suggest that maintaining a constant TIT in the event of incomplete combustion is not critical
• Provided variation in TIT and recycle flow rate is not too great
56.5
57.0
57.5
58.0
58.5
59.0
46.0
46.5
47.0
47.5
48.0
48.5
0.000 0.005 0.010 0.015 0.020 0.025 0.030
Cycle efficiency (%
HHV)
Process e
fficien
cy (%HH
V)
CO mole fraction combustor exit
Proc eff const TIT
Proc eff const recyc
Cycle eff const TIT
Cycle eff const recyc
31
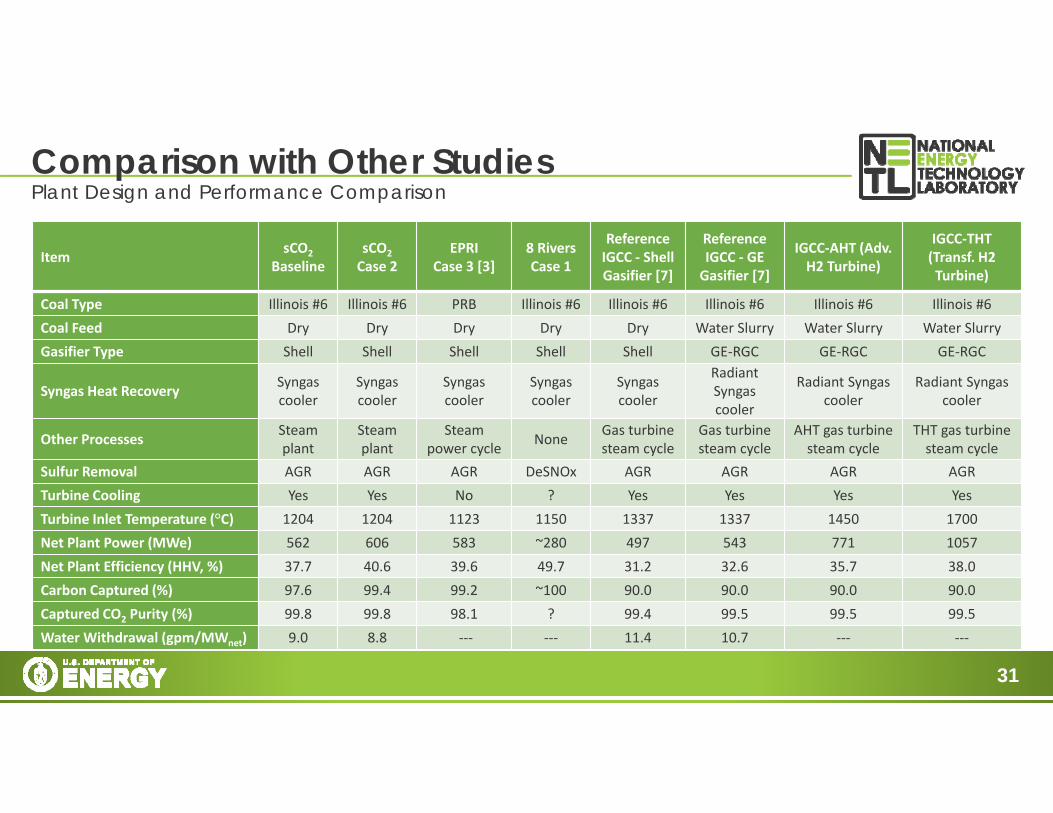
Comparison with Other StudiesPlant Design and Performance Comparison
Item sCO2Baseline
sCO2Case 2
EPRICase 3 [3]
8 RiversCase 1
ReferenceIGCC ‐ ShellGasifier [7]
ReferenceIGCC ‐ GE Gasifier [7]
IGCC‐AHT (Adv. H2 Turbine)
IGCC‐THT(Transf. H2 Turbine)
Coal Type Illinois #6 Illinois #6 PRB Illinois #6 Illinois #6 Illinois #6 Illinois #6 Illinois #6Coal Feed Dry Dry Dry Dry Dry Water Slurry Water Slurry Water SlurryGasifier Type Shell Shell Shell Shell Shell GE‐RGC GE‐RGC GE‐RGC
Syngas Heat Recovery Syngas cooler
Syngas cooler
Syngas cooler
Syngas cooler
Syngas cooler
Radiant Syngas cooler
Radiant Syngas cooler
Radiant Syngascooler
Other Processes Steam plant
Steam plant
Steam power cycle None Gas turbine
steam cycleGas turbine steam cycle
AHT gas turbine steam cycle
THT gas turbine steam cycle
Sulfur Removal AGR AGR AGR DeSNOx AGR AGR AGR AGRTurbine Cooling Yes Yes No ? Yes Yes Yes YesTurbine Inlet Temperature (°C) 1204 1204 1123 1150 1337 1337 1450 1700Net Plant Power (MWe) 562 606 583 ~280 497 543 771 1057 Net Plant Efficiency (HHV, %) 37.7 40.6 39.6 49.7 31.2 32.6 35.7 38.0Carbon Captured (%) 97.6 99.4 99.2 ~100 90.0 90.0 90.0 90.0Captured CO2 Purity (%) 99.8 99.8 98.1 ? 99.4 99.5 99.5 99.5Water Withdrawal (gpm/MWnet) 9.0 8.8 ‐‐‐ ‐‐‐ 11.4 10.7 ‐‐‐ ‐‐‐
32
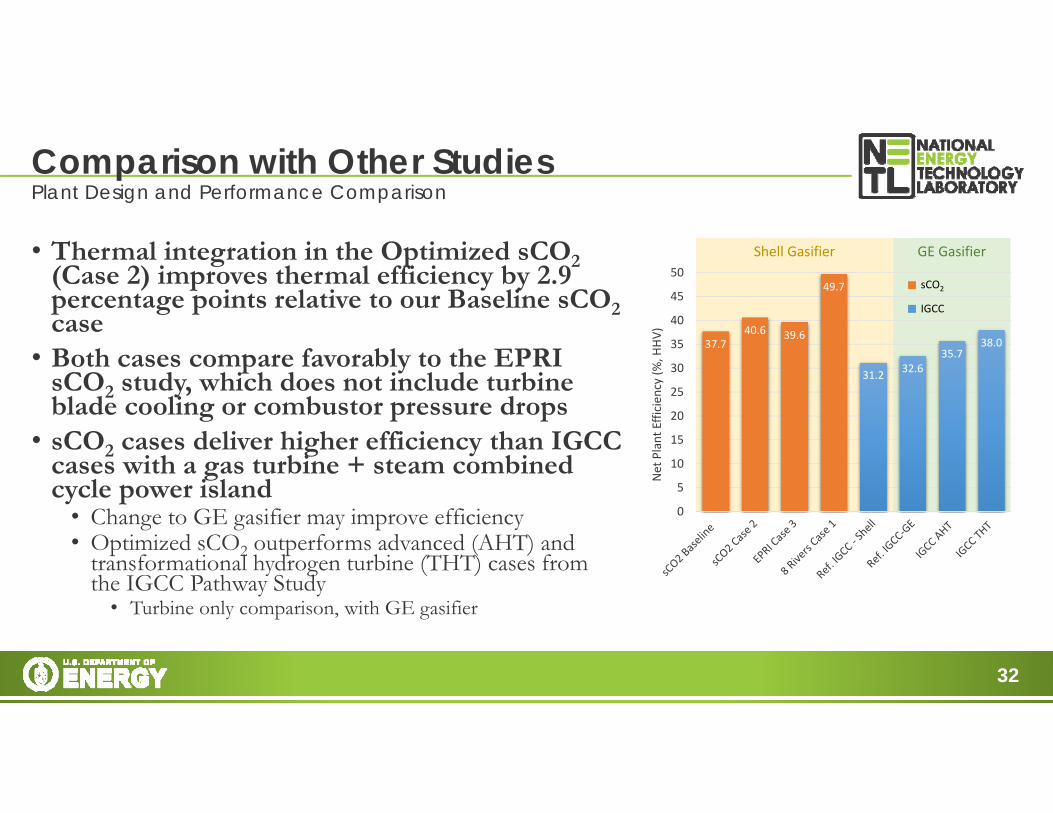
• Thermal integration in the Optimized sCO2(Case 2) improves thermal efficiency by 2.9 percentage points relative to our Baseline sCO2case
• Both cases compare favorably to the EPRI sCO2 study, which does not include turbine blade cooling or combustor pressure drops
• sCO2 cases deliver higher efficiency than IGCC cases with a gas turbine + steam combined cycle power island
• Change to GE gasifier may improve efficiency• Optimized sCO2 outperforms advanced (AHT) and
transformational hydrogen turbine (THT) cases from the IGCC Pathway Study
• Turbine only comparison, with GE gasifier
Comparison with Other StudiesPlant Design and Performance Comparison
GE GasifierShell Gasifier
37.740.6 39.6
49.7
31.2 32.635.7
38.0
0
5
10
15
20
25
30
35
40
45
50
Net Plant Efficien
cy (%
, HHV
)
sCO2
IGCC
33
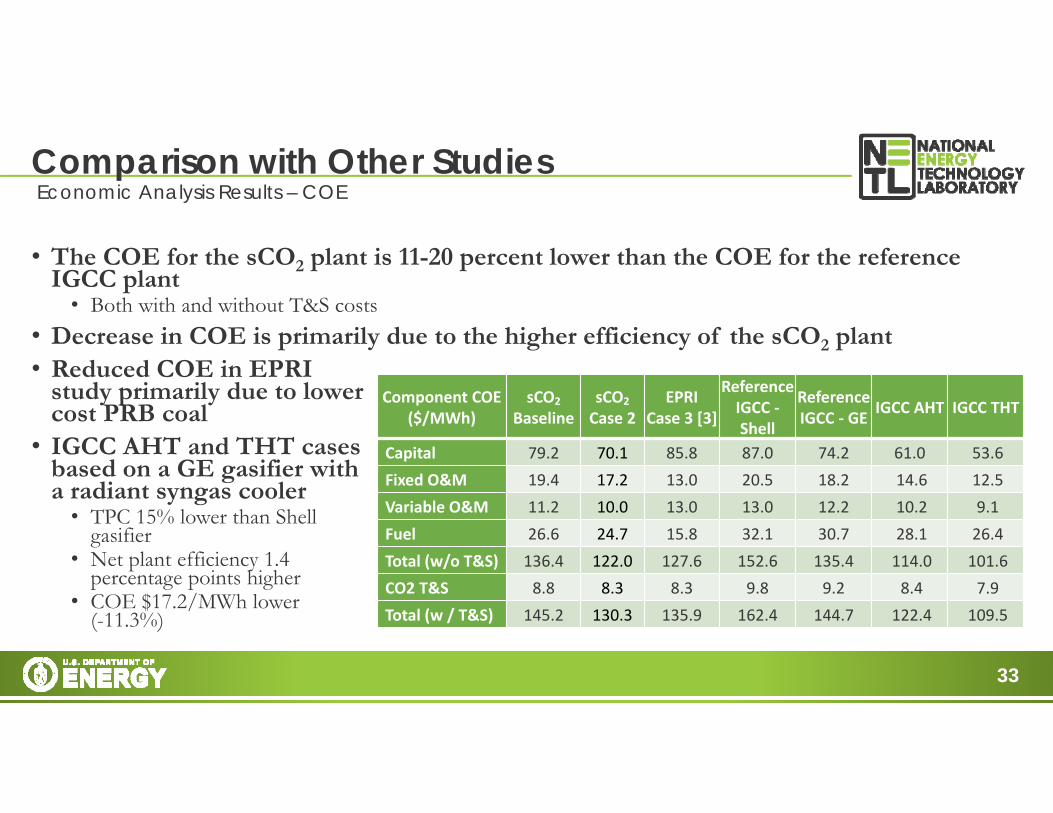
• The COE for the sCO2 plant is 11-20 percent lower than the COE for the reference IGCC plant
• Both with and without T&S costs• Decrease in COE is primarily due to the higher efficiency of the sCO2 plant• Reduced COE in EPRI
study primarily due to lower cost PRB coal
• IGCC AHT and THT casesbased on a GE gasifier with a radiant syngas cooler
• TPC 15% lower than Shell gasifier
• Net plant efficiency 1.4 percentage points higher
• COE $17.2/MWh lower (-11.3%)
Comparison with Other StudiesEconomic Analysis Results – COE
Component COE ($/MWh)
sCO2
Baseline sCO2
Case 2EPRI
Case 3 [3]
Reference IGCC ‐Shell
Reference IGCC ‐ GE IGCC AHT IGCC THT
Capital 79.2 70.1 85.8 87.0 74.2 61.0 53.6Fixed O&M 19.4 17.2 13.0 20.5 18.2 14.6 12.5Variable O&M 11.2 10.0 13.0 13.0 12.2 10.2 9.1Fuel 26.6 24.7 15.8 32.1 30.7 28.1 26.4Total (w/o T&S) 136.4 122.0 127.6 152.6 135.4 114.0 101.6CO2 T&S 8.8 8.3 8.3 9.8 9.2 8.4 7.9Total (w / T&S) 145.2 130.3 135.9 162.4 144.7 122.4 109.5

34
• The COE for the sCO2 plant is 11-20 percent lower than the COE for the reference IGCC plant
• Both with and without T&S costs• Decrease in COE is primarily due to the higher
efficiency of the sCO2 plant• Reduced COE in EPRI study primarily due to
lower cost PRB coal• IGCC AHT and THT cases based on a GE
gasifier with a radiant syngas cooler• TPC 15% lower than Shell gasifier• COE $17.2/MWh lower (-11.3%)
Comparison with Other StudiesEconomic Analysis Results – COE
GE GasifierShell Gasifier
79.2 70.185.8 87
74.261 53.6
19.417.2
13 20.5
18.2
14.612.5
11.210.0
1313
12.2
10.29.1
26.6
24.715.8
32.1
30.7
28.126.4
145.28.8 130.3
8.3
135.98.3
162.49.8
144.79.2
122.48.4 109.5
7.9
0
20
40
60
80
100
120
140
160
180
sCO2Baseline
sCO2Case 2
EPRICase 3
Ref. IGCC‐ Shell
Ref.IGCC‐GE
IGCCAHT
IGCCTHT
COE (201
1$/M
Wh)
CO2 T&SFuelVariable O&MFixed O&MCapital