Embed Size (px)
Citation preview
Refer to pages 51-52 for Important Disclosures, including Analyst's Certification. For Important Disclosures on the stocks discussed in this report, please go to http://researchglobal.bmocapitalmarkets.com/Company_Disclosure_Public.asp.
Fadi Chamoun, CFA*Transport – Rails416-359-6775
Jason Granger, CA, CFA*Transport – Trucking & Logistics416-359-4293
Sal Guatieri*Senior Economist416-359-5295
Wayne HoodRetail – Broadlines/Hardlines404-926-1590
Gerrick L. JohnsonToys & Leisure212-883-5192
Phillip Juhan, CFARestaurants404-926-1599
Jeffrey B. LogsdonGaming, Media, & Entertainment213-228-2234
Stephen MacLeod, CFA*Consumer Special Situations416-359-8069
Connie M. ManeatyHousehold & Personal Care Products212-885-4004
John MorrisRetail – Apparel & Specialty212-885-4016
Amit Sharma, CFAFood & Beverage212-885-4132
Karen ShortFood Retailing212-885-4123
Peter Sklar, CA*Auto Parts416-359-5188
Kenneth B. Zaslow, CFAFood & Ag Products212-885-4017
$5 Gas?March 21, 2012
BMO RESEARCH ROUNDTABLE
*Employee of BMO Nesbitt Burns Inc.; otherwise, employee of BMO Capital Markets Corp.

Financial GroupA member of BMO January 4, 2012
Electric Utilities BMO Capital Markets
2
Financial GroupA member of BMO March 21, 2012
$5 Gas? BMO Capital Markets
3
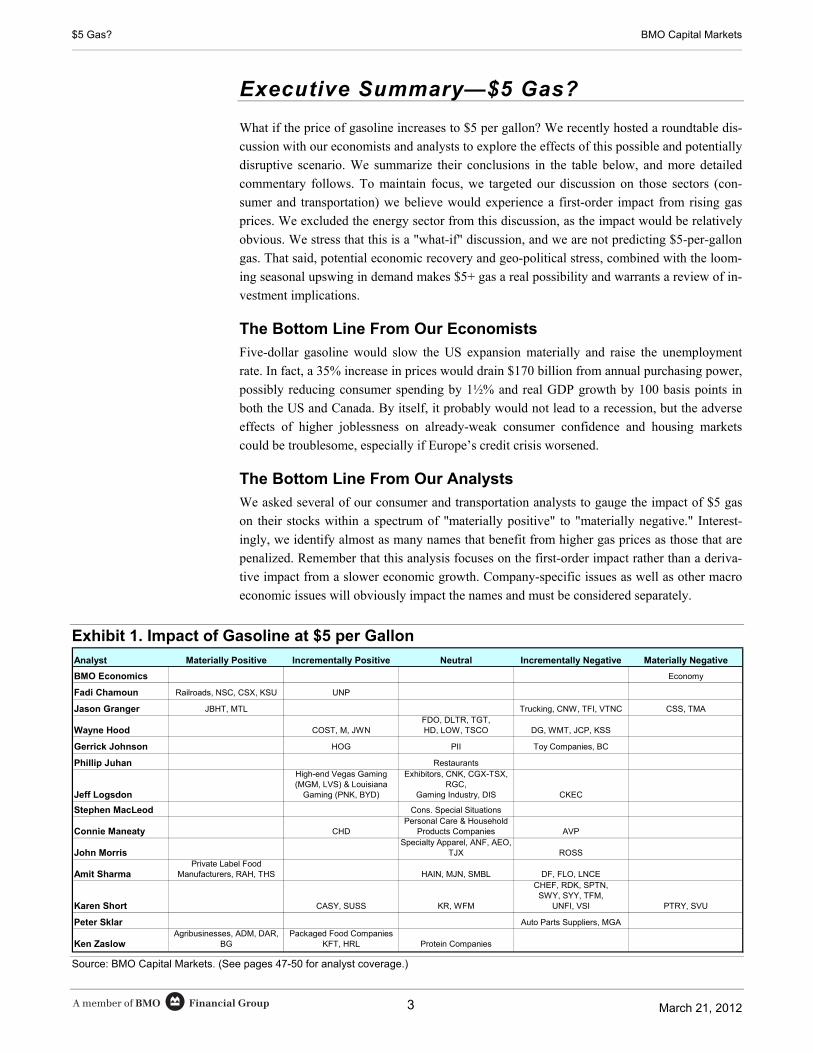
Executive Summary—$5 Gas?
What if the price of gasoline increases to $5 per gallon? We recently hosted a roundtable dis-
cussion with our economists and analysts to explore the effects of this possible and potentially
disruptive scenario. We summarize their conclusions in the table below, and more detailed
commentary follows. To maintain focus, we targeted our discussion on those sectors (con-
sumer and transportation) we believe would experience a first-order impact from rising gas
prices. We excluded the energy sector from this discussion, as the impact would be relatively
obvious. We stress that this is a "what-if" discussion, and we are not predicting $5-per-gallon
gas. That said, potential economic recovery and geo-political stress, combined with the loom-
ing seasonal upswing in demand makes $5+ gas a real possibility and warrants a review of in-
vestment implications.
The Bottom Line From Our Economists
Five-dollar gasoline would slow the US expansion materially and raise the unemployment
rate. In fact, a 35% increase in prices would drain $170 billion from annual purchasing power,
possibly reducing consumer spending by 1½% and real GDP growth by 100 basis points in
both the US and Canada. By itself, it probably would not lead to a recession, but the adverse
effects of higher joblessness on already-weak consumer confidence and housing markets
could be troublesome, especially if Europe’s credit crisis worsened.
The Bottom Line From Our Analysts
We asked several of our consumer and transportation analysts to gauge the impact of $5 gas
on their stocks within a spectrum of "materially positive" to "materially negative." Interest-
ingly, we identify almost as many names that benefit from higher gas prices as those that are
penalized. Remember that this analysis focuses on the first-order impact rather than a deriva-
tive impact from a slower economic growth. Company-specific issues as well as other macro
economic issues will obviously impact the names and must be considered separately.
Exhibit 1. Impact of Gasoline at $5 per Gallon
Analyst Materially Positive Incrementally Positive Neutral Incrementally Negative Materially Negative
BMO Economics Economy
Fadi Chamoun Railroads, NSC, CSX, KSU UNP
Jason Granger JBHT, MTL Trucking, CNW, TFI, VTNC CSS, TMA
Wayne Hood COST, M, JWNFDO, DLTR, TGT, HD, LOW, TSCO DG, WMT, JCP, KSS
Gerrick Johnson HOG PII Toy Companies, BC
Phillip Juhan Restaurants
Jeff Logsdon
High-end Vegas Gaming (MGM, LVS) & Louisiana
Gaming (PNK, BYD)
Exhibitors, CNK, CGX-TSX, RGC,
Gaming Industry, DIS CKEC
Stephen MacLeod Cons. Special Situations
Connie Maneaty CHDPersonal Care & Household
Products Companies AVP
John MorrisSpecialty Apparel, ANF, AEO,
TJX ROSS
Amit SharmaPrivate Label Food
Manufacturers, RAH, THS HAIN, MJN, SMBL DF, FLO, LNCE
Karen Short CASY, SUSS KR, WFM
CHEF, RDK, SPTN, SWY, SYY, TFM,
UNFI, VSI PTRY, SVU
Peter Sklar Auto Parts Suppliers, MGA
Ken ZaslowAgribusinesses, ADM, DAR,
BGPackaged Food Companies
KFT, HRL Protein Companies Source: BMO Capital Markets. (See pages 47-50 for analyst coverage.)
Financial GroupA member of BMO March 21, 2012
$5 Gas? BMO Capital Markets
4
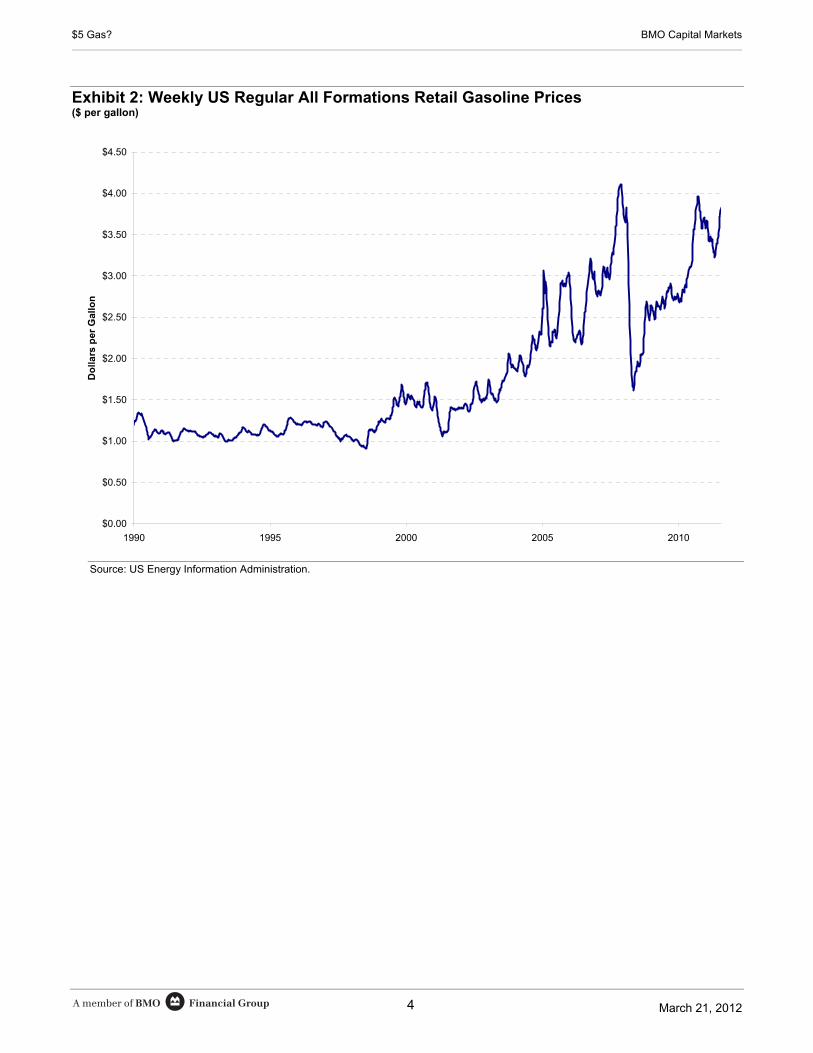
Exhibit 2: Weekly US Regular All Formations Retail Gasoline Prices ($ per gallon)
$0.00
$0.50
$1.00
$1.50
$2.00
$2.50
$3.00
$3.50
$4.00
$4.50
1990 1995 2000 2005 2010
Do
llars
per
Gal
lon
Source: US Energy Information Administration.
Financial GroupA member of BMO March 21, 2012
$5 Gas? BMO Capital Markets
5
Table of Contents
$5 Gas...................................................................................................................................................3
Economics (Sal Guartieri) ....................................................................................................................7
Rails (Fadi Chamoun) ...........................................................................................................................9
Trucking & Logistics (Jason Granger).................................................................................................13
Retail - Broadlines/Hardlines (Wayne Hood) ......................................................................................17
Toys & Leisure (Gerrick Johnson) ......................................................................................................23
Restaurants (Phillip Juhan) .................................................................................................................25
Exhibitors and Gaming (Jeffrey Logsdon)...........................................................................................29
Consumer - Special Situations (Stephen MacLeod)...........................................................................31
Personal Care and Household Products (Connie Maneaty)...............................................................33
Retail - Apparel & Specialty (John Morris) ..........................................................................................35
Food & Beverage (Amit Sharma)........................................................................................................37
Food Retailing (Karen Short) ..............................................................................................................39
Auto Parts (Peter Sklar) ......................................................................................................................41
Food & Ag Products (Ken Zaslow)......................................................................................................45
Exhibit No. Exhibit 1. Impact of Gasoline at $5 per Gallon..........................................................................................3
Exhibit 2: Weekly US Regular All Formations Retail Gasoline Prices ($ per gallon) ..................................4
Exhibit 3: Rising Energy Prices Hurt, No Fuelin' .......................................................................................8
Exhibit 4: Paying More but Consuming Less Gasoline..............................................................................8
Exhibit 5: Fuel Recovery – Time Lag .......................................................................................................9
Exhibit 6: Fuel Efficiency – Truck vs. Rails .............................................................................................10
Exhibit 7: Truck and Rail Intermodal in Markets 500 Miles and Greater (in million units) ..........................11
Exhibit 8: US Trucking Failures vs. Diesel Prices ...................................................................................14
Exhibit 9: ITS Market Demand Index......................................................................................................14
Exhibit 10: J.B. Hunt Intermodal Volumes vs. Diesel Prices ....................................................................15
Exhibit 11. Little Correlation Between Comp-Store Sales and Gas Prices Using One-Year Rates of Change ..................................................................................................17
Exhibit 12. Change in Two-Year Comp-Store Stack Rates vs. Change in Gasoline Price - Dollar Stores .............................................................................................................19
Exhibit 13. Change in Two-Year Comp-Store Stack Rates vs. Change in Gasoline Price - Discount and Club Retailers ......................................................................................20
Exhibit 14. Change in Two-Year Comp-Store Stack Rates vs. Change in Gasoline Price - Department Stores ....................................................................................................21
Exhibit 15. Change in Two-Year Comp-Store Stack Rates vs. Change in Gasoline Price - Hardline Retailers .....................................................................................................21
Exhibit 16. Monthly Gas Savings ...........................................................................................................24
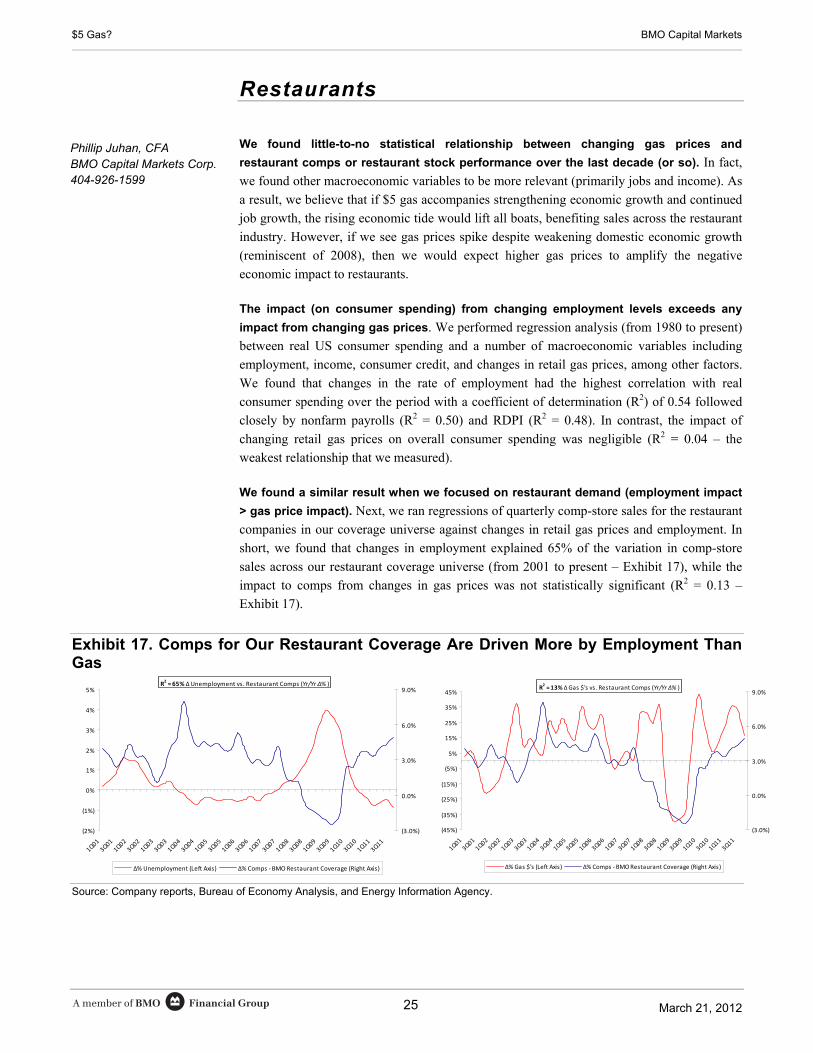
Exhibit 17. Comps for Our Restaurant Coverage Are Driven More by Employment Than Gas..................25
Exhibit 18. Sequential Change in Gas Prices Unrelated to Comp Acceleration........................................26
Exhibit 19. Monthly Sequential % Chg in Retail Gas Prices vs. Monthly Stock Returns............................27
Exhibit 20. PCHP Performance During the Recent Run-Up in Oil............................................................34
Exhibit 21. Lower Income Households' Food Spending Shows Greater Impact From Higher Gas Prices................................................................................................................38
Exhibit 22. US Light Vehicle Sales vs. Gasoline Prices...........................................................................41
Exhibit 23. Gas Price Spikes Shift Purchases Away From Light Trucks...................................................42
Exhibit 24. US Consumer Response to Higher Gasoline Prices ..............................................................43
Note: All prices shown in US dollars.

Financial GroupA member of BMO March 21, 2012
$5 Gas? BMO Capital Markets
6
Financial GroupA member of BMO March 21, 2012
$5 Gas? BMO Capital Markets
7
Economics
Economic Impact of $5 Gasoline—It’s Not a Gas! Five-dollar gasoline could reduce US economic growth from a projected moderate rate of
2½% on average in 2012-2013 to 1½%, driving the unemployment rate back to 9%. Ameri-
cans consume about 130 billion gallons of gasoline each year, accounting for slightly less than
4% of total spending. As fuel costs rise, households cut back on non-essential trips and spend-
ing on other items. A 35% increase from $3.70 a gallon to $5.00 could drain $170 billion
from annual purchasing power, reducing consumer spending by 1½% and real GDP growth
by 100 basis points.
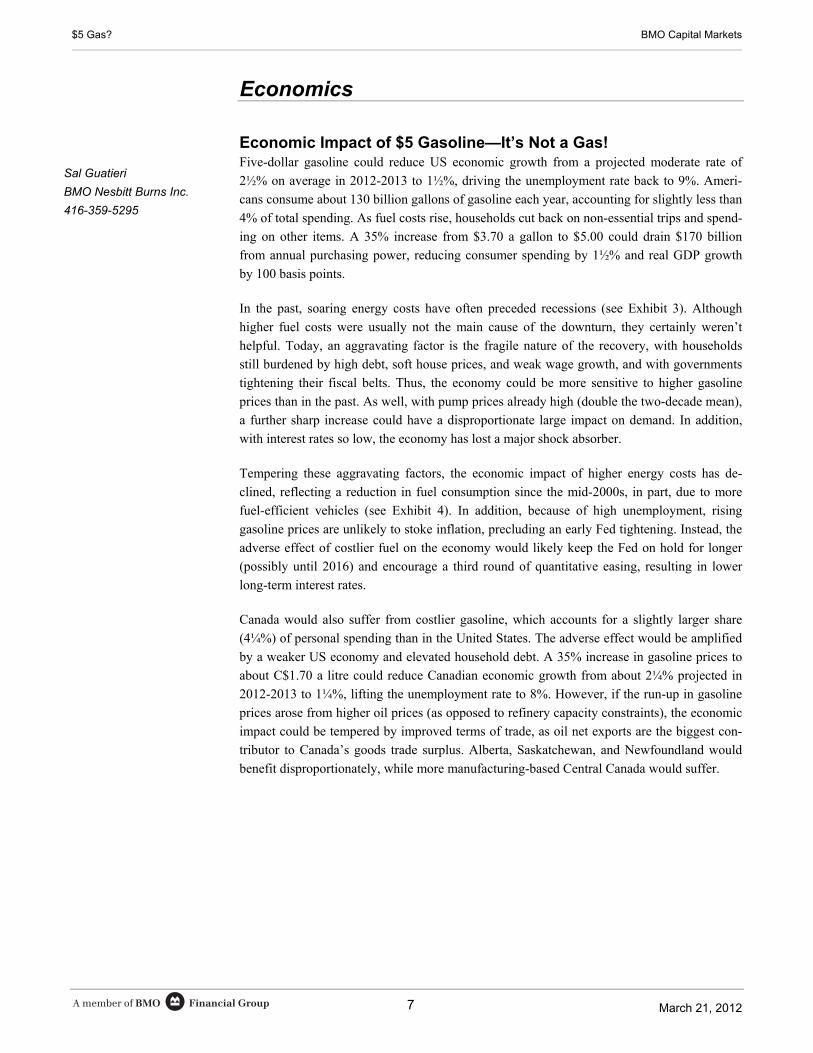
In the past, soaring energy costs have often preceded recessions (see Exhibit 3). Although
higher fuel costs were usually not the main cause of the downturn, they certainly weren’t
helpful. Today, an aggravating factor is the fragile nature of the recovery, with households
still burdened by high debt, soft house prices, and weak wage growth, and with governments
tightening their fiscal belts. Thus, the economy could be more sensitive to higher gasoline
prices than in the past. As well, with pump prices already high (double the two-decade mean),
a further sharp increase could have a disproportionate large impact on demand. In addition,
with interest rates so low, the economy has lost a major shock absorber.
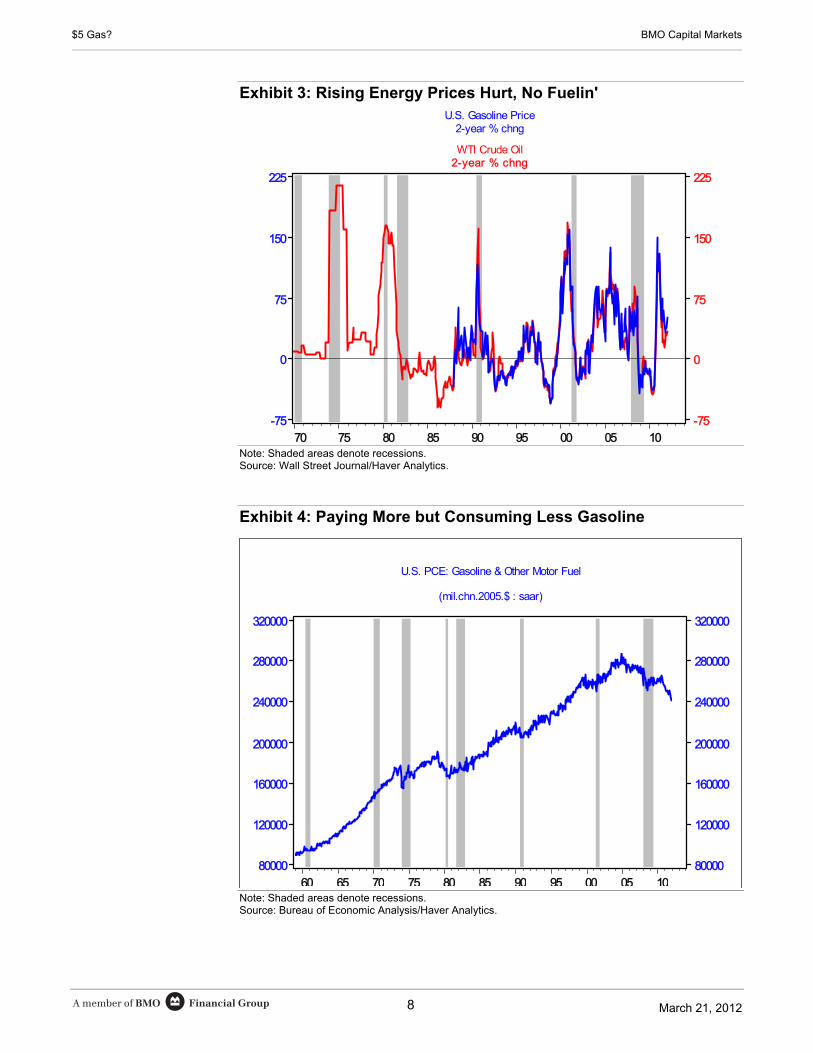
Tempering these aggravating factors, the economic impact of higher energy costs has de-
clined, reflecting a reduction in fuel consumption since the mid-2000s, in part, due to more
fuel-efficient vehicles (see Exhibit 4). In addition, because of high unemployment, rising
gasoline prices are unlikely to stoke inflation, precluding an early Fed tightening. Instead, the
adverse effect of costlier fuel on the economy would likely keep the Fed on hold for longer
(possibly until 2016) and encourage a third round of quantitative easing, resulting in lower
long-term interest rates.
Canada would also suffer from costlier gasoline, which accounts for a slightly larger share
(4¼%) of personal spending than in the United States. The adverse effect would be amplified
by a weaker US economy and elevated household debt. A 35% increase in gasoline prices to
about C$1.70 a litre could reduce Canadian economic growth from about 2¼% projected in
2012-2013 to 1¼%, lifting the unemployment rate to 8%. However, if the run-up in gasoline
prices arose from higher oil prices (as opposed to refinery capacity constraints), the economic
impact could be tempered by improved terms of trade, as oil net exports are the biggest con-
tributor to Canada’s goods trade surplus. Alberta, Saskatchewan, and Newfoundland would
benefit disproportionately, while more manufacturing-based Central Canada would suffer.
Sal Guatieri
BMO Nesbitt Burns Inc.
416-359-5295
Financial GroupA member of BMO March 21, 2012
$5 Gas? BMO Capital Markets
8
Exhibit 3: Rising Energy Prices Hurt, No Fuelin' U.S. Gasoline Price
2-year % chng
WTI Crude Oil2-year % chng
100500959085807570
225
150
75
0
-75
225
150
75
0
-75
Note: Shaded areas denote recessions. Source: Wall Street Journal/Haver Analytics.
Exhibit 4: Paying More but Consuming Less Gasoline
U.S. PCE: Gasoline & Other Motor Fuel
(mil.chn.2005.$ : saar)
1005009590858075706560
320000
280000
240000
200000
160000
120000
80000
320000
280000
240000
200000
160000
120000
80000
Note: Shaded areas denote recessions. Source: Bureau of Economic Analysis/Haver Analytics.
Financial GroupA member of BMO March 21, 2012
$5 Gas? BMO Capital Markets
9
Rails
We believe a scenario in which gas prices reach $5 per gallon would be favourable for the
railroads. We expect higher fuel prices to drive further truck-to-rail conversions as it would
become much less competitive for trucks and therefore benefit the railroads’ domestic inter-
modal business.
Fuel Costs Are to a Large Degree Passed Through to Customers In 2011, fuel was on average 16.3% of railroad freight revenues. However, fuel expense is
largely a cost that is recovered from shippers with a modest time lag (see Exhibit 5 below). In
general, the fuel surcharge is applied to customers based on the monthly average price of WTI
or on-highway diesel two months prior (60% of contracts are based on highway diesel). The
inherent lag in the fuel recovery mechanism impacts earnings in any given quarter but is es-
sentially neutral over a longer period of time. We note, however, that fuel surcharges are not
fully efficient given timing of contract renewals, effect of remaining legacy contracts, and to a
lesser degree a result of differences in the calculation of fuel surcharges (spread of WTI and
diesel could have an impact).
Exhibit 5: Fuel Recovery – Time Lag
Intermodal Carloads Approx. fuel coveredCNR ~2 Months ~2 Months 90%CPR* ~2 Months ~2 Months 85%UNP ~2-4 weeks ~2 Months 90%CSX ~1 Month ~2 Months 95%NSC ~2-3 weeks ~2 Months 95%*Should improve with new coal contract effective April 1
Time Lag in fuel recovery
Source: Company, BMO Capital Markets.
Railroads Are More Fuel Efficient Than Trucks According to a report by the Federal Railroad Administration published in late 2009, railroad fuel
efficiency ranges from 156 to 512 ton-miles/gallon while truck fuel efficiency ranges from 68 to
133 ton-miles/gallon. On average, railroads are 3.6 times more fuel efficient compared with trucks.
(See pages 47-50 for analyst coverage tables.)
Fadi Chamoun BMO Nesbitt Burns Inc. 416-359-6775
Financial GroupA member of BMO March 21, 2012
$5 Gas? BMO Capital Markets
10
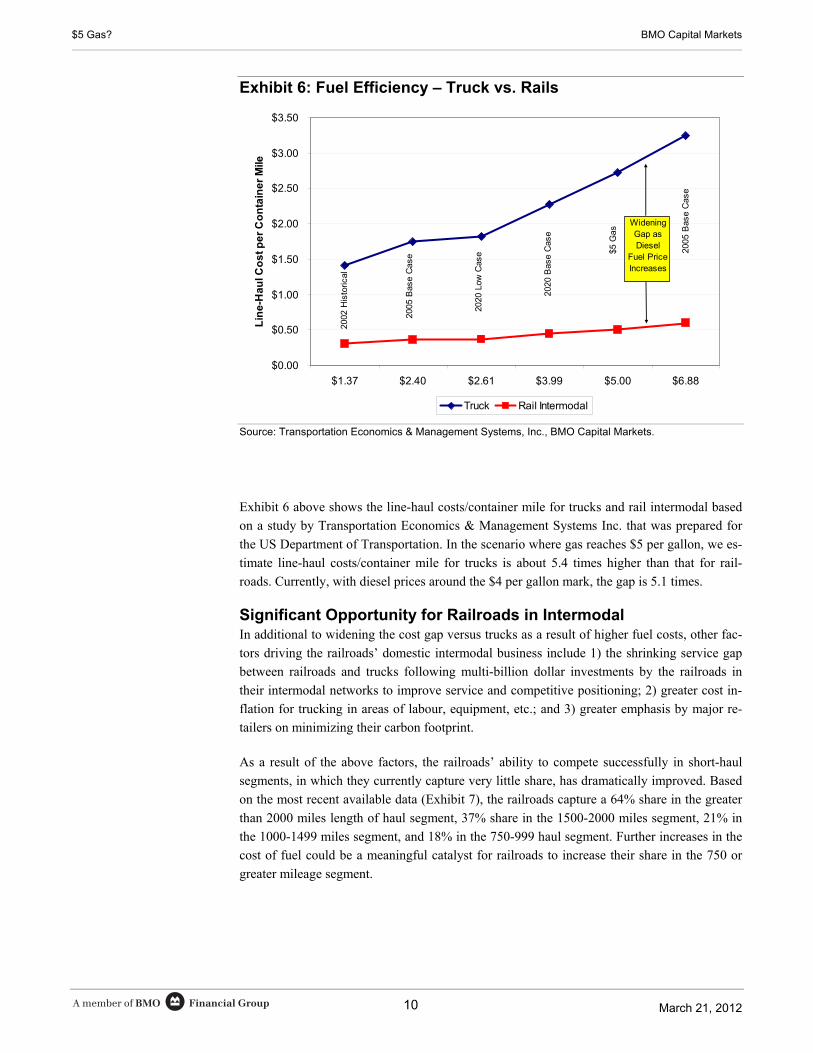
Exhibit 6: Fuel Efficiency – Truck vs. Rails
$0.00
$0.50
$1.00
$1.50
$2.00
$2.50
$3.00
$3.50
$1.37 $2.40 $2.61 $3.99 $5.00 $6.88
Lin
e-H
aul C
os
t pe
r C
on
tain
er
Mile
Truck Rail Intermodal
2002
His
toric
al
2005
Bas
e C
ase
2020
Low
Cas
e 2005
Bas
e C
ase
2020
Bas
e C
ase
$5 G
as
WideningGap as Diesel
Fuel PriceIncreases
Source: Transportation Economics & Management Systems, Inc., BMO Capital Markets.
Exhibit 6 above shows the line-haul costs/container mile for trucks and rail intermodal based
on a study by Transportation Economics & Management Systems Inc. that was prepared for
the US Department of Transportation. In the scenario where gas reaches $5 per gallon, we es-
timate line-haul costs/container mile for trucks is about 5.4 times higher than that for rail-
roads. Currently, with diesel prices around the $4 per gallon mark, the gap is 5.1 times.
Significant Opportunity for Railroads in Intermodal In additional to widening the cost gap versus trucks as a result of higher fuel costs, other fac-
tors driving the railroads’ domestic intermodal business include 1) the shrinking service gap
between railroads and trucks following multi-billion dollar investments by the railroads in
their intermodal networks to improve service and competitive positioning; 2) greater cost in-
flation for trucking in areas of labour, equipment, etc.; and 3) greater emphasis by major re-
tailers on minimizing their carbon footprint.
As a result of the above factors, the railroads’ ability to compete successfully in short-haul
segments, in which they currently capture very little share, has dramatically improved. Based
on the most recent available data (Exhibit 7), the railroads capture a 64% share in the greater
than 2000 miles length of haul segment, 37% share in the 1500-2000 miles segment, 21% in
the 1000-1499 miles segment, and 18% in the 750-999 haul segment. Further increases in the
cost of fuel could be a meaningful catalyst for railroads to increase their share in the 750 or
greater mileage segment.
Financial GroupA member of BMO March 21, 2012
$5 Gas? BMO Capital Markets
11
Exhibit 7: Truck and Rail Intermodal in Markets 500 Miles and Greater (in million units) Mileage Blocks Truck Rail Intermodal Total Market Truck Share Rail Share500 to 749 17.8 1.2 19 94% 6%750 to 999 10.1 2.3 12.4 82% 18%1000 to 1499 7.7 2 9.7 79% 21%1500 to 2000 3.7 2.1 5.8 63% 37%> 2000 2.8 4.9 7.7 36% 64%Total 42.1 12.5 54.6 77% 23% Source: Assessment of 2007 Commodity Flow Survey and 2007 Rail Carload Waybill Sample.
We note that NSC, CSX, and KSU are well positioned to benefit from ongoing truck-to-rail
conversions. UNP should also benefit from domestic intermodal growth, albeit to a lesser de-
gree than the shorter-haul carriers. NSC has indicated in previous presentations that its Cres-
cent corridor project has the potential to add 1 million intermodal carloads in the medium
term. The company is in the process of expanding several terminals, which have the potential
to significantly raise the company’s throughput capacity by the end of 2012.
The opportunity in intermodal is one of the key reasons we favour the US railroads versus the
Canadian peers.
(See pages 47-50 for analyst coverage tables.)

Financial GroupA member of BMO March 21, 2012
$5 Gas? BMO Capital Markets
12
Financial GroupA member of BMO March 21, 2012
$5 Gas? BMO Capital Markets
13
Trucking & Logistics
Near-Term Headwind; Pressure Eases as Surcharges Catch Up
We believe a rapid rise in fuel prices would be a near-term headwind for earnings because
fuel surcharges in the trucking sector generally lag the change in the price of fuel by one week
to one month. However, once the fuel prices settle at a higher level, the pressure eases as the
fuel surcharges catch up. Some shippers have negotiated caps on fuel surcharges, whereby
they avoid paying the additional cost once diesel fuel exceeds a certain price. Ultimately, a
carrier’s ability to pass on the full amount of fuel surcharges depends on industry conditions
and pricing power. We note that industry conditions in the US and Canada have become more
balanced as capacity exited the system during the most recent downturn. As such, we would
expect the surcharge mechanisms to be reasonably effective and the earnings pressure to sub-
side once the cost of diesel fuel stabilizes.
Truckload More Sensitive Than Less-Than-Truckload
The impact of rising fuel prices is generally more pronounced in the truckload sector than the
less-than-truckload space. Long-haul truckload carriers typically have a higher percentage of
empty miles where the carrier is not hauling revenue-generating freight and cannot levy fuel
surcharges.
Upturn in Bankruptcies Likely but Not to Same Extent as in 2008
In H1/08, coinciding with the abrupt spike in fuel prices, there was a significant surge in busi-
ness failures (up 130% y/y) among trucking companies as some struggled to fully offset
higher fuel costs with rate increases. An indirect benefit from the acceleration in bankruptcies
was a reduction in industry capacity. However, we do not expect the same dynamic as we saw
in 2008 if there were a rapid rise in the price of gas to $5.00 per gallon. This scenario would
translate into a more moderate fuel cost increase of roughly 20% compared with the spike of
almost 60% that was realized from Q2/07 to Q2/08. Moreover, industry conditions are in a
better position today in light of capacity that has exited the system and flat-to-rising demand
(ITS Market Demand Index below shows relative strength of US truckload industry condi-
tions). This should allow trucking companies to pass through rate increases more easily, as-
suming volumes hold relatively steady. We would expect some upturn in bankruptcies but not
to the same extent as in 2008.
Jason Granger BMO Nesbitt Burns Inc. 416-359-4293
Financial GroupA member of BMO March 21, 2012
$5 Gas? BMO Capital Markets
14
Exhibit 8: US Trucking Failures vs. Diesel Prices
0
200
400
600
800
1000
1200
Q1
Q2
Q3
Q4
Q1
Q2
Q3
Q4
Q1
Q2
Q3
Q4
Q1
Q2
Q3
Q4
Q1
Q2
Q3
Q4
Q1
Q2
Q3
Q4
Q1
Q2
Q3
Q4
Q1
Q2
Q3
Q4
Q1
Q2
Q3
Q4
Q1
Q2
Q3
Q4
2002 2003 2004 2005 2006 2007 2008 2009 2010 2011
U.S
. T
ruck
ing
Fai
lure
s
$0.00
$0.50
$1.00
$1.50
$2.00
$2.50
$3.00
$3.50
$4.00
$4.50
$5.00
U.S
. A
vera
ge
Ret
ail
Die
sel
Pri
ce
Trucking Failures Diesel
Source: FTR Associates, US Department of Energy.
Exhibit 9: ITS Market Demand Index
0
2
4
6
8
10
12
14
16
Jan-
08
Jul-0
8
Jan-
09
Jul-0
9
Jan-
10
Jul-1
0
Jan-
11
Jul-1
1
Jan-
12
Mar
ket
Dem
and
In
dex
Market Demand Index
conditions favourable to shippers
conditions favourableto truckers
Source: ITS.
Truck-to-Train Conversion in Medium- to Long-Haul Lanes Higher fuel costs weigh on demand for trucking where shippers have viable options across
other modes that are less sensitive to the price of fuel, such as rail or water. A sustained rise in
fuel prices from current levels would likely accelerate truck-to-train conversion, similar to
what happened in 2008. However, we also note that other modes are usually not viable op-
tions in shorter-haul lanes (i.e., below 500 miles), where trucks offers more flexibility at com-
petitive rates. That said, competition in regional shorter-haul trucking markets would continue
to increase as long-haul carriers look for alternate markets.
Financial GroupA member of BMO March 21, 2012
$5 Gas? BMO Capital Markets
15
J.B. Hunt – Intermodal Leaves Company Well Positioned
In 2011, J.B. Hunt’s intermodal business accounted for about 68% of consolidated operating
income. As fuel prices rise, shippers become more willing to consider intermodal opportuni-
ties to combat higher freight costs. We estimate that at current diesel prices ($4.15 per gallon),
the cost advantage of intermodal over trucking is about 40% for JB Hunt’s book of business.
If diesel were to spike to $5 per gallon, we estimate the cost advantage would increase to
50%. There is a substantial market opportunity in the eastern portion of the US (where the
adoption of intermodal is at an earlier stage) because of the denser population base and shorter
average length of haul compared to the western US. CSX has estimated that a market poten-
tial of up to 9.3 million loads (>550 miles) could be converted to intermodal in the Eastern
US. By comparison, JB Hunt shipped 1.25 million intermodal loads across its entire business
in 2011. The company has been generating impressive volume growth as it benefits from on-
going truck-to-train conversion and penetration of new markets. In 2011, J.B. Hunt’s inter-
modal loads were up 16%, including a 32% surge in the eastern network and a 10% increase
in transcontinental loads (western/central network).
Exhibit 10: J.B. Hunt Intermodal Volumes vs. Diesel Prices
100
150
200
250
300
350
Q1 Q2Q3 Q4 Q1 Q2Q3 Q4 Q1 Q2Q3 Q4 Q1 Q2Q3 Q4 Q1 Q2Q3 Q4 Q1 Q2Q3 Q4 Q1 Q2Q3 Q4
2005 2006 2007 2008 2009 2010 2011
JBH
T I
nte
rmo
dal
Lo
ads
(tho
usan
ds)
$1.80
$2.20
$2.60
$3.00
$3.40
$3.80
$4.20
$4.60
US
Ret
ail
On
-Hig
hw
ay D
iese
l P
rice
s
Intermodal Loads Diesel Qtrly Avg
Source: US Department of Energy (DOE), Company reports, BMO Capital Markets.
Mullen Group – Oilfield Services Business Expected to More Than Offset Headwind in Trucking In the event of a surge in fuel prices, we believe the headwinds faced by Mullen’s trucking
operations would be more than offset by stronger demand and pricing for its oilfield services
operations (70% of operating income). Higher oil prices should be positive for activity in the
oil patch. This should benefit Mullen’s business units exposed to oilfield production (i.e.,
hauling crude oil from well sites to processing facilities), oil sands and infrastructure (hauling
heavy over-sized equipment), and drilling activity (i.e., rig moving, hauling/warehousing
drilling mud). However, we note that labour constraints in western Canada would be expected
to hold back some of this momentum.
(See pages 47-50 for analyst coverage tables.)
Financial GroupA member of BMO March 21, 2012
$5 Gas? BMO Capital Markets
16
TransForce – Impact Should Be Muted Due to Non-Traditional Trucking and Increased Emphasis on Asset Light Trucking While higher fuel prices are expected to present headwinds for truckload and less-than-
truckload carriers, the overall impact to TransForce should be only modestly negative. Trans-
Force generates roughly two-thirds of its earnings from non-traditional trucking services (i.e.,
courier, oilfield services), the majority of which are less sensitive to higher fuel prices. More-
over, the company has been growing in a less asset intensive manner by using more owner
operators, who would likely absorb some of the higher fuel costs.
Trimac – Most Negative Exposure to Fuel Price Surge Given Higher Percentage of Empty Miles Within our coverage universe, we believe Trimac would face the most pressure under the sce-
nario of higher fuel costs. The company hauls certain bulk commodities that require special-
ized rolling-stock equipment, which limits backhaul opportunities. As a result, Trimac has a
higher percentage of empty miles and would have more difficulty offsetting fuel cost in-
creases with rate hikes.
(See pages 47-50 for analyst coverage tables.)
Financial GroupA member of BMO March 21, 2012
$5 Gas? BMO Capital Markets
17
Retail - Broadlines/Hardlines
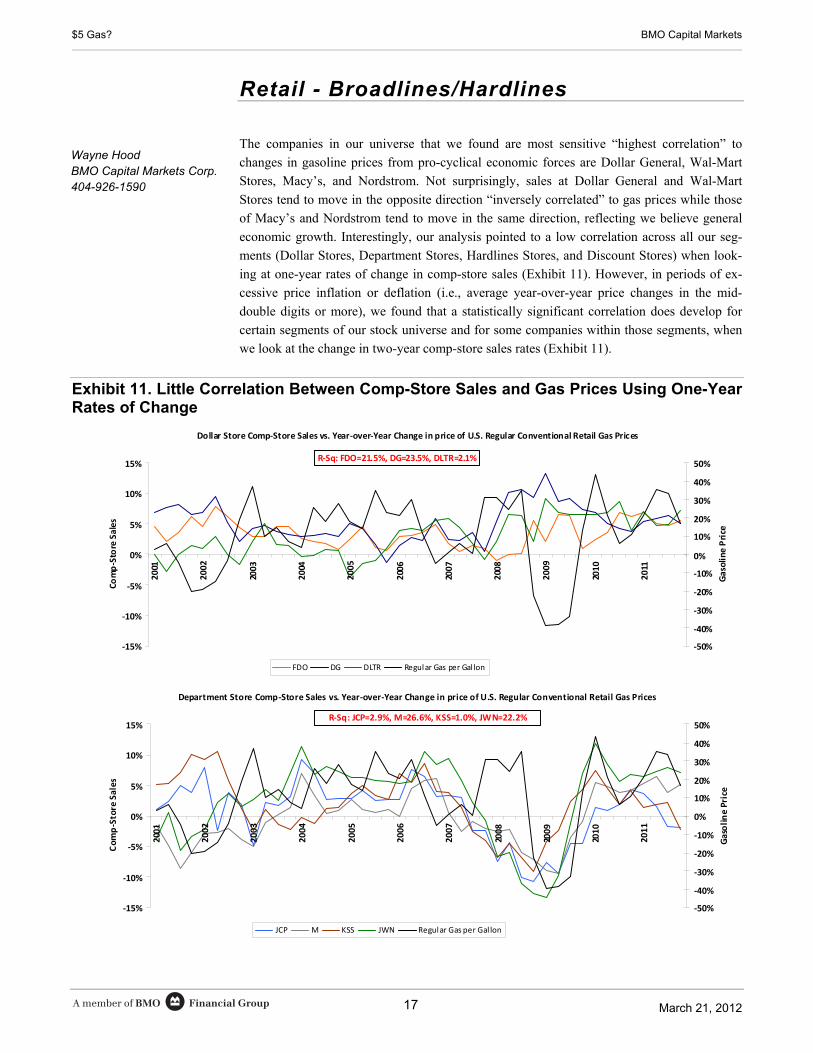
The companies in our universe that we found are most sensitive “highest correlation” to
changes in gasoline prices from pro-cyclical economic forces are Dollar General, Wal-Mart
Stores, Macy’s, and Nordstrom. Not surprisingly, sales at Dollar General and Wal-Mart
Stores tend to move in the opposite direction “inversely correlated” to gas prices while those
of Macy’s and Nordstrom tend to move in the same direction, reflecting we believe general
economic growth. Interestingly, our analysis pointed to a low correlation across all our seg-
ments (Dollar Stores, Department Stores, Hardlines Stores, and Discount Stores) when look-
ing at one-year rates of change in comp-store sales (Exhibit 11). However, in periods of ex-
cessive price inflation or deflation (i.e., average year-over-year price changes in the mid-
double digits or more), we found that a statistically significant correlation does develop for
certain segments of our stock universe and for some companies within those segments, when
we look at the change in two-year comp-store sales rates (Exhibit 11).
Exhibit 11. Little Correlation Between Comp-Store Sales and Gas Prices Using One-Year Rates of Change
Dollar Store Comp‐Store Sales vs. Year‐over‐Year Change in price of U.S. Regular Conventional Retail Gas Prices
‐15%
‐10%
‐5%
0%
5%
10%
15%
2001
2002
2003
2004
2005
2006
2007
2008
2009
2010
2011
Comp‐Store Sales
‐50%
‐40%
‐30%
‐20%
‐10%
0%
10%
20%
30%
40%
50%
Gasoline
Price
FDO DG DLTR Regular Gas per Gal lon
R‐Sq: FDO=21.5%, DG=23.5%, DLTR=2.1%
Department Store Comp‐Store Sales vs. Year‐over‐Year Change in price of U.S. Regular Conventional Retail Gas Prices
‐15%
‐10%
‐5%
0%
5%
10%
15%
2001
2002
2003
2004
2005
2006
2007
2008
2009
2010
2011
Comp‐Store Sales
‐50%
‐40%
‐30%
‐20%
‐10%
0%
10%
20%
30%
40%
50%Gasoline Price
JCP M KSS JWN Regular Gas per Gal lon
R‐Sq: JCP=2.9%, M=26.6%, KSS=1.0%, JWN=22.2%
Wayne Hood BMO Capital Markets Corp. 404-926-1590
Financial GroupA member of BMO March 21, 2012
$5 Gas? BMO Capital Markets
18
Hardlines Comp‐Store Sales vs. vs. Year‐over‐Year Change in price of U.S. Regular Conventional Retail Gas Prices
‐15%
‐10%
‐5%
0%
5%
10%
15%
2001
2002
2003
2004
2005
2006
2007
2008
2009
2010
2011
Comp‐Store Sales
‐50%
‐40%
‐30%
‐20%
‐10%
0%
10%
20%
30%
40%
50%
Gasoline Price
HD LOW TSCO Regular Gas per Gallon
R‐Sq: HD=11.0%, LOW=4.7%, TSCO=2.0%
Discount Store Comp‐Store Sales vs. Year‐over‐Year Change in price of U.S. Regular Conventional Reta il Gas Prices
‐15%
‐10%
‐5%
0%
5%
10%
15%
2001
2002
2003
2004
2005
2006
2007
2008
2009
2010
2011
Comp‐Store Sales
‐50%
‐40%
‐30%
‐20%
‐10%
0%
10%
20%
30%
40%
50%
Gasoline
Price
TGT WMT COST Regular Gas per Gallon
R‐Sq: TGT=7.8%, WMT=5.7%, COST=20.3%
Source: Company reports, BMO Capital Markets.
Dollar Stores We found that a statistically significant correlation (49.6%) exists for Dollar General, but not
for Family Dollar or Dollar Tree (Exhibit 12). We find that while Family Dollar’s and Dollar
Tree’s comp-store sales remain relatively uncorrelated, sales at Dollar General do tend to
experience sequential declines as gasoline prices inflate quickly while the opposite holds true
in a period of swift declines. Given Dollar General’s strong rural presence (more miles
driven) versus the skewed urban presence of Family Dollar and versus the greater store
penetration in relatively higher household income zip codes of Dollar Tree, we would expect
to find these respective results given extreme gasoline price volatility.
(See pages 47-50 for analyst coverage tables.)
Financial GroupA member of BMO March 21, 2012
$5 Gas? BMO Capital Markets
19
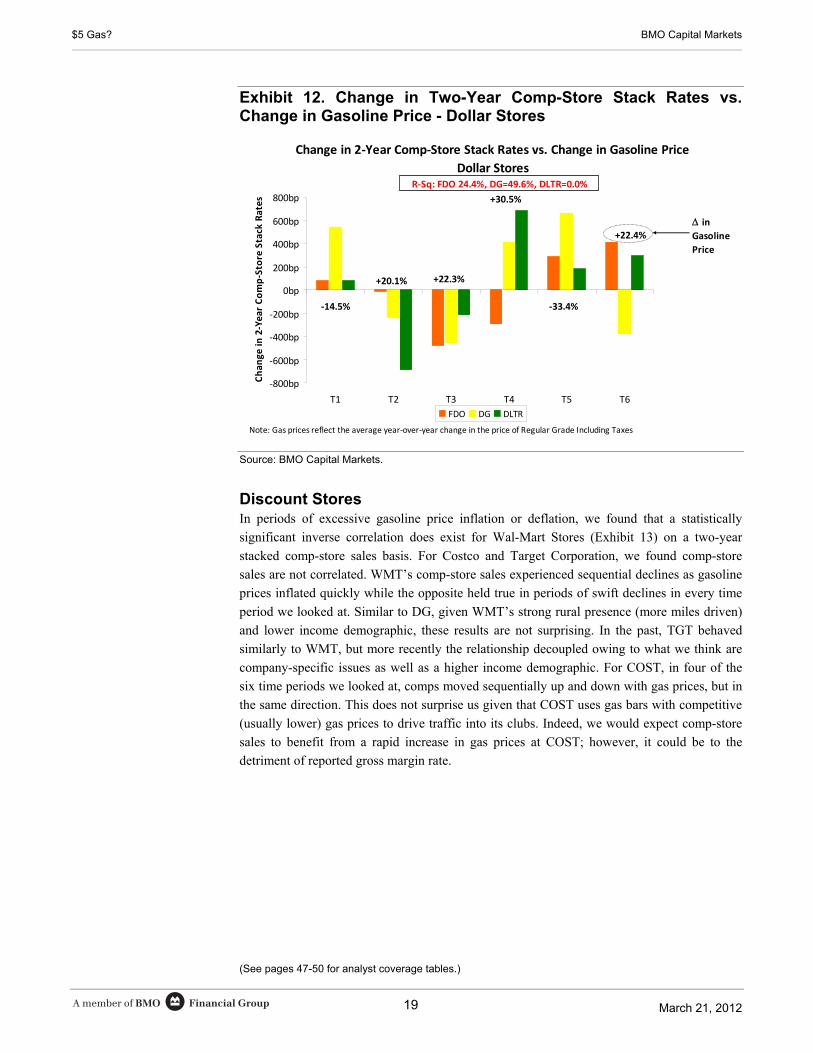
Exhibit 12. Change in Two-Year Comp-Store Stack Rates vs. Change in Gasoline Price - Dollar Stores
Change in 2‐Year Comp‐Store Stack Rates vs. Change in Gasoline Price
Dollar Stores
‐800bp
‐600bp
‐400bp
‐200bp
0bp
200bp
400bp
600bp
800bp
T1 T2 T3 T4 T5 T6
Chan
ge in 2‐Year Comp‐Store Stack Rates
FDO DG DLTR
in Gasoline
Price
+22.4%
‐14.5%
+20.1% +22.3%
+30.5%
‐33.4%
Note: Gas prices reflect the average year‐over‐year change in the price of Regular Grade Including Taxes
R‐Sq: FDO 24.4%, DG=49.6%, DLTR=0.0%
Source: BMO Capital Markets.
Discount Stores In periods of excessive gasoline price inflation or deflation, we found that a statistically
significant inverse correlation does exist for Wal-Mart Stores (Exhibit 13) on a two-year
stacked comp-store sales basis. For Costco and Target Corporation, we found comp-store
sales are not correlated. WMT’s comp-store sales experienced sequential declines as gasoline
prices inflated quickly while the opposite held true in periods of swift declines in every time
period we looked at. Similar to DG, given WMT’s strong rural presence (more miles driven)
and lower income demographic, these results are not surprising. In the past, TGT behaved
similarly to WMT, but more recently the relationship decoupled owing to what we think are
company-specific issues as well as a higher income demographic. For COST, in four of the
six time periods we looked at, comps moved sequentially up and down with gas prices, but in
the same direction. This does not surprise us given that COST uses gas bars with competitive
(usually lower) gas prices to drive traffic into its clubs. Indeed, we would expect comp-store
sales to benefit from a rapid increase in gas prices at COST; however, it could be to the
detriment of reported gross margin rate.
(See pages 47-50 for analyst coverage tables.)
Financial GroupA member of BMO March 21, 2012
$5 Gas? BMO Capital Markets
20
Exhibit 13. Change in Two-Year Comp-Store Stack Rates vs. Change in Gasoline Price - Discount and Club Retailers
Change in 2‐Year Comp‐Store Stack Rates vs. Change in Gasoline Price
Discount and Club Retailers
‐1000bp
‐800bp
‐600bp
‐400bp
‐200bp
0bp
200bp
400bp
600bp
800bp
T1 T2 T3 T4 T5 T6
Change
in 2‐Year Comp‐Store Stack Rates
TGT WMT COST
in Gasoline
Price
+22.4%
‐14.5%
+20.1%
+22.3%+30.5%
‐33.4%
Note: Gas prices reflect the average year‐over‐year change in the price of Regular Grade Including Taxes
R‐Sq: TGT 8.8%, WMT=41.4%, COST=9.6%
Source BMO Capital Markets.
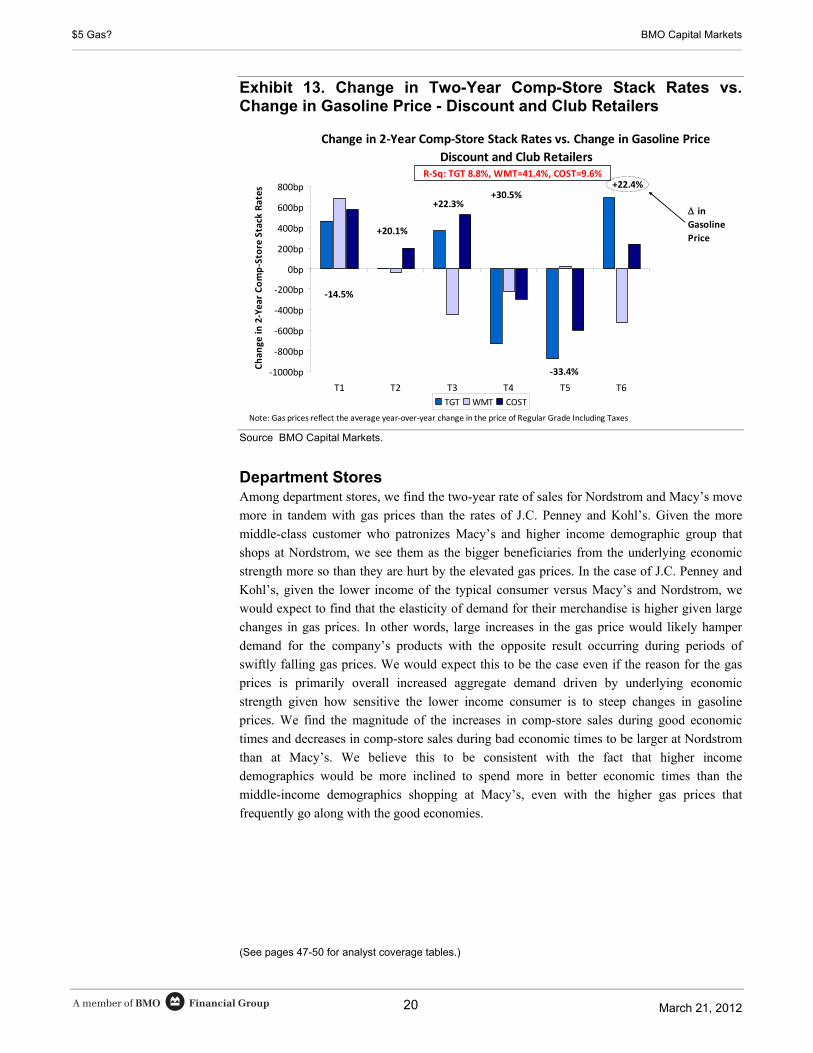
Department Stores Among department stores, we find the two-year rate of sales for Nordstrom and Macy’s move
more in tandem with gas prices than the rates of J.C. Penney and Kohl’s. Given the more
middle-class customer who patronizes Macy’s and higher income demographic group that
shops at Nordstrom, we see them as the bigger beneficiaries from the underlying economic
strength more so than they are hurt by the elevated gas prices. In the case of J.C. Penney and
Kohl’s, given the lower income of the typical consumer versus Macy’s and Nordstrom, we
would expect to find that the elasticity of demand for their merchandise is higher given large
changes in gas prices. In other words, large increases in the gas price would likely hamper
demand for the company’s products with the opposite result occurring during periods of
swiftly falling gas prices. We would expect this to be the case even if the reason for the gas
prices is primarily overall increased aggregate demand driven by underlying economic
strength given how sensitive the lower income consumer is to steep changes in gasoline
prices. We find the magnitude of the increases in comp-store sales during good economic
times and decreases in comp-store sales during bad economic times to be larger at Nordstrom
than at Macy’s. We believe this to be consistent with the fact that higher income
demographics would be more inclined to spend more in better economic times than the
middle-income demographics shopping at Macy’s, even with the higher gas prices that
frequently go along with the good economies.
(See pages 47-50 for analyst coverage tables.)
Financial GroupA member of BMO March 21, 2012
$5 Gas? BMO Capital Markets
21
Exhibit 14. Change in Two-Year Comp-Store Stack Rates vs. Change in Gasoline Price - Department Stores p
‐2000bp
‐1500bp
‐1000bp
‐500bp
0bp
500bp
1000bp
1500bp
2000bp
2500bp
3000bp
T1 T2 T3 T4 T5 T6
Chan
ge in
2‐Year Comp‐Store Stack Rates
JCP M KSS JWN
in Gasoline
Price
+22.4%
‐14.5%
+20.1%
+22.3%
+30.5%
‐33.4%
Note: Gas prices reflect the average year‐over‐year change in the price of Regular Grade Including Taxes
R‐Sq: JCP=5.4%, M=30.6%, KSS=1.8%, JWN=22.9%
Source: BMO Capital Markets.
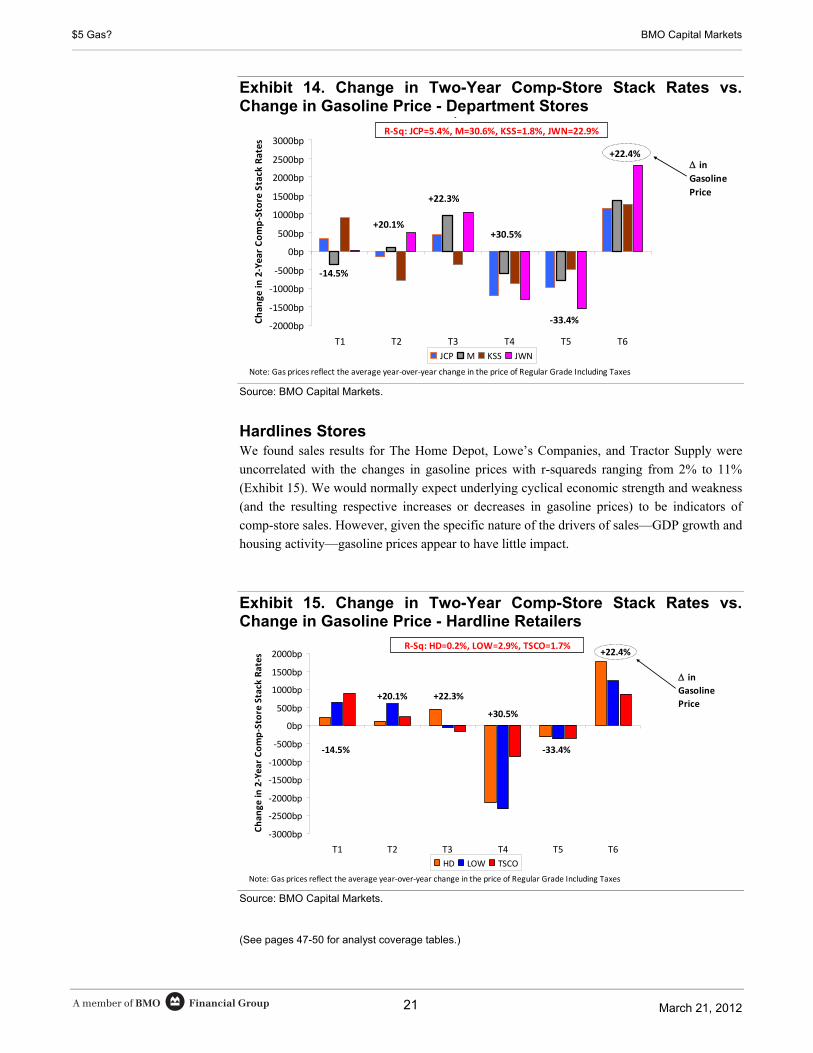
Hardlines Stores We found sales results for The Home Depot, Lowe’s Companies, and Tractor Supply were
uncorrelated with the changes in gasoline prices with r-squareds ranging from 2% to 11%
(Exhibit 15). We would normally expect underlying cyclical economic strength and weakness
(and the resulting respective increases or decreases in gasoline prices) to be indicators of
comp-store sales. However, given the specific nature of the drivers of sales—GDP growth and
housing activity—gasoline prices appear to have little impact.
Exhibit 15. Change in Two-Year Comp-Store Stack Rates vs. Change in Gasoline Price - Hardline Retailers
‐3000bp
‐2500bp
‐2000bp
‐1500bp
‐1000bp
‐500bp
0bp
500bp
1000bp
1500bp
2000bp
T1 T2 T3 T4 T5 T6
Change
in 2‐Year Comp‐Store Stack Rates
HD LOW TSCO
in Gasoline
Price
+22.4%
‐14.5%
+20.1% +22.3%
+30.5%
‐33.4%
Note: Gas prices reflect the average year‐over‐year change in the price of Regular Grade Including Taxes
R‐Sq: HD=0.2%, LOW=2.9%, TSCO=1.7%
Source: BMO Capital Markets.
(See pages 47-50 for analyst coverage tables.)

Financial GroupA member of BMO March 21, 2012
$5 Gas? BMO Capital Markets
22
Financial GroupA member of BMO March 21, 2012
$5 Gas? BMO Capital Markets
23
Toys & Leisure
Higher gas prices will have the most obvious effect on the powersports sector of the leisure
industry, as these companies sell products whose cost of use is directly related to the price of
gasoline.
The company to have the biggest negative impact is Brunswick (BC), the world’s largest boat
and boat engine manufacturer. 75% of BC’s sales are related to the boating industry. We
believe it is well known that boats get very poor gas mileage. Smaller fiberglass boats
generally get 2-4 miles per gallon, while larger inboard/sterndrive sport-yachts are lucky if
they get up to 1 mile per gallon. Thus, higher gas prices can significantly increase the cost of
boating.
What is also impactful, but perhaps not as obvious, is the fact that a rising price of gasoline
will also increase the cost of getting a boat to the water, or getting to a boat that is moored or
docked on the water. According to the NMMA, boat owners spent more on gas in 2010 to get
to their boat or get their boat to water ($3.7 billion) than they actually did in the operation of
their boat ($2.4 billion). We estimate that about 60% of all boats are trailered, about 25% are
stored at a marina, while just 15% are on the water at the owners’ residence. Therefore, 85%
of all boaters are required to travel in some way to use their boat, while 60% actually have to
haul their boat. Hauling a boat on a trailer will reduce a vehicle’s mileage by about 20%-35%,
depending on the weight of the boat.
Polaris (PII) is the world leader in off-road vehicles, with most sales coming from ATVs,
side-by-sides, and snowmobiles. All of PII’s products consume gasoline, and all would be
negatively impacted by a significant increase in the price of gasoline. However, we think the
use of these vehicles would be much less affected than boats.
First, in the off-road vehicle segment (ATV and side-by-side), which generates 80% of PII’s
sales, we estimate that about half of its sales are to farmers, ranchers, landscapers, and the
government, all of which tend to use the vehicles for work-related purposes. We believe the
use of these vehicles will see no impact from higher gas prices.
The balance of PII’s product portfolio is used for recreational purposes. But even in this
segment, we see minimal impact from higher gas prices. PII’s customers generally take their
ATVs, side-by-sides, or snowmobiles out on weekends and perhaps ride 100 miles on them
during each outing. Gas mileage on off-road vehicles averages 12-15 mpg, so if gas prices rise
from a current $3.75 to $5.00 per gallon, that adds about $10 to the cost of their day of fun.
We doubt these powersports enthusiasts would give up riding for a day because it costs an
extra $10.
For Harley-Davidson (HOG), owing to the superior gas mileage of motorcycles, we think the
impact of higher gas prices would be mostly positive. In the face of rising gas prices, we think
people are looking to motorcycles as a less expensive form of transportation. The appeal of
high-mileage motorcycle could be especially strong for a commuter who is consistently
putting extensive miles on his/her car.
(See pages 47-50 for analyst coverage tables.)
Gerrick Johnson BMO Capital Markets Corp. 212-883-5192
Financial GroupA member of BMO March 21, 2012
$5 Gas? BMO Capital Markets
24
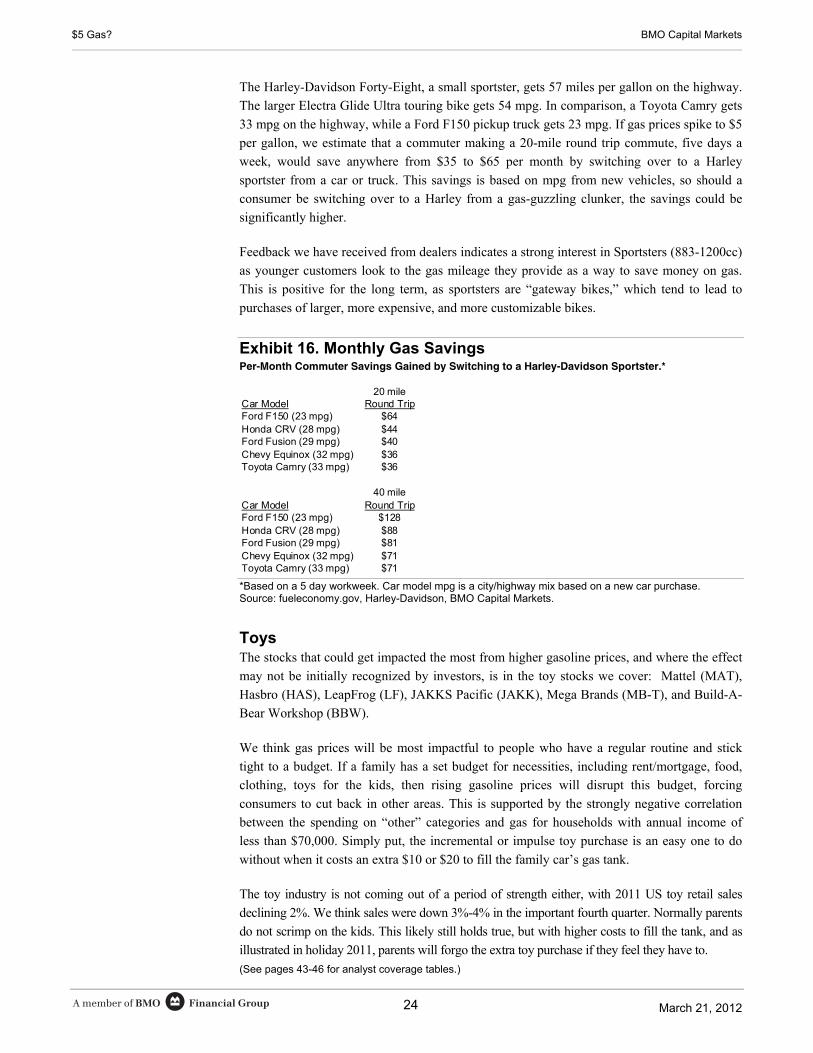
The Harley-Davidson Forty-Eight, a small sportster, gets 57 miles per gallon on the highway.
The larger Electra Glide Ultra touring bike gets 54 mpg. In comparison, a Toyota Camry gets
33 mpg on the highway, while a Ford F150 pickup truck gets 23 mpg. If gas prices spike to $5
per gallon, we estimate that a commuter making a 20-mile round trip commute, five days a
week, would save anywhere from $35 to $65 per month by switching over to a Harley
sportster from a car or truck. This savings is based on mpg from new vehicles, so should a
consumer be switching over to a Harley from a gas-guzzling clunker, the savings could be
significantly higher.
Feedback we have received from dealers indicates a strong interest in Sportsters (883-1200cc)
as younger customers look to the gas mileage they provide as a way to save money on gas.
This is positive for the long term, as sportsters are “gateway bikes,” which tend to lead to
purchases of larger, more expensive, and more customizable bikes.
Exhibit 16. Monthly Gas Savings Per-Month Commuter Savings Gained by Switching to a Harley-Davidson Sportster.*
Car ModelFord F150 (23 mpg) $64Honda CRV (28 mpg) $44Ford Fusion (29 mpg) $40Chevy Equinox (32 mpg) $36Toyota Camry (33 mpg) $36
Car ModelFord F150 (23 mpg) $128Honda CRV (28 mpg) $88Ford Fusion (29 mpg) $81Chevy Equinox (32 mpg) $71Toyota Camry (33 mpg) $71
Round Trip
Round Trip20 mile
40 mile
*Based on a 5 day workweek. Car model mpg is a city/highway mix based on a new car purchase. Source: fueleconomy.gov, Harley-Davidson, BMO Capital Markets.
Toys The stocks that could get impacted the most from higher gasoline prices, and where the effect
may not be initially recognized by investors, is in the toy stocks we cover: Mattel (MAT),
Hasbro (HAS), LeapFrog (LF), JAKKS Pacific (JAKK), Mega Brands (MB-T), and Build-A-
Bear Workshop (BBW).
We think gas prices will be most impactful to people who have a regular routine and stick
tight to a budget. If a family has a set budget for necessities, including rent/mortgage, food,
clothing, toys for the kids, then rising gasoline prices will disrupt this budget, forcing
consumers to cut back in other areas. This is supported by the strongly negative correlation
between the spending on “other” categories and gas for households with annual income of
less than $70,000. Simply put, the incremental or impulse toy purchase is an easy one to do
without when it costs an extra $10 or $20 to fill the family car’s gas tank.
The toy industry is not coming out of a period of strength either, with 2011 US toy retail sales
declining 2%. We think sales were down 3%-4% in the important fourth quarter. Normally parents
do not scrimp on the kids. This likely still holds true, but with higher costs to fill the tank, and as
illustrated in holiday 2011, parents will forgo the extra toy purchase if they feel they have to.
(See pages 43-46 for analyst coverage tables.)
Financial GroupA member of BMO March 21, 2012
$5 Gas? BMO Capital Markets
25
Restaurants
We found little-to-no statistical relationship between changing gas prices and
restaurant comps or restaurant stock performance over the last decade (or so). In fact,
we found other macroeconomic variables to be more relevant (primarily jobs and income). As
a result, we believe that if $5 gas accompanies strengthening economic growth and continued
job growth, the rising economic tide would lift all boats, benefiting sales across the restaurant
industry. However, if we see gas prices spike despite weakening domestic economic growth
(reminiscent of 2008), then we would expect higher gas prices to amplify the negative
economic impact to restaurants.
The impact (on consumer spending) from changing employment levels exceeds any
impact from changing gas prices. We performed regression analysis (from 1980 to present)
between real US consumer spending and a number of macroeconomic variables including
employment, income, consumer credit, and changes in retail gas prices, among other factors.
We found that changes in the rate of employment had the highest correlation with real
consumer spending over the period with a coefficient of determination (R2) of 0.54 followed
closely by nonfarm payrolls (R2 = 0.50) and RDPI (R2 = 0.48). In contrast, the impact of
changing retail gas prices on overall consumer spending was negligible (R2 = 0.04 – the
weakest relationship that we measured).
We found a similar result when we focused on restaurant demand (employment impact
> gas price impact). Next, we ran regressions of quarterly comp-store sales for the restaurant
companies in our coverage universe against changes in retail gas prices and employment. In
short, we found that changes in employment explained 65% of the variation in comp-store
sales across our restaurant coverage universe (from 2001 to present – Exhibit 17), while the
impact to comps from changes in gas prices was not statistically significant (R2 = 0.13 –
Exhibit 17).
Exhibit 17. Comps for Our Restaurant Coverage Are Driven More by Employment Than Gas
(2%)
(1%)
0%
1%
2%
3%
4%
5%
1Q01
3Q01
1Q02
3Q02
1Q03
3Q03
1Q04
3Q04
1Q05
3Q05
1Q06
3Q06
1Q07
3Q07
1Q08
3Q08
1Q09
3Q09
1Q10
3Q10
1Q11
3Q11
(3.0%)
0.0%
3.0%
6.0%
9.0%
∆% Unemployment (Left Axis) ∆% Comps ‐ BMO Restaurant Coverage (Right Axis)
R2 = 65% ∆ Unemployment vs. Restaurant Comps (Yr/Yr ∆% )
Source: Company reports, Bureau of Economy Analysis, and Energy Information Agency.
(45%)
(35%)
(25%)
(15%)
(5%)
5%
15%
25%
35%
45%
1Q01
3Q01
1Q02
3Q02
1Q03
3Q03
1Q04
3Q04
1Q05
3Q05
1Q06
3Q06
1Q07
3Q07
1Q08
3Q08
1Q09
3Q09
1Q10
3Q10
1Q11
3Q11
(3.0%)
0.0%
3.0%
6.0%
9.0%
∆% Gas $'s (Left Axis) ∆% Comps ‐ BMO Restaurant Coverage (Right Axis)
R2 = 13% ∆ Gas $'s vs. Restaurant Comps (Yr/Yr ∆% )
Phillip Juhan, CFA BMO Capital Markets Corp. 404-926-1599
Financial GroupA member of BMO March 21, 2012
$5 Gas? BMO Capital Markets
26
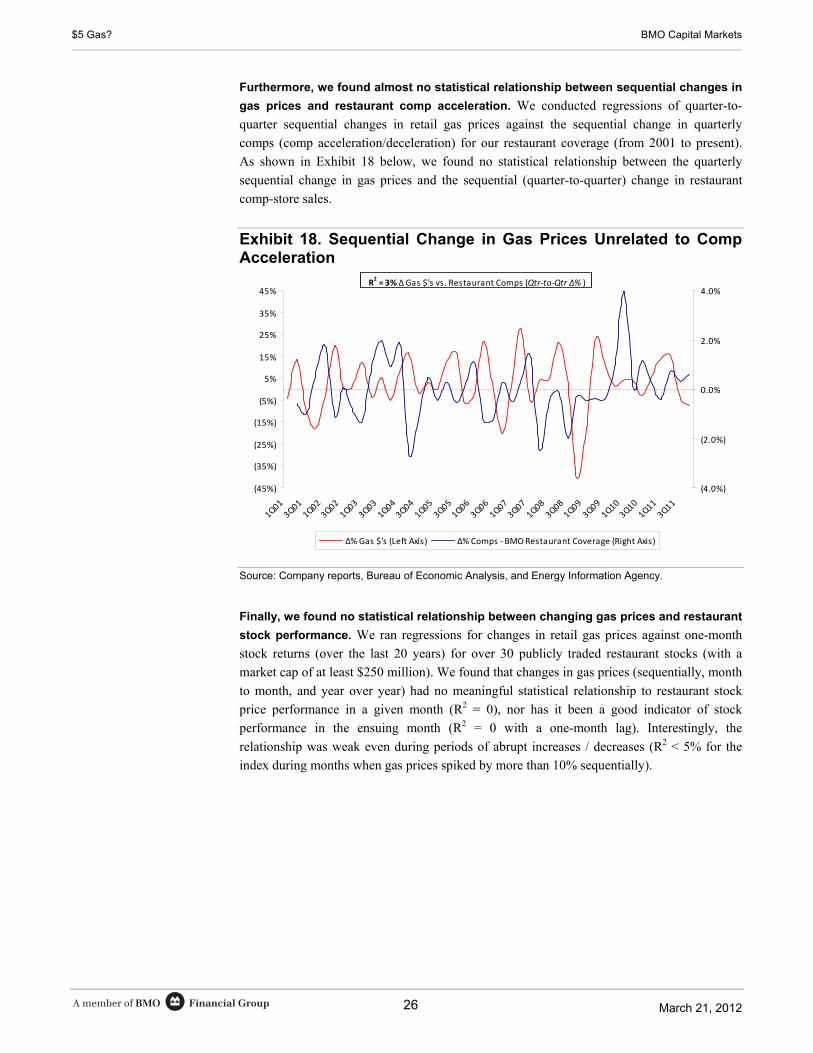
Furthermore, we found almost no statistical relationship between sequential changes in
gas prices and restaurant comp acceleration. We conducted regressions of quarter-to-
quarter sequential changes in retail gas prices against the sequential change in quarterly
comps (comp acceleration/deceleration) for our restaurant coverage (from 2001 to present).
As shown in Exhibit 18 below, we found no statistical relationship between the quarterly
sequential change in gas prices and the sequential (quarter-to-quarter) change in restaurant
comp-store sales.
Exhibit 18. Sequential Change in Gas Prices Unrelated to Comp Acceleration
(45%)
(35%)
(25%)
(15%)
(5%)
5%
15%
25%
35%
45%
1Q01
3Q01
1Q02
3Q02
1Q03
3Q03
1Q04
3Q04
1Q05
3Q05
1Q06
3Q06
1Q07
3Q07
1Q08
3Q08
1Q09
3Q09
1Q10
3Q10
1Q11
3Q11
(4.0%)
(2.0%)
0.0%
2.0%
4.0%
∆% Gas $'s (Left Axis) ∆% Comps ‐ BMO Restaurant Coverage (Right Axis)
R2= 3% ∆ Gas $'s vs. Restaurant Comps (Qtr‐to‐Qtr ∆% )
Source: Company reports, Bureau of Economic Analysis, and Energy Information Agency.
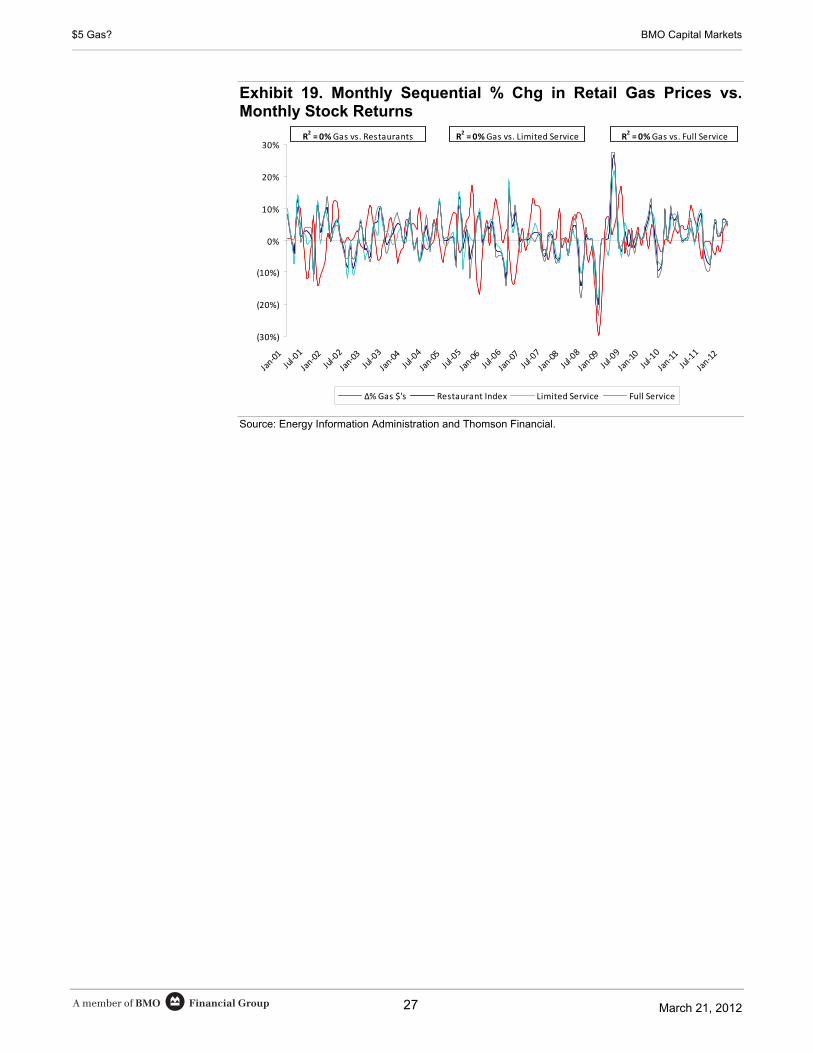
Finally, we found no statistical relationship between changing gas prices and restaurant
stock performance. We ran regressions for changes in retail gas prices against one-month
stock returns (over the last 20 years) for over 30 publicly traded restaurant stocks (with a
market cap of at least $250 million). We found that changes in gas prices (sequentially, month
to month, and year over year) had no meaningful statistical relationship to restaurant stock
price performance in a given month (R2 = 0), nor has it been a good indicator of stock
performance in the ensuing month (R2 = 0 with a one-month lag). Interestingly, the
relationship was weak even during periods of abrupt increases / decreases (R2 < 5% for the
index during months when gas prices spiked by more than 10% sequentially).
Financial GroupA member of BMO March 21, 2012
$5 Gas? BMO Capital Markets
27
Exhibit 19. Monthly Sequential % Chg in Retail Gas Prices vs. Monthly Stock Returns
(30%)
(20%)
(10%)
0%
10%
20%
30%
Jan‐01
Jul‐01
Jan‐02
Jul‐02
Jan‐03
Jul‐03
Jan‐04
Jul‐04
Jan‐05
Jul‐05
Jan‐06
Jul‐06
Jan‐07
Jul‐07
Jan‐08
Jul‐08
Jan‐09
Jul‐09
Jan‐10
Jul‐10
Jan‐11
Jul‐11
Jan‐12
∆% Gas $'s Restaurant Index Limited Service Full Service
R2 = 0%Gas vs. Restaurants R
2 = 0% Gas vs. Full ServiceR
2= 0%Gas vs. Limited Service
Source: Energy Information Administration and Thomson Financial.

Financial GroupA member of BMO March 21, 2012
$5 Gas? BMO Capital Markets
28
Financial GroupA member of BMO March 21, 2012
$5 Gas? BMO Capital Markets
29
Exhibitors and Gaming
Exhibition Industry In general, the exhibition industry has been largely immune to the economic swings that have
occurred over the past two decades, including the recent spikes (2005/2008) in gasoline, which
took prices up $1 per gallon or more than previous trend lines. In fact, at the height of the
economic fears in 2009, the exhibitors saw a roughly 10% increase in revenue driven in large part
by higher attendance.
Whereas some consumer discretionary/leisure spending categories may experience some
slowdown, this has not been the case for the major exhibitors such as AMC, Cinemark (CNK,
Outperform, $29 target), Cineplex (CGX.TO, Outperform, $30 target), or Regal (RGC,
Outperform, $19 target) in the last decade, when we have gone through two major gasoline price
spikes. Whether it is the social experience, value proposition versus other out of home
entertainment options, or the attraction of high-priced comfort food (popcorn and Coke!),
eliminating the movie-going option does not appear to be the one most consumers choose to
economize when higher gas prices arrive.
Although the one major theater circuit that does seem to feel the impact of higher gas prices is
Carmike Cinemas (CKEC, Market Perform, $10 target). Historically, it seems to experience more
of an unfavorable attendance impact from the higher gas prices than the other exhibitors. The
company’s geographic footprint is largely centered in the Southeast portion of the US, and it tends
to operate in more rural settings, which perhaps explains its vulnerability when we see major
upward moves in gas prices.
We see a neutral impact to most exhibitor stocks if gas prices were to rise to $5 per gallon.
Gaming Industry The domestic gaming market can be, in simplistic terms, broken down into two broad geographical
categories: the regional casinos and the destination resorts (Las Vegas). It is estimated by the
American Gaming Association (AGA) that over 80% of the American population lives within a
two-hour drive to a casino and that close to 40% of US households gamble at least once per year.
The last two gasoline price spikes have spawned frequent chatter that rising gas prices would keep
people from driving or gambling due to the higher personal or gaming trip expense quotient. Any
brief examination of the variables would likely conclude that the individual whose gaming behavior
is impacted by higher gas prices is the marginal customer at best and represents a negligible amount
of revenue for casinos anyway. The incremental $5 or $10 cost to drive 100 miles to visit a regional
riverboat or Native American casino probably is not going to stop his entertainment routine at a local
casino, even if the overall gasoline bill were to rise $50 or $100 per month.
With about half the visitors to Las Vegas arriving by automobile, it might seem logical to presume
a measureable portion of the drive-in customers would defer or cancel a drive to Las Vegas. Using
an average of 20 miles per gallon for the 280-mile one-way commute to Las Vegas from Los
Angeles (the largest feeder market for drive-in traffic) and assuming an incremental $1 per gallon
increase in the price of gasoline, the price of the trip increases $28.
(See pages 47-50 for analyst coverage tables.)
Jeffrey Logsdon BMO Capital Markets Corp. 213-228-2234
Financial GroupA member of BMO March 21, 2012
$5 Gas? BMO Capital Markets
30
If the average Las Vegas stay is three days and average gaming budget for the free and
independent traveler (FIT) segment is around $600, we do not think there is a lot of risk to
casino companies posed by higher gas prices and an incremental $28 trip cost. During the last
two spikes, some casinos in Las Vegas even used a free tank of gas as a promotional tool to
lure customers.
On the more positive side of the equation are the benefits of $105-$120 per barrel oil. It is
exceptionally good for Latin American gamblers as well as those most levered to oil in Texas,
Louisiana, and Oklahoma (owners and workers), many of whom have a high propensity for
gambling. Those who might be the greatest beneficiaries are the high-end casinos in Las
Vegas (MGM, LVS, WYNN) and those in Louisiana (PNK, BYD, and CZR).
Disney Disney’s domestic theme parks in Florida and California generate about 35% and 65%,
respectively, of their admissions from the “locals” market, which is broadly defined as visitors
who live within a two-hour drive to the park. Some observers may postulate that Disney could
feel some decline in attendance because of the overall expense pressure on consumers who
are having to pay higher gasoline prices or are hesitant to spend the extra dollars to get there.
Jet fuel prices rise similarly if not more than gasoline prices. However, we point out that a
significant portion of the non-commuters are booking packages 3-6 months ahead for Walt
Disney World, when the incremental cost of higher jet fuel prices on a $2,000-$10,000
vacation is not going to be that noticeable (less than a 5% package cost price increase).
Historically, periods of high gas prices have not had any measurable impact on admissions;
Park attendance was up 5% in each of 2005 and 2006 and up 2% in 2008.
Disney parks and resorts tend to be destination resorts or high priority excursions that
certainly transcend gas prices for most park and resort visitors. A $10 incremental expense for
gas for locals does not rationally seem sufficient when a family of four is likely to spend more
than $500 for a one-day visit. Locals obviously have time-shifting capabilities, but we are
skeptical that anything more than a 1%-2% reduction in spending for a very small percentage
of Disney parks’ annual visitors would occur. Indeed, per cap spending actually rose 5% in
2005, and 3% in each of 2006 and 2008, the three periods of gas price spikes mentioned
above. We believe the impact to Disney of $5 gas prices is, at the very least, neutral.
(See pages 47-50 for analyst coverage tables.)
Financial GroupA member of BMO March 21, 2012
$5 Gas? BMO Capital Markets
31
Consumer - Special Situations
For the group of Canadian furniture retailers in our coverage universe (LNF, BRK, GBT.a,
CWA, EH), while we believe that rising gas prices takes a further bite out of consumers’
discretionary spending and general feeling of wealth, furniture, appliance, and electronics
sales (both at the retail level and wholesale level to builders) tend to correlate most highly
with housing activity. As such, the level of housing activity trumps movement in gas prices.
Consumers tend to buy household furniture and appliances when they move into a new home,
with homebuyers tending to spend more than non-moving homeowners. Typically,
homebuyer spending on furniture continues in the three years following a move, with the
majority of spending occurring in the first two years; after this, spending declines annually
until their spending is equivalent to a non-moving homeowner. In addition, a strong housing
market (higher transaction activity accompanied by rising home prices) contributes to a
consumer’s feeling of wealth, compounded by strong employment and higher consumer
confidence, which can lead to higher discretionary spending.
For North West Company, fuel prices impact the company’s operating costs to a much larger
degree, through both freight (given higher distribution costs across the breadth of its store
network – northern Canada, Alaska, Caribbean, South Pacific) and fuel-related utility costs
(powering and heating a store in a cold northern winter). Given the company’s strong
competitive position across more than 60% of its store network (namely, Alaska and northern
Canada), the company generally is able to recover a high proportion of rising fuel costs
through retail pricing. While this is less the case in its more competitive Giant Tiger and Cost-
U-Less markets, we believe that on a net basis, North West is well positioned to recover, over
time, short-term fuel-related cost pressures.
(See pages 47-50 for analyst coverage tables.)
Stephen MacLeod BMO Nesbitt Burns Inc. 416-359-8069

Financial GroupA member of BMO March 21, 2012
$5 Gas? BMO Capital Markets
32
Financial GroupA member of BMO March 21, 2012
$5 Gas? BMO Capital Markets
33
Personal Care and Household Products
From the standpoint of consumer behavior: Spikes in gasoline prices historically have had a
modest impact on sales volumes as people in developed markets cut back little on necessities.
However, the total dollar sales in some categories can come under pressure as consumers, as
they have in the past, trade down to more affordable value brands and private label.
In this environment of rising gas prices:
CHD appears best positioned as its portfolio of 60% premium products and 40% value
covers a wide range of price points and should capture much of the migration within its
categories. Its Arm & Hammer (at the upper end of value pricing) and Xtra (at opening
price points) detergents, about 20% of total sales, gained share during the most recent US
recession. We think they will continue to do well if high gas prices crimp consumer
spending. Most recently, Arm & Hammer and Xtra’s share gained 40 bp to 12.7 % in the
12-week IRI data ended February 19.
At the opposite end, Avon’s business may be negatively affected as there is less incentive
for its representatives, most of whom make a modest income, to drive long distances to
make sales to consumers whose income is at least temporarily under pressure. This
impact is felt greatest in North America (19% of sales and 8% of operating profit), where
representatives generally drive more and live further away from their customers than in
other countries.
From the standpoint of the personal care and househould products (PCHP) stock
behavior: While consumer behavior shifts a bit as a result of spikes in gas, the correlation
between gas and oil prices seems to have a bigger impact on the profits and stock prices of
PCHP companies. High gas prices normally follow high oil prices, and high oil prices
typically correlate with underperformance for this group. We analyzed the impact of rising oil
and gas prices in periods of geopolitically induced increases (the 1973 OPEC oil embargo, the
1979 Iranian Revolution, the 1990 Gulf War, the December 2010-April 2011 Arab Spring,
and most recently (Exhibit 20) since mid-December, the escalated tension with Iran). In
addition, we evaluated one extended period of demand-driven price increases between
January 2002 and July 2008.
Performance in the personal care and household products stocks was mixed. In the past,
companies with significant exposure to oil and its derivatives—particularly KMB and PG—
generated modest returns and underperformed the market and other sectors. A surprise finding
(and tied to the factors noted above) was how poorly AVP fared. It underperformed in 7 of 12
periods, including during the first three periods of Middle East turmoil, where it declined an
average of 36%, far worse than the 9% decrease of the S&P 500, and during the most recent
one, where its 14% increase was one of the best of the group but was still below the market’s
24% gain. There is no example of consistent outperformance when oil and gas prices are high.
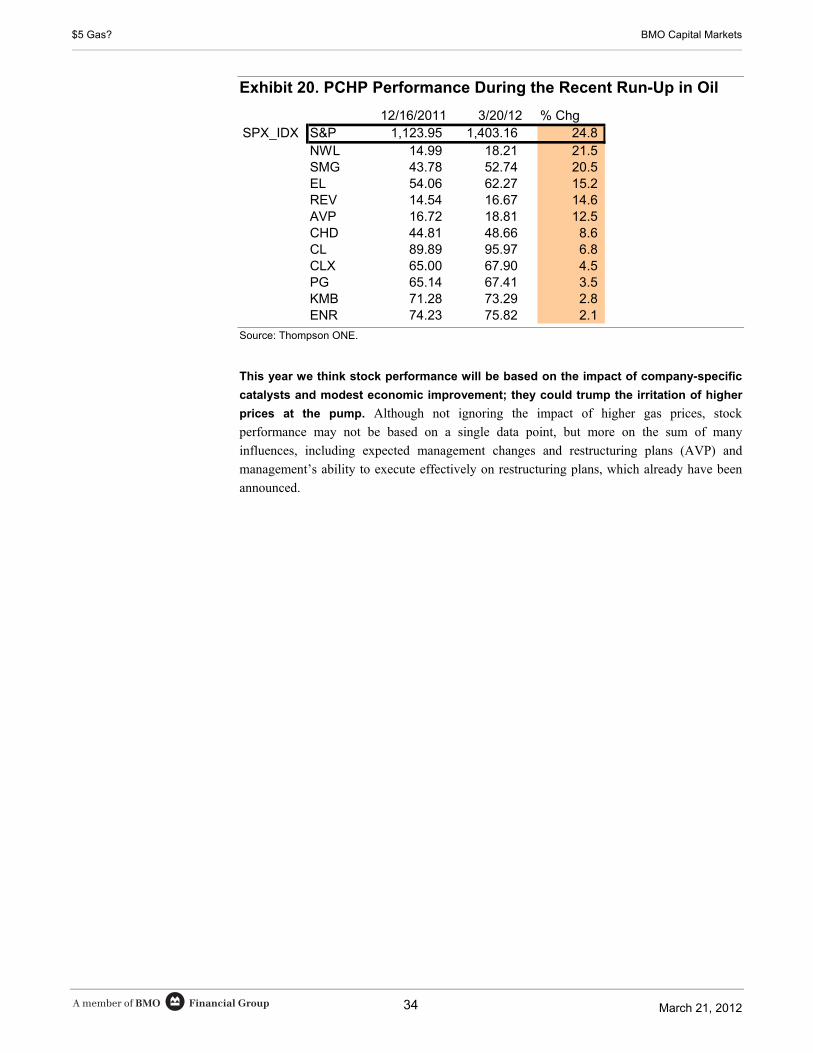
Most recently, all PCHP stocks have underperformed the 25% increase in the S&P 500 since
mid-December. NWL 22% increase is the closest, but we think this has more to do with the
arrival of a new CEO and the adjustment of earnings expectations during an investment phase
than with anything else.
(See pages 47-50 for analyst coverage tables.)
Connie Maneaty BMO Capital Markets Corp. 212-885-4004
Financial GroupA member of BMO March 21, 2012
$5 Gas? BMO Capital Markets
34
Exhibit 20. PCHP Performance During the Recent Run-Up in Oil
12/16/2011 3/20/12 % ChgSPX_IDX S&P 1,123.95 1,403.16 24.8
NWL 14.99 18.21 21.5SMG 43.78 52.74 20.5EL 54.06 62.27 15.2REV 14.54 16.67 14.6AVP 16.72 18.81 12.5CHD 44.81 48.66 8.6CL 89.89 95.97 6.8CLX 65.00 67.90 4.5PG 65.14 67.41 3.5KMB 71.28 73.29 2.8ENR 74.23 75.82 2.1
Source: Thompson ONE.
This year we think stock performance will be based on the impact of company-specific
catalysts and modest economic improvement; they could trump the irritation of higher
prices at the pump. Although not ignoring the impact of higher gas prices, stock
performance may not be based on a single data point, but more on the sum of many
influences, including expected management changes and restructuring plans (AVP) and
management’s ability to execute effectively on restructuring plans, which already have been
announced.
Financial GroupA member of BMO March 21, 2012
$5 Gas? BMO Capital Markets
35
Retail - Apparel & Specialty
As it relates to specialty retail, so far we have not seen any noticeable impact on consumer behavior
as gas prices have increased. We would argue that consumers are likely to remain somewhat
immune—even to $5 per gallon gas—because 1) the employment outlook is brighter, 2) compelling
new spring fashions and warm weather are fueling early demand, 3) consumer sentiment is stronger,
and 4) natural gas prices have declined meaningfully, which has enabled lower heating bills to offset
higher prices at the pump. Our bottom line view is that, barring any significant and unexpected
economic shock, higher gas prices alone will have little negative effect on our companies in the
aggregate, especially as specialty apparel skews to an upper-middle income consumer.
Still, most retailers consider $4 gas prices as the tipping point where consumers begin to pull back
on their discretionary spending. So the real possibility that we could eclipse this figure and hit
$5 per gallon is causing concern in a recovering, yet still fragile, economic environment. While
exorbitant energy prices could weigh negatively on our sector outlook, we must acknowledge that
the impact of higher gasoline prices likely wouldn’t be immediate in the current environment,
where consumer bevior seems somewhat more optimistic. Unless it were a sharp and rapid price
hike (think back to Hurricane Katrina) or meaningful deterioration in other macro components
(like unemployment or overall inflation), our view is that the consumers will continue to grin and
bear it. If gas prices were to climb to $5 per gallon and remain there for three to four months, we
could start to see some changes/reductions in spending habits at the lower end, but otherwise, our
view is that it would take a material price shock to derail spending overall.
Taking a step back, the reality is that consumers have lived with high gas prices for some time now
and sales generally continue to grow across specialty apparel. To the degree consumers make one
or two less trips to the mall is not of major concern, as the trips they do make would likely be more
targeted and productive, particularly given that we are in a strong trend cycle and demand is higher
than it has been in a few years. The bigger issue, and the one which would garner investor
attention, is that performance across different companies would likely be uneven. Typically, it’s
the lower-income consumer who feels the pinch most when energy costs rise. For example, you
might see more resistance in the off-price sector, given the middle-income consumer’s higher
sensitivity to macro conditions (gas represents a higher percentage of their household budget). We
believe TJX would be less impacted than Ross Stores, because of the more diversified base of
retail concepts at the former. On the other hand, in the teen sector, looking good and being on trend
outweighs concerns about gas prices or interest rates, and therefore a rise in gas prices to $5 per
gallon would likely have less impact on the Abercrombies and American Eagles of the world.
High prices at the pump don’t tend to change the spending habits of higher income households—at
least not in the early stages of the upswing. If prices spike significantly and quickly, we
acknowledge that there could be broader spillover to other areas of the economy, which in turn
could weigh on stock prices and have a lagging effect on the high-end shopper.
The beginning of June 2008 was the first time gas prices rose above $4 per gallon and energy-
related spending hit 6% of total US consumer outlays. Retail comps in the subsequent months did
indeed turn negative. However, we caution that there was a unique set of economic circumstances
in 2008 and that extrapolating same outcome to today, especially in light of more favorable data
points, would not really be applicable.
(See pages 47-50 for analyst coverage tables.)
John Morris BMO Capital Markets Corp. 212-359-4016

Financial GroupA member of BMO March 21, 2012
$5 Gas? BMO Capital Markets
36
Financial GroupA member of BMO March 21, 2012
$5 Gas? BMO Capital Markets
37
Food & Beverage
Higher gas prices would create a favorable operating environment for private label consumer
packaged goods (CPG) companies, particularly private label food manufacturers. Higher
household spending on gas (in terms of both absolute dollar amount and as a percent of total
household spending) would force consumers, particularly in the lower income cohort, to
reduce other expenses, including those on food. We believe that private label food
manufacturers, with their well-established appeal to value-conscious consumers, are well
positioned to benefit from likely changes in consumer behavior, leading to continued unit and
dollar share gains in the US packaged food segment. In fact, we estimate a negative 87%
correlation between household spending on food and gas (both expressed as percent of total
household spending) for households with annual income of less than $70,000 (see Exhibit 21).
On the other hand, food-related expenses for higher income households showed very little
impact from changes in gas prices as we estimate correlations of +9% and +10% for
households with average annual income of more than $70,000 and more than $100,000,
respectively, based on our analysis of household spending patterns over the last eight years.
The divergent consumer reaction, based on relative prosperity level, clearly signals that higher
gas prices would have a greater impact on food purchasing power and patterns of lower and
lower-middle income consumers, likely strengthening the ongoing trend of stronger private
label growth among value-oriented consumers and accelerating the shift to private label for
consumers on the fence.
Our investment conclusions are as follows:
We expect Ralcorp (RAH) and Treehouse Foods (THS), pure play private label
packaged food manufacturers, to continue to outgrow branded competitors in their key
categories, with 6%-8% organic top-line growth in 2012, including low-single-digit
volume growth. While private label performance varies across categories, our analysis of
75 of the top packaged food categories reveals the following trends, which support our
conclusion:
o Private label volumes have outperformed branded volumes in each of the past six
quad-weeks periods with an average decline of 0.6% compared with an average
decline of 5.9% for the top three brands in these categories;
o Price gaps between private label and top branded competitors have remained largely
stable at approximately 24%, which indicates that recent volume share gains are
sustainable (i.e., not driven by temporary widening of price gaps); and
o Private label share gains appear to be more pronounced in commoditized categories,
in which the consumer is more likely to focus on lower prices (i.e., relative to
value-added categories).
(See pages 47-50 for analyst coverage tables.)
Amit Sharma, CFA BMO Capital Markets Corp. 212-885-4132
Financial GroupA member of BMO March 21, 2012
$5 Gas? BMO Capital Markets
38
Dean Foods (DF), Flowers Foods (FLO), and Snyder’s-Lance (LNCE) face potential
margin pressure from increasing consumer focus on value and faster private label growth
in commoditized categories. DF, FLO, and LNCE derive approximately 45%, 16%, and
35% of their revenues from private label (including partner brands) products,
respectively, on which they generate significantly lower margins compared with their
branded portfolios. Given ongoing volume weakness in the fluid milk (DF) and fresh
bread (FLO) categories, faster private label growth will pressure branded sales in these
categories, leading to negative mix-shift and lower margins.
Hain Celestial (HAIN), Mead Johnson (MJN), and Smart Balance (SMBL) are well
positioned to largely offset an impact from higher gas prices, mainly owing to their
premium product portfolio and large exposure to higher income consumers, who are less
likely to change spending patterns in response to the higher gas prices. First, gas and
retail food purchases account for a relatively smaller portion of total household expenses
for higher income consumers (i.e., 3.3% and 6.0% for households with average annual
income of more than $100,000 compared with 5.1% and 8.9% for households making
less than $70,000, in 2010). Second, higher-income consumers tend to be more focused
on health and wellness (i.e., higher consumption of natural, organic, and better-for-you
products), which reduces their propensity to trade down within (or out of) the category in
response to relatively minor changes in their purchasing power.
Exhibit 21. Lower Income Households' Food Spending Shows Greater Impact From Higher Gas Prices
Average Income < $70,000
13.5%
13.7%
13.9%
14.1%
14.3%
14.5%
14.7%
20032004
20052006
20072008
20092010
Per
cent
of
Hou
seho
ld E
xpen
ses
- F
ood
3.0%
3.5%
4.0%
4.5%
5.0%
5.5%
6.0%
6.5%
Per
cent
of
Hou
seho
ld E
xpen
ses
- G
as
Retail Food Gas and Motor Oil
Correlation: -87%
Average Income > $70,000
11.0%
11.2%
11.4%
11.6%
11.8%
12.0%
12.2%
20032004
20052006
20072008
20092010
Per
cent
of
Hou
seho
ld E
xpen
ses
- F
ood
2.5%
3.0%
3.5%
4.0%
4.5%
5.0%
5.5%
6.0%
Per
cent
of
Hou
seho
ld E
xpen
ses
- G
as
Retail Food Gas and Motor Oil
Correlation: +9%
Average Income > $100,000
10.4%
10.6%
10.8%
11.0%
11.2%
11.4%
11.6%
20032004
20052006
20072008
20092010
Per
cent
of
Hou
seho
ld E
xpen
ses
- F
ood
2.0%
2.5%
3.0%
3.5%
4.0%
4.5%
5.0%
5.5%
Per
cent
of
Hou
seho
ld E
xpen
ses
- G
as
Retail Food Gas and Motor Oil
Correlation: +10%
Source: BLS, AAA, Bloomberg, and BMO Capital Markets.
(See pages 47-50 for analyst coverage tables.)
Financial GroupA member of BMO March 21, 2012
$5 Gas? BMO Capital Markets
39
Food Retailing
Within food retailing, the cumulative impact of an increase in gasoline prices to $5 per gallon
would be incrementally negative given the generally negative impact on the consumer, but
some companies will fare better than others. The exact impact on each company would
depend on the company’s competitive position, geographic exposure, and financial strength.
We believe materially higher gasoline prices would be incrementally positive for CASY and
SUSS because—counter-intuitively—while customers may place a cap on the dollars spent on
fuel per trip (e.g., a $20 “fill”), traffic actually increases because customers visit the store
more frequently for these $20 fills. CASY’s and SUSS’s strong prepared food offerings
generate industry-leading conversion ratios (percentage of customers visiting the store for gas
who also make an in-store purchase), and as a result, the higher fuel prices actually benefit
both of these retailers by driving stronger traffic inside the store in extremely high margin
categories. Additionally, both companies are geographically exposed to areas of the country
under indexing the national average gasoline price, so while prices are still up year over year
(the primary driver of traffic increases), the Midwest and Texas consumer is feeling less
constrained by higher gas prices versus consumers in other parts of the country. In addition,
both retailers are benefiting from the tailwind of extremely strong industries—oil and gas
(SUSS) and agriculture (CASY). Lastly, lower gas margins across the industry would hurt
weaker competitors and could accelerate consolidation and attrition throughout the industry,
and because CASY and SUSS remain in growth mode, they stand to gain from their
competitors’ financial challenges.
We see PTRY and SVU as the two most negatively impacted companies in our universe
should gasoline prices rise to $5 per gallon. Both companies have credibility issues with
consumers as it relates to pricing, and in an environment where consumers feel increasingly
pressured, we are not sure that either company has the financial flexibility to remain
competitive on pricing and turn around recent traffic losses. Separately, PTRY (vs. CASY and
SUSS) has more exposure to vacation destinations.
In general, all our companies would feel margin pressure as the cost of inbound/outbound
freight and distribution costs increase. Companies that sell fuel would experience lower gas
margins (since wholesale prices move more quickly than retail prices) and higher credit card
fees. We believe convenience stores with strong offerings inside the store and that do not rely
on fuel margins to sustain the business are best positioned to weather the storm, along with
food retailers that have the financial flexibility to remain competitive on pricing and tie their
loyalty programs to fuel sales.
(See pages 47-50 for analyst coverage tables.)
Karen Short BMO Capital Markets Corp. 212-885-4123

Financial GroupA member of BMO March 21, 2012
$5 Gas? BMO Capital Markets
40
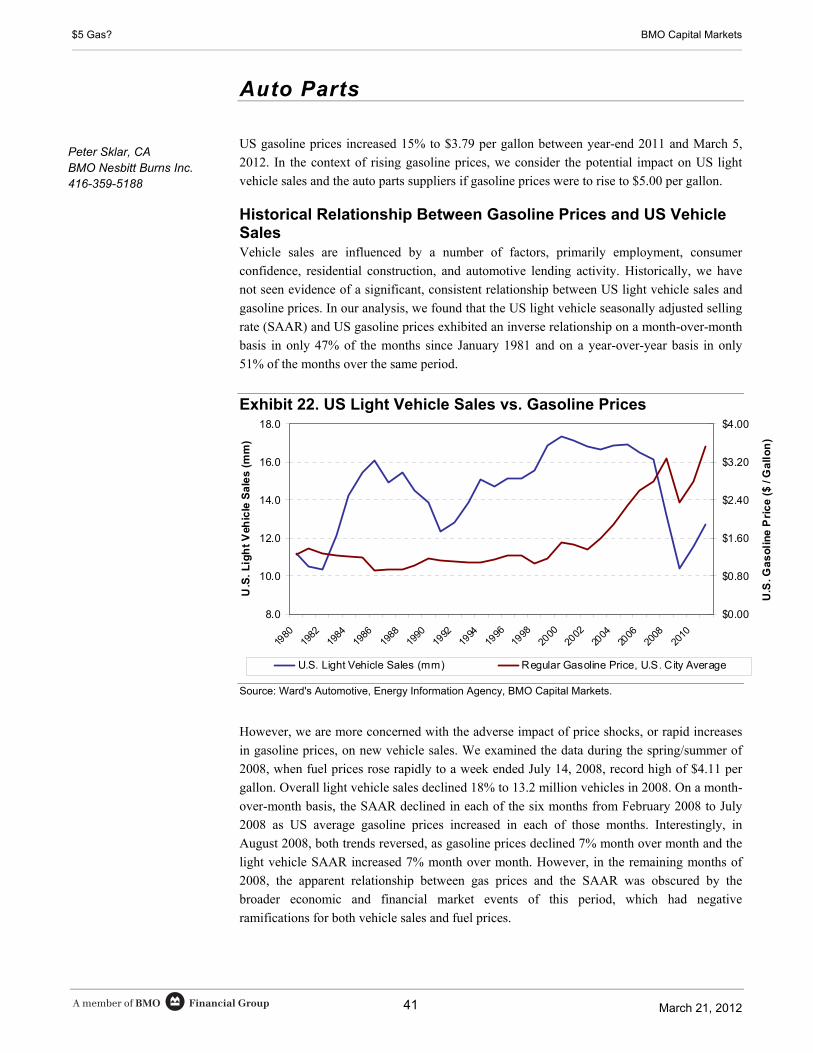
Financial GroupA member of BMO March 21, 2012
$5 Gas? BMO Capital Markets
41
Auto Parts
US gasoline prices increased 15% to $3.79 per gallon between year-end 2011 and March 5,
2012. In the context of rising gasoline prices, we consider the potential impact on US light
vehicle sales and the auto parts suppliers if gasoline prices were to rise to $5.00 per gallon.
Historical Relationship Between Gasoline Prices and US Vehicle Sales Vehicle sales are influenced by a number of factors, primarily employment, consumer
confidence, residential construction, and automotive lending activity. Historically, we have
not seen evidence of a significant, consistent relationship between US light vehicle sales and
gasoline prices. In our analysis, we found that the US light vehicle seasonally adjusted selling
rate (SAAR) and US gasoline prices exhibited an inverse relationship on a month-over-month
basis in only 47% of the months since January 1981 and on a year-over-year basis in only
51% of the months over the same period.
Exhibit 22. US Light Vehicle Sales vs. Gasoline Prices
8.0
10.0
12.0
14.0
16.0
18.0
1980
1982
1984
1986
1988
1990
1992
1994
1996
1998
2000
2002
2004
2006
2008
2010
U.S
. L
igh
t V
ehic
le S
ale
s (
mm
)
$0.00
$0.80
$1.60
$2.40
$3.20
$4.00
U.S
. Ga
so
lin
e P
ric
e ($
/ G
all
on
)
U.S. Light Vehicle Sales (mm) Regular Gasoline Price, U.S. C ity Average
Source: Ward's Automotive, Energy Information Agency, BMO Capital Markets.
However, we are more concerned with the adverse impact of price shocks, or rapid increases
in gasoline prices, on new vehicle sales. We examined the data during the spring/summer of
2008, when fuel prices rose rapidly to a week ended July 14, 2008, record high of $4.11 per
gallon. Overall light vehicle sales declined 18% to 13.2 million vehicles in 2008. On a month-
over-month basis, the SAAR declined in each of the six months from February 2008 to July
2008 as US average gasoline prices increased in each of those months. Interestingly, in
August 2008, both trends reversed, as gasoline prices declined 7% month over month and the
light vehicle SAAR increased 7% month over month. However, in the remaining months of
2008, the apparent relationship between gas prices and the SAAR was obscured by the
broader economic and financial market events of this period, which had negative
ramifications for both vehicle sales and fuel prices.
Peter Sklar, CA BMO Nesbitt Burns Inc. 416-359-5188
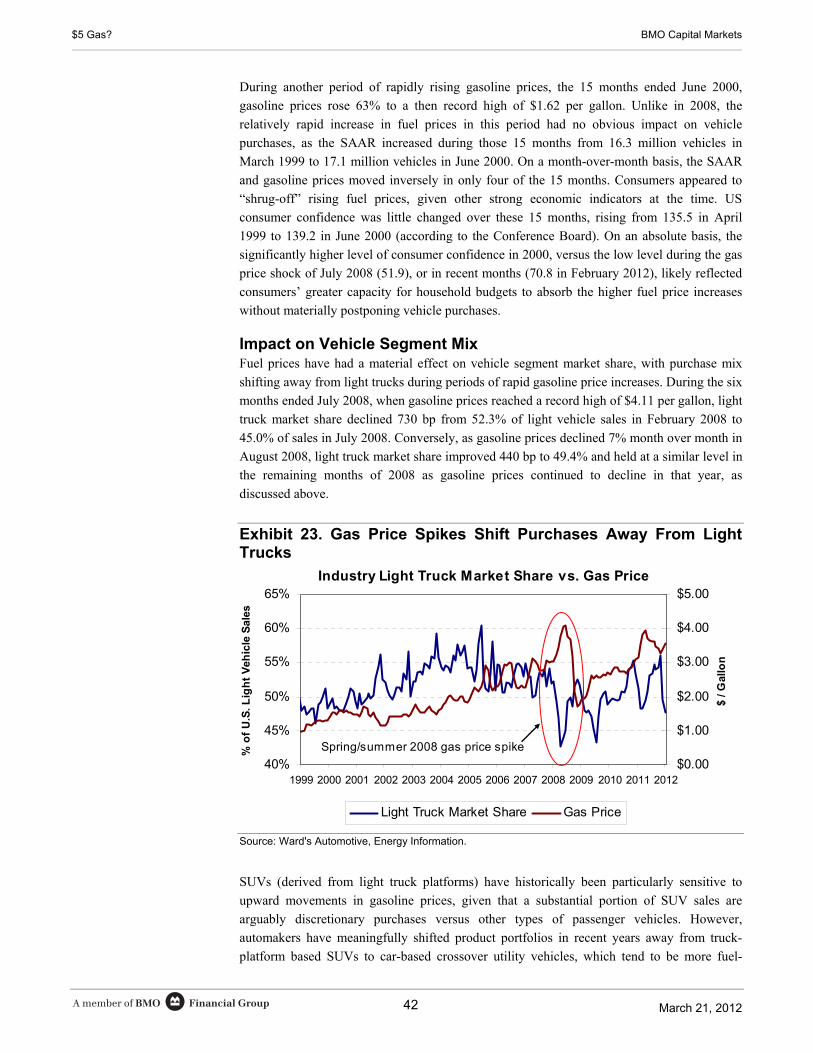
Financial GroupA member of BMO March 21, 2012
$5 Gas? BMO Capital Markets
42
During another period of rapidly rising gasoline prices, the 15 months ended June 2000,
gasoline prices rose 63% to a then record high of $1.62 per gallon. Unlike in 2008, the
relatively rapid increase in fuel prices in this period had no obvious impact on vehicle
purchases, as the SAAR increased during those 15 months from 16.3 million vehicles in
March 1999 to 17.1 million vehicles in June 2000. On a month-over-month basis, the SAAR
and gasoline prices moved inversely in only four of the 15 months. Consumers appeared to
“shrug-off” rising fuel prices, given other strong economic indicators at the time. US
consumer confidence was little changed over these 15 months, rising from 135.5 in April
1999 to 139.2 in June 2000 (according to the Conference Board). On an absolute basis, the
significantly higher level of consumer confidence in 2000, versus the low level during the gas
price shock of July 2008 (51.9), or in recent months (70.8 in February 2012), likely reflected
consumers’ greater capacity for household budgets to absorb the higher fuel price increases
without materially postponing vehicle purchases.
Impact on Vehicle Segment Mix Fuel prices have had a material effect on vehicle segment market share, with purchase mix
shifting away from light trucks during periods of rapid gasoline price increases. During the six
months ended July 2008, when gasoline prices reached a record high of $4.11 per gallon, light
truck market share declined 730 bp from 52.3% of light vehicle sales in February 2008 to
45.0% of sales in July 2008. Conversely, as gasoline prices declined 7% month over month in
August 2008, light truck market share improved 440 bp to 49.4% and held at a similar level in
the remaining months of 2008 as gasoline prices continued to decline in that year, as
discussed above.
Exhibit 23. Gas Price Spikes Shift Purchases Away From Light Trucks
Industry Light Truck Market Share vs. Gas Price
40%
45%
50%
55%
60%
65%
1999 2000 2001 2002 2003 2004 2005 2006 2007 2008 2009 2010 2011 2012
% o
f U
.S. L
igh
t V
ehic
le S
ales
$0.00
$1.00
$2.00
$3.00
$4.00
$5.00
$ / G
allo
n
Light Truck Market Share Gas Price
Spring/summer 2008 gas price spike
Source: Ward's Automotive, Energy Information.
SUVs (derived from light truck platforms) have historically been particularly sensitive to
upward movements in gasoline prices, given that a substantial portion of SUV sales are
arguably discretionary purchases versus other types of passenger vehicles. However,
automakers have meaningfully shifted product portfolios in recent years away from truck-
platform based SUVs to car-based crossover utility vehicles, which tend to be more fuel-
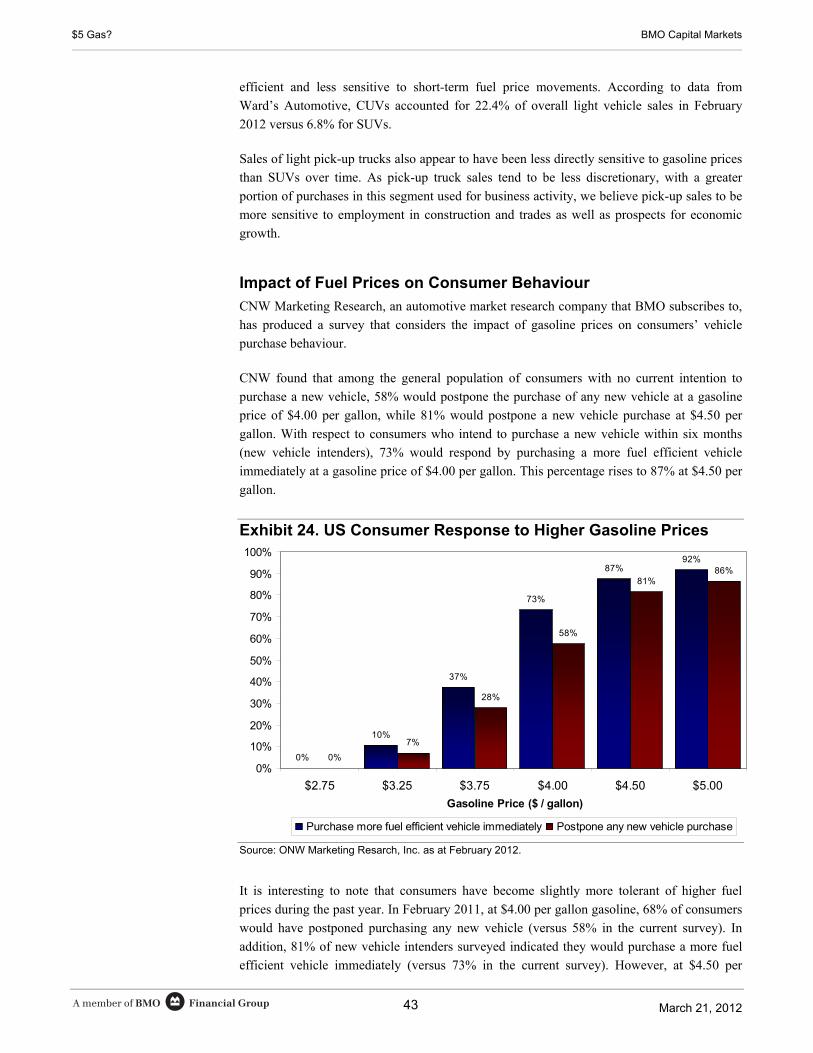
Financial GroupA member of BMO March 21, 2012
$5 Gas? BMO Capital Markets
43
efficient and less sensitive to short-term fuel price movements. According to data from
Ward’s Automotive, CUVs accounted for 22.4% of overall light vehicle sales in February
2012 versus 6.8% for SUVs.
Sales of light pick-up trucks also appear to have been less directly sensitive to gasoline prices
than SUVs over time. As pick-up truck sales tend to be less discretionary, with a greater
portion of purchases in this segment used for business activity, we believe pick-up sales to be
more sensitive to employment in construction and trades as well as prospects for economic
growth.
Impact of Fuel Prices on Consumer Behaviour
CNW Marketing Research, an automotive market research company that BMO subscribes to,
has produced a survey that considers the impact of gasoline prices on consumers’ vehicle
purchase behaviour.
CNW found that among the general population of consumers with no current intention to
purchase a new vehicle, 58% would postpone the purchase of any new vehicle at a gasoline
price of $4.00 per gallon, while 81% would postpone a new vehicle purchase at $4.50 per
gallon. With respect to consumers who intend to purchase a new vehicle within six months
(new vehicle intenders), 73% would respond by purchasing a more fuel efficient vehicle
immediately at a gasoline price of $4.00 per gallon. This percentage rises to 87% at $4.50 per
gallon.
Exhibit 24. US Consumer Response to Higher Gasoline Prices
0%
10%
37%
73%
87%92%
0%
7%
28%
58%
81%86%
0%
10%
20%
30%
40%
50%
60%
70%
80%
90%
100%
$2.75 $3.25 $3.75 $4.00 $4.50 $5.00
Gasoline Price ($ / gallon)
Purchase more fuel efficient vehicle immediately Postpone any new vehicle purchase
Source: ONW Marketing Resarch, Inc. as at February 2012.
It is interesting to note that consumers have become slightly more tolerant of higher fuel
prices during the past year. In February 2011, at $4.00 per gallon gasoline, 68% of consumers
would have postponed purchasing any new vehicle (versus 58% in the current survey). In
addition, 81% of new vehicle intenders surveyed indicated they would purchase a more fuel
efficient vehicle immediately (versus 73% in the current survey). However, at $4.50 per
Financial GroupA member of BMO March 21, 2012
$5 Gas? BMO Capital Markets
44
gallon gasoline, the survey results have not shifted materially, with the percentage of non
intenders who would postpone a purchase at 79% in February 2011 (versus 81% in the current
survey) and the percentage of current intenders who would respond by purchasing a more fuel
efficient vehicle at 85% (versus 87% in the current survey).
Overall, the market survey suggests that, during the last year, the inflection point has shifted
from $4.00 per gallon to $4.50, moderately above current levels. We believe that as the recent
increase in gasoline prices has been relatively gradual (up 8% year over year as at March 5,
versus up 35% year over year as at July 14, 2008, record high of $4.11 per gallon), consumer
behaviour and perception have adjusted to accommodate the current fuel price level.
Impact of $5.00 per Gallon Gasoline on Auto Parts Suppliers Some auto parts suppliers can be disproportionately exposed to the Detroit Three (Ford, GM,
and Chrysler), and in the past, a shift toward more fuel efficient vehicles has negatively
impacted Detroit Three market share. However, the Detroit Three have meaningfully
improved their portfolios of small and more fuel efficient vehicles, and we are less concerned
about the impact of rising fuel prices than we were a few years ago. For example, Detroit
Three market share was up 100 bp in February 2012 despite rising gasoline prices.
The greater concern for all suppliers is the potential of higher gasoline prices to derail the
recovery in new vehicle sales, as consumers begin to defer new vehicle purchases. The strong
SAAR in recent months suggests that consumers are not yet postponing new vehicle
purchases. However, market research suggests that the potential for new purchase deferrals
increases significantly above $4.50 per gallon. A lower SAAR would quickly dampen vehicle
production and negatively impact the earnings outlook of the auto parts suppliers. However,
the magnitude of this impact is somewhat ambiguous, as consumers have shown in the past an
ability to adapt to higher fuel prices without necessarily deferring new purchases.
Conclusion Overall, the impact of $5.00 per gallon gasoline would depend on the pace at which prices
rise to this level. A gradual rise to $5.00 per gallon gasoline would represent only a mild
negative for the auto parts sector. Total US automotive sales have shown little direct
relationship with fuel prices over the long term, as vehicle purchases are influenced by a
number of factors, including employment, consumer confidence, automotive lending activity,
and the replacement cycle for aged vehicles. In addition, consumers are generally able to find
room in their wallets to accommodate higher fuel prices over time.
An increase in fuel prices would likely accelerate the existing trend in light vehicle mix away
from light trucks toward more fuel-efficient small cars and crossovers. Historically, a shift
toward fuel efficient vehicles has been negative for market share of the Detroit Three OEMs
(Ford, GM, and Chrysler). However, the Detroit Three have meaningfully improved their
portfolios of small and more fuel efficient vehicles.
Of greater concern, a rapid rise in the price of gasoline to the $5.00 per gallon price level
could be a “shock” to consumers, causing them to postpone new vehicle purchases. This
would cause OEMs to quickly reduce production, with a meaningful short-term earnings
impact on the auto parts suppliers.
Financial GroupA member of BMO March 21, 2012
$5 Gas? BMO Capital Markets
45
Food & Ag Products
We analyzed the performance of food stocks—the agribusiness, packaged food, and protein
sectors—during periods of rising oil and gas prices including 1) four periods of geopolitically-
induced increases (e.g., the 1973 OPEC oil embargo, the 1979 Iranian Revolution, the 1990
Gulf War, and the period of unrest in the Middle East and North Africa from December 2010
to April 2011); and 2) one extended period of demand driven price increases between January
2002 and July 2008.
Our investment conclusions are as follows:
Agribusiness likely will outperform the S&P 500 by the greatest magnitude in a rising oil
and gas price environment reflecting higher end-product prices, increased demand for
alternative fuels (e.g., biodiesel and ethanol), and potential dislocation opportunities.
Specifically, sustained price increases for oil have typically resulted in higher prices for
retail gasoline (i.e., gas and oil prices are 90+% correlated) and have accelerated the
economic feasibility of renewable fuels, creating increased demand for grain and oil
seeds, thereby creating dislocation opportunities. Agribusiness stocks realized the
greatest outperformance among the consumer group during the periods of rising oil prices
we analyzed, as they outperformed the S&P 500 by an average of 24%. Specifically, in
the four periods of geopolitically driven spikes in oil prices, agribusiness stocks returned
an average of 20%, while the S&P 500 declined 5%. Moreover, during the steady rise in
oil prices from January 2002 through July 2008, agribusiness stocks returned an average
of 17%, which beat the 1% average return of the S&P 500.
We believe that ADM (rated Outperform), DAR (rated Outperform), and BG (rated
Market Perform) are the best ways to invest in agribusiness in a rising gas and oil
environment. First, ADM and BG would benefit from the increased demand for
alternative fuels (e.g., ethanol, vegetable oil, biodiesel), as well as potential dislocation
opportunities created by increased demand and tightening grain and oil seed supplies.
Most notably, ADM’s US ethanol business would get an additional boost, as ethanol
prices likely would surge along with gasoline prices (i.e., high correlation between
gasoline and ethanol). ADM has the capacity to produce 1.75 billion gallons of ethanol
annually. Second, DAR’s rendering product prices and Diamond Green Diesel JV likely
would materially benefit from higher commodity prices (i.e., greater demand for
alternative fuels, higher end-product prices including yellow grease, tallow, and B-100
prices) reflecting a tightening of grain and oil seed supply driven by continued global bio-
fuel demand. Moreover, DAR’s renewable diesel JV likely would benefit reflecting the
90% correlation between gas and B-100 prices.
(See pages 47-50 for analyst coverage tables.)
Ken Zaslow, CFA BMO Capital Markets Corp. 212-885-4017
Financial GroupA member of BMO March 21, 2012
$5 Gas? BMO Capital Markets
46
US packaged food stocks should outperform—albeit less than Agribusiness—the S&P
500 during a period of rising oil and gas prices, reflecting the defensive nature of the US
packaged food industry. Specifically, packaged food companies would benefit from
increased in-home dining, which is perceived as a value proposition relative to
foodservice. Packaged food companies, particularly those with strong brands, pricing
power, and a steady pipeline of new products, modestly outperformed the S&P 500 by
one percentage point during the periods of rising oil and gas prices that we analyzed.
Kellogg (K, rated Market Perform) was the best performer from the packaged food
group during periods of rising oil prices as it outperformed the market in seven of the
nine periods analyzed, returning an average of 5% relative to a 1% decline and flat
performance by the S&P 500 and packaged food group, respectively. In addition, HRL
outperformed the market in seven of the nine periods of increasing oil prices,
outperforming the S&P 500 by an average of 10 points in periods of geopolitically driven
oil spikes, and by an average of 1 point during the long run-up in oil from 2002 to 2008.
First, KFT’s (rated Outperform) outperformance in a period of rising gas prices likely
would be fueled by 1) ongoing strong new product innovation and consistent marketing
support; 2) the broad appeal of KFT’s products to consumers given its wide range of
price points across its product portfolio; and 3) the relatively strong dividend, which
likely will become even apparent with the spinoff of its North American Grocery
division. Second, HRL (rated Market Perform) likely would outperform during a period
of higher gas prices, as it has developed a portfolio that generates above-industry growth
under a wide range of economic (i.e., from SPAM to foodservice) and commodity
environments.
Performance in the protein sector would likely be mixed as it would be more dependent
on protein fundamentals than gas prices. Although protein stocks as a group
outperformed the market during periods of rising oil and gas prices, the sector’s
performance likely will be linked more closely with cyclical industry fundamentals, such
as exports, supply/availability (i.e., production cuts), and domestic consumption. That
said, the higher gasoline prices would correlate to higher feed costs, which would temper
production margins in chicken and hogs.
(See pages 47-50 for analyst coverage tables.)
Financial GroupA member of BMO March 21, 2012
$5 Gas? BMO Capital Markets
47
Coverage Tables for Participating Analysts
Industrials - Transportation: Rails
Industry Rating: Outperform
Fadi Chamoun, CFA (416) 359-6775
Mrkt Curr Last3/19/12 Price Cap Rev EBITDA FY Rep'd EV/ Div.
Company Name (Ticker/Rating) Price Target ($mm) ($mm) FCF ($mm) End Qtr Nxt Qtr* Our Est Cons Yr Ago Last Yr This Yr Nxt Yr This Yr Nxt Yr CurrYr Nxt Yr EBITDA Yld.Canadian Pacific Railway (CP/Mkt) $77.62 $76 $13,257 $5,602 $8.30 $1,819 12/12 4Q11 1Q12 $0.69 $0.62 $0.20 $3.12 $4.47 $5.44 17.4x 14.3x 9.4x 7.8x 9.9x 1.5%CN Railway (CNR/Mkt) $78.99 $78 $34,921 $9,668 $7.85 $4,414 12/12 4Q11 1Q12 $1.01 $1.01 $0.90 $4.84 $5.28 $5.96 15.0x 13.3x 10.062 9.1x 9.3x 1.9%CSX (CSX/OP) $22.07 $27 $23,306 $12,066 $3.19 $4,550 12/12 4Q11 1Q12 $0.39 $0.38 $0.35 $1.67 $1.79 $2.01 12.3x 11.0x 6.9185 6.3x 6.9x 2.2%Kansas City Southern (KSU/Mkt) $73.69 $66 $8,099 $2,338 $6.76 $900 12/12 4Q11 1Q12 $0.73 $0.73 $0.58 $2.86 $3.50 $4.03 21.1x 18.3x 10.901 10.0x 10.7x --Norfolk Southern (NSC/OP) $68.30 $83 $23,126 $11,472 $9.55 $4,267 12/12 4Q11 1Q12 $1.07 $1.14 $0.90 $5.27 $5.62 $6.25 12.2x 10.9x 7.1518 6.5x 7.1x 2.8%Union Pacific (UNP/OP) $113.01 $125 $54,776 $21,277 $13.71 $8,529 12/12 4Q11 1Q12 $1.75 $1.63 $1.29 $6.72 $8.27 $9.51 13.7x 11.9x 8.2429 7.4x 7.3x 2.1%Westshore Terminals (WTE.UN/Mkt) $24.40 $22 $1,813 $202 $1.36 $101 12/11 3Q11 4Q11 $0.12 $0.12 $0.29 ($0.07) $0.52 $0.73 46.9x 33.4x 17.941 17.7x 20.9x 4.8%
Current Year Quarterly AnnualEPS EPS** P/E P/FCF
Industrials - Transportation:Trucking & Logistics
Industry Rating: Market Perform
Jason Granger, CA, CFA (416) 359-4293
Mrkt Curr Last3/19/12 Price Cap Rev EBITDA FY Rep'd EV/ Div.
Company Name (Ticker/Rating) Price Target ($mm) ($mm) CF ($mm) End Qtr Nxt Qtr* Our Est Cons Yr Ago Last Yr This Yr Nxt Yr This Yr Nxt Yr CurrYr Nxt Yr EBITDA Yld.Contrans Group (CSS/OP) $9.10 $10.00 $321 $494 $1.59 $64 12/12 4Q11 1Q12 $0.10 $0.13 $0.10 $0.58 $0.67 $0.77 13.6x 11.8x 5.7x 5.3x 6.1x 4.4%Con-way (CNW/Mkt) $34.29 $32.00 $1,927 $5,729 $6.03 $451 12/12 4Q11 1Q12 $0.27 $0.33 $0.24 $1.53 $2.01 $2.45 17.1x 14.0x 5.7x 5.5x 5.1x 1.2%J.B. Hunt Transport Services (JBHT/Mkt) $54.34 $53.00 $6,488 $5,143 $4.79 $767 12/12 4Q11 1Q12 $0.53 $0.51 $0.40 $2.11 $2.56 $2.87 21.2x 18.9x 11.3x 10.3x 9.4x 1.0%Mullen Group (MTL/Mkt) $21.33 $22.50 $1,945 $1,448 $2.63 $305 12/12 4Q11 1Q12 $0.51 $0.53 $0.43 $1.57 $1.67 $1.79 12.8x 11.9x 8.1x 7.7x 7.5x 4.7%TransForce (TFI/OP) $17.15 $21.00 $1,640 $3,260 $3.02 $396 12/12 4Q11 1Q12 $0.17 $0.24 $0.12 $1.06 $1.51 $1.78 11.4x 9.6x 5.7x 5.3x 6.4x 2.7%Trimac (TMA/Mkt) $4.69 $5.00 $121 $369 $1.23 $42 12/12 4Q11 1Q12 $0.02 $0.03 $0.03 $0.43 $0.39 $0.40 12.0x 11.7x 3.8x 3.6x 4.6x 5.3%Vitran (VTNC/Mkt) $8.45 $8.50 $138 $873 $1.33 $27 12/12 4Q11 1Q12 ($0.17) ($0.16) $0.02 ($0.20) $0.27 $0.85 31.3x 9.9x 6.4x 4.3x 7.9x --
Current Year Quarterly AnnualEPS EPS** P/E P/CF
Consumer - Broadline Retail
Industry Rating: Market Perform
Wayne Hood 404-926-1590
Mrkt Curr Last3/19/12 Price Cap Rev EBITDA FY Rep'd EV/ Div.
Company Name (Ticker/Rating) Price Target ($mm) ($mm) FCF ($mm) End Qtr Nxt Qtr* Our Est Cons Yr Ago Last Yr This Yr Nxt Yr This Yr Nxt Yr CurrYr Nxt Yr EBITDA Yld.Canadian Tire (CTCA/Mkt) $64.41 $73 $5,025 $11,572 $7.75 $1,193 1/13 4Q11 1Q12 $0.85 na $0.75 $5.71 $6.21 na 10.4x na 8.3x 7.9x 7.8x 1.9%Costco Wholesale (COST/Und) $90.02 $55 $39,152 $95,510 $3.25 $3,264 8/12 2Q12 3Q12 $0.86 $0.87 $0.73 $3.30 $3.77 $4.40 23.9x 20.5x 27.7x 22.4x 11.7x 1.1%Dollar General (DG/OP) $44.75 $47 $15,096 $14,789 $1.25 $1,755 1/13 3Q11 4Q11 $0.81 na $0.65 $1.88 $2.31 $2.68 19.4x 16.7x 35.8x 21.6x 9.7x --Dollar Tree (DLTR/OP) $93.69 $95 $11,151 $7,395 $3.38 $1,065 1/13 4Q11 1Q12 $0.96 na $0.82 $4.03 $4.83 $5.63 19.4x 16.6x 27.7x 22.9x 10.5x --Family Dollar (FDO/Mkt) $56.41 $56 $6,643 $9,308 $0.69 $900 8/12 1Q12 2Q12 $1.14 $1.13 $0.98 $3.12 $3.60 $4.06 15.7x 13.9x 81.8x 152.5x 7.8x 1.3%Home Depot (HD/Mkt) $48.83 $51 $75,275 $74,183 $2.54 $9,021 1/13 4Q11 1Q12 $0.61 $0.61 $0.50 $2.47 $2.89 $3.19 16.9x 15.3x 19.2x 28.6x 9.3x 2.4%J.C. Penney (JCP/Und) $36.22 $29 $7,735 $16,512 $0.61 $1,329 1/13 4Q11 1Q12 $0.28 $0.02 $0.28 $1.31 $1.66 $2.30 21.8x 15.7x 59.4x 20.7x 6.2x 2.2%Kohl's (KSS/OP) $48.72 $64 $12,347 $19,561 $5.46 $2,977 1/13 4Q11 1Q12 $0.61 $0.61 $0.69 $4.30 $4.86 $5.64 10.0x 8.6x 8.9x 7.6x 4.6x 2.1%Lowe's (LOW/Mkt) $30.53 $27 $38,241 $20,733 $2.55 $5,323 1/13 4Q11 1Q12 $0.38 $0.39 $0.34 $1.43 $1.80 $2.27 17.0x 13.4x 12.0x 9.5x 8.3x 1.8%Macy's (M/Mkt) $39.62 $41 $16,633 $27,851 $3.72 $3,733 1/13 4Q11 1Q12 $0.38 $0.37 $0.30 $2.88 $3.42 $3.93 11.6x 10.1x 10.7x 9.4x 5.8x 2.0%Nordstrom (JWN/Mkt) $54.37 $58 $11,386 $11,963 $2.29 $1,721 1/13 4Q11 1Q12 $0.75 $0.73 $0.65 $3.14 $3.44 $3.88 15.8x 14.0x 23.7x 28.5x 7.6x 2.0%RONA (RON/Mkt) $9.20 $11 $1,170 $4,740 $0.65 $269 12/12 3Q11 4Q11 $0.15 na $0.17 $1.09 $0.67 $0.77 13.7x 11.9x 14.2x 16.4x 5.8x 1.5%Target (TGT/OP) $58.37 $65 $39,067 $73,934 $3.87 $7,287 1/13 4Q11 1Q12 $1.01 $0.96 $0.99 $4.28 $4.26 $4.78 13.7x 12.2x 15.1x 10.0x 7.3x 2.1%Tractor Supply (TSCO/Mkt) $86.32 $83 $6,156 $4,683 $2.53 $492 12/12 4Q11 1Q12 $0.30 $0.31 $0.24 $3.01 $3.51 $4.13 24.6x 20.9x 34.1x 30.0x 12.0x 0.6%Walmart (WMT/Mkt) $60.74 $60 $208,016 $462,904 $3.42 $35,729 1/13 4Q11 1Q12 $1.05 $1.04 $0.98 $4.54 $4.90 $5.39 12.4x 11.3x 17.8x 15.8x 7.0x 2.4%
EPS EPS** P/E P/FCFCurrent Year Quarterly Annual
Consumer - Toys & Juvenile
Industry Rating: Market Perform
Gerrick L. Johnson, CMT 212-883-5192
Mrkt Curr Last3/19/12 Price Cap Rev EBITDA FY Rep'd EV/ Div.
Company Name (Ticker/Rating) Price Target ($mm) ($mm) FCF ($mm) End Qtr Nxt Qtr* Our Est Cons Yr Ago Last Yr This Yr Nxt Yr This Yr Nxt Yr CurrYr Nxt Yr EBITDA Yld.Build-A-Bear Workshop (BBW/Mkt) $5.56 $5 $97 $393 $0.50 $30 12/12 4Q11 1Q12 ($0.10) ($0.10) ($0.12) ($0.13) $0.25 $0.30 22.2x 18.5x 11.1x nm 1.7x --Carter's (CRI/Mkt) $48.04 $45 $2,829 $2,334 $0.32 $265 12/12 4Q11 1Q12 $0.41 $0.41 $0.55 $2.06 $2.55 $3.20 18.8x 15.0x 150.1x 33.1x 10.7x --Hasbro (HAS/Mkt) $36.35 $34 $4,676 $4,167 $2.86 $743 12/12 4Q11 1Q12 $0.12 $0.08 $0.12 $2.74 $2.90 $3.00 12.5x 12.1x 12.7x 11.7x 7.5x 4.0%JAKKS Pacific (JAKK/Mkt) $16.72 $15 $434 $720 $0.45 $69 12/12 4Q11 1Q12 ($0.59) ($0.61) ($0.35) $0.39 $1.00 $1.15 16.7x 14.5x 37.2x 25.3x 4.3x 2.4%LeapFrog (LF/OP) $7.67 $8 $568 $509 $0.43 $49 12/12 4Q11 1Q12 ($0.26) ($0.26) ($0.34) $0.30 $0.50 $0.70 15.3x 11.0x 17.8x 11.4x 8.6x --Mattel (MAT/OP) $33.53 $38 $11,367 $6,700 $2.20 $1,338 12/12 4Q11 1Q12 $0.06 $0.07 $0.05 $2.18 $2.50 $2.90 13.4x 11.6x 15.2x 13.6x 8.7x 2.7%Mega Brands (MB/Mkt) $6.65 $7 $109 $390 $0.40 $45 12/12 4Q11 1Q12 ($0.58) ($0.61) ($0.57) $0.45 $0.65 $0.75 10.2x 8.9x 16.6x 20.2x 5.9x --
EPS EPS** P/E P/FCFCurrent Year Quarterly Annual
Financial GroupA member of BMO March 21, 2012
$5 Gas? BMO Capital Markets
48
Consumer - Leisure
Industry Rating: Market Perform
Gerrick L. Johnson, CMT 212-883-5192
Mrkt Curr Last3/19/12 Price Cap Rev EBITDA FY Rep'd EV/ Div.
Company Name (Ticker/Rating) Price Target ($mm) ($mm) FCF ($mm) End Qtr Nxt Qtr* Our Est Cons Yr Ago Last Yr This Yr Nxt Yr This Yr Nxt Yr CurrYr Nxt Yr EBITDA Yld.Brunswick (BC/Mkt) $26.16 $20 $2,333 $3,877 $0.36 $329 12/12 4Q11 1Q12 $0.37 $0.37 $0.35 $1.17 $1.45 $1.75 18.0x 14.9x 72.7x 25.6x 7.9x 0.2%Deer Consumer Products (DEER/Mkt(S)) $3.40 $6 $114 $225 $0.31 $49 12/12 3Q11 4Q11 $0.36 $0.36 $0.33 $0.90 $1.15 $1.30 3.0x 2.6x 11.0x 9.4x -0.5x 5.9%Harley-Davidson (HOG/OP) $49.50 $60 $11,410 $5,082 $3.16 $1,321 12/12 4Q11 1Q12 $0.68 $0.71 $0.51 $2.14 $2.85 $3.50 17.4x 14.1x 15.7x 11.0x 11.5x 1.3%Polaris Industries (PII/OP) $66.97 $75 $4,586 $2,965 $3.68 $504 12/12 4Q11 1Q12 $0.75 $0.77 $0.67 $3.20 $3.90 $4.75 17.2x 14.1x 18.2x 15.9x 8.7x 1.3%
EPS EPS** P/E P/FCFCurrent Year Quarterly Annual
Consumer - Restaurants
Industry Rating: Market Perform
Phillip Juhan, CFA 404-926-1599
Mrkt Curr Last3/19/12 Price Cap Rev EBITDA FY Rep'd EV/ Div.
Company Name (Ticker/Rating) Price Target ($mm) ($mm) FCF ($mm) End Qtr Nxt Qtr* Our Est Cons Yr Ago Last Yr This Yr Nxt Yr This Yr Nxt Yr CurrYr Nxt Yr EBITDA Yld.BJ's Restaurants (BJRI/Mkt) $48.39 $58 $1,351 $715 $0.45 $91 12/12 4Q11 1Q12 $0.31 $0.31 $0.25 $1.12 $1.32 $1.60 36.7x 30.2x 107.5x 62.0x 14.4x --Chipotle Mexican Grill (CMG/Mkt) $413.92 $400 $12,940 $2,721 $7.56 $532 12/12 4Q11 1Q12 $2.00 $1.91 $1.44 $6.79 $8.70 $11.00 47.6x 37.6x 54.8x 42.7x 23.5x --Darden Restaurants (DRI/Mkt) $52.54 $57 $6,748 $8,066 $2.47 $1,089 5/12 2Q12 3Q12 $1.25 $1.24 $1.08 $3.41 $3.60 $4.15 14.6x 12.7x 21.3x 17.0x 7.8x 3.3%McDonald's (MCD/Mkt) $97.73 $107 $99,543 $28,630 $4.52 $10,557 12/12 4Q11 1Q12 $1.23 $1.23 $1.15 $5.27 $5.73 $6.35 17.1x 15.4x 21.6x 19.1x 10.4x 2.9%Panera Bread Company (PNRA/OP) $161.25 $175 $4,900 $2,105 $6.85 $355 12/12 4Q11 1Q12 $1.34 $1.34 $1.09 $4.65 $5.54 $6.57 29.1x 24.5x 23.5x 20.4x 13.3x --Red Robin Gourmet Burgers (RRGB/OP) $37.81 $50 $552 $989 $3.02 $101 12/12 4Q11 1Q12 $0.68 $0.66 $0.58 $1.58 $1.88 $2.06 20.1x 18.4x 12.5x 12.6x 6.7x --Starbucks (SBUX/OP) $53.55 $60 $40,345 $13,351 $1.67 $2,622 9/12 1Q12 2Q12 $0.38 $0.39 $0.34 $1.52 $1.85 $2.29 28.9x 23.4x 32.1x 25.3x 14.8x 1.3%Texas Roadhouse (TXRH/OP) $16.83 $20 $1,166 $1,262 $0.80 $147 12/12 4Q11 1Q12 $0.29 $0.30 $0.27 $0.88 $0.93 $1.08 18.1x 15.6x 21.0x 17.5x 7.9x 1.9%Wendy's (WEN/Mkt) $5.03 $6 $1,961 $2,523 $0.08 $339 12/12 4Q11 1Q12 $0.03 $0.03 $0.02 $0.15 $0.18 $0.23 27.9x 21.9x 62.9x 50.3x na 1.6%
EPS EPS** P/E P/FCFCurrent Year Quarterly Annual
Media/Entertainment-Entertainment
Industry Rating: Outperform
Jeffrey B. Logsdon 213-228-2234
Mrkt Curr Last3/19/12 Price Cap Rev EBITDA FY Rep'd EV/ Div.
Company Name (Ticker/Rating) Price Target ($mm) ($mm) FCF ($mm) End Qtr Nxt Qtr* Our Est Cons Yr Ago Last Yr This Yr Nxt Yr This Yr Nxt Yr CurrYr Nxt Yr EBITDA Yld.Carmike Cinemas (CKEC/Mkt) $12.07 $10 $157 $516 $2.14 $78 12/12 4Q11 1Q12 ($0.25) ($0.21) ($1.44) ($0.60) $0.74 $0.96 16.3x 12.6x 5.6x 5.0x 5.9x --Cinemark Holdings (CNK/OP) $22.08 $29 $2,522 $2,429 $0.40 $558 12/12 4Q11 1Q12 $0.28 $0.26 $0.22 $1.25 $1.57 $1.74 14.1x 12.7x 55.2x 14.2x 6.4x 3.8%Cineplex (CGX/OP) $28.41 $30 $1,659 $1,086 $1.82 $210 12/12 4Q11 1Q12 $0.10 $0.82 ($0.01) $0.85 $1.32 $1.57 21.5x 18.1x 15.6x 13.5x 8.6x 4.5%DreamWorks Animation (DWA/OP) $18.83 $23 $1,597 $696 $0.76 $131 12/12 4Q11 1Q12 $0.14 $0.11 $0.10 $1.02 $1.00 $1.10 18.8x 17.1x 24.8x 21.6x 11.3x --Lions Gate Entertainment (LGF/Mkt) $14.25 $14 $2,044 $1,395 ($0.08) $69 3/12 3Q12 4Q12 $0.07 $0.16 $0.34 ($0.41) ($0.03) $1.16 nm 12.3x nm 15.7x 41.7x --News Corp (NWSA/Mkt) $20.12 $19 $50,602 $34,840 $1.40 $6,950 6/12 2Q12 3Q12 $0.31 $0.31 $0.26 $1.18 $1.40 $1.61 14.4x 12.5x 14.4x 13.2x 8.1x 0.9%RealD (RLD/OP) $12.09 $15 $659 $253 ($0.44) $89 3/12 3Q12 4Q12 ($0.06) ($0.08) $0.08 ($0.29) $0.49 $0.37 24.7x 32.7x nm nm 7.3x --Regal Entertainment Group (RGC/OP) $14.00 $19 $2,166 $2,891 $1.97 $525 12/12 4Q11 1Q12 $0.04 $0.07 ($0.04) $0.48 $0.66 $0.75 21.2x 18.7x 7.1x 6.9x 7.5x 6.0%Time Warner (TWX/OP) $35.94 $46 $36,335 $29,825 $3.06 $7,089 12/12 4Q11 1Q12 $0.64 $0.65 $0.58 $2.89 $3.20 $3.55 11.2x 10.1x 11.7x 10.6x 7.4x 2.6%Viacom (VIAB/OP) $48.46 $59 $27,002 $15,212 $4.35 $4,270 9/12 1Q12 2Q12 $0.88 na $0.72 $3.78 $4.34 $5.00 11.2x 9.7x 11.1x 10.1x 7.9x 2.1%Walt Disney (DIS/OP) $43.44 $53 $77,860 $42,335 $1.79 $11,140 9/12 1Q12 2Q12 $0.56 $0.61 $0.49 $2.54 $2.99 $3.48 14.5x 12.5x 24.3x 13.3x 7.9x 1.4%
Current Year Quarterly AnnualEPS EPS** P/E P/FCF
Consumer - Personal Care and Household Products
Industry Rating: Market Perform
Connie M. Maneaty 212-885-4004
Mrkt Curr Last3/19/12 Price Cap Rev EBITDA FY Rep'd EV/ Div.
Company Name (Ticker/Rating) Price Target ($mm) ($mm) FCF ($mm) End Qtr Nxt Qtr* Our Est Cons Yr Ago Last Yr This Yr Nxt Yr This Yr Nxt Yr CurrYr Nxt Yr EBITDA Yld.Avon (AVP/OP) $18.96 $24 $8,171 $10,739 ($0.19) $1,304 12/12 4Q11 1Q12 $0.26 $0.28 $0.37 $1.64 $1.45 $1.85 13.1x 10.2x nm 46.2x 7.8x 4.9%Church & Dwight (CHD/Mkt) $48.65 $50 $6,928 $2,841 $1.87 $650 12/12 4Q11 1Q12 $0.58 $0.61 $0.58 $2.21 $2.43 $2.64 20.0x 18.4x 26.0x 24.1x 10.7x 1.4%Clorox (CLX/Mkt) $67.84 $70 $8,806 $5,438 $1.71 $1,077 6/12 2Q12 3Q12 $1.00 $1.03 $1.02 $3.93 $4.05 $4.40 16.8x 15.4x 39.7x 27.6x 10.6x 3.5%Colgate Palmolive (CL/Mkt) $95.37 $90 $45,737 $17,218 $2.29 $4,312 12/12 4Q11 1Q12 $1.26 $1.24 $1.16 $5.03 $5.30 $5.85 18.0x 16.3x 41.6x 39.6x 11.5x 2.4%Elizabeth Arden (RDEN/Mkt) $35.20 $41 $1,031 $1,250 $3.52 $133 6/12 2Q12 3Q12 $0.04 $0.04 $0.02 $1.58 $2.01 $2.38 17.5x 14.8x 10.0x 10.5x 9.2x --Energizer Holdings (ENR/Mkt) $76.35 $79 $4,990 $4,550 $6.70 $886 9/12 1Q12 2Q12 $0.93 $1.10 $1.04 $5.20 $6.08 $6.84 12.6x 11.2x 11.4x 10.1x 7.9x --Estee Lauder (EL/OP) $62.83 $69 $14,822 $9,599 $2.09 $1,639 6/12 2Q12 3Q12 $0.32 $0.33 $0.35 $1.85 $2.21 $2.61 28.4x 24.1x 30.1x 35.5x 9.2x 0.8%Kimberly-Clark (KMB/Mkt) $73.01 $76 $28,743 $20,963 $1.46 $3,921 12/12 4Q11 1Q12 $1.18 $1.17 $1.09 $4.80 $5.16 $5.45 14.1x 13.4x 50.0x 50.4x 8.8x 4.1%Newell Rubbermaid (NWL/OP) $18.30 $21 $5,278 $5,925 $0.95 $881 12/12 4Q11 1Q12 $0.29 $0.31 $0.30 $1.60 $1.66 $1.80 11.0x 10.2x 19.3x 13.8x 8.3x 1.7%Procter & Gamble (PG/OP) $67.21 $78 $185,123 $85,667 $1.36 $18,895 6/12 2Q12 3Q12 $0.90 $0.94 $0.94 $3.88 $3.93 $4.20 17.1x 16.0x 49.4x 44.5x 11.3x 3.1%Revlon (REV/OP) $16.80 $19 $824 $1,384 $1.68 $268 12/12 4Q11 1Q12 $0.20 $0.20 $0.20 $1.26 $1.42 $1.61 11.8x 10.4x 10.0x 9.4x 7.3x --Scotts Miracle-Gro (SMG/Und) $52.90 $40 $3,218 $3,011 $2.36 $394 9/12 1Q12 2Q12 $1.91 $2.03 $2.22 $2.76 $2.69 $3.13 19.7x 16.9x 22.4x 23.7x 10.5x 2.3%
EPS EPS** P/E P/FCFCurrent Year Quarterly Annual
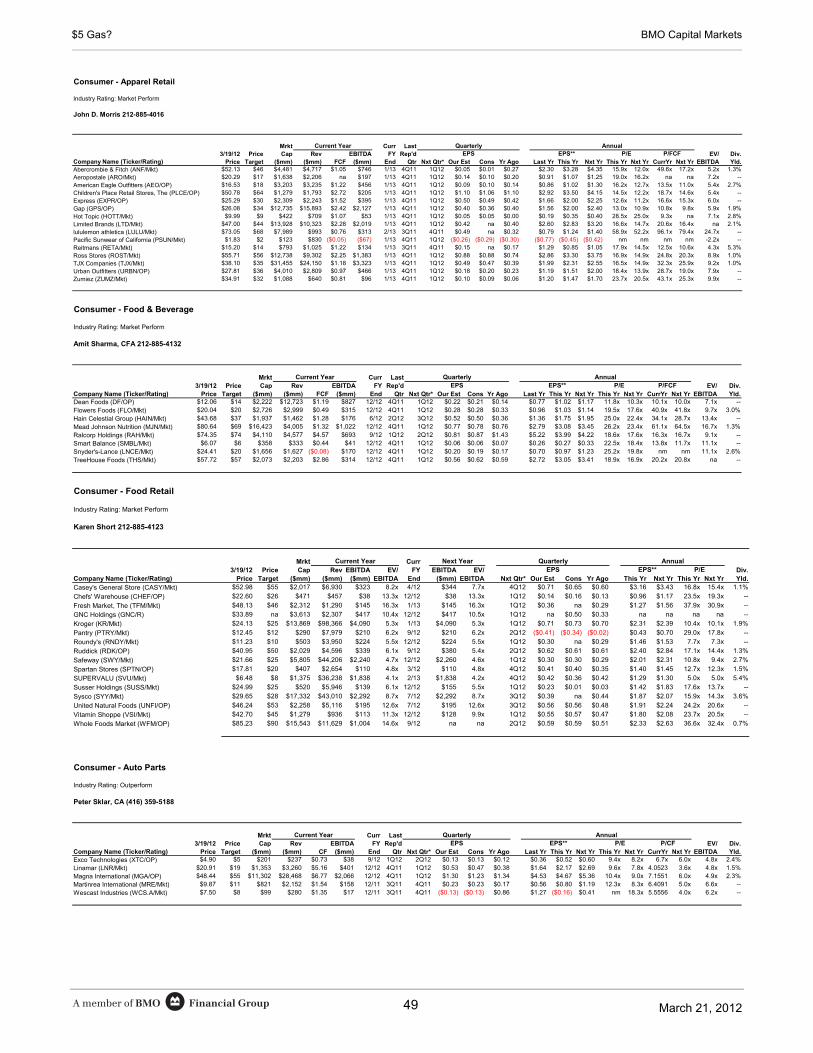
Financial GroupA member of BMO March 21, 2012
$5 Gas? BMO Capital Markets
49
Consumer - Apparel Retail
Industry Rating: Market Perform
John D. Morris 212-885-4016
Mrkt Curr Last3/19/12 Price Cap Rev EBITDA FY Rep'd EV/ Div.
Company Name (Ticker/Rating) Price Target ($mm) ($mm) FCF ($mm) End Qtr Nxt Qtr* Our Est Cons Yr Ago Last Yr This Yr Nxt Yr This Yr Nxt Yr CurrYr Nxt Yr EBITDA Yld.Abercrombie & Fitch (ANF/Mkt) $52.13 $46 $4,481 $4,717 $1.05 $746 1/13 4Q11 1Q12 $0.05 $0.01 $0.27 $2.30 $3.28 $4.35 15.9x 12.0x 49.6x 17.2x 5.2x 1.3%Aeropostale (ARO/Mkt) $20.29 $17 $1,638 $2,206 na $197 1/13 4Q11 1Q12 $0.14 $0.10 $0.20 $0.91 $1.07 $1.25 19.0x 16.2x na na 7.2x --American Eagle Outfitters (AEO/OP) $16.53 $18 $3,203 $3,235 $1.22 $456 1/13 4Q11 1Q12 $0.09 $0.10 $0.14 $0.86 $1.02 $1.30 16.2x 12.7x 13.5x 11.0x 5.4x 2.7%Children's Place Retail Stores, The (PLCE/OP) $50.78 $64 $1,279 $1,793 $2.72 $205 1/13 4Q11 1Q12 $1.10 $1.06 $1.10 $2.92 $3.50 $4.15 14.5x 12.2x 18.7x 14.6x 5.4x --Express (EXPR/OP) $25.29 $30 $2,309 $2,243 $1.52 $395 1/13 4Q11 1Q12 $0.50 $0.49 $0.42 $1.66 $2.00 $2.25 12.6x 11.2x 16.6x 15.3x 6.0x --Gap (GPS/OP) $26.08 $34 $12,735 $15,893 $2.42 $2,127 1/13 4Q11 1Q12 $0.40 $0.36 $0.40 $1.56 $2.00 $2.40 13.0x 10.9x 10.8x 9.8x 5.9x 1.9%Hot Topic (HOTT/Mkt) $9.99 $9 $422 $709 $1.07 $53 1/13 4Q11 1Q12 $0.05 $0.05 $0.00 $0.19 $0.35 $0.40 28.5x 25.0x 9.3x na 7.1x 2.8%Limited Brands (LTD/Mkt) $47.00 $44 $13,928 $10,323 $2.28 $2,019 1/13 4Q11 1Q12 $0.42 na $0.40 $2.60 $2.83 $3.20 16.6x 14.7x 20.6x 16.4x na 2.1%lululemon athletica (LULU/Mkt) $73.05 $68 $7,989 $993 $0.76 $313 2/13 3Q11 4Q11 $0.49 na $0.32 $0.79 $1.24 $1.40 58.9x 52.2x 96.1x 79.4x 24.7x --Pacific Sunwear of California (PSUN/Mkt) $1.83 $2 $123 $830 ($0.05) ($67) 1/13 4Q11 1Q12 ($0.26) ($0.29) ($0.30) ($0.77) ($0.45) ($0.42) nm nm nm nm -2.2x --Reitmans (RETA/Mkt) $15.20 $14 $793 $1,025 $1.22 $134 1/13 3Q11 4Q11 $0.15 na $0.17 $1.29 $0.85 $1.05 17.9x 14.5x 12.5x 10.6x 4.3x 5.3%Ross Stores (ROST/Mkt) $55.71 $56 $12,738 $9,302 $2.25 $1,383 1/13 4Q11 1Q12 $0.88 $0.88 $0.74 $2.86 $3.30 $3.75 16.9x 14.9x 24.8x 20.3x 8.9x 1.0%TJX Companies (TJX/Mkt) $38.10 $35 $31,455 $24,150 $1.18 $3,323 1/13 4Q11 1Q12 $0.49 $0.47 $0.39 $1.99 $2.31 $2.55 16.5x 14.9x 32.3x 25.9x 9.2x 1.0%Urban Outfitters (URBN/OP) $27.81 $36 $4,010 $2,809 $0.97 $466 1/13 4Q11 1Q12 $0.18 $0.20 $0.23 $1.19 $1.51 $2.00 18.4x 13.9x 28.7x 19.0x 7.9x --Zumiez (ZUMZ/Mkt) $34.91 $32 $1,088 $640 $0.81 $96 1/13 4Q11 1Q12 $0.10 $0.09 $0.06 $1.20 $1.47 $1.70 23.7x 20.5x 43.1x 25.3x 9.9x --
EPS EPS** P/E P/FCFCurrent Year Quarterly Annual
Consumer - Food & Beverage
Industry Rating: Market Perform
Amit Sharma, CFA 212-885-4132
Mrkt Curr Last3/19/12 Price Cap Rev EBITDA FY Rep'd EV/ Div.
Company Name (Ticker/Rating) Price Target ($mm) ($mm) FCF ($mm) End Qtr Nxt Qtr* Our Est Cons Yr Ago Last Yr This Yr Nxt Yr This Yr Nxt Yr CurrYr Nxt Yr EBITDA Yld.Dean Foods (DF/OP) $12.06 $14 $2,222 $12,723 $1.19 $827 12/12 4Q11 1Q12 $0.22 $0.21 $0.14 $0.77 $1.02 $1.17 11.8x 10.3x 10.1x 10.0x 7.1x --Flowers Foods (FLO/Mkt) $20.04 $20 $2,726 $2,999 $0.49 $315 12/12 4Q11 1Q12 $0.28 $0.28 $0.33 $0.96 $1.03 $1.14 19.5x 17.6x 40.9x 41.8x 9.7x 3.0%Hain Celestial Group (HAIN/Mkt) $43.68 $37 $1,937 $1,462 $1.28 $176 6/12 2Q12 3Q12 $0.52 $0.50 $0.36 $1.36 $1.75 $1.95 25.0x 22.4x 34.1x 28.7x 13.4x --Mead Johnson Nutrition (MJN/Mkt) $80.64 $69 $16,423 $4,005 $1.32 $1,022 12/12 4Q11 1Q12 $0.77 $0.78 $0.76 $2.79 $3.08 $3.45 26.2x 23.4x 61.1x 64.5x 16.7x 1.3%Ralcorp Holdings (RAH/Mkt) $74.35 $74 $4,110 $4,577 $4.57 $693 9/12 1Q12 2Q12 $0.81 $0.87 $1.43 $5.22 $3.99 $4.22 18.6x 17.6x 16.3x 16.7x 9.1x --Smart Balance (SMBL/Mkt) $6.07 $6 $358 $333 $0.44 $41 12/12 4Q11 1Q12 $0.06 $0.06 $0.07 $0.26 $0.27 $0.33 22.5x 18.4x 13.8x 11.7x 11.1x --Snyder's-Lance (LNCE/Mkt) $24.41 $20 $1,656 $1,627 ($0.08) $170 12/12 4Q11 1Q12 $0.20 $0.19 $0.17 $0.70 $0.97 $1.23 25.2x 19.8x nm nm 11.1x 2.6%TreeHouse Foods (THS/Mkt) $57.72 $57 $2,073 $2,203 $2.86 $314 12/12 4Q11 1Q12 $0.56 $0.62 $0.59 $2.72 $3.05 $3.41 18.9x 16.9x 20.2x 20.8x na --
EPS EPS** P/E P/FCFCurrent Year Quarterly Annual
Consumer - Food Retail
Industry Rating: Market Perform
Karen Short 212-885-4123
Mrkt Curr3/19/12 Price Cap Rev EBITDA EV/ FY EBITDA EV/ Div.
Company Name (Ticker/Rating) Price Target ($mm) ($mm) ($mm) EBITDA End ($mm) EBITDA Nxt Qtr* Our Est Cons Yr Ago This Yr Nxt Yr This Yr Nxt Yr Yld.Casey's General Store (CASY/Mkt) $52.98 $55 $2,017 $6,930 $323 8.2x 4/12 $344 7.7x 4Q12 $0.71 $0.65 $0.60 $3.16 $3.43 16.8x 15.4x 1.1%
Chefs' Warehouse (CHEF/OP) $22.60 $26 $471 $457 $38 13.3x 12/12 $38 13.3x 1Q12 $0.14 $0.16 $0.13 $0.96 $1.17 23.5x 19.3x --
Fresh Market, The (TFM/Mkt) $48.13 $46 $2,312 $1,290 $145 16.3x 1/13 $145 16.3x 1Q12 $0.36 na $0.29 $1.27 $1.56 37.9x 30.9x --
GNC Holdings (GNC/R) $33.89 na $3,613 $2,307 $417 10.4x 12/12 $417 10.5x 1Q12 na $0.50 $0.33 na na na na --
Kroger (KR/Mkt) $24.13 $25 $13,869 $98,366 $4,090 5.3x 1/13 $4,090 5.3x 1Q12 $0.71 $0.73 $0.70 $2.31 $2.39 10.4x 10.1x 1.9%
Pantry (PTRY/Mkt) $12.45 $12 $290 $7,979 $210 6.2x 9/12 $210 6.2x 2Q12 ($0.41) ($0.34) ($0.02) $0.43 $0.70 29.0x 17.8x --
Roundy's (RNDY/Mkt) $11.23 $10 $503 $3,950 $224 5.5x 12/12 $224 5.5x 1Q12 $0.30 na $0.29 $1.46 $1.53 7.7x 7.3x --
Ruddick (RDK/OP) $40.95 $50 $2,029 $4,596 $339 6.1x 9/12 $380 5.4x 2Q12 $0.62 $0.61 $0.61 $2.40 $2.84 17.1x 14.4x 1.3%
Safeway (SWY/Mkt) $21.66 $25 $5,805 $44,206 $2,240 4.7x 12/12 $2,260 4.6x 1Q12 $0.30 $0.30 $0.29 $2.01 $2.31 10.8x 9.4x 2.7%
Spartan Stores (SPTN/OP) $17.81 $20 $407 $2,654 $110 4.8x 3/12 $110 4.8x 4Q12 $0.41 $0.40 $0.35 $1.40 $1.45 12.7x 12.3x 1.5%
SUPERVALU (SVU/Mkt) $6.48 $8 $1,375 $36,238 $1,838 4.1x 2/13 $1,838 4.2x 4Q12 $0.42 $0.36 $0.42 $1.29 $1.30 5.0x 5.0x 5.4%
Susser Holdings (SUSS/Mkt) $24.99 $25 $520 $5,946 $139 6.1x 12/12 $155 5.5x 1Q12 $0.23 $0.01 $0.03 $1.42 $1.83 17.6x 13.7x --
Sysco (SYY/Mkt) $29.65 $28 $17,332 $43,010 $2,292 8.7x 7/12 $2,292 8.7x 3Q12 $0.39 na $0.44 $1.87 $2.07 15.9x 14.3x 3.6%
United Natural Foods (UNFI/OP) $46.24 $53 $2,258 $5,116 $195 12.6x 7/12 $195 12.6x 3Q12 $0.56 $0.56 $0.48 $1.91 $2.24 24.2x 20.6x --
Vitamin Shoppe (VSI/Mkt) $42.70 $45 $1,279 $936 $113 11.3x 12/12 $128 9.9x 1Q12 $0.55 $0.57 $0.47 $1.80 $2.08 23.7x 20.5x --
Whole Foods Market (WFM/OP) $85.23 $90 $15,543 $11,629 $1,004 14.6x 9/12 na na 2Q12 $0.59 $0.59 $0.51 $2.33 $2.63 36.6x 32.4x 0.7%
EPS EPS** P/EQuarterly AnnualCurrent Year Next Year
Consumer - Auto Parts
Industry Rating: Outperform
Peter Sklar, CA (416) 359-5188
Mrkt Curr Last3/19/12 Price Cap Rev EBITDA FY Rep'd EV/ Div.
Company Name (Ticker/Rating) Price Target ($mm) ($mm) CF ($mm) End Qtr Nxt Qtr* Our Est Cons Yr Ago Last Yr This Yr Nxt Yr This Yr Nxt Yr CurrYr Nxt Yr EBITDA Yld.Exco Technologies (XTC/OP) $4.90 $5 $201 $237 $0.73 $38 9/12 1Q12 2Q12 $0.13 $0.13 $0.12 $0.36 $0.52 $0.60 9.4x 8.2x 6.7x 6.0x 4.8x 2.4%Linamar (LNR/Mkt) $20.91 $19 $1,353 $3,260 $5.16 $401 12/12 4Q11 1Q12 $0.53 $0.47 $0.38 $1.64 $2.17 $2.69 9.6x 7.8x 4.0523 3.6x 4.8x 1.5%Magna International (MGA/OP) $48.44 $55 $11,302 $28,468 $6.77 $2,066 12/12 4Q11 1Q12 $1.30 $1.23 $1.34 $4.53 $4.67 $5.36 10.4x 9.0x 7.1551 6.0x 4.9x 2.3%Martinrea International (MRE/Mkt) $9.87 $11 $821 $2,152 $1.54 $158 12/11 3Q11 4Q11 $0.23 $0.23 $0.17 $0.56 $0.80 $1.19 12.3x 8.3x 6.4091 5.0x 6.6x --Wescast Industries (WCS.A/Mkt) $7.50 $8 $99 $280 $1.35 $17 12/11 3Q11 4Q11 ($0.13) ($0.13) $0.86 $1.27 ($0.16) $0.41 nm 18.3x 5.5556 4.0x 6.2x --
EPS EPS** P/E P/CFCurrent Year Quarterly Annual
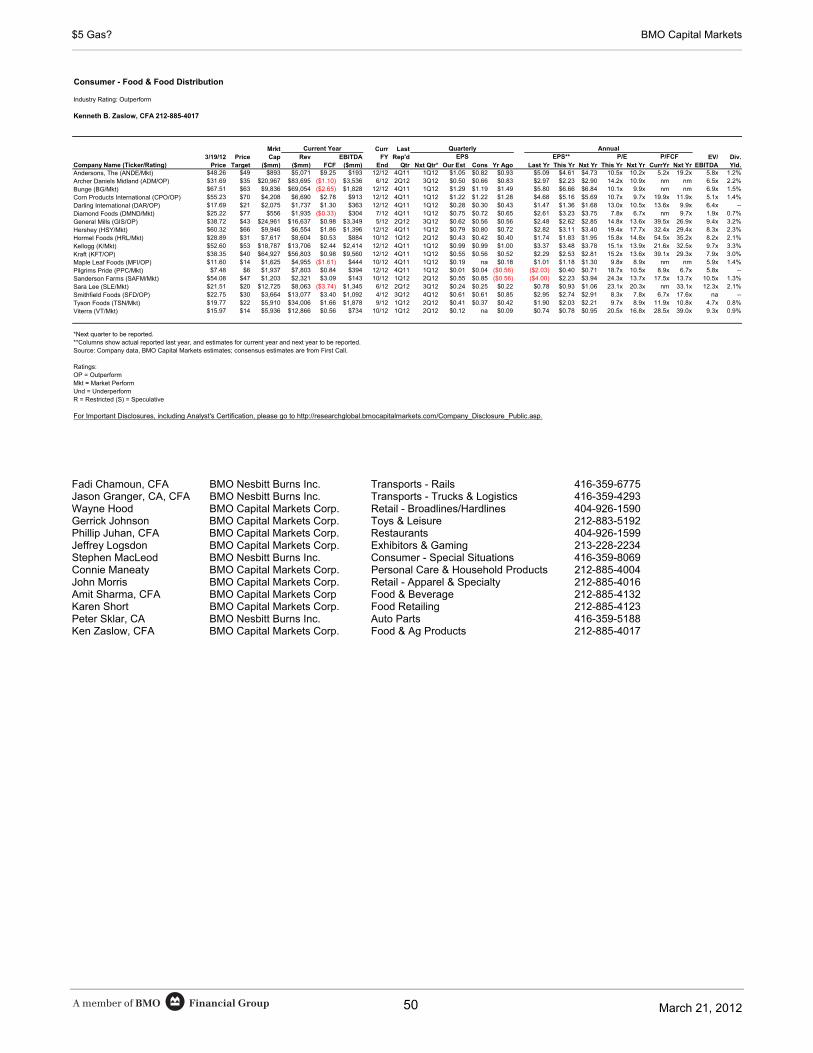
Financial GroupA member of BMO March 21, 2012
$5 Gas? BMO Capital Markets
50
Consumer - Food & Food Distribution
Industry Rating: Outperform
Kenneth B. Zaslow, CFA 212-885-4017
Mrkt Curr Last3/19/12 Price Cap Rev EBITDA FY Rep'd EV/ Div.
Company Name (Ticker/Rating) Price Target ($mm) ($mm) FCF ($mm) End Qtr Nxt Qtr* Our Est Cons Yr Ago Last Yr This Yr Nxt Yr This Yr Nxt Yr CurrYr Nxt Yr EBITDA Yld.Andersons, The (ANDE/Mkt) $48.26 $49 $893 $5,071 $9.25 $193 12/12 4Q11 1Q12 $1.05 $0.82 $0.93 $5.09 $4.61 $4.73 10.5x 10.2x 5.2x 19.2x 5.8x 1.2%Archer Daniels Midland (ADM/OP) $31.69 $35 $20,967 $83,695 ($1.10) $3,536 6/12 2Q12 3Q12 $0.50 $0.66 $0.83 $2.97 $2.23 $2.90 14.2x 10.9x nm nm 6.5x 2.2%Bunge (BG/Mkt) $67.51 $63 $9,836 $69,054 ($2.65) $1,828 12/12 4Q11 1Q12 $1.29 $1.19 $1.49 $5.80 $6.66 $6.84 10.1x 9.9x nm nm 6.9x 1.5%Corn Products International (CPO/OP) $55.23 $70 $4,208 $6,690 $2.78 $913 12/12 4Q11 1Q12 $1.22 $1.22 $1.28 $4.68 $5.16 $5.69 10.7x 9.7x 19.9x 11.9x 5.1x 1.4%Darling International (DAR/OP) $17.69 $21 $2,075 $1,737 $1.30 $363 12/12 4Q11 1Q12 $0.28 $0.30 $0.43 $1.47 $1.36 $1.68 13.0x 10.5x 13.6x 9.9x 6.4x --Diamond Foods (DMND/Mkt) $25.22 $77 $556 $1,935 ($0.33) $304 7/12 4Q11 1Q12 $0.75 $0.72 $0.65 $2.61 $3.23 $3.75 7.8x 6.7x nm 9.7x 1.9x 0.7%General Mills (GIS/OP) $38.72 $43 $24,961 $16,637 $0.98 $3,349 5/12 2Q12 3Q12 $0.62 $0.56 $0.56 $2.48 $2.62 $2.85 14.8x 13.6x 39.5x 26.9x 9.4x 3.2%Hershey (HSY/Mkt) $60.32 $66 $9,946 $6,554 $1.86 $1,396 12/12 4Q11 1Q12 $0.79 $0.80 $0.72 $2.82 $3.11 $3.40 19.4x 17.7x 32.4x 29.4x 8.3x 2.3%Hormel Foods (HRL/Mkt) $28.89 $31 $7,617 $8,604 $0.53 $884 10/12 1Q12 2Q12 $0.43 $0.42 $0.40 $1.74 $1.83 $1.95 15.8x 14.8x 54.5x 35.2x 8.2x 2.1%Kellogg (K/Mkt) $52.60 $53 $18,787 $13,706 $2.44 $2,414 12/12 4Q11 1Q12 $0.99 $0.99 $1.00 $3.37 $3.48 $3.78 15.1x 13.9x 21.6x 32.5x 9.7x 3.3%Kraft (KFT/OP) $38.35 $40 $64,927 $56,803 $0.98 $9,560 12/12 4Q11 1Q12 $0.55 $0.56 $0.52 $2.29 $2.53 $2.81 15.2x 13.6x 39.1x 29.3x 7.9x 3.0%Maple Leaf Foods (MFI/OP) $11.60 $14 $1,625 $4,955 ($1.61) $444 10/12 4Q11 1Q12 $0.19 na $0.18 $1.01 $1.18 $1.30 9.8x 8.9x nm nm 5.9x 1.4%Pilgrims Pride (PPC/Mkt) $7.48 $6 $1,937 $7,803 $0.84 $394 12/12 4Q11 1Q12 $0.01 $0.04 ($0.56) ($2.03) $0.40 $0.71 18.7x 10.5x 8.9x 6.7x 5.8x --Sanderson Farms (SAFM/Mkt) $54.08 $47 $1,203 $2,321 $3.09 $143 10/12 1Q12 2Q12 $0.55 $0.85 ($0.56) ($4.00) $2.23 $3.94 24.3x 13.7x 17.5x 13.7x 10.5x 1.3%Sara Lee (SLE/Mkt) $21.51 $20 $12,725 $8,063 ($3.74) $1,345 6/12 2Q12 3Q12 $0.24 $0.25 $0.22 $0.78 $0.93 $1.06 23.1x 20.3x nm 33.1x 12.3x 2.1%Smithfield Foods (SFD/OP) $22.75 $30 $3,664 $13,077 $3.40 $1,092 4/12 3Q12 4Q12 $0.61 $0.61 $0.85 $2.95 $2.74 $2.91 8.3x 7.8x 6.7x 17.6x na --Tyson Foods (TSN/Mkt) $19.77 $22 $5,910 $34,006 $1.66 $1,878 9/12 1Q12 2Q12 $0.41 $0.37 $0.42 $1.90 $2.03 $2.21 9.7x 8.9x 11.9x 10.8x 4.7x 0.8%Viterra (VT/Mkt) $15.97 $14 $5,936 $12,866 $0.56 $734 10/12 1Q12 2Q12 $0.12 na $0.09 $0.74 $0.78 $0.95 20.5x 16.8x 28.5x 39.0x 9.3x 0.9%
EPS EPS** P/E P/FCFCurrent Year Quarterly Annual
*Next quarter to be reported.**Columns show actual reported last year, and estimates for current year and next year to be reported.Source: Company data, BMO Capital Markets estimates; consensus estimates are from First Call.
Ratings:OP = OutperformMkt = Market PerformUnd = UnderperformR = Restricted (S) = Speculative
For Important Disclosures, including Analyst's Certification, please go to http://researchglobal.bmocapitalmarkets.com/Company_Disclosure_Public.asp.
Fadi Chamoun, CFA BMO Nesbitt Burns Inc. Transports - Rails 416-359-6775 Jason Granger, CA, CFA BMO Nesbitt Burns Inc. Transports - Trucks & Logistics 416-359-4293 Wayne Hood BMO Capital Markets Corp. Retail - Broadlines/Hardlines 404-926-1590 Gerrick Johnson BMO Capital Markets Corp. Toys & Leisure 212-883-5192 Phillip Juhan, CFA BMO Capital Markets Corp. Restaurants 404-926-1599 Jeffrey Logsdon BMO Capital Markets Corp. Exhibitors & Gaming 213-228-2234 Stephen MacLeod BMO Nesbitt Burns Inc. Consumer - Special Situations 416-359-8069 Connie Maneaty BMO Capital Markets Corp. Personal Care & Household Products 212-885-4004 John Morris BMO Capital Markets Corp. Retail - Apparel & Specialty 212-885-4016 Amit Sharma, CFA BMO Capital Markets Corp Food & Beverage 212-885-4132 Karen Short BMO Capital Markets Corp. Food Retailing 212-885-4123 Peter Sklar, CA BMO Nesbitt Burns Inc. Auto Parts 416-359-5188 Ken Zaslow, CFA BMO Capital Markets Corp. Food & Ag Products 212-885-4017
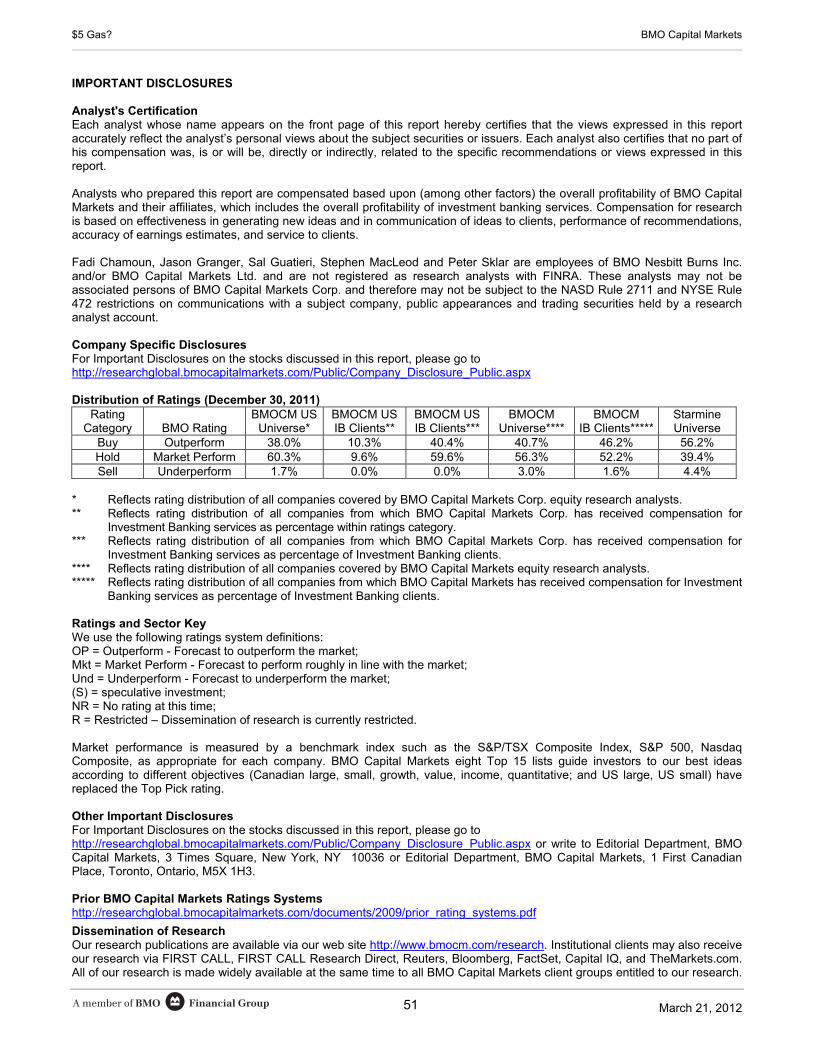
Financial GroupA member of BMO March 21, 2012
$5 Gas? BMO Capital Markets
51
IMPORTANT DISCLOSURES Analyst's Certification Each analyst whose name appears on the front page of this report hereby certifies that the views expressed in this report accurately reflect the analyst’s personal views about the subject securities or issuers. Each analyst also certifies that no part of his compensation was, is or will be, directly or indirectly, related to the specific recommendations or views expressed in this report. Analysts who prepared this report are compensated based upon (among other factors) the overall profitability of BMO Capital Markets and their affiliates, which includes the overall profitability of investment banking services. Compensation for research is based on effectiveness in generating new ideas and in communication of ideas to clients, performance of recommendations, accuracy of earnings estimates, and service to clients. Fadi Chamoun, Jason Granger, Sal Guatieri, Stephen MacLeod and Peter Sklar are employees of BMO Nesbitt Burns Inc. and/or BMO Capital Markets Ltd. and are not registered as research analysts with FINRA. These analysts may not be associated persons of BMO Capital Markets Corp. and therefore may not be subject to the NASD Rule 2711 and NYSE Rule 472 restrictions on communications with a subject company, public appearances and trading securities held by a research analyst account. Company Specific Disclosures For Important Disclosures on the stocks discussed in this report, please go to http://researchglobal.bmocapitalmarkets.com/Public/Company_Disclosure_Public.aspx
Distribution of Ratings (December 30, 2011)
Rating Category
BMO Rating
BMOCM US Universe*
BMOCM USIB Clients**
BMOCM USIB Clients***
BMOCM Universe****
BMOCM IB Clients*****
Starmine Universe
Buy Outperform 38.0% 10.3% 40.4% 40.7% 46.2% 56.2% Hold Market Perform 60.3% 9.6% 59.6% 56.3% 52.2% 39.4% Sell Underperform 1.7% 0.0% 0.0% 3.0% 1.6% 4.4%
* Reflects rating distribution of all companies covered by BMO Capital Markets Corp. equity research analysts. ** Reflects rating distribution of all companies from which BMO Capital Markets Corp. has received compensation for
Investment Banking services as percentage within ratings category. *** Reflects rating distribution of all companies from which BMO Capital Markets Corp. has received compensation for
Investment Banking services as percentage of Investment Banking clients. **** Reflects rating distribution of all companies covered by BMO Capital Markets equity research analysts. ***** Reflects rating distribution of all companies from which BMO Capital Markets has received compensation for Investment
Banking services as percentage of Investment Banking clients. Ratings and Sector Key We use the following ratings system definitions: OP = Outperform - Forecast to outperform the market; Mkt = Market Perform - Forecast to perform roughly in line with the market; Und = Underperform - Forecast to underperform the market; (S) = speculative investment; NR = No rating at this time; R = Restricted – Dissemination of research is currently restricted. Market performance is measured by a benchmark index such as the S&P/TSX Composite Index, S&P 500, Nasdaq Composite, as appropriate for each company. BMO Capital Markets eight Top 15 lists guide investors to our best ideas according to different objectives (Canadian large, small, growth, value, income, quantitative; and US large, US small) have replaced the Top Pick rating. Other Important Disclosures For Important Disclosures on the stocks discussed in this report, please go to http://researchglobal.bmocapitalmarkets.com/Public/Company_Disclosure_Public.aspx or write to Editorial Department, BMO Capital Markets, 3 Times Square, New York, NY 10036 or Editorial Department, BMO Capital Markets, 1 First Canadian Place, Toronto, Ontario, M5X 1H3. Prior BMO Capital Markets Ratings Systems http://researchglobal.bmocapitalmarkets.com/documents/2009/prior_rating_systems.pdf
Dissemination of Research Our research publications are available via our web site http://www.bmocm.com/research. Institutional clients may also receive our research via FIRST CALL, FIRST CALL Research Direct, Reuters, Bloomberg, FactSet, Capital IQ, and TheMarkets.com. All of our research is made widely available at the same time to all BMO Capital Markets client groups entitled to our research.
Financial GroupA member of BMO March 21, 2012
$5 Gas? BMO Capital Markets
52
Additional dissemination may occur via email or regular mail. Please contact your investment advisor or institutional salesperson for more information.
Conflict Statement A general description of how BMO Financial Group identifies and manages conflicts of interest is contained in our public facing policy for managing conflicts of interest in connection with investment research which is available at http://researchglobal.bmocapitalmarkets.com/Public/Conflict_Statement_Public.aspx General Disclaimer “BMO Capital Markets” is a trade name used by the BMO Investment Banking Group, which includes the wholesale arm of Bank of Montreal and its subsidiaries BMO Nesbitt Burns Inc. and BMO Nesbitt Burns Ltée./Ltd., BMO Capital Markets Ltd. in the U.K. and BMO Capital Markets Corp. in the U.S. BMO Nesbitt Burns Inc., BMO Capital Markets Ltd. and BMO Capital Markets Corp are affiliates. Bank of Montreal or its subsidiaries (“BMO Financial Group”) has lending arrangements with, or provide other remunerated services to, many issuers covered by BMO Capital Markets. The opinions, estimates and projections contained in this report are those of BMO Capital Markets as of the date of this report and are subject to change without notice. BMO Capital Markets endeavours to ensure that the contents have been compiled or derived from sources that we believe are reliable and contain information and opinions that are accurate and complete. However, BMO Capital Markets makes no representation or warranty, express or implied, in respect thereof, takes no responsibility for any errors and omissions contained herein and accepts no liability whatsoever for any loss arising from any use of, or reliance on, this report or its contents. Information may be available to BMO Capital Markets or its affiliates that is not reflected in this report. The information in this report is not intended to be used as the primary basis of investment decisions, and because of individual client objectives, should not be construed as advice designed to meet the particular investment needs of any investor. This material is for information purposes only and is not an offer to sell or the solicitation of an offer to buy any security. BMO Capital Markets or its affiliates will buy from or sell to customers the securities of issuers mentioned in this report on a principal basis. BMO Capital Markets or its affiliates, officers, directors or employees have a long or short position in many of the securities discussed herein, related securities or in options, futures or other derivative instruments based thereon. The reader should assume that BMO Capital Markets or its affiliates may have a conflict of interest and should not rely solely on this report in evaluating whether or not to buy or sell securities of issuers discussed herein.
Additional Matters To Canadian Residents: BMO Nesbitt Burns Inc. and BMO Nesbitt Burns Ltee/Ltd., affiliates of BMO Capital Markets Corp., furnish this report to Canadian residents and accept responsibility for the contents herein subject to the terms set out above. Any Canadian person wishing to effect transactions in any of the securities included in this report should do so through BMO Nesbitt Burns Inc. and/or BMO Nesbitt Burns Ltee/Ltd. To U.S. Residents: BMO Capital Markets Corp. and/or BMO Nesbitt Burns Securities Ltd., affiliates of BMO NB, furnish this report to U.S. residents and accept responsibility for the contents herein, except to the extent that it refers to securities of Bank of Montreal. Any U.S. person wishing to effect transactions in any security discussed herein should do so through BMO Capital Markets Corp. and/or BMO Nesbitt Burns Securities Ltd. To U.K. Residents: In the UK this document is published by BMO Capital Markets Limited which is authorised and regulated by the Financial Services Authority. The contents hereof are intended solely for the use of, and may only be issued or passed on to, (I) persons who have professional experience in matters relating to investments falling within Article 19(5) of the Financial Services and Markets Act 2000 (Financial Promotion) Order 2005 (the “Order”) or (II) high net worth entities falling within Article 49(2)(a) to (d) of the Order (all such persons together referred to as “relevant persons”). The contents hereof are not intended for the use of and may not be issued or passed on to, retail clients.
ADDITIONAL INFORMATION IS AVAILABLE UPON REQUEST BMO Financial Group (NYSE, TSX: BMO) is an integrated financial services provider offering a range of retail banking, wealth management, and in-vestment and corporate banking products. BMO serves Canadian retail clients through BMO Bank of Montreal and BMO Nesbitt Burns. In the United States, personal and commercial banking clients are served by BMO Harris Bank N.A., Member FDIC. Investment and corporate banking services are provided in Canada and the US through BMO Capital Markets.
BMO Capital Markets is a trade name used by BMO Financial Group for the wholesale banking businesses of Bank of Montreal, BMO Harris Bank N.A, BMO Ireland Plc, and Bank of Montreal (China) Co. Ltd. and the institutional broker dealer businesses of BMO Capital Markets Corp. (Member SIPC), BMO Nesbitt Burns Trading Corp. S.A., BMO Nesbitt Burns Securities Limited (Member SIPC) and BMO Capital Markets GKST Inc. (Member SIPC) in the U.S., BMO Nesbitt Burns Inc. (Member Canadian Investor Protection Fund) in Canada, Europe and Asia, BMO Nesbitt Burns Ltée/Ltd. (Member Canadian Investor Protection Fund) in Canada, BMO Capital Markets Limited in Europe, Asia and Australia and BMO Advisors Private Lim-ited in India.
“Nesbitt Burns” is a registered trademark of BMO Nesbitt Burns Corporation Limited, used under license. “BMO Capital Markets” is a trademark of Bank of Montreal, used under license. "BMO (M-Bar roundel symbol)" is a registered trademark of Bank of Montreal, used under license.
® Registered trademark of Bank of Montreal in the United States, Canada and elsewhere. TM Trademark Bank of Montreal
©COPYRIGHT 2012 BMO CAPITAL MARKETS CORP.
Financial GroupA member of BMO

Financial GroupA member of BMO March 21, 2012
$5 Gas? BMO Capital Markets
53
NOTES

Financial GroupA member of BMO March 21, 2012
$5 Gas? BMO Capital Markets
54
NOTES

Financial GroupA member of BMO January 4, 2012
Electric Utilities BMO Capital Markets
2
EnErgy & UtilitiEs ___________integrated Oils
Randy Ollenberger 403-515-1502
Oil & gas: north American E&PRandy Ollenberger 403-515-1502Jim Byrne, P. Eng. 403-515-1557Phillip Jungwirth, CFA 303-436-1127 Dan McSpirit 303-436-1117Gordon Tait, CFA 403-515-1501Jared Dziuba, CFA 403-515-3672
Oil & gas: services & EquipmentAlan Laws, CFA 303-436-1125Mike Mazar, CA, CFA 403-515-1538
Electric Utilities & independent PowerMichael S. Worms 212-885-4031
PipelinesCarl Kirst, CFA 713-546-9756
MAcrO _______________________Portfolio strategy
Jack A. Ablin, CFA 312-461-7756Don Coxe Coxe Advisors LLC
EconomicsDr. Sherry Cooper 416-359-4112Douglas Porter, CFA 416-359-4887Michael Gregory, CFA 416-359-4747Sal Guatieri 416-359-5295
Quantitative/technicalMark Steele 416-359-4641Ken Hartviksen, CFA 416-359-6211Qin Lu 416-359-6187
currency/Public PolicyAndy Busch 312-845-4080
small capsAndreka Lapchinski, CFA 416-359-5767
MAtEriAls ___________________Metals & Mining
Tony Robson 416-359-4034Stephen Bonnyman, CFA 416-359-8456Edward Sterck +44 (0)20 7246 5421 Meredith Bandy, CFA 303-436-1113Johannes Faul, CFA 416-359-7732
Precious MetalsDavid Haughton 416-359-4052Andrew Breichmanas, P.Eng. 416-359-8387
Mining Exploration & DevelopmentJohn Hayes, P. Geo. 416-359-6189Andrew Kaip, P. Geo. 416-359-7224
Paper & Forest ProductsStephen Atkinson 514-286-7309
FertilizersJoel Jackson, P.Eng., CFA 416-359-4250
cAPitAl gOODs & sErVicEs ___services - Education & staffing
Jeffrey M. Silber 212-885-4063
services - Marketing & AdvertisingDaniel Salmon 212-885-4029
services - Equipment DistributionBert Powell, CFA 416-359-5301
services - Engineering & constructionAvram Fisher 212-885-4094
transport - railsFadi Chamoun, CFA 416-359-6775
transport - trucks & logisticsJason Granger, CA, CFA 416-359-4293
Diversified industrialsCharles D. Brady 617-960-2363Bert Powell, CFA 416-359-5301
tEch/tElEcOM/MEDiA _________tech - Enterprise hardware, imaging & services
Keith Bachman, CFA 212-885-4010
tech - communications EquipmentTim Long 212-885-4101
tech - software/specialty hardwareThanos Moschopoulos, CFA 416-359-5428
tech - software/china software & servicesKarl Keirstead 212-885-4192
tech - semiconductors Ambrish Srivastava, Ph.D 415-591-2116
telecom servicesPeter Rhamey, CFA 416-359-6191
Media - Digital Entertainment Edward S. Williams 212-885-4054
Media - Entertainment & cableJeffrey B. Logsdon 213-228-2234Tim Casey, CFA 416-359-4860
FinAnciAls ___________________canadian Banks
John Reucassel, CFA 416-359-4379
Us BanksLana Chan 212-885-4109Peter Winter 212-885-4108
insuranceTom MacKinnon, FSA, FCIA 416-359-4629
Diversified FinancialsJohn Reucassel, CFA 416-359-4379Atul Shah 416-359-4691David Chiaverini, CFA 212-885-4115
ExchangesJillian Miller 404-926-1581
real Estate investment trustsPaul E. Adornato, CFA 212-885-4170Richard Anderson 212-885-4180Karine MacIndoe 416-359-4269
cOnsUMEr ___________________retail - Broadlines/hardlines
Wayne Hood 404-926-1590
retail - Apparel & specialtyJohn D. Morris 212-885-4016
retail - Food & DrugPeter Sklar, CA 416-359-5188Karen Short 212-885-4123
Food & Ag ProductsKenneth Zaslow, CFA 212-885-4017
Food & BeverageAmit Sharma, CFA 212-885-4132
restaurantsPhillip Juhan, CFA 404-926-1599
household & Personal care Products Connie M. Maneaty 212-885-4004
toys & leisureGerrick L. Johnson 212-883-5192
gamingJeffrey B. Logsdon 213-228-2234
Auto PartsPeter Sklar, CA 416-359-5188
Diversified consumerStephen MacLeod, CFA 416-359-8069
hEAlthcArE _________________Biotechnology
Jim Birchenough, M.D. 415-591-2129
Medical technologyJoanne K. Wuensch 212-883-5115
Managed care/Benefit ManagersDave Shove 212-885-4146
global head of researchIan de Verteuil 416-359-4478 Paul Campbell 416-359-5424
Equity Research
1 First Canadian Place, P.O. Box 150, Toronto, ON M5X 1H3 416-359-4000 • Tour McGill College, 1501 McGill College Ave., Suite 3200, Montreal, PQ H3A 3M8 • Dome Tower, 333 7th Ave.S.W., 22nd fl., Calgary, Alberta, T2P 2Z1 • 95 Queen Victoria Street, London, U.K., EC4V 4HG • 3 Times Square, New York, NY 10036 212-885-4000 • 200 Tower Place,, Suite 1430, Atlanta, GA 30326 • 175 Federal Street, 8th Floor,
Boston, MA 02110 617-451-0670 • 600 17th Street, Suite 1704S, South Tower, Denver, CO 80202 • 700 Louisiana Street, Suite 2100, Houston, TX 77002 713-546-9746601 South Figueroa Street, Suite 1730, Los Angeles, CA 90017 213-228-2161 • 100 Pine Street, Suite 2400, San Francisco, CA 94111 415-591-2100
co-heads of Equity researchR. Jackson Blackstock, CFA 212-885-4113