Embed Size (px)
Citation preview
1
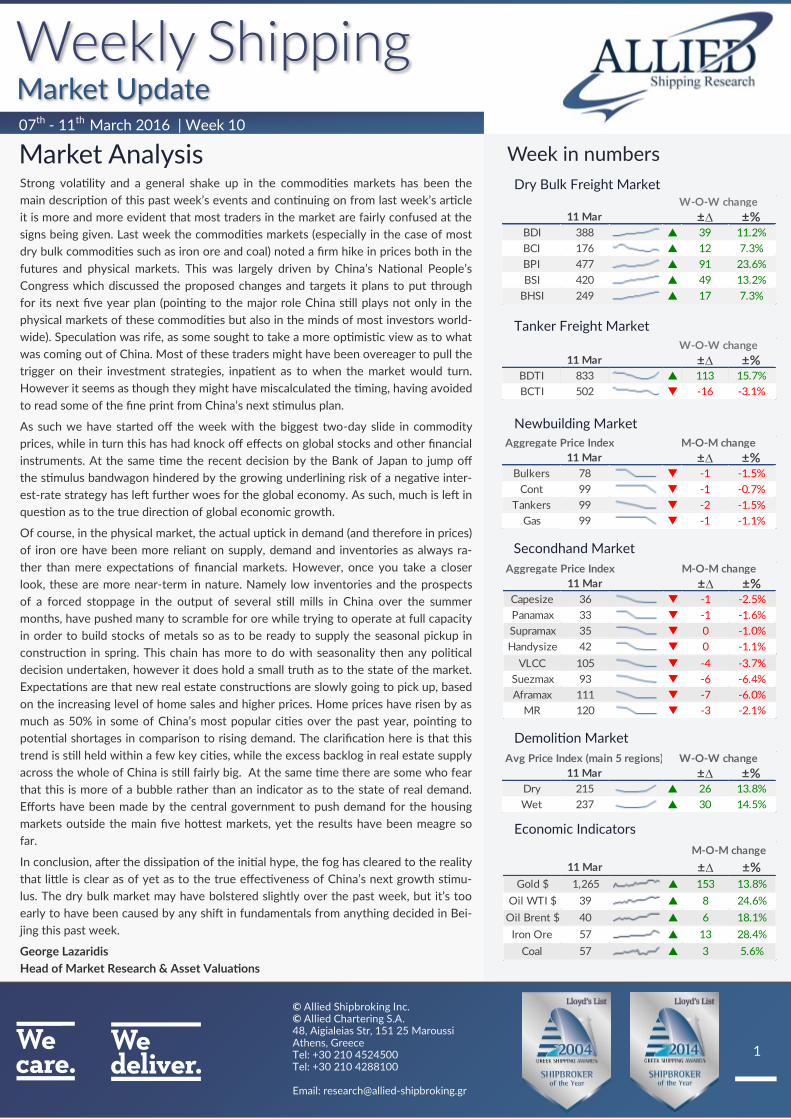
11 Mar ±∆ ±%BDI 388 p 39 11.2%
BCI 176 p 12 7.3%
BPI 477 p 91 23.6%
BSI 420 p 49 13.2%
BHSI 249 p 17 7.3%
W-O-W change
Strong volatility and a general shake up in the commodities markets has been the
main description of this past week’s events and continuing on from last week’s article
it is more and more evident that most traders in the market are fairly confused at the
signs being given. Last week the commodities markets (especially in the case of most
dry bulk commodities such as iron ore and coal) noted a firm hike in prices both in the
futures and physical markets. This was largely driven by China’s National People’s
Congress which discussed the proposed changes and targets it plans to put through
for its next five year plan (pointing to the major role China still plays not only in the
physical markets of these commodities but also in the minds of most investors world-
wide). Speculation was rife, as some sought to take a more optimistic view as to what
was coming out of China. Most of these traders might have been overeager to pull the
trigger on their investment strategies, inpatient as to when the market would turn.
However it seems as though they might have miscalculated the timing, having avoided
to read some of the fine print from China’s next stimulus plan.
As such we have started off the week with the biggest two-day slide in commodity
prices, while in turn this has had knock off effects on global stocks and other financial
instruments. At the same time the recent decision by the Bank of Japan to jump off
the stimulus bandwagon hindered by the growing underlining risk of a negative inter-
est-rate strategy has left further woes for the global economy. As such, much is left in
question as to the true direction of global economic growth.
Of course, in the physical market, the actual uptick in demand (and therefore in prices)
of iron ore have been more reliant on supply, demand and inventories as always ra-
ther than mere expectations of financial markets. However, once you take a closer
look, these are more near-term in nature. Namely low inventories and the prospects
of a forced stoppage in the output of several still mills in China over the summer
months, have pushed many to scramble for ore while trying to operate at full capacity
in order to build stocks of metals so as to be ready to supply the seasonal pickup in
construction in spring. This chain has more to do with seasonality then any political
decision undertaken, however it does hold a small truth as to the state of the market.
Expectations are that new real estate constructions are slowly going to pick up, based
on the increasing level of home sales and higher prices. Home prices have risen by as
much as 50% in some of China’s most popular cities over the past year, pointing to
potential shortages in comparison to rising demand. The clarification here is that this
trend is still held within a few key cities, while the excess backlog in real estate supply
across the whole of China is still fairly big. At the same time there are some who fear
that this is more of a bubble rather than an indicator as to the state of real demand.
Efforts have been made by the central government to push demand for the housing
markets outside the main five hottest markets, yet the results have been meagre so
far.
In conclusion, after the dissipation of the initial hype, the fog has cleared to the reality
that little is clear as of yet as to the true effectiveness of China’s next growth stimu-
lus. The dry bulk market may have bolstered slightly over the past week, but it’s too
early to have been caused by any shift in fundamentals from anything decided in Bei-
jing this past week.
George Lazaridis
Head of Market Research & Asset Valuations
07th - 11th March 2016 | Week 10
Dry Bulk Freight Market
Secondhand Market
Newbuilding Market
Demolition Market
Economic Indicators
Tanker Freight Market
11 Mar ±∆ ±%BDTI 833 p 113 15.7%
BCTI 502 q -16 -3.1%
W-O-W change
Avg Price Index (main 5 regions)
11 Mar ±∆ ±%Dry 215 p 26 13.8%
Wet 237 p 30 14.5%
W-O-W change
Aggregate Price Index
11 Mar ±∆ ±%Bulkers 78 q -1 -1.5%
Cont 99 q -1 -0.7%
Tankers 99 q -2 -1.5%
Gas 99 q -1 -1.1%
M-O-M change
11 Mar ±∆ ±%Gold $ 1,265 p 153 13.8%
Oil WTI $ 39 p 8 24.6%
Oil Brent $ 40 p 6 18.1%
Iron Ore 57 p 13 28.4%
Coal 57 p 3 5.6%
M-O-M change
Aggregate Price Index
11 Mar ±∆ ±%Capesize 36 q -1 -2.5%
Panamax 33 q -1 -1.6%
Supramax 35 q 0 -1.0%
Handysize 42 q 0 -1.1%
M-O-M change
VLCC 105 q -4 -3.7%
Suezmax 93 q -6 -6.4%
Aframax 111 q -7 -6.0%
MR 120 q -3 -2.1%

2
2015 2016
07th - 11th March 2016
Capesize - Still no clear direction in sight for the large capesize segment, though
they managed to close off the week with a slight gain in the main index thanks to
slightly higher spot rates given out of Australia and South America. The market
however is still dragging its feet, unwilling to move in any clear direction quickly
and with a plethora of tonnage still lurking open in the market, it will be hard to
see a quick positive outcome to materialize over the next couple of days.
Panamax - Things quickly started to heat up in the Panamax market, as the North
Atlantic started to feel strong gains, being heavily supported by the still active
ECSA trade which has been keeping tonnage busy for more then two weeks now.
The Pacific was also quick to step up to the plate, giving another boost on that
side, also benefiting from the limited open tonnage thanks to the previous flux of
ballasters that headed westward, while the was also a good flow of fresh inquiries
to keep things hot.
Supramax - Things were almost equally active in the Supramax segment, with all
major routes showing strong gains on a week-on-week basis. The Pacific was
slightly lagging, though the gains should start to catch up there as well. A good
inflow of fresh enquiries should keep things in the green over the next couple of
days, though for now the main gains will likely hold mainly in the North Atlantic.
Handysize - A positive feel, though slightly softer then what the rest of the size
groups were noting. The market here is still not showing a clear picture as to its
strength, causing a lack of sentiment to get things going further.
0
5
10
15
20
25'000 US$/day
11 Mar 04 Mar ±% 2016 2015
Baltic Dry IndexBDI 388 349 11.2% 350 711
CapesizeBCI 176 164 7.3% 232 1,009
BCI 5TC $ 2,172 $ 2,221 -2.2% $ 2,906 $ 8,001ATLANTIC RV $ 1,850 $ 2,055 -10.0% $ 3,212 $ 8,206
Cont / FEast $ 6,291 $ 6,532 -3.7% $ 8,598 $ 16,387PACIFIC RV $ 2,284 $ 2,233 2.3% $ 2,299 $ 7,394
FEast / ECSA $ 2,986 $ 2,950 1.2% $ 3,303 $ 8,353Panamax
BPI 477 386 23.6% 364 690BPI - TCA $ 3,827 $ 3,098 23.5% $ 2,913 $ 5,513
ATLANTIC RV $ 3,300 $ 2,195 50.3% $ 2,279 $ 5,925Cont / FEast $ 6,767 $ 6,138 10.2% $ 6,165 $ 10,563PACIFIC RV $ 4,762 $ 3,673 29.6% $ 2,845 $ 5,021
FEast / Cont $ 480 $ 387 24.0% $ 361 $ 542Supramax
BSI 420 371 13.2% 343 662BSI - TCA $ 4,391 $ 3,875 13.3% $ 3,589 $ 6,919
Cont / FEast $ 7,800 $ 6,533 19.4% $ 6,141 $ 9,890Med / Feast $ 6,571 $ 5,875 11.8% $ 5,720 $ 9,274PACIFIC RV $ 4,392 $ 4,142 6.0% $ 3,288 $ 5,989
FEast / Cont $ 2,000 $ 1,680 19.0% $ 1,651 $ 4,794USG / Skaw $ 6,019 $ 5,644 6.6% $ 5,767 $ 10,915Skaw / USG $ 1,950 $ 1,307 49.2% $ 1,202 $ 3,705
HandysizeBHSI 249 232 7.3% 223 364
BHSI - TCA $ 3,690 $ 3,446 7.1% $ 3,298 $ 5,354Skaw / Rio $ 2,236 $ 2,054 8.9% $ 2,046 $ 3,770
Skaw / Boston $ 2,542 $ 2,358 7.8% $ 2,103 $ 4,057Rio / Skaw $ 5,764 $ 5,344 7.9% $ 4,467 $ 8,526
USG / Skaw $ 4,818 $ 4,668 3.2% $ 4,775 $ 7,200SEAsia / Aus / Jap $ 3,036 $ 2,789 8.9% $ 2,895 $ 4,211
PACIFIC RV $ 4,043 $ 3,782 6.9% $ 3,600 $ 5,429
Spot market rates & indices Average
0
500
1,000
1,500
2,000
2,500
3,000
BDI BCI BPI BSI BHSI
0
2
4
6
8
10'000 US$/day
0
5
10
15'000 US$/day
0
3
6
9
12
15'000 US$/day

3
2015 2016
Crude Oil Carriers - Things fired up this past week in the crude oil tankers, with
the MEG showing a strong inflow of fresh inquiries boosting the late March pro-
gram and giving a strong boost on rates. Delays being noted in the Far East helped
keep tonnage lists fairly tight, while the higher interest amongst oil traders is likely
to keep things tight for both westbound and Eastbound voyages while also in-
creasing interest in the WAF as well. .
Oil Products - A mismatch of available tonnage coupled with slight softer enquir-
ies pushed for a further correction in rates this week. Things were on the low key
in the USAC and Caribs area, while the North Atlantic in general was poised for
slightly softer levels due to a diminished price arbitrage opportunity. Things were
looking more promising in the Pacific with demand from the Far East showing
signs of strengthening further. The Black Sea/Med region is also expected to pro-
vide some support over the next couple of days as things still hold firm there.
07th - 11th March 2016
11 Mar 04 Mar ±% 2016 2015
Baltic Tanker IndicesBDTI 833 720 15.7% 836 820BCTI 502 518 -3.1% 600 637
VLCCWS 46.00 28.33 62.4% 39.69 36.36
$/day $ 32,930 $ 15,141 117.5% $ 28,141 $ 31,968WS 94.32 53.32 76.9% 68.76 64.43
$/day $ 91,648 $ 50,276 82.3% $ 63,393 $ 61,629WS 92.18 51.71 78.3% 67.39 63.09
$/day $ 78,128 $ 39,570 97.4% $ 55,662 $ 68,288WS 87.50 65.00 34.6% 76.91 72.72
$/day $ 118,546 $ 85,749 38.2% $ 103,453 $ 76,589SUEZMAX
WS 72.50 65.00 11.5% 83.87 81.13$/day $ 44,245 $ 39,279 12.6% $ 54,032 $ 46,404
WS 81.14 74.86 8.4% 96.09 91.34$/day $ 25,388 $ 22,708 11.8% $ 37,291 $ 46,346
AFRAMAXWS 92.50 92.50 0.0% 103.83 111.01
$/day $ 17,214 $ 18,855 -8.7% $ 26,861 $ 37,053WS 131.89 119.72 10.2% 123.06 112.26
$/day $ 28,620 $ 26,582 7.7% $ 27,559 $ 31,406WS 135.28 138.33 -2.2% 128.20 133.63
$/day $ 27,553 $ 29,450 -6.4% $ 26,719 $ 37,962WS 70.00 72.50 -3.4% 86.58 92.57
$/day $ 19,025 $ 22,038 -13.7% $ 31,861 $ 43,406DPP
WS 122.50 130.00 -5.8% 133.92 138.77$/day $ 28,703 $ 31,641 -9.3% $ 32,803 $ 30,727
WS 92.50 100.75 -8.2% 122.14 122.73$/day $ 20,763 $ 23,983 -13.4% $ 34,187 $ 30,281
WS 138.69 119.06 16.5% 118.53 110.54$/day $ 34,976 $ 29,718 17.7% $ 29,644 $ 35,804
WS 111.56 84.28 32.4% 96.97 108.70$/day $ 24,295 $ 14,378 69.0% $ 20,195 $ 35,902
CPPWS 97.22 87.72 10.8% 112.25 105.50
$/day $ 18,422 $ 17,068 7.9% $ 23,830 $ 28,796WS 97.05 113.41 -14.4% 125.15 134.68
$/day $ 8,321 $ 11,801 -29.5% $ 14,261 $ 18,755WS 130.00 175.00 -25.7% 140.15 134.05
$/day $ 23,281 $ 34,812 -33.1% $ 26,119 $ 22,099WS 90.00 112.50 -20.0% 100.01 96.47
$/day $ 7,607 $ 12,041 -36.8% $ 10,304 $ 12,481
MED-MED
CONT-USAC
USG-CONT
MEG-USG
MEG-SPORE
WAF-USG
BSEA-MED
MEG-SPORE
MEG-JAPAN
WAF-USAC
NSEA-CONT
CARIBS-USG
CARIBS-USAC
SEASIA-AUS
MEG-JAPAN
CARIBS-USAC
BALTIC-UKC
ARA-USG
Spot market rates & indices Average
250
450
650
850
1,050
1,250
BDTI BCTI
-101030507090
110'000 US$/day
-25
0
25
50
75
100'000 US$/day
0
20
40
60
80
100'000 US$/day
5101520253035
'000 US$/day
4
last 5 years
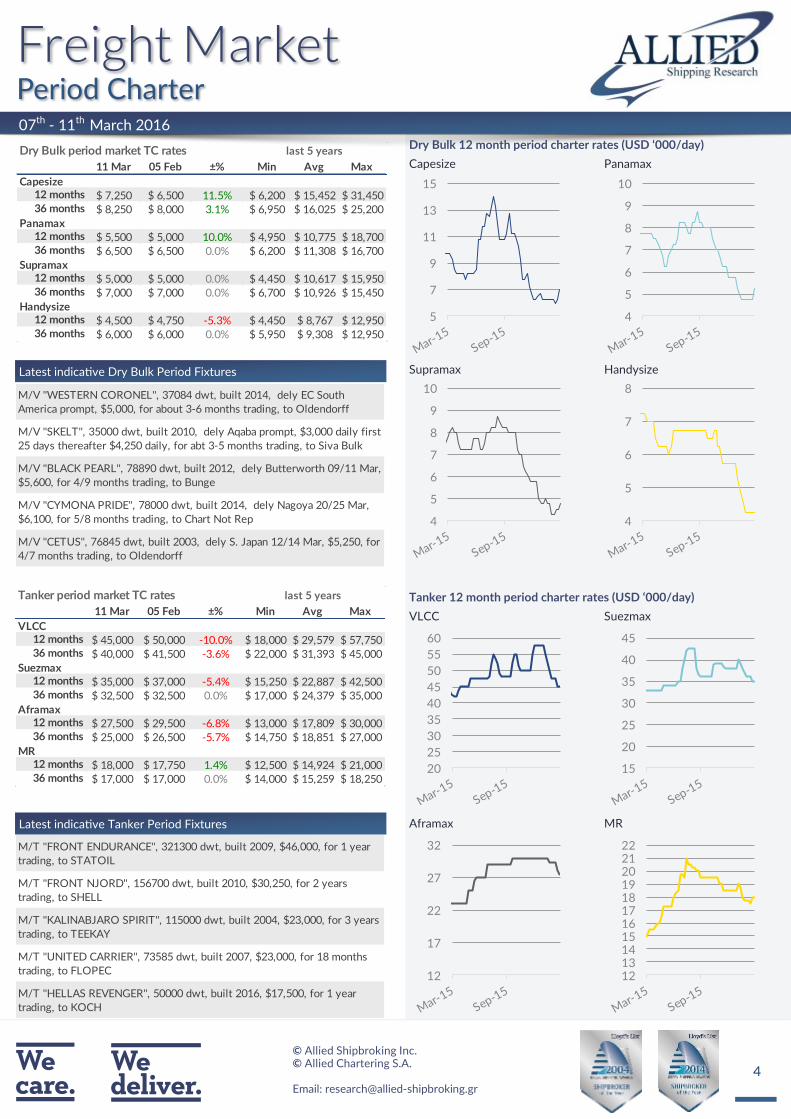
11 Mar 05 Feb ±% Min Avg Max
VLCC
$ 45,000 $ 50,000 -10.0% $ 18,000 $ 29,579 $ 57,750
$ 40,000 $ 41,500 -3.6% $ 22,000 $ 31,393 $ 45,000
Suezmax
$ 35,000 $ 37,000 -5.4% $ 15,250 $ 22,887 $ 42,500
$ 32,500 $ 32,500 0.0% $ 17,000 $ 24,379 $ 35,000
Aframax
$ 27,500 $ 29,500 -6.8% $ 13,000 $ 17,809 $ 30,000
$ 25,000 $ 26,500 -5.7% $ 14,750 $ 18,851 $ 27,000
MR
$ 18,000 $ 17,750 1.4% $ 12,500 $ 14,924 $ 21,000
$ 17,000 $ 17,000 0.0% $ 14,000 $ 15,259 $ 18,250
12 months
36 months
12 months
36 months
Tanker period market TC rates
12 months
36 months
12 months
36 months
last 5 years
11 Mar 05 Feb ±% Min Avg Max
Capesize
$ 7,250 $ 6,500 11.5% $ 6,200 $ 15,452 $ 31,450
$ 8,250 $ 8,000 3.1% $ 6,950 $ 16,025 $ 25,200
Panamax
$ 5,500 $ 5,000 10.0% $ 4,950 $ 10,775 $ 18,700
$ 6,500 $ 6,500 0.0% $ 6,200 $ 11,308 $ 16,700
Supramax
$ 5,000 $ 5,000 0.0% $ 4,450 $ 10,617 $ 15,950
$ 7,000 $ 7,000 0.0% $ 6,700 $ 10,926 $ 15,450
Handysize
$ 4,500 $ 4,750 -5.3% $ 4,450 $ 8,767 $ 12,950
$ 6,000 $ 6,000 0.0% $ 5,950 $ 9,308 $ 12,950
12 months
Dry Bulk period market TC rates
12 months
36 months
36 months
12 months
36 months
12 months
36 months
07th - 11th March 2016
Latest indicative Dry Bulk Period Fixtures
Latest indicative Tanker Period Fixtures
5
7
9
11
13
15
4
5
6
7
8
9
10
4
5
6
7
8
9
10
4
5
6
7
8
20
25
30
35
40
45
50
55
60
15
20
25
30
35
40
45
12
17
22
27
32
1213141516171819202122M/T ''FRONT ENDURANCE'', 321300 dwt, built 2009, $46,000, for 1 year
trading, to STATOIL
M/T ''FRONT NJORD'', 156700 dwt, built 2010, $30,250, for 2 years
trading, to SHELL
M/T ''KALINABJARO SPIRIT'', 115000 dwt, built 2004, $23,000, for 3 years
trading, to TEEKAY
M/T ''UNITED CARRIER'', 73585 dwt, built 2007, $23,000, for 18 months
trading, to FLOPEC
M/T ''HELLAS REVENGER'', 50000 dwt, built 2016, $17,500, for 1 year
trading, to KOCH
M/V ''WESTERN CORONEL'', 37084 dwt, built 2014, dely EC South
America prompt, $5,000, for about 3-6 months trading, to Oldendorff
M/V ''SKELT'', 35000 dwt, built 2010, dely Aqaba prompt, $3,000 daily first
25 days thereafter $4,250 daily, for abt 3-5 months trading, to Siva Bulk
M/V ''BLACK PEARL'', 78890 dwt, built 2012, dely Butterworth 09/11 Mar,
$5,600, for 4/9 months trading, to Bunge
M/V ''CYMONA PRIDE'', 78000 dwt, built 2014, dely Nagoya 20/25 Mar,
$6,100, for 5/8 months trading, to Chart Not Rep
M/V ''CETUS'', 76845 dwt, built 2003, dely S. Japan 12/14 Mar, $5,250, for
4/7 months trading, to Oldendorff

5
Reported Transactions
Despite the fact that on face value it looks as though the newbuild-
ing market was suddenly given new life, the reported activity holds a
slight misdirection as to the given position of the market right now.
There was a strong order placed in the very large dry bulkers this
week, supported by Brazil’s Vale and the Chinese government, both
of whom for their separate reasons have made a move in contrary to
what the market fundamentals dictate. Through the determination to
minimize its freight costs and increase its competitiveness, the major
Brazilian iron ore producer has found a close ally within the Chinese
government how have eagerly taken up this opportunity to prop up
their national orderbook and support their shipbuilders. Beyond this
order the rest have been for considerably smaller sized orders (both
in number of units and the size of the vessels in question), while the
focus is still on the more specialized vessels which are harder to be
sourced from within the secondhand market. As such it looks as
though things are still subdued in terms of real interest in newbuild-
ing orders and government support is still playing a major role in
keeping some shipbuilders afloat.
07th - 11th March 2016
10
20
30
40
50
60
Capesize Panamax Supramax Handysize
US$ million
30
50
70
90
110VLCC Suezmax Aframax LR1 MR
US$ million
Indicative Dry NB Prices (US$ million) last 5 years
11 Mar 05 Feb ±% Min Avg Max
Dry Bulkers
Capesize (180,000dwt) 45.5 46.0 -1.1% 45.5 50.4 58.0
Kamsarmax (82,000dwt) 26.0 26.3 -1.0% 26.0 29.1 36.5
Panamax (77,000dwt) 25.3 25.8 -1.9% 25.3 28.2 34.5
Ultramax (64,000dwt) 24.0 24.3 -1.0% 24.0 26.4 31.0
Handysize (37,000dwt) 20.0 20.5 -2.4% 20.0 22.4 26.5
Container
Post Panamax (9,000teu) 87.0 88.0 -1.1% 76.5 86.6 94.5
Panamax (5,200teu) 55.0 56.0 -1.8% 48.6 57.2 65.6
Sub Panamax (2,500teu) 29.5 29.5 0.0% 29.5 33.1 41.0
Feeder (1,700teu) 20.5 20.5 0.0% 20.5 24.5 29.4
Indicative Wet NB Prices (US$ million) last 5 years
11 Mar 05 Feb ±% Min Avg Max
Tankers
VLCC (300,000dwt) 92.5 93.5 -1.1% 89.5 96.3 104.0
Suezmax (160,000dwt) 61.5 62.5 -1.6% 55.8 61.5 66.0
Aframax (115,000dwt) 50.5 51.5 -1.9% 47.0 51.9 56.0
LR1 (75,000dwt) 45.0 45.8 -1.6% 40.5 44.0 47.0
MR (56,000dwt) 35.0 35.5 -1.4% 33.5 35.3 37.3
Gas
LNG 160k cbm 199.0 199.0 0.0% 198.0 200.1 203.0
LPG LGC 80k cbm 76.5 77.0 -0.6% 70.0 74.2 80.0
LPG MGC 55k cbm 66.5 67.5 -1.5% 62.0 64.6 68.5
LPG SGC 25k cbm 44.0 45.0 -2.2% 41.0 44.1 46.5
Type Units Size Shipbuilder Price Buyer Delivery Comments
BULK 10 400,000 dwt SWS, China N/ACHINA COSCO SHIPPING -
China2018
BULK 6 400,000 dwt YANGZIJIANG, China N/A ICBC LEASING - China 2018
BULK 7 400,000 dwt BEIHAI, China N/A ICBC LEASING - China 2018
BULK 4 34,500 dwt OSHIMA SHIPBUILDING, Japan N/A FEDNAV - Canada 2018
TANKER 1 49,800 dwt ONOMICHI, Japan N/AFAIRFIELD CHEMICAL
CARRIERS - U. S. A.2019 Declared option
TANKER 2 7,000 dwt CHENGXI SHIPYARD, China N/A WINNING INT, - Singapore 2016/2017
GAS 1 7,500 cbm MURAKAMI, Japan N/AWISDOM MARINE LINES -
Taiwan2017

6
Indicative Dry Bulk Values (US$ million)
11 Mar 05 Feb ±% Min Avg Max
Capesize180k dwt Resale 35.0 36.0 -2.8% 35.0 49.0 65.0170k dwt 5 year old 23.0 23.0 0.0% 23.0 37.8 53.0170k dwt 10 year old 12.0 13.0 -7.7% 12.0 26.0 39.0150k dwt 15 year old 6.5 6.5 0.0% 6.5 15.7 25.0Panamax82k dwt Resale 23.0 23.0 0.0% 23.0 31.1 43.076k dwt 5 year old 11.5 11.5 0.0% 11.5 22.6 36.876k dwt 10 year old 7.3 7.3 0.0% 7.3 16.8 29.374k dwt 15 year old 3.5 4.0 -12.5% 3.5 11.1 22.0Supramax62k dwt Resale 19.5 20.0 -2.5% 19.5 29.0 36.858k dwt 5 year old 11.0 11.0 0.0% 11.0 21.7 30.552k dwt 10 year old 6.0 6.0 0.0% 6.0 15.8 24.352k dwt 15 year old 3.5 3.5 0.0% 3.5 10.6 19.0Handysize37k dwt Resale 17.5 18.0 -2.8% 17.5 23.4 30.032k dwt 5 year old 9.0 9.0 0.0% 9.0 17.8 25.532k dwt 10 year old 6.0 6.0 0.0% 6.0 13.3 19.528k dwt 15 year old 3.5 3.5 0.0% 3.5 9.0 14.5
last 5 years
07th - 11th March 2016
On the dry bulk side, activity had picked up slightly, though prices
have started to show an ability to hold at their current levels, given
both the improvement from within the freight market as well as the
strong hike in scrap steel prices. Although both of these factors may
well be temporary and are still at weaker levels compared to where
they were a couple of months back, they might still be the initial
stages of a support level that has been growing on behalf of the
sellers side and could well prove to cause difficulties in allowing any
significant further price drops to be noted over the coming weeks.
On the tanker side, activity was fairly subdued, while the drop in
prices has been in part the cause for a noticeable withdrawal of sales
candidates. Being that the freight market still lacks a clear direction
for the long-term, a sort of mismatch gap between sellers and buyers
has grown in size, and keeping activity subdued.
+0%
-12%
-34%
-30%
-40%
-35%
-30%
-25%
-20%
-15%
-10%
-5%
0%
1 month diff 3 months diff6 months diff 12 months diff
+0% +0%
-36%-32%
-40%
-35%
-30%
-25%
-20%
-15%
-10%
-5%
0%
1 month diff 3 months diff6 months diff 12 months diff
+0% +0%
-29%
-33%-35%
-30%
-25%
-20%
-15%
-10%
-5%
0%
1 month diff 3 months diff6 months diff 12 months diff
+0% +0%
-31%
-38%-40%
-35%
-30%
-25%
-20%
-15%
-10%
-5%
0%
1 month diff 3 months diff6 months diff 12 months diff
-5% -5%
-8%
-6%
-9%
-8%
-7%
-6%
-5%
-4%
-3%
-2%
-1%
0%
1 month diff 3 months diff6 months diff 12 months diff
-8%
-9%
-11%
-6%
-12%
-10%
-8%
-6%
-4%
-2%
0%
1 month diff 3 months diff6 months diff 12 months diff
-11%
-13%
-11% -11%
-14%
-13%
-13%
-12%
-12%
-11%
-11%
-10%
1 month diff 3 months diff6 months diff 12 months diff
-2%
-5%
-4%
+2%
-6%
-5%
-4%
-3%
-2%
-1%
0%
1%
2%
3%
1 month diff 3 months diff6 months diff 12 months diff
Indicative Tanker Values (US$ million)
11 Mar 05 Feb ±% Min Avg Max
VLCC310k dwt Resale 96.0 98.0 -2.0% 80.0 95.3 108.5310k dwt 5 year old 76.0 80.0 -5.0% 55.0 70.2 87.0250k dwt 10 year old 56.0 57.0 -1.8% 33.8 46.2 62.0250k dwt 15 year old 36.0 38.0 -5.3% 16.9 27.4 41.0Suezmax160k dwt Resale 66.0 69.0 -4.3% 53.0 64.0 73.0150k dwt 5 year old 54.5 59.0 -7.6% 38.0 50.0 62.0150k dwt 10 year old 40.0 44.0 -9.1% 24.0 33.8 44.5150k dwt 15 year old 22.0 23.0 -4.3% 14.0 18.7 23.3Aframax110k dwt Resale 55.0 55.0 0.0% 39.0 48.6 57.0110k dwt 5 year old 40.0 45.0 -11.1% 27.0 36.9 47.5105k dwt 10 year old 27.0 30.0 -10.0% 16.0 24.0 33.0105k dwt 15 year old 16.5 17.0 -2.9% 8.0 13.1 18.5MR52k dwt Resale 36.0 37.0 -2.7% 32.0 36.9 39.352k dwt 5 year old 27.5 28.0 -1.8% 22.0 26.9 31.045k dwt 10 year old 20.0 20.0 0.0% 14.0 17.9 21.045k dwt 15 year old 12.5 13.0 -3.8% 9.0 11.0 13.5
last 5 years

7
07th - 11th March 2016
Size Name Dwt Built Shipbuilder M/E Coating Price Buyers Comments
AFRA TRIDENT STAR 105,996 2005 NAMURA IMARI,
JapanMAN-B&W $ 26.0m Thai - Nathalin
buyer subs untill end
March
AFRA RATNA PUJA 104,635 2006
SHANGHAI
WAIGAOQIAO,
China
MAN-B&W $ 22.5m Greek - Eurotankers on subs
PROD/
CHEMDEVA MARIA 13,921 1990
SHIN KURUSHIMA
AKITSU, JapanB&W St St $ 2.5m undisclosed
Size Name Dwt Built Shipbuilder M/E Gear Price Buyers Comments
KMAX TENSHIN MARU 82,687 2008 TSUNEISHI
ZHOUSHAN, ChinaMAN-B&W $ 8.0m Greek
PMAX ZEYNEP K 80,669 2010 STX OFFSHORE &
SHBLDG, S. KoreaMAN-B&W $ 10.3m
PMAX SADAN K 80,306 2010 STX OFFSHORE &
SHBLDG, S. KoreaMAN-B&W $ 10.3m
PMAX JI MAY 75,900 2001 TSUNEISHI, Japan B&W $ 3.7m Chinese just passed SS/DD
PMAX CORAL SEAS 74,476 2006
HUDONG-
ZHONGHUA
SHIPBU, China
MAN-B&W N/A
PMAX GOLDEN SEAS 74,475 2006
HUDONG-
ZHONGHUA
SHIPBU, China
MAN-B&W N/A
HANDY PROSPEROUS SEAS 37,294 2012 ZHEJIANG OUHUA
SHBLDG, ChinaWartsila
4 X 30t
CRANESN/A
HANDY PROUD SEAS 37,227 2014 ZHEJIANG OUHUA
SHBLDG, ChinaWartsila
4 X 30t
CRANESN/A
HANDY PRECIOUS SEAS 37,205 2012 ZHEJIANG OUHUA
SHBLDG, ChinaWartsila
4 X 30t
CRANESN/A
HANDY PRICELESS SEAS 37,202 2013 ZHEJIANG OUHUA
SHBLDG, ChinaWartsila
4 X 30t
CRANESN/A
PMAXWASHINGTON
TRADER74,228 2000
SASEBO SASEBO,
JapanB&W $ 2.7m Chinese
PMAX IOANNIS F K 74,190 2001 NAMURA IMARI,
JapanB&W $ 3.2m Chinese
SMAX CALYPSO COLOSSUS 55,429 2009
KAWASAKI
SHIPBUILDING,
Japan
MAN-B&W4 X 30,5t
CRANES$ 8.3m
Bangladeshi - SR
Shipping
SMAX SECRET 55,395 2013 HYUNDAI
VINASHIN, VietnamMAN-B&W
4 X 35t
CRANES$ 8.3m
SMAX CAPITAL 55,340 2013 HYUNDAI
VINASHIN, VietnamMAN-B&W
4 X 30t
CRANES$ 8.5m
SMAX GLOBAL ISLAND 53,556 2004 IWAGI, Japan MAN-B&W4 X 30,5t
CRANES$ 4.5m Greek - L.A Maritime
HMAX AURORA SAPPHIRE 48,893 2000 IHI - TOKYO, Japan Sulzer4 X 30t
CRANES$ 3.0m Bangladeshi
HANDY AEC ENDURANCE 37,500 2016 SHIMANAMI, Japan MAN-B&W4 X 30,5t
CRANES$ 15.0m Japanese incl. 1yr TC Back
Tankers
Bulk Carriers
undisclosed bank controlled deal
via auction, pending
deposit South African
Greek

8
07th - 11th March 2016
Type Name Dwt Built Shipbuilder M/E Gear Price Buyers Comments
General
CargoADDI L 4,557 1995 SLIP, Russia Deutz $ 1.5m undisclosed
General
CargoFAABORG 3,469 2004
SLOVENSKE,
SlovakiaMaK
2 X 35t
CRANES$ 2.95m undisclosed
General
CargoHERTFORDSHIRE 2,489 1995
SLOVENSKE,
SlovakiaDeutz $ 1.0m undisclosed
Size Name TEU Built Shipbuilder M/E Gear Price Buyers Comments
PMAX PRETORIA 4,389 2002
HANJIN HI &
CONST - BU, S.
Korea
MAN-B&W N/A Chinese
PMAX NORDIC WISMAR 3,421 2011
RONGCHENG
SHENFEI SHIP,
China
Wartsila
3 X 45t
CRANES,
1 X 35t
CRANES
$ 20.0mNorwegian - Ness
Risan
Gen. Cargo
Containers

9
The market was struck by a sudden shift in global fundamentals in
regards to steel, causing a speculative fever to hit some of the
shipbreakers across the Indian Sub-Continent as well. Most of the
drive seems to have been building off the spike in iron ore prices that
emerged early on Monday, while the fact that some owners of over-
aged dry bulkers took a “wait and see” stance this past week also
kept demo candidates on the wain. For the moment it looks as
though the spike in offered demo prices is more based on the opti-
mistic feeling circulating the market for the moment rather then from
an actual demand spike. To what extent this may hold will heavily
depend on the effectiveness of China’s new 5 year plan and the ex-
tent of the cash they will push towards new construction and other
investment projects. It is however to early to call and as such these
price levels may well wane given that their rise might have been too
quick for the market to support just yet.
07th - 11th March 2016
Reported Transactions
100150200250300350400450500
Bangladesh India Pakistan China Turkey
US$/ldt
100150200250300350400450500
Bangladesh India Pakistan China Turkey
US$/ldt
Indicative Wet Prices ($/ldt) last 5 years
11 Mar 04 Mar ±% Min Avg Max
Indian Sub Continent
Bangladesh 285 250 14.0% 245 429 540
India 285 255 11.8% 250 438 550
Pakistan 285 255 11.8% 245 434 525
Far East Asia
China 150 120 25.0% 120 332 485
Mediterranean
Turkey 180 155 16.1% 150 273 355
Indicative Dry Prices ($/ldt) last 5 years
11 Mar 04 Mar ±% Min Avg Max
Indian Sub Continent
Bangladesh 255 225 13.3% 220 408 515
India 255 230 10.9% 225 415 525
Pakistan 255 230 10.9% 220 411 510
Far East Asia
China 140 110 27.3% 110 315 455
Mediterranean
Turkey 170 150 13.3% 145 263 355
Type Vessel's Name Dwt Built Country Built Ldt US$/ldt Buyer Sale Comments
Bulker CAPE CENTURY 172,683 2001 Japan 21,104 $ 247/Ldt Pakistani bss 'as is' S'pore, incl. 250tns ROB
Bulker CAPE VENUS 172,612 1996 Japan 21,165 $ 239/Ldt Indian Green recycling - incl. 600tns ROB
Bulker POS AMBITION 149,330 1992 S. Korea 17,077 $ 245/Ldt Bangladeshi sunb-con options
Cont ZAMBIA 82,171 1998 Japan 28,544 $ 290/Ldt Bangladeshi incl. 80tns propeller & extra bunkers
Bulker AQUARIA 73,236 1994 S. Korea 10,481 $ 240/Ldt Indian
Bulker SUERTE 72,516 1995 S. Korea 11,343 $ 262/Ldt Indian bss 'as is' S'pore
Bulker ORIENT RICH 70,119 1995 Japan 9,284 $ 260/Ldt Indian
Bulker MIGHTY PLEIADES 68,962 1997 Japan 9,543 $ 230/Ldt Indian
Bulker MP PANAMAX 6 68,541 1995 Japan 10,306 $ 256/Ldt undisclosed bss 'as is' Colombo, incl. 200tns ROB
Bulker THE CREATOR 68,519 1995 Japan 9,861 $ 260/Ldt undisclosed sunb-con options
Cont MOL INTEGRITY 66,559 2001 Japan 24,572 $ 258/Ldt undisclosed net price - bss 'as is' S'pore; incl. 300tns ROB
Cont NORTHERN DIVINITY 45,117 1997 S. Korea 14,446 $ 257/Ldt Indian bss 'as is' S'pore incl/ 200tns ROB
Tanker KAMPOS 41,465 1991 Japan 8,223 $ 240/Ldt Pakistani bss 'as is' S'pore
ContCAPT. STEVEN L.
BENNETT41,151 1984 S. Korea 13,147 $ 293/Ldt Indian incl. 600tns ROB
Cont ARNOLD SCHULTE 41,000 2002 S. Korea 13,900 $ 273/Ldt Indian bss 'as is' S'pore

10
350
400
450
500
550
600
650
07th - 11th March 2016
US Dollar per Euro Yen per US Dollar
Iron Ore (TSI) Coal Price Index
Yuan per US Dollar US Dollar INDEX
Oil WTI $ Palm Oil
Korean owner Hanjin Shipping is reportedly looking to find KRW 1.2
trillion ($1bn) through asset sales and savings to refinance its debt.
The Korea Economic Daily, citing government and creditor officials,
said the company will take a number of approaches to boost its financ-
es. More old vessels will be sold or jobs cut to save KRW 500bn to the
end of 2020, while it will seek to raise KRW 500bn in 2016 alone
through asset sales.
The company also wants to lower its debt ratio from 600% to 400%
on borrowings of KRW 6 trillion. It has already been reported that
Hanjin is considering a sale of 30-year bonds worth KRW 220bn, at
interest of more than 9.5%. The container line and bulker player is also
mulling the disposal of US and European trademark rights to invest-
ment company Hanjin Kal for KRW 111.3bn. It may also sell treasury
stock worth KRW 37bn and an office building in London. Hanjin is
facing $406m of maturing debts in the first six months of 2016.
The company said its net profit was $6m last year, compared to a defi-
cit of $396m in the previous 12 months. Revenue fell to $6.86bn,
down 15.3% due to lower freight rates, but its operating profit rose to
$41m, from $26m, its second year in the black. Source: Tradewinds
0.95
1.00
1.05
1.10
1.15
1.20
1.25
1.30
110.00
112.00
114.00
116.00
118.00
120.00
122.00
124.00
126.00
6.00
6.10
6.20
6.30
6.40
6.50
6.60
6.70
84.00
89.00
94.00
99.00
104.00
109.00
30.00
40.00
50.00
60.00
70.00
80.00
45.00
50.00
55.00
60.00
65.00
70.00
25.00
30.00
35.00
40.00
45.00
50.00
55.00
60.00
65.00
11 Mar 05 Feb ±% Min Avg Max
Markets
10year US Bond 1.98 1.85 7.0% 1.64 2.13 2.48
S&P 500 2,022.2 1,880.1 7.6% 1,829 2,036 2,131
Nasdaq 4,748.5 4,363.1 8.8% 4,267 4,903 5,219
Dow Jones 17,213.3 16,205.0 6.2% 15,660 17,338 18,312
FTSE 100 6,139.8 5,848.1 5.0% 5,537 6,431 7,104
FTSE All-Share UK 3,367.5 3,215.1 4.7% 3,047 3,517 3,834
CAC40 4,492.8 4,200.7 7.0% 3,897 4,764 5,269
Xetra Dax 9,831.1 9,286.2 5.9% 8,753 10,752 12,375
Nikkei 16,938.9 16,819.6 0.7% 14,953 18,991 20,868
Hang Seng 20,199.6 19,288.2 4.7% 18,320 23,401 28,443
DJ US Maritime 197.7 170.6 15.8% 150.2 221.6 275.4
Currencies
$ per € 1.11 1.12 -0.7% 1.06 1.10 1.16
$ per ₤ 1.43 1.45 -1.2% 1.39 1.51 1.59
₤ per € 0.77 0.77 0.5% 0.70 0.73 0.79
¥ per $ 113.6 116.8 -2.8% 111.8 120.5 125.1
$ per Au$ 0.75 0.71 5.5% 0.69 0.74 0.81
$ per NoK 0.12 0.12 1.2% 0.11 0.12 0.14
$ per SFr 0.98 0.99 -0.7% 0.91 0.97 1.03
Yuan per $ 6.50 6.57 -1.1% 6.16 6.33 6.60
Won per $ 1,194.4 1,199.2 -0.4% 1,069.2 1,153.8 1,237.8
$ INDEX 102.6 104.2 -1.5% 99.5 103.9 107.4
Commoditites
Gold $ 1,264.8 1,111.8 13.8% 1,049.4 1,146.3 1,277.5
Oil WTI $ 38.5 30.9 24.6% 26.9 45.6 61.4
Oil Brent $ 40.3 34.1 18.1% 28.2 49.6 68.3
Palm Oil 562.0 562.0 0.0% 437.5 561.8 630.5
Iron Ore 57.4 44.7 28.4% 37.0 51.6 65.4
Coal Price Index 57.0 54.0 5.6% 47.3 55.6 68.5
White Sugar 427.3 380.0 12.4% 333.6 377.5 428.8
last 12 months

11
ALLIED SHIPBROKING INC. 48, Aigialeias Street, 4th Floor, Maroussi 151 25, Greece Tel: +30 210 45 24 500 Fax: +30 210 45 25 017/ 019 E-mail: [email protected]
ALLIED CHARTERING S.A. 48, Aigialeias Street, 4th Floor, Maroussi 151 25, Greece Tel : +30 210 42 88 100 Fax: +30 210 45 24 201
E-mail: [email protected]
E-mail: [email protected]
07th - 11th March 2016 | Week 10
AERAKIS GEORGEMOBILE: +30 6946 04 57 37
BOLIS ILIASMOBILE: +30 6937 02 65 00
DASKALAKIS GEORGEMOBILE: +30 6932 24 80 07
DRAKOGIANNOPOULOS STAVROSMOBILE: +30 6932 20 15 65
DRAKOGIANNOPOULOS SAKISMOBILE: +30 6944 88 58 08
HATZIGEORGIOU NASSOSMOBILE: +30 6944 73 33 93
KARADIMAS COSTASMOBILE: +30 6932 20 15 64
KLONIZAKIS JOHNMOBILE: +30 6948 50 55 81
KOSTOYANNIS JOHNMOBILE: +30 6932 43 39 99
MANOLAS NIKOLASMOBILE: +30 6940 63 22 56
MOISSOGLOU THEODOROSMOBILE: +30 6932 45 52 41
PAPOUIS THASSOSMOBILE: +30 6944 29 49 89
PRACHALIAS ARGIRISMOBILE: +30 6947 62 82 62
STASSINAKIS JOHNMOBILE: +30 6972 60 92 09
TSALPATOUROS COSTISMOBILE: +30 6932 20 15 63
VARVAROS PLUTONMOBILE: +30 6937 25 15 15
LAZARIDIS GEORGE MOBILE: +30 6946 95 69 40
Maritime Research & Valuations
Sale & PurchaseALEXOPOULOS PANOS
MOBILE: +30 6944 34 66 15
DAOULAS SPYROS MOBILE: +30 6932 27 88 40
KAILAS VAGGELISMOBILE: +30 6942 48 05 69
KANELLOS DIMITRIS MOBILE: +30 6945 07 47 85
KAPPA ANGELIKI MOBILE: +30 6975 85 60 84
KARAMANIS COSTASMOBILE: +30 6941 54 14 65
KARAMANI NATALIA MOBILE: +30 6984 58 82 99
MANOLOPOULOS VASSILISMOBILE: +30 6988 88 13 05
MAVRIKOU GEORGINA MOBILE: +30 6974 18 07 84
PATELIS DIMITRIS MOBILE: +30 6944 04 43 61
THEODOTOS ARISTOFANIS MOBILE: +30 6951 79 82 89
TSALPATOUROU MARGARITA MOBILE: +30 6934 74 22 16
FLOURIS JOHN MOBILE: +30 6955 80 15 03
FOUROULI STELLA MOBILE: +30 6947 35 68 48
PAPANTONOPOULOS NICOLAS MOBILE: +30 6945 23 21 88
Dry Cargo Chartering
Tanker Chartering

12
Disclaimer
The information contained within this report has been provided by Allied Shipbroking Inc. and Allied Chartering S.A. for general information
purposes.
All the information is compiled through Allied Shipbroking Inc. and Allied Chartering S.A. databases, as well as from other market sources. De-
spite having taken reasonable care in the gathering, filtering and auditing of this information and believing that the information is accurate and
correct, it may still contain errors, as a lot of the views regarding market levels are partially derived from estimates and/or subject judgments
while the reported transaction activity is gathered from several sources and rumors, some of which are sometimes hard to validate in full their
accuracy and truthfulness. As such we advise that the information be taken cautiously, while advising that this information does not obviate the
need to also make further enquiries and seek further information in order to obtain a more accurate outlook. As we make no warranties of any
kind, both expressed or implied, as to the completeness, accuracy, reliability or completeness of the information herein, Allied Shipbroking Inc.
and its connected persons shall not be held liable to any loss or damage of any kind, including direct, indirect and/or consequential damages
caused by negligence of any kind on our part.
Any choice to rely on this information provided is strictly at the recipient’s own risk.
This report and its information is confidential and solely for the internal use of its recipients, while any re-production or re-distribution of the
report and its material is strictly prohibited without prior permission from Allied Shipbroking Inc.
If you wish to subscribe to this or any other report we produce, please contact us directly.
Appendix
Aggregate Price Index quoted on the first page for both Newbuilding and Secondhand relates to the current average prices levels compared to
where they stood at 1st January 2010 (i.e. index 100 = 01/01/2010)
Demolition market average price index refers to the combination of the average prices currently offered in the Indian Sub-Continent, Far East
and Mediterranean.
Period rates currently relate to Capesize of 180,000dwt, Panamax of 76,000dwt, Supramax of 56,000dwt and Handysize of 33,000dwt on the
Dry Bulk side and VLCC of 250,000dwt, Suezmax of 150,000dwt, Aframax of 115,000dwt and MR of 52,000dwt on the Tankers side respec-
tively.
In terms of Secondhand Asset Prices their levels are quoted based on following description:
All vessels built to European specifications
by top Japanese shipbuilders, with dwt size
based on the below table.
07th - 11th March 2016 | Week 10
Resale 5 year old 10 year old 15 year old
Capesize 180,000dwt 170,000dwt 170,000dwt 150,000dwt
Panamax 82,000dwt 76,000dwt 76,000dwt 74,000dwt
Supramax 62,0000dwt 58,000dwt 52,000dwt 52,000dwt
Handysize 37,000dwt 32,000dwt 32,000dwt 28,000dwt
VLCC 310,000dwt 310,000dwt 250,000dwt 250,000dwt
Suezmax 160,000dwt 150,000dwt 150,000dwt 150,000dwt
Aframax 110,000dwt 110,000dwt 105,000dwt 95,000dwt
MR 52,000dwt 45,000dwt 45,000dwt 45,000dwt