Embed Size (px)
Citation preview
`
TRENDS AND OPPORTUNITIES March 2016

Greater Minnesota Transit Investment Plan TM#5: Trends & Opportunities | FINAL
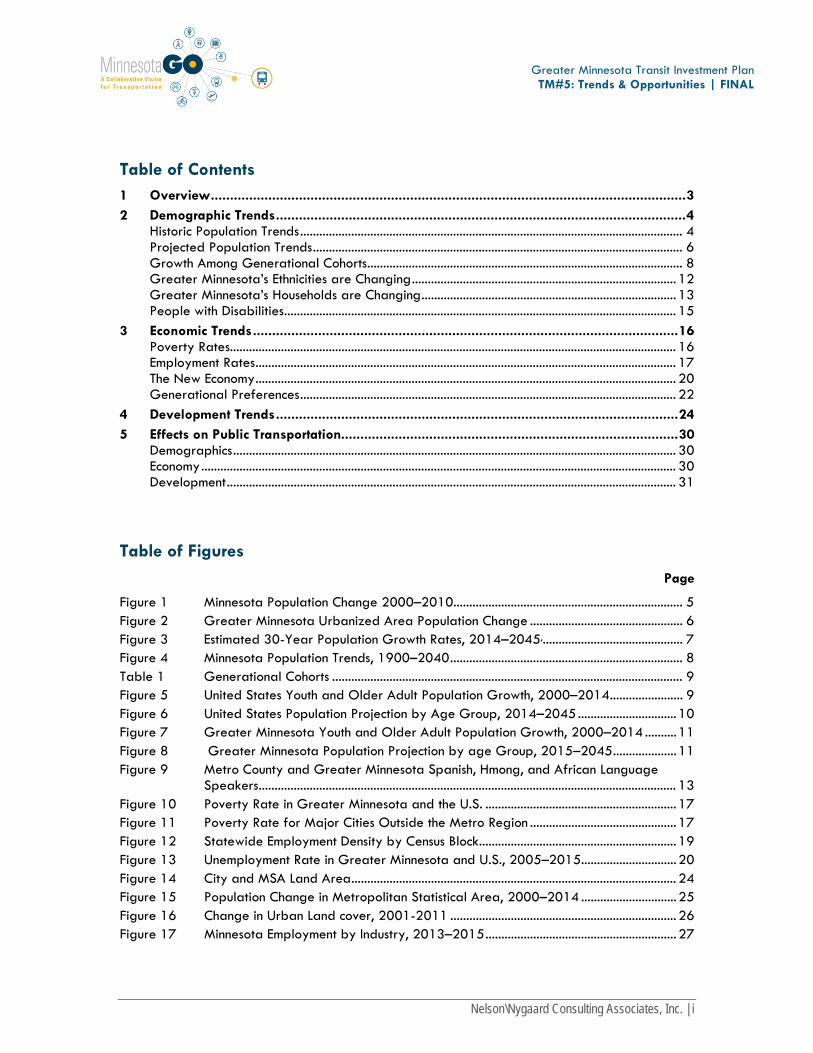
Table of Contents 1 Overview ............................................................................................................................ 3 2 Demographic Trends ........................................................................................................... 4
Historic Population Trends ........................................................................................................................ 4 Projected Population Trends .................................................................................................................... 6 Growth Among Generational Cohorts ................................................................................................... 8 Greater Minnesota’s Ethnicities are Changing ................................................................................... 12 Greater Minnesota’s Households are Changing ................................................................................ 13 People with Disabilities ........................................................................................................................... 15
3 Economic Trends ............................................................................................................... 16 Poverty Rates............................................................................................................................................ 16 Employment Rates .................................................................................................................................... 17 The New Economy .................................................................................................................................... 20 Generational Preferences ...................................................................................................................... 22
4 Development Trends ......................................................................................................... 24 5 Effects on Public Transportation........................................................................................ 30
Demographics ........................................................................................................................................... 30 Economy ..................................................................................................................................................... 30 Development ............................................................................................................................................. 31
Table of Figures Page
Figure 1 Minnesota Population Change 2000–2010........................................................................ 5 Figure 2 Greater Minnesota Urbanized Area Population Change ................................................ 6 Figure 3 Estimated 30-Year Population Growth Rates, 2014–2045,............................................ 7 Figure 4 Minnesota Population Trends, 1900–2040 ......................................................................... 8 Table 1 Generational Cohorts .............................................................................................................. 9 Figure 5 United States Youth and Older Adult Population Growth, 2000–2014 ....................... 9 Figure 6 United States Population Projection by Age Group, 2014–2045 ............................... 10 Figure 7 Greater Minnesota Youth and Older Adult Population Growth, 2000–2014 .......... 11 Figure 8 Greater Minnesota Population Projection by age Group, 2015–2045 .................... 11 Figure 9 Metro County and Greater Minnesota Spanish, Hmong, and African Language
Speakers ................................................................................................................................... 13 Figure 10 Poverty Rate in Greater Minnesota and the U.S. ............................................................ 17 Figure 11 Poverty Rate for Major Cities Outside the Metro Region .............................................. 17 Figure 12 Statewide Employment Density by Census Block .............................................................. 19 Figure 13 Unemployment Rate in Greater Minnesota and U.S., 2005–2015.............................. 20 Figure 14 City and MSA Land Area ...................................................................................................... 24 Figure 15 Population Change in Metropolitan Statistical Area, 2000–2014 .............................. 25 Figure 16 Change in Urban Land cover, 2001-2011 ....................................................................... 26 Figure 17 Minnesota Employment by Industry, 2013–2015 ............................................................ 27
Nelson\Nygaard Consulting Associates, Inc. | i

Greater Minnesota Transit Investment Plan TM#5: Trends & Opportunities | FINAL
Figure 18 Percentage of County Workforce Employed by Industry .............................................. 28
Nelson\Nygaard Consulting Associates, Inc. | ii
Greater Minnesota Transit Investment Plan TM#5: Trends & Opportunities | FINAL
1 OVERVIEW Transit service must meet the times and places where people need to travel and evolve as lifestyles change. How people access information, the makeup of a typical household, shifting job markets, and the size of generational cohorts all affect the need for and design of public transportation.
This analysis examines multiple topics and characteristics of Greater Minnesota that affect how people travel. These include:
Demographic changes
− Population growth
− Generational cohort growth
− Household makeup
− Foreign-born populations
− Persons with disabilities
Economic trends
− Poverty status
− Employment levels
− The new economy
Development trends
− Job growth by sector
− Urbanization
− Public Health
− Aging infrastructure
This project focuses upon Greater Minnesota, or the area of the state outside the Twin Cities metro region. The Twin Cities area generally corresponds to MnDOT’s District 5, which includes Chisago, Washington, Ramsey, Anoka, Hennepin, Carver, Scott, and Dakota Counties. Therefore, these eight counties were excluded from analysis to understand trends in Greater Minnesota.
Nelson\Nygaard Consulting Associates, Inc. | 3
Greater Minnesota Transit Investment Plan TM#5: Trends & Opportunities | FINAL
2 DEMOGRAPHIC TRENDS Demographics – the quantifiable characteristics of a population – by their very nature are constantly changing in society. The rate of change and convergence of certain demographic trends, however, affect the need for public services like transit. By comparing rates of change in Greater Minnesota to the country overall, unique transportation needs in the study area begin to emerge. The study team identified key demographic topics with the greatest implications for policymaking and transit investments.
HISTORIC POPULATION TRENDS
Greater Minnesota is growing, although slower than the entire United States. The population of Greater Minnesota as a whole increased 8% from 2,236,322 to 2,409,226 between 2000 and 2014. This is considerably less than the United States, which grew by 12% during the same period.1
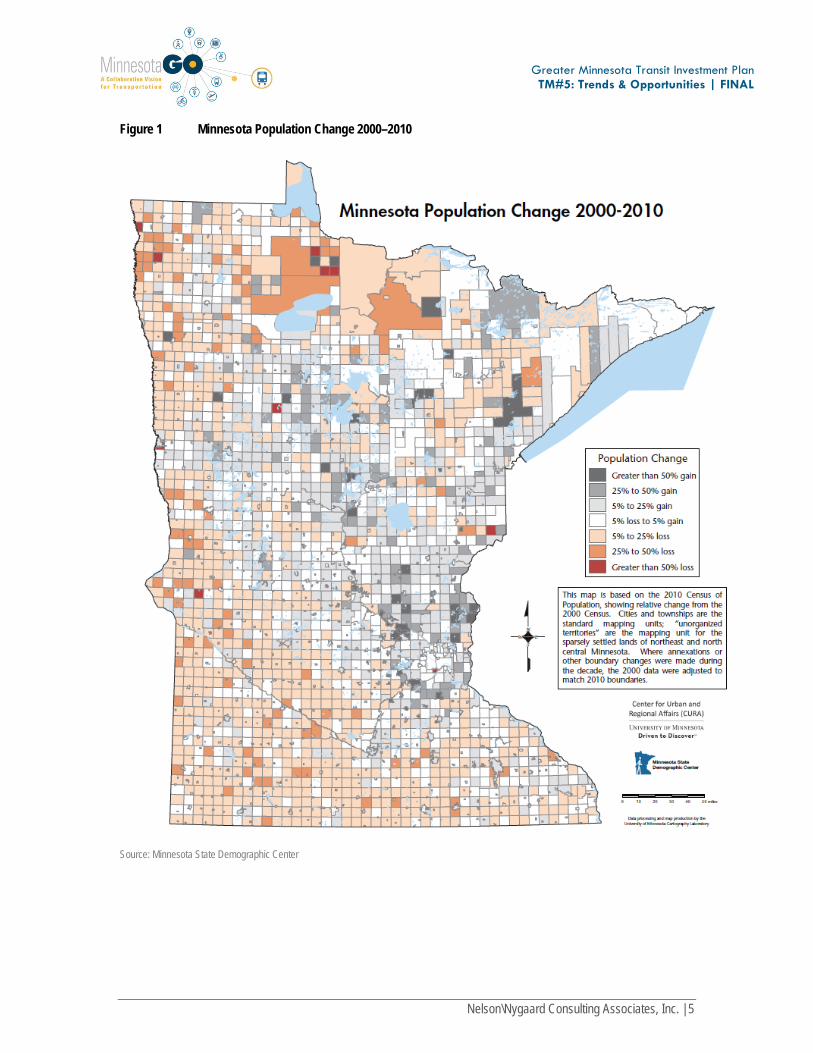
Population growth in Minnesota has been concentrated around the Twin Cities and the central northern region of Greater Minnesota. The population of Minnesota increased 8% from 4,919,479 to 5,303,925 between 2000 and 2010. Figure 1 shows that this growth has occurred primarily around the Twin Cities region as well as northern areas of the state. Population decline occurred in the southern and northwest regions of the state.
1 American Community Survey 2014
Nelson\Nygaard Consulting Associates, Inc. | 4
Greater Minnesota Transit Investment Plan TM#5: Trends & Opportunities | FINAL
Figure 1 Minnesota Population Change 2000–2010
Source: Minnesota State Demographic Center
Nelson\Nygaard Consulting Associates, Inc. | 5
Greater Minnesota Transit Investment Plan TM#5: Trends & Opportunities | FINAL
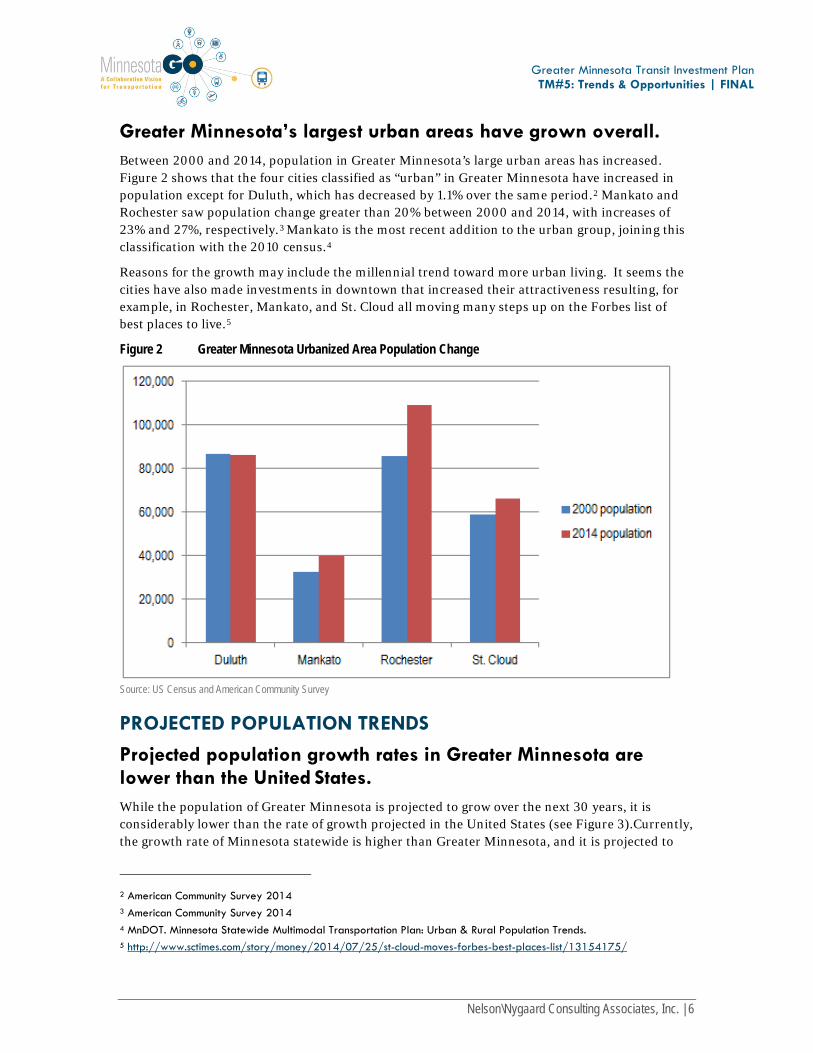
Greater Minnesota’s largest urban areas have grown overall. Between 2000 and 2014, population in Greater Minnesota’s large urban areas has increased. Figure 2 shows that the four cities classified as “urban” in Greater Minnesota have increased in population except for Duluth, which has decreased by 1.1% over the same period.2 Mankato and Rochester saw population change greater than 20% between 2000 and 2014, with increases of 23% and 27%, respectively.3 Mankato is the most recent addition to the urban group, joining this classification with the 2010 census.4
Reasons for the growth may include the millennial trend toward more urban living. It seems the cities have also made investments in downtown that increased their attractiveness resulting, for example, in Rochester, Mankato, and St. Cloud all moving many steps up on the Forbes list of best places to live.5
Figure 2 Greater Minnesota Urbanized Area Population Change
Source: US Census and American Community Survey
PROJECTED POPULATION TRENDS
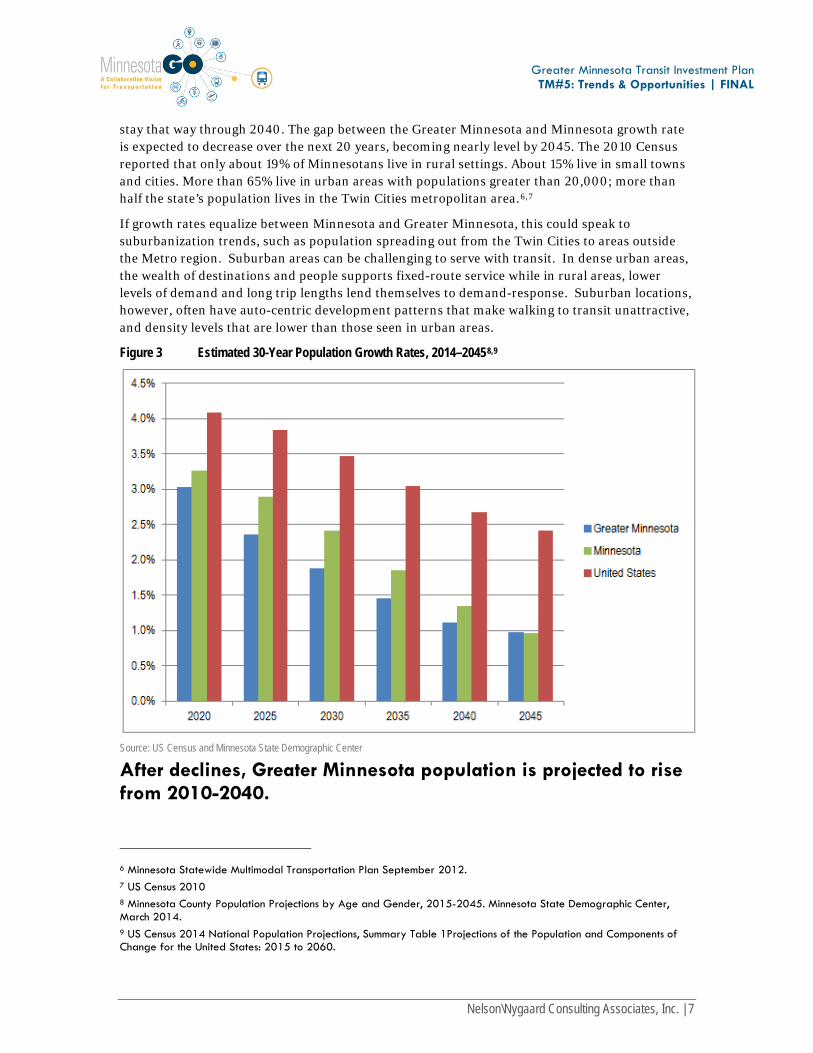
Projected population growth rates in Greater Minnesota are lower than the United States. While the population of Greater Minnesota is projected to grow over the next 30 years, it is considerably lower than the rate of growth projected in the United States (see Figure 3).Currently, the growth rate of Minnesota statewide is higher than Greater Minnesota, and it is projected to
2 American Community Survey 2014 3 American Community Survey 2014 4 MnDOT. Minnesota Statewide Multimodal Transportation Plan: Urban & Rural Population Trends. 5 http://www.sctimes.com/story/money/2014/07/25/st-cloud-moves-forbes-best-places-list/13154175/
Nelson\Nygaard Consulting Associates, Inc. | 6
Greater Minnesota Transit Investment Plan TM#5: Trends & Opportunities | FINAL
stay that way through 2040. The gap between the Greater Minnesota and Minnesota growth rate is expected to decrease over the next 20 years, becoming nearly level by 2045. The 2010 Census reported that only about 19% of Minnesotans live in rural settings. About 15% live in small towns and cities. More than 65% live in urban areas with populations greater than 20,000; more than half the state’s population lives in the Twin Cities metropolitan area.6,7
If growth rates equalize between Minnesota and Greater Minnesota, this could speak to suburbanization trends, such as population spreading out from the Twin Cities to areas outside the Metro region. Suburban areas can be challenging to serve with transit. In dense urban areas, the wealth of destinations and people supports fixed-route service while in rural areas, lower levels of demand and long trip lengths lend themselves to demand-response. Suburban locations, however, often have auto-centric development patterns that make walking to transit unattractive, and density levels that are lower than those seen in urban areas.
Figure 3 Estimated 30-Year Population Growth Rates, 2014–20458,9
Source: US Census and Minnesota State Demographic Center
After declines, Greater Minnesota population is projected to rise from 2010-2040.
6 Minnesota Statewide Multimodal Transportation Plan September 2012. 7 US Census 2010 8 Minnesota County Population Projections by Age and Gender, 2015-2045. Minnesota State Demographic Center, March 2014. 9 US Census 2014 National Population Projections, Summary Table 1Projections of the Population and Components of Change for the United States: 2015 to 2060.
Nelson\Nygaard Consulting Associates, Inc. | 7
Greater Minnesota Transit Investment Plan TM#5: Trends & Opportunities | FINAL
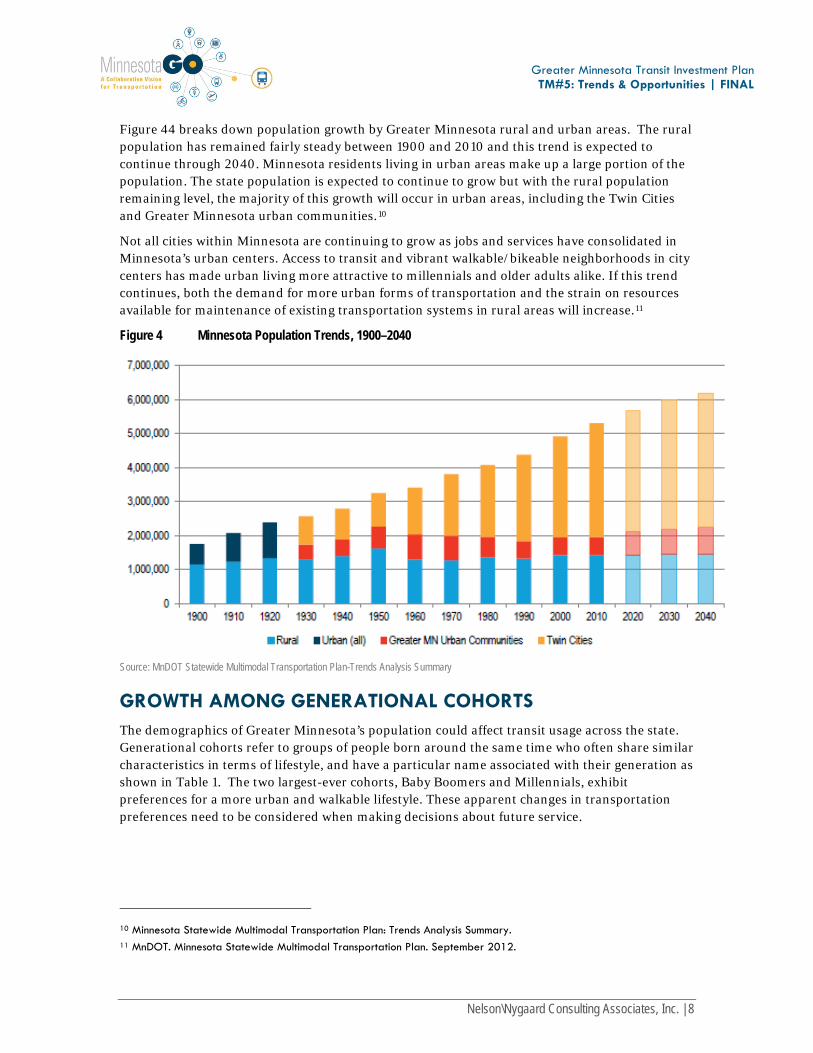
Figure 44 breaks down population growth by Greater Minnesota rural and urban areas. The rural population has remained fairly steady between 1900 and 2010 and this trend is expected to continue through 2040. Minnesota residents living in urban areas make up a large portion of the population. The state population is expected to continue to grow but with the rural population remaining level, the majority of this growth will occur in urban areas, including the Twin Cities and Greater Minnesota urban communities.10
Not all cities within Minnesota are continuing to grow as jobs and services have consolidated in Minnesota’s urban centers. Access to transit and vibrant walkable/bikeable neighborhoods in city centers has made urban living more attractive to millennials and older adults alike. If this trend continues, both the demand for more urban forms of transportation and the strain on resources available for maintenance of existing transportation systems in rural areas will increase.11
Figure 4 Minnesota Population Trends, 1900–2040
Source: MnDOT Statewide Multimodal Transportation Plan-Trends Analysis Summary
GROWTH AMONG GENERATIONAL COHORTS The demographics of Greater Minnesota’s population could affect transit usage across the state. Generational cohorts refer to groups of people born around the same time who often share similar characteristics in terms of lifestyle, and have a particular name associated with their generation as shown in Table 1. The two largest-ever cohorts, Baby Boomers and Millennials, exhibit preferences for a more urban and walkable lifestyle. These apparent changes in transportation preferences need to be considered when making decisions about future service.
10 Minnesota Statewide Multimodal Transportation Plan: Trends Analysis Summary. 11 MnDOT. Minnesota Statewide Multimodal Transportation Plan. September 2012.
Nelson\Nygaard Consulting Associates, Inc. | 8
Greater Minnesota Transit Investment Plan TM#5: Trends & Opportunities | FINAL
Table 1 Generational Cohorts12
GENERATIONAL COHORT Birth Year DESCRIPTION Generation Y 1985-2004 Also known as the Millennials and Echo Boomers. The children of
the Baby Boomer cohort. Generation X 1965-1984 Also known as the Baby Bust. Baby Boomers 1945-1964 The post-World War II generation. Silent Generation 1925-1944 Born between the Great Depression and World War II. Also known
as the Lucky Few.
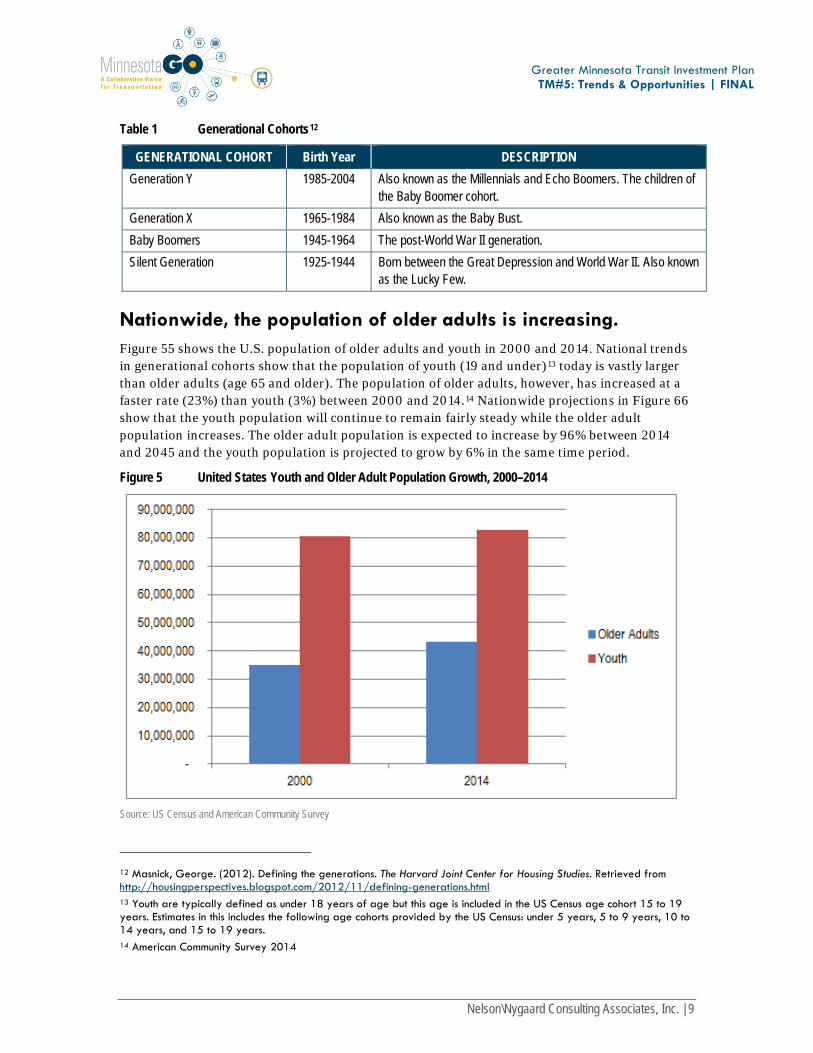
Nationwide, the population of older adults is increasing. Figure 55 shows the U.S. population of older adults and youth in 2000 and 2014. National trends in generational cohorts show that the population of youth (19 and under)13 today is vastly larger than older adults (age 65 and older). The population of older adults, however, has increased at a faster rate (23%) than youth (3%) between 2000 and 2014.14 Nationwide projections in Figure 66 show that the youth population will continue to remain fairly steady while the older adult population increases. The older adult population is expected to increase by 96% between 2014 and 2045 and the youth population is projected to grow by 6% in the same time period.
Figure 5 United States Youth and Older Adult Population Growth, 2000–2014
Source: US Census and American Community Survey
12 Masnick, George. (2012). Defining the generations. The Harvard Joint Center for Housing Studies. Retrieved from http://housingperspectives.blogspot.com/2012/11/defining-generations.html 13 Youth are typically defined as under 18 years of age but this age is included in the US Census age cohort 15 to 19 years. Estimates in this includes the following age cohorts provided by the US Census: under 5 years, 5 to 9 years, 10 to 14 years, and 15 to 19 years. 14 American Community Survey 2014
Nelson\Nygaard Consulting Associates, Inc. | 9
Greater Minnesota Transit Investment Plan TM#5: Trends & Opportunities | FINAL
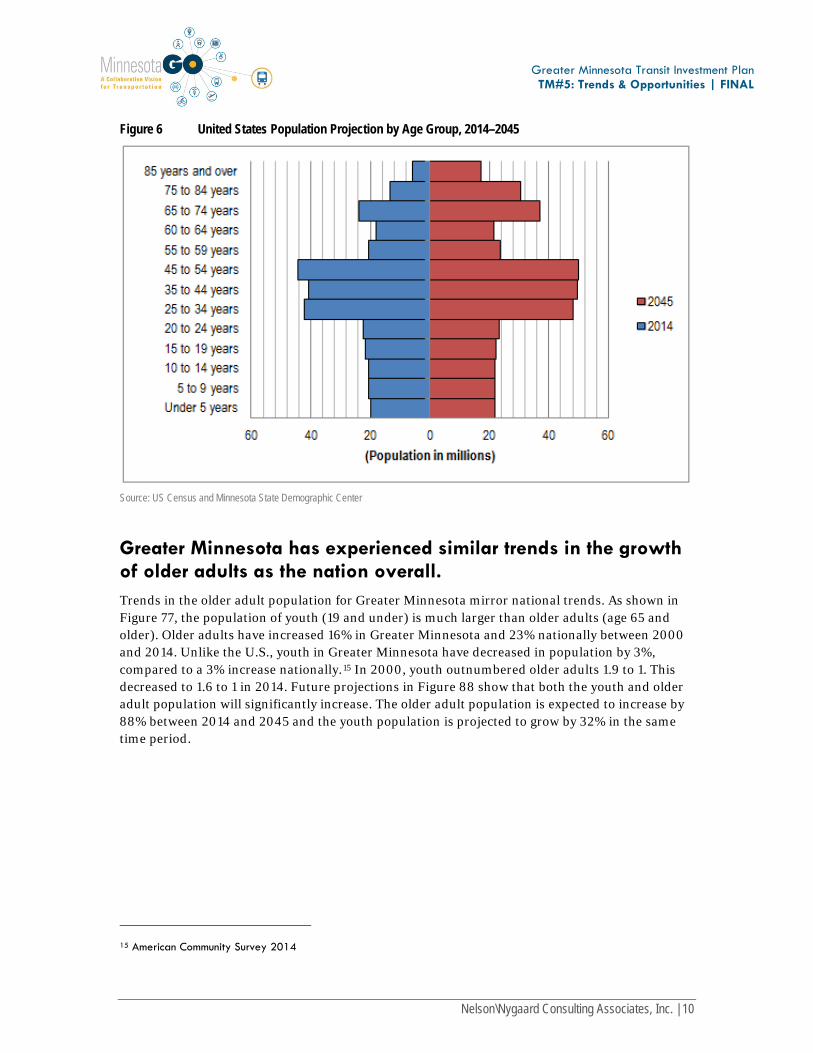
Figure 6 United States Population Projection by Age Group, 2014–2045
Source: US Census and Minnesota State Demographic Center
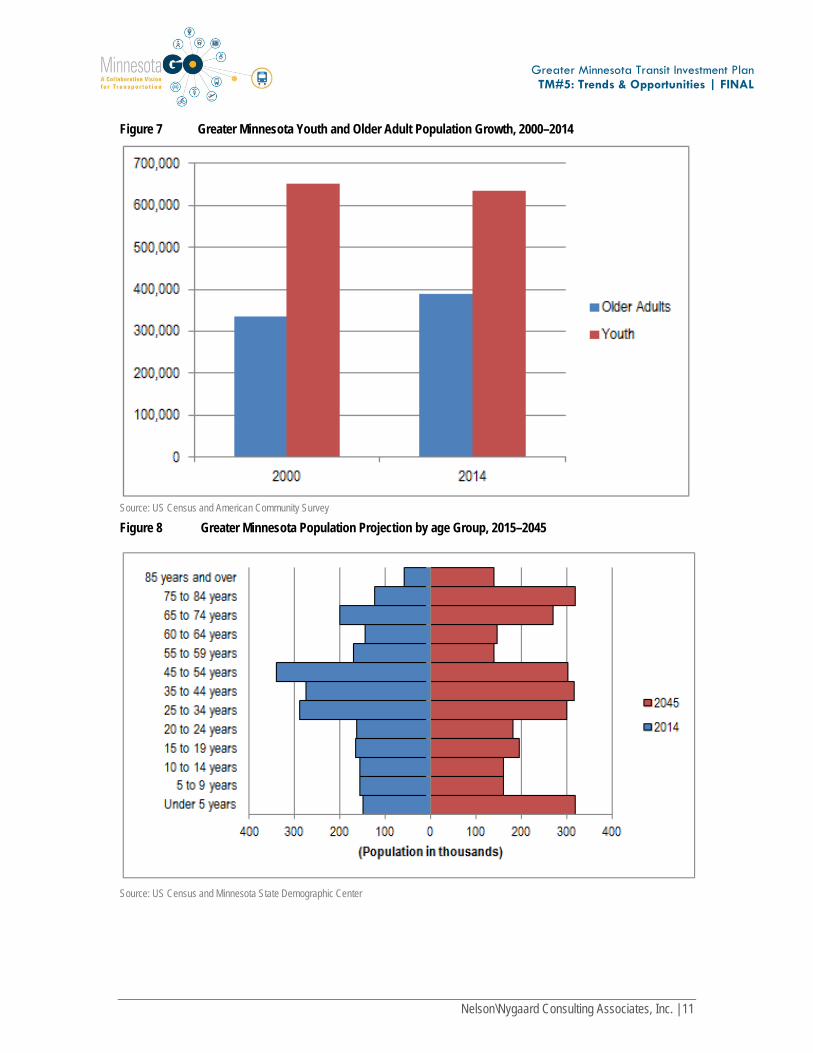
Greater Minnesota has experienced similar trends in the growth of older adults as the nation overall. Trends in the older adult population for Greater Minnesota mirror national trends. As shown in Figure 77, the population of youth (19 and under) is much larger than older adults (age 65 and older). Older adults have increased 16% in Greater Minnesota and 23% nationally between 2000 and 2014. Unlike the U.S., youth in Greater Minnesota have decreased in population by 3%, compared to a 3% increase nationally.15 In 2000, youth outnumbered older adults 1.9 to 1. This decreased to 1.6 to 1 in 2014. Future projections in Figure 88 show that both the youth and older adult population will significantly increase. The older adult population is expected to increase by 88% between 2014 and 2045 and the youth population is projected to grow by 32% in the same time period.
15 American Community Survey 2014
Nelson\Nygaard Consulting Associates, Inc. | 10
Greater Minnesota Transit Investment Plan TM#5: Trends & Opportunities | FINAL
Figure 7 Greater Minnesota Youth and Older Adult Population Growth, 2000–2014
Source: US Census and American Community Survey
Figure 8 Greater Minnesota Population Projection by age Group, 2015–2045
Source: US Census and Minnesota State Demographic Center
Nelson\Nygaard Consulting Associates, Inc. | 11
Greater Minnesota Transit Investment Plan TM#5: Trends & Opportunities | FINAL
These findings are significant because older adults are historically more reliant on transit for access to services. As more adults become eligible for Medicare and associated transportation services, this rate will increase over its current trends. Older adults also are more likely to have a physical disability that requires higher level of service, such as a life-equipped vehicle or service delivered from curb-to-curb. Additionally, recent trends in millennial transit usage show that they tend to chose transit over other modes when available.16 As millennials and older adults alike seek to live in areas with transit services. Transit has the opportunity to gain more riders; service, however, must be convenient and reliable to attract those new customers.
GREATER MINNESOTA’S ETHNICITIES ARE CHANGING
The population of individuals with Limited English Proficiency is increasing slower than nationally. The population of individuals in Greater Minnesota that speak English less than “very well” increased 7% from 43,054 to 46,062 between 2000 and 2014. This is slightly lower than the 12% increase seen in the United States as a whole over the same period.17
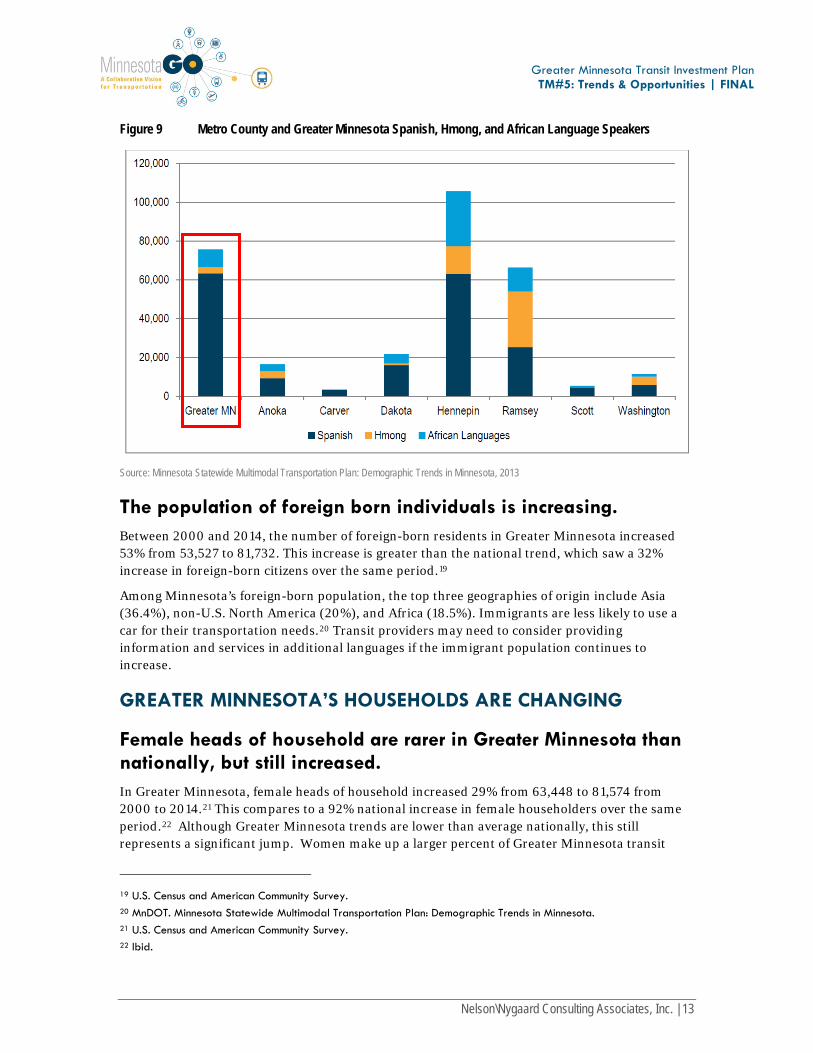
English remains the primary spoken language in Minnesota with 89% of residents who speak English at home. After English, the three most common languages or language groups spoken in Minnesota are Spanish, African Languages, and Hmong. Non-English speakers tend to live in or near urban areas, such as the Twin Cities region but as shown in Figure 910 there are a large number of non-English speakers throughout the Greater Minnesota region. Over 60,000 Greater Minnesota residents are Spanish speakers.18
Individuals with Limited English Proficiency are more reliant on transit services, as it can be difficult to obtain a drivers license with limited knowledge of the language. Transit providers must provide bilingual information materials, so that this population is able to successfully and equitably use provided services.
16 APTA Millennials & Mobility: Understanding the Millennial Mindset 17 U.S. Census and American Community Survey. 18 MnDOT. Minnesota Statewide Multimodal Transportation Plan: Demographic Trends in Minnesota.
Nelson\Nygaard Consulting Associates, Inc. | 12
Greater Minnesota Transit Investment Plan TM#5: Trends & Opportunities | FINAL
Figure 9 Metro County and Greater Minnesota Spanish, Hmong, and African Language Speakers
Source: Minnesota Statewide Multimodal Transportation Plan: Demographic Trends in Minnesota, 2013
The population of foreign born individuals is increasing. Between 2000 and 2014, the number of foreign-born residents in Greater Minnesota increased 53% from 53,527 to 81,732. This increase is greater than the national trend, which saw a 32% increase in foreign-born citizens over the same period.19
Among Minnesota’s foreign-born population, the top three geographies of origin include Asia (36.4%), non-U.S. North America (20%), and Africa (18.5%). Immigrants are less likely to use a car for their transportation needs.20 Transit providers may need to consider providing information and services in additional languages if the immigrant population continues to increase.
GREATER MINNESOTA’S HOUSEHOLDS ARE CHANGING
Female heads of household are rarer in Greater Minnesota than nationally, but still increased. In Greater Minnesota, female heads of household increased 29% from 63,448 to 81,574 from 2000 to 2014.21 This compares to a 92% national increase in female householders over the same period.22 Although Greater Minnesota trends are lower than average nationally, this still represents a significant jump. Women make up a larger percent of Greater Minnesota transit
19 U.S. Census and American Community Survey. 20 MnDOT. Minnesota Statewide Multimodal Transportation Plan: Demographic Trends in Minnesota. 21 U.S. Census and American Community Survey. 22 Ibid.
Nelson\Nygaard Consulting Associates, Inc. | 13
Greater Minnesota Transit Investment Plan TM#5: Trends & Opportunities | FINAL
riders than men, meaning this demographic change may be affecting current transit riders. Even as the head of household, women are often still in charge of running the household and managing child care. A barrier to transit often voiced during stakeholder interviews was that people need to “trip chain” or get from work to the grocery story to child care to home – a chain that is difficult to achieve on demand-response service present in much of Greater Minnesota. This trend of more women who not only work demanding jobs as head of household but also must run the home can deter ridership on current transit systems.
The number of households with older adults in Greater Minnesota counters national trends. Nationwide, the number of older adults as head of household increased 19%, while the number of households with at least one person over 65 increased 23%. Greater Minnesota saw an increase in number of older adults heading their household (10%), but a decrease in number of households with at least one person over 65 (-14%).23 This suggests that more older adults may be in group quarters since that age cohort overall continues growing.
The national discussion surrounding the repercussions of the aging population and housing needs is a pressing one in Greater Minnesota, especially given the projected increased in the older adult population discussed earlier. Surveys and research have shown that people want to stay in their homes as long as possible; however, health and other factors sometimes require people to move into assisted living quarters. While research thus far is not conclusive, initial studies by the US Department of Housing and Urban Development authority point out that people who can age in place have better overall physical and mental health.24 Providing public transportation to serve older adult households has been identified as a missing link in the services network for the aging population. An article published in the Rural Minnesota Journal suggests a regional, multi-county effort needed to prepare Greater Minnesota for the rapid rise of older adults.25
More people are living in nonfamily households. Nonfamily households increased from 2000 to 201, both nationally (17%) and in Greater Minnesota (19%).26 A nonfamily household is defined as a household containing only one person, the householder, or additional persons who are not relatives of the householder. This population is significant because nonfamiliy households are traditionally more mobile than family households, and therefore have a greater propensity to use multiple modes of transportation for their trips, including transit.
23 U.S. Census and American Community Survey. 24 US Department of Housing and Urban Development. https://www.huduser.gov/portal/periodicals/em/fall13/highlight2.html. 25Knatterud, LaRhea. “Long-Term Care in Greater Minnesota.” Rural Minnesota Journal. http://www.ruralmn.org/wp-content/uploads/2011/03/Long-term-Care-in-Greater-Minnesota.pdf, page 111. 26 U.S. Census and American Community Survey.
Nelson\Nygaard Consulting Associates, Inc. | 14
Greater Minnesota Transit Investment Plan TM#5: Trends & Opportunities | FINAL
Households are becoming smaller. The average household size has increased 2% nationally from 2000 to 2014. This trend is not reflected in Greater Minnesota, where the average household size has decreased 4% between 2000 and 2014 from 2.48 to 2.39 people per household.27
The decreasing household size and increasing population indicates a future need for more housing units, which has the potential to influence transit capacity needs in high density areas as well as transit access needs in areas with low-density residential.
PEOPLE WITH DISABILITIES
The population of people with disabilities is increasing. The number of people with disabilities is trending in opposite directions between Greater Minnesota and the United States. The number of people with disabilities in the United States declined 31% between 2000 and 2014, while increasing 21% in greater Minnesota during the same period.28
Those with disabilities frequently depend on transit to provide them with equitable accessibility options to services. As the population of people with disabilities increases, the capacity of providers serving them must also increase in order to satisfy demand as required by the Federal Transit Administration to provide ADA service complementary to fixed-routes and to provide equitable access per the Olmstead Act.29 Given the rise of older adults combined with people with disabilities, greater coordination will be needed between the Office of Transit and human services agencies. Public transit cannot always transport extremely frail individuals or those with severe disabilities; therefore, specialized transportation options must be available to ensure mobility for all.
27 U.S. Census and American Community Survey. 28 Ibid. 29 Federal Transit Administration Circular FTA C 4710.1
Nelson\Nygaard Consulting Associates, Inc. | 15
Greater Minnesota Transit Investment Plan TM#5: Trends & Opportunities | FINAL
3 ECONOMIC TRENDS Many aspects of Greater Minnesota’s economy affect the need and demand for transit, such as income levels, employment sectors, and changes to technology. An increase in poverty as a lingering effect of the 2008 recession potentially increases the population that has difficulty affording a personal vehicle and is most in need of access to jobs and to other services. Rates of employment speak to the market of frequent transit customers – since most people travel to work five days per week, a transit system that meets employment needs can capture a large number of frequent riders. The sectors of employment matter in terms of when people need to travel. Second and third shifts, common to Minnesota’s manufacturing sectors, for example, require late night and early morning travel. Lastly, the development of a sharing economy that uses technology to broker trips and potentially even drive vehicles changes transportation behavior.
POVERTY RATES
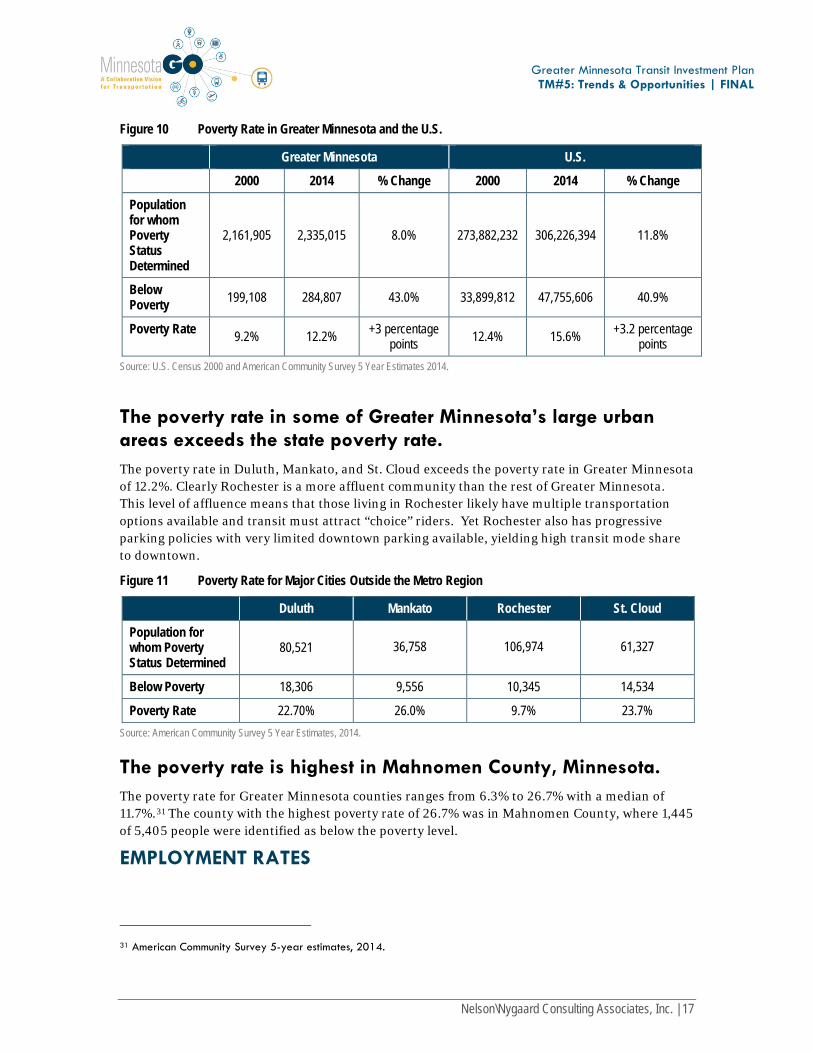
The poverty rate in Greater Minnesota has followed the national trend. In 2014, the U.S. poverty rate was 15.6% compared to a poverty rate of 12.2% in Greater Minnesota.30 This follows the national trend of rising by 3 percentage points from 2000 to 2014. The poverty rate affects transit demand as this population typically has lower rates of automobile access and use and is more likely to take transit.
30 American Community Survey 5-year estimates, 2014.
Nelson\Nygaard Consulting Associates, Inc. | 16
Greater Minnesota Transit Investment Plan TM#5: Trends & Opportunities | FINAL
Figure 10 Poverty Rate in Greater Minnesota and the U.S.
Greater Minnesota U.S.
2000 2014 % Change 2000 2014 % Change
Population for whom Poverty Status Determined
2,161,905 2,335,015 8.0% 273,882,232 306,226,394 11.8%
Below Poverty 199,108 284,807 43.0% 33,899,812 47,755,606 40.9%
Poverty Rate 9.2% 12.2% +3 percentage points 12.4% 15.6% +3.2 percentage
points Source: U.S. Census 2000 and American Community Survey 5 Year Estimates 2014.
The poverty rate in some of Greater Minnesota’s large urban areas exceeds the state poverty rate. The poverty rate in Duluth, Mankato, and St. Cloud exceeds the poverty rate in Greater Minnesota of 12.2%. Clearly Rochester is a more affluent community than the rest of Greater Minnesota. This level of affluence means that those living in Rochester likely have multiple transportation options available and transit must attract “choice” riders. Yet Rochester also has progressive parking policies with very limited downtown parking available, yielding high transit mode share to downtown.
Figure 11 Poverty Rate for Major Cities Outside the Metro Region
Duluth Mankato Rochester St. Cloud
Population for whom Poverty Status Determined
80,521 36,758 106,974 61,327
Below Poverty 18,306 9,556 10,345 14,534
Poverty Rate 22.70% 26.0% 9.7% 23.7% Source: American Community Survey 5 Year Estimates, 2014.
The poverty rate is highest in Mahnomen County, Minnesota. The poverty rate for Greater Minnesota counties ranges from 6.3% to 26.7% with a median of 11.7%.31 The county with the highest poverty rate of 26.7% was in Mahnomen County, where 1,445 of 5,405 people were identified as below the poverty level.
EMPLOYMENT RATES
31 American Community Survey 5-year estimates, 2014.
Nelson\Nygaard Consulting Associates, Inc. | 17
Greater Minnesota Transit Investment Plan TM#5: Trends & Opportunities | FINAL
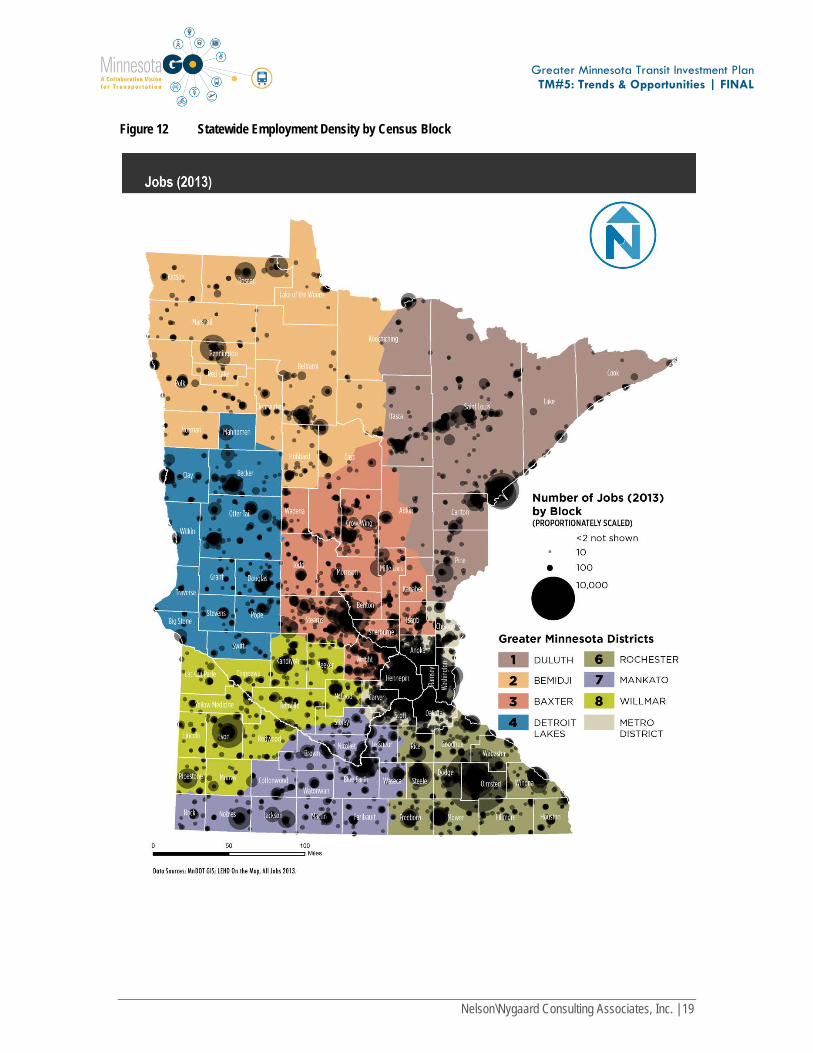
Jobs continue to grow throughout Greater Minnesota since the 2007-2009 recession. Central Minnesota has more jobs than any region outside of the Twin Cities –approximately 1 in every 10 jobs is located in this district, as defined by the Minnesota Department of Employment and Economic Development. The Central Minnesota region includes 12 counties in Greater Minnesota (Benton, Isanti, Kanabec, Kandiyohi, McLeod, Meeker, Mille Lacs, Pine, Renville, Sherburne, Stearns and Wright) and 1 county in the Metro District (Chisago).
Northwest and Southeast Minnesota have surpassed their pre-recessionary employment levels.32
Northwest Minnesota includes 26 counties (Becker, Beltrami, Cass, Clay, Clearwater, Crow Wing, Douglas, Grant, Hubbard, Kittson, Lake of the Woods, Mahnomen, Marshall, Morrison, Norman, Otter Tail, Pennington, Polk, Pope, Red Lake, Roseau, Stevens, Todd, Traverse, Wadena, and Wilkin) and Southeast Minnesota contains 11 counties (Dodge, Fillmore, Freeborn, Goodhue, Houston, Mower, Olmsted, Rice, Steele, Wabasha, and Winona).33
As shown in Figure 1112, many of the state’s largest employers are located in the Twin Cities region, but considerable nodes of employment density exist around Greater Minnesota’s largest cities such as Rochester, Duluth, St. Cloud, and Mankato.
32 Minnesota Department of Employment and Economic Development. June 2015. Minnesota Economic Trends. Retrieved from http://mn.gov/deed/newscenter/publications/trends/june-2015/index.jsp
33 Minnesota Department of Employment and Economic Development. Regional Labor Markets. http://mn.gov/deed/data/regional-lmi/
Nelson\Nygaard Consulting Associates, Inc. | 18
Greater Minnesota Transit Investment Plan TM#5: Trends & Opportunities | FINAL
Figure 12 Statewide Employment Density by Census Block
Nelson\Nygaard Consulting Associates, Inc. | 19
Greater Minnesota Transit Investment Plan TM#5: Trends & Opportunities | FINAL
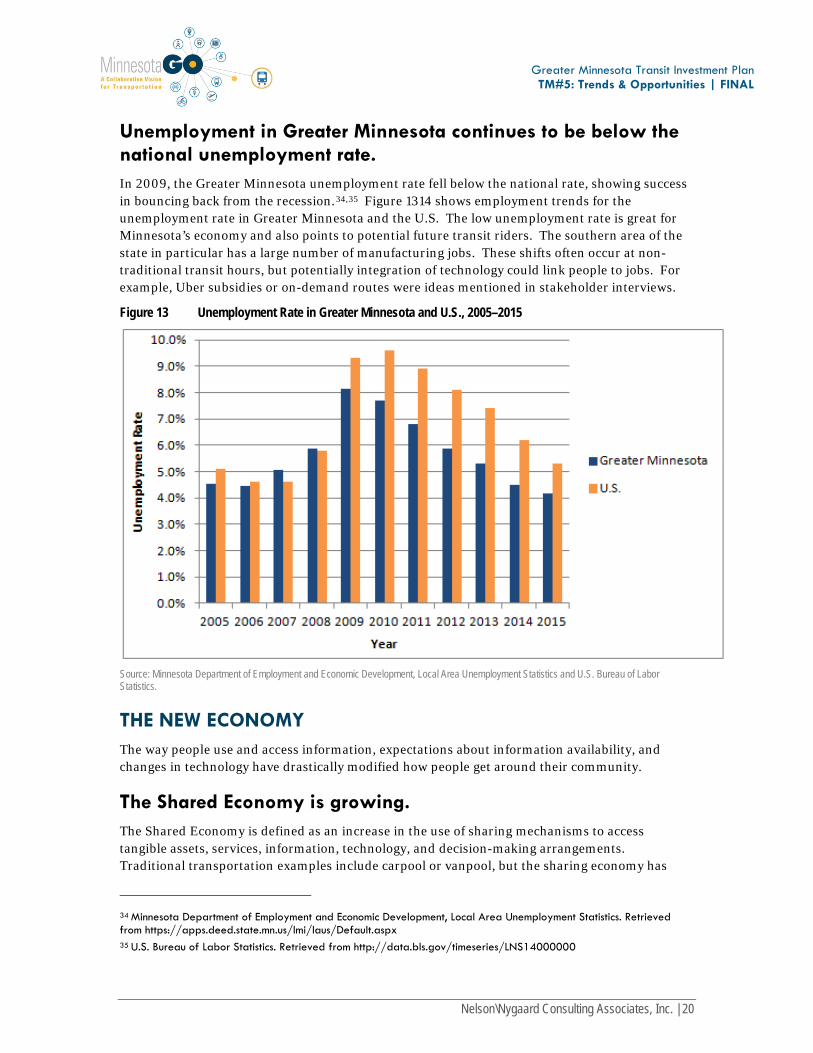
Unemployment in Greater Minnesota continues to be below the national unemployment rate. In 2009, the Greater Minnesota unemployment rate fell below the national rate, showing success in bouncing back from the recession.34,35 Figure 1314 shows employment trends for the unemployment rate in Greater Minnesota and the U.S. The low unemployment rate is great for Minnesota’s economy and also points to potential future transit riders. The southern area of the state in particular has a large number of manufacturing jobs. These shifts often occur at non-traditional transit hours, but potentially integration of technology could link people to jobs. For example, Uber subsidies or on-demand routes were ideas mentioned in stakeholder interviews.
Figure 13 Unemployment Rate in Greater Minnesota and U.S., 2005–2015
Source: Minnesota Department of Employment and Economic Development, Local Area Unemployment Statistics and U.S. Bureau of Labor Statistics.
THE NEW ECONOMY The way people use and access information, expectations about information availability, and changes in technology have drastically modified how people get around their community.
The Shared Economy is growing. The Shared Economy is defined as an increase in the use of sharing mechanisms to access tangible assets, services, information, technology, and decision-making arrangements. Traditional transportation examples include carpool or vanpool, but the sharing economy has
34 Minnesota Department of Employment and Economic Development, Local Area Unemployment Statistics. Retrieved from https://apps.deed.state.mn.us/lmi/laus/Default.aspx
35 U.S. Bureau of Labor Statistics. Retrieved from http://data.bls.gov/timeseries/LNS14000000
Nelson\Nygaard Consulting Associates, Inc. | 20
Greater Minnesota Transit Investment Plan TM#5: Trends & Opportunities | FINAL
expanded beyond that to include bike-sharing, short term car rental, peer-to-peer car-sharing, peer-to-peer ridesharing, and transportation providers that use mobile apps to link potential passengers with transportation. An example of how the sharing economy is exhibited in Greater Minnesota includes integration of Zimride, an online service that connects drivers to those looking for rides. Zimride has been established for the University of Minnesota at Morris and the College of Saint Benedict/Saint John’s University.36 Growth in the development and use of these services is particularly prevalent among Millennials.
Technology facilitates sharing of assets among peers. Technology, particularly smartphones and apps, has enabled the creation of systems for sharing information or resources. Sharing of assets or services among peer users is now much more feasible, enabling a person in need of a ride to connect with people who are willing to provide the ride. Other peer-to-peer services enable one car owner to rent their vehicle to someone else, or a visitor to rent a spare room or apartment from another individual. Use of these technologies is much more prevalent among Millennials, who are adept with technology and less able to shoulder the costs of car ownership.
Autonomous Vehicles Autonomous vehicles have numerous potential benefits for roadway users, such as safety, mobility, costs, and access.
Safety. Reducing (potentially completely removing) human error from vehicle operation can reduce the number and severity of roadway crashes.
Mobility. Without the need for a driver, automated cars can enhance mobility for everyone, particularly youth, persons with disabilities, and older adults.
Costs. Autonomous cars allow the car to come to the driver, which has the potential to decrease labor costs for services with a driver and increase access for users who do not live in a central urban region.
Access. With reduced transportation costs, people may be more willing to reside in areas far from central destinations or employment centers. Additionally, automated vehicles will have the ability to travel faster potentially increasing people’s willingness to travel longer distances.
Fully automated self driving vehicles are expected to be made available to consumers by 2025 but consumer acceptance remains an unknown element to the full adoption and integration of the technology.37 Regardless of public acceptance, the presence of autonomous vehicles will have a huge impact on the transit market. For years, advocates have promoted reduced emissions as a benefit of transit. Autonomous vehicles – especially when operating within a “smart” environment with vehicles and signals talking to each other – can potentially increase fuel economy by 15 percent by braking and accelerating in a smoother fashion and through less stop-and-go movements due to seamless signal timing. Matched with the upswing in electric vehicle ownership, transit advocates need to create new reasons why transit is still valuable. With the
36 MnDOT. Statewide Multimodal Plan: Transportation Behavior Changes. 37 David Levinson, Adam Boies, Jason Cao, Yingling Fan. The Transportation Futures Project: Planning for Technology Change. January 2016. Retrieved from http://www.aamva.org/PlanningForTechChanges_MNDOT_012016/
Nelson\Nygaard Consulting Associates, Inc. | 21
Greater Minnesota Transit Investment Plan TM#5: Trends & Opportunities | FINAL
potential for driverless transit vehicles comes the need to rethink the role of current transit agency staff.
Sharing of information makes transit more convenient and attractive. The sharing economy includes access to goods and services as well as information. Transportation can be much more user-friendly as a result of greatly improved real-time information. Transit vehicles equipped with GPS technology lets users know where a particular vehicle is and when it will arrive at a particular stop. The next generation of apps, such as Ridescout, connect multiple providers such as Car 2 Go, transit, bike share, and more. The next level of information integration lies in connecting peer-to-peer services with transit. The Dallas Area Rapid Transit (DART) agency was the first in the nation to integrate Uber into its own transit trip planner app, GoPass, meaning app users can call Uber directly from one app to address first-last mile hurdles.38
GENERATIONAL PREFERENCES The lifestyle preferences and buying habits of the nation’s largest generations also affects economic trends. Nationwide, the population of older adults is increasing as the Baby Boomer generation ages. Baby Boomers represent about 27% of the U.S. population. Older adults (65+ years old) represent 16% of the total population in Greater Minnesota. While some Baby Boomers want to age in place, others are planning to downsize to smaller homes in communities where they can walk and use transit to get around. A 2013 survey by the National Association of Realtors found that 60% of Baby Boomers preferred to live in neighborhoods with a combination of shopping, restaurants, and parks, as compared to 35% who preferred traditional residential neighborhoods.
According to the 2014 American Community Survey, Millennials make up about to 26% of the Greater Minnesota population.39 Nationally, Millennials’ transportation patterns are changing. Millennials are:
Purchasing fewer cars. From 2007 to 2011, the number of cars purchased by 18 to 34- year-olds fell almost 30%.40
Driving less. People age 18 to 34 drove 23% fewer miles in 2009 than in 2001.41
Not obtaining their driver’s licenses. The percent of young people with a driver’s license is on the decline. According to the Federal Highway Administration, from 2000 to 2010, the share of 14 to 34-year-olds without a driver’s license increased from 21% to 26%.42
Biking, walking, and taking transit more. Millennials use transit, bicycle, and walk more than young people have in the past two decades.43 From 2001 to 2006, bike trips
38 http://siliconangle.com/blog/2015/04/15/dallas-integrates-uber-into-its-public-transportation-app/ 39 American Community Survey 5-Year Estimates, 2014. 40 American Public Transportation Association. “Millennials & Mobility: Understanding the Millennial Mindset.” http://www.apta.com/resources/reportsandpublications/Documents/APTA-Millennials-and-Mobility.pdf 41 Ibid 42 Federal Highway Administration, Highway Statistics 2010—Table DL-20, September 2011. 43 American Public Transportation Association. “Millennials & Mobility: Understanding the Millennial Mindset.”
Nelson\Nygaard Consulting Associates, Inc. | 22
Greater Minnesota Transit Investment Plan TM#5: Trends & Opportunities | FINAL
increased by 24% among 16-34 year olds.44 Between 2001 and 2009, the number of public transit passenger-miles traveled by this age group also increased by 40%.45
Placing more value on technology and access to technology. Millennials choose to spend resources on technology, such as smart phones, tablets and computers. New mobile apps provide easy trip planning tools and real time information. Transit systems that allow them to stay connected while they travel are highly valued.46
On the contrary, some research suggests that Millenials are driving less due to a decrease in trips overall. 47 Therefore a reduction in automobile use may be the result of Millenials increasingly going fewer places. Regardless of the current trends, Millennials clearly think about transportation differently than previous generations, and Baby Boomers are being forced to think differently due to physical limitations.
44 U.S. PIRG. “A New Direction.” 2013 http://uspirg.org/sites/pirg/files/reports/A%20New%20Direction%20vUS.pdf. 45 Ohio Department of Transportation. Statewide Transit Needs Study. Demographic Trend Analysis. 46 Ibid. In a survey administered by zipcar, 25% of those18 to 34 reported that mobile transportation apps (such as taxi apps, real-time transit information, and car sharing) had reduced their driving frequency, compared with only 9% of those 55 and older. 47 Noreen C. McDonald. Journal of the American Planning Association. Are Millennials Really the “Go-Nowhere” Generation? July 2015. Retrieved from http://dx.doi.org/10.1080/01944363.2015.1057196
Nelson\Nygaard Consulting Associates, Inc. | 23
Greater Minnesota Transit Investment Plan TM#5: Trends & Opportunities | FINAL
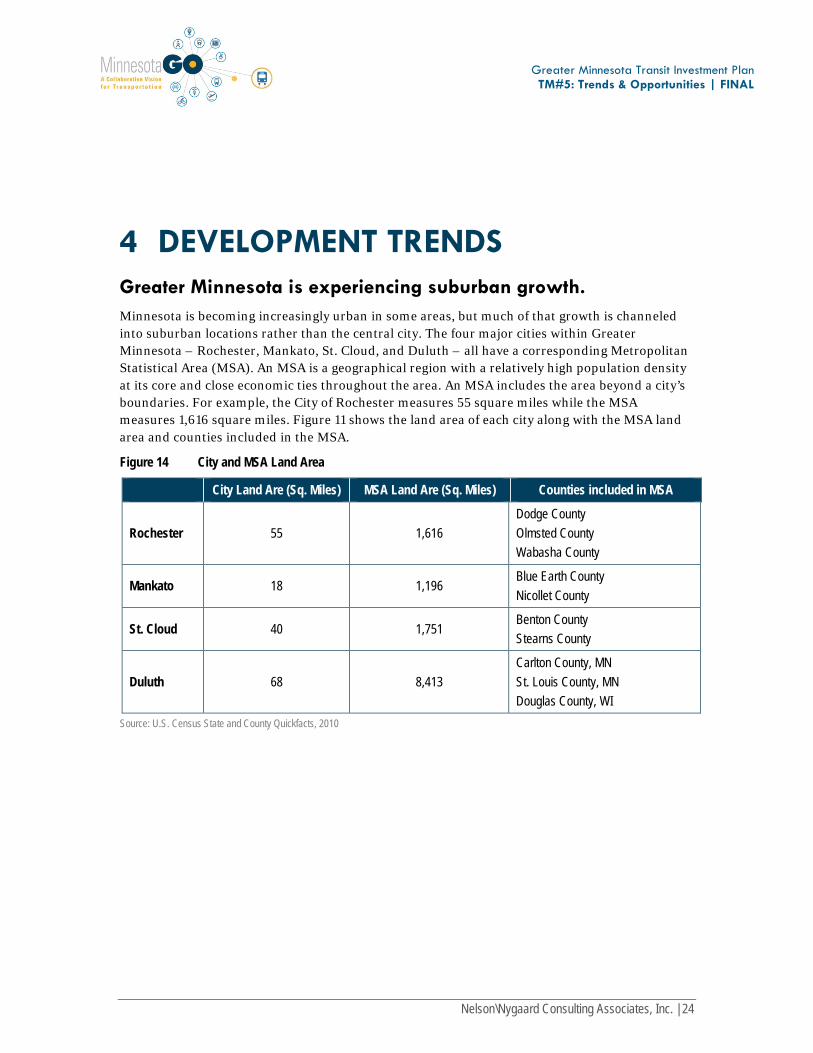
4 DEVELOPMENT TRENDS Greater Minnesota is experiencing suburban growth. Minnesota is becoming increasingly urban in some areas, but much of that growth is channeled into suburban locations rather than the central city. The four major cities within Greater Minnesota – Rochester, Mankato, St. Cloud, and Duluth – all have a corresponding Metropolitan Statistical Area (MSA). An MSA is a geographical region with a relatively high population density at its core and close economic ties throughout the area. An MSA includes the area beyond a city’s boundaries. For example, the City of Rochester measures 55 square miles while the MSA measures 1,616 square miles. Figure 11 shows the land area of each city along with the MSA land area and counties included in the MSA.
Figure 14 City and MSA Land Area
City Land Are (Sq. Miles) MSA Land Are (Sq. Miles) Counties included in MSA
Rochester 55 1,616 Dodge County Olmsted County Wabasha County
Mankato 18 1,196 Blue Earth County Nicollet County
St. Cloud 40 1,751 Benton County Stearns County
Duluth 68 8,413 Carlton County, MN St. Louis County, MN Douglas County, WI
Source: U.S. Census State and County Quickfacts, 2010
Nelson\Nygaard Consulting Associates, Inc. | 24
Greater Minnesota Transit Investment Plan TM#5: Trends & Opportunities | FINAL
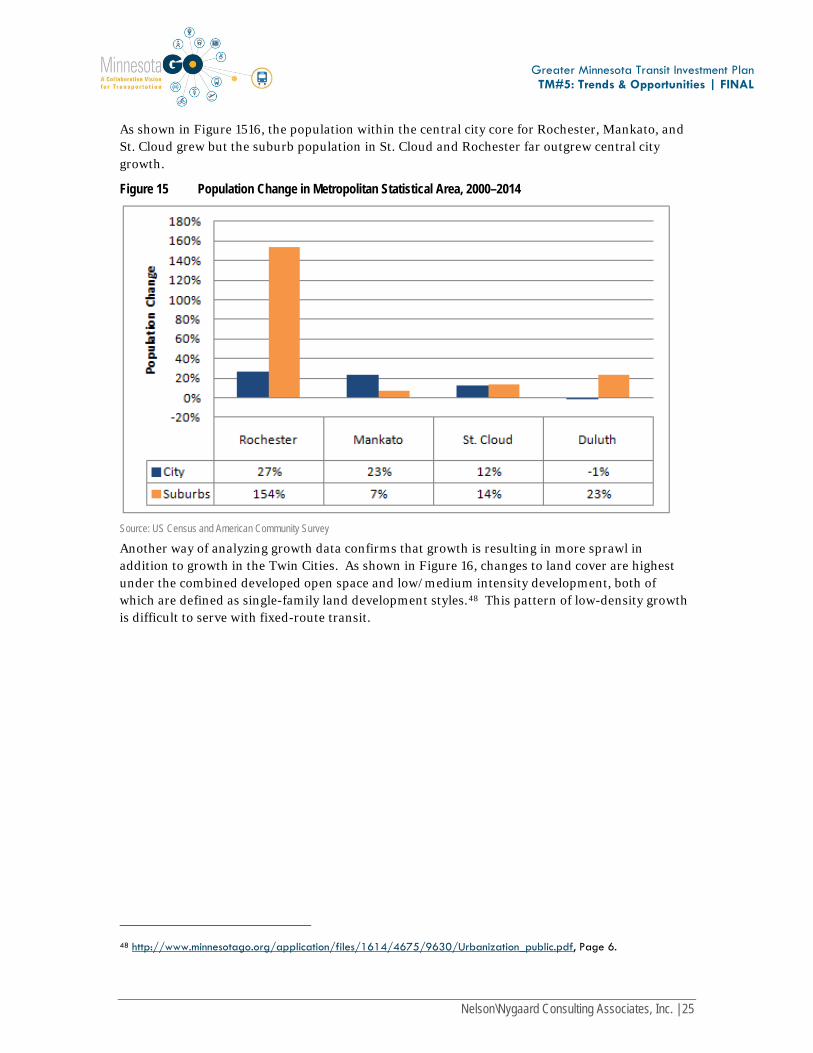
As shown in Figure 1516, the population within the central city core for Rochester, Mankato, and St. Cloud grew but the suburb population in St. Cloud and Rochester far outgrew central city growth.
Figure 15 Population Change in Metropolitan Statistical Area, 2000–2014
Source: US Census and American Community Survey
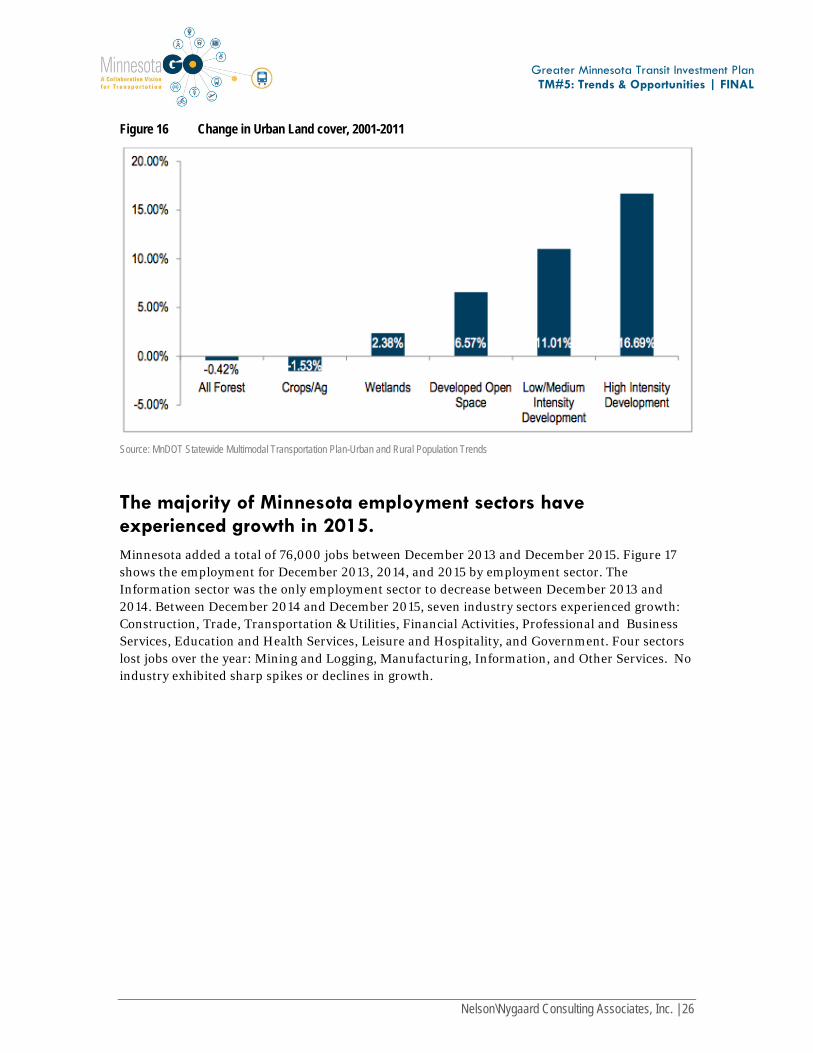
Another way of analyzing growth data confirms that growth is resulting in more sprawl in addition to growth in the Twin Cities. As shown in Figure 16, changes to land cover are highest under the combined developed open space and low/medium intensity development, both of which are defined as single-family land development styles.48 This pattern of low-density growth is difficult to serve with fixed-route transit.
48 http://www.minnesotago.org/application/files/1614/4675/9630/Urbanization_public.pdf, Page 6.
Nelson\Nygaard Consulting Associates, Inc. | 25
Greater Minnesota Transit Investment Plan TM#5: Trends & Opportunities | FINAL
Figure 16 Change in Urban Land cover, 2001-2011
Source: MnDOT Statewide Multimodal Transportation Plan-Urban and Rural Population Trends
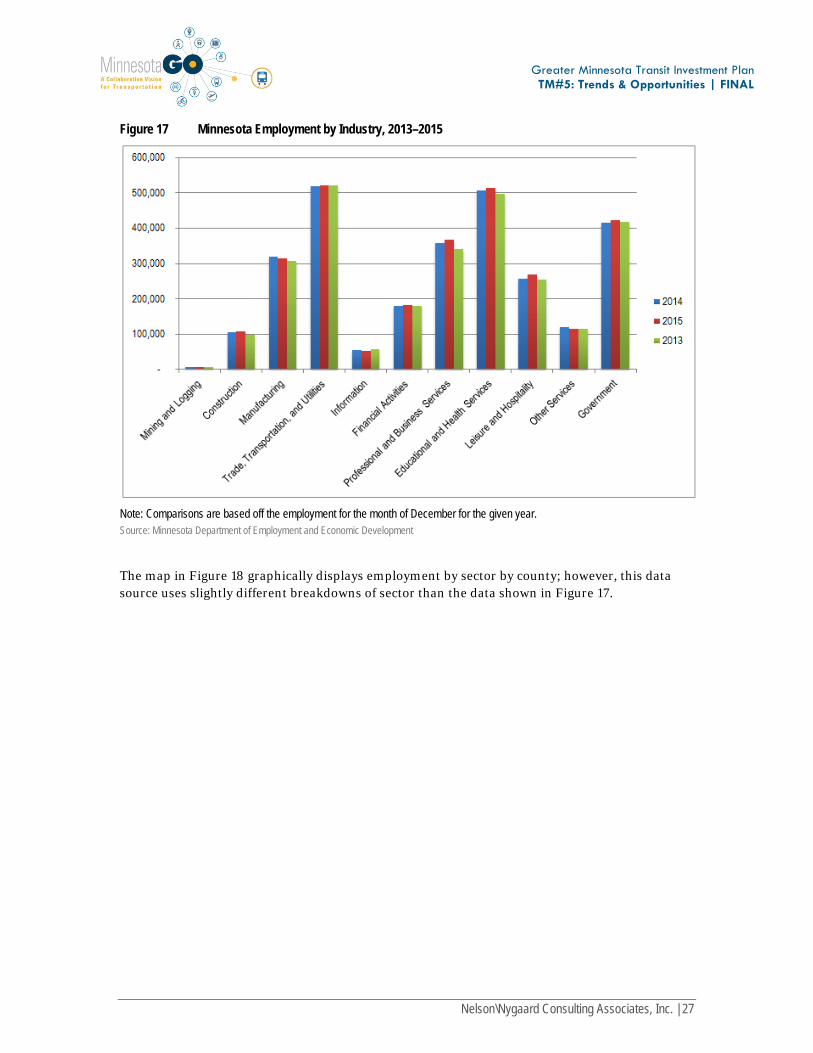
The majority of Minnesota employment sectors have experienced growth in 2015. Minnesota added a total of 76,000 jobs between December 2013 and December 2015. Figure 17 shows the employment for December 2013, 2014, and 2015 by employment sector. The Information sector was the only employment sector to decrease between December 2013 and 2014. Between December 2014 and December 2015, seven industry sectors experienced growth: Construction, Trade, Transportation & Utilities, Financial Activities, Professional and Business Services, Education and Health Services, Leisure and Hospitality, and Government. Four sectors lost jobs over the year: Mining and Logging, Manufacturing, Information, and Other Services. No industry exhibited sharp spikes or declines in growth.
Nelson\Nygaard Consulting Associates, Inc. | 26
Greater Minnesota Transit Investment Plan TM#5: Trends & Opportunities | FINAL
Figure 17 Minnesota Employment by Industry, 2013–2015
Note: Comparisons are based off the employment for the month of December for the given year. Source: Minnesota Department of Employment and Economic Development
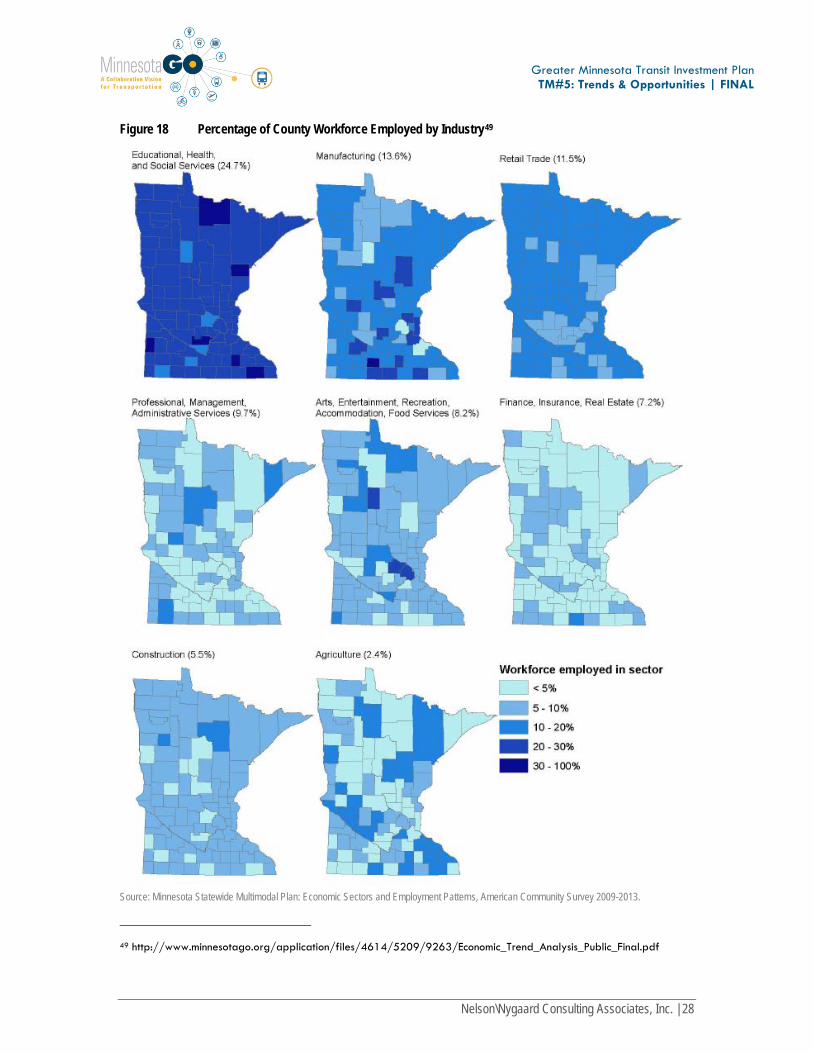
The map in Figure 18 graphically displays employment by sector by county; however, this data source uses slightly different breakdowns of sector than the data shown in Figure 17.
Nelson\Nygaard Consulting Associates, Inc. | 27
Greater Minnesota Transit Investment Plan TM#5: Trends & Opportunities | FINAL
Figure 18 Percentage of County Workforce Employed by Industry49
Source: Minnesota Statewide Multimodal Plan: Economic Sectors and Employment Patterns, American Community Survey 2009-2013.
49 http://www.minnesotago.org/application/files/4614/5209/9263/Economic_Trend_Analysis_Public_Final.pdf
Nelson\Nygaard Consulting Associates, Inc. | 28
Greater Minnesota Transit Investment Plan TM#5: Trends & Opportunities | FINAL
Transit infrastructure and policies in Greater Minnesota should support public health. The link between transportation and public health has become prominent through a variety of factors such as:
Pollution. The transportation sector is the second biggest source of greenhouse gas emissions, which can heighten the risk of asthma and other respiratory problems and also contributes to climate change.
Access to health care. Reliable transportation means people can access medical services and receive preventive treatments that ward off chronic disease.
Physical activity rates. Active forms of transportation can increase physical activity and reduce obesity and the risk of heart attack. This is particularly relevant for Minnesota where heart disease is the second most common cause of death.50
Transportation investments in walking, bicycling, and transit infrastructure and programs can lead to positive public health outcomes in a variety of ways. While walking and biking more obviously contribute to an increase in physical activity, transit trips also usually involve walking at either end of the trip or the destination.
Policies and practices in community design, land use, and facility access focused on active transportation have been proven effective to increase physical activity.51 Many communities in Minnesota are working to provide safe and convenient opportunities for active transportation modes as well as improved access to public transit through:
Sidewalks, walking paths, and bike facilities
Safe and convenient pedestrian street crossing features (e.g. crosswalks, stop signs, or stop lights)
Motorist traffic calming and speed-reduction measures
Street landscaping and pedestrian-level street lighting
Bike racks, lockers, or other bike parking and storage facilities
Land use development patterns to locate homes, worksites, schools, stores and other community services and amenities within reasonable walking distances (pedestrian-oriented development) and within easy access to transit (transit-oriented development)
Signage that helps pedestrians and bicyclists navigate to their destinations52
Robust public transit is a key component in an active transportation network. Messaging and information around transit should include health benefits as a reason for investment.
50 Minnesota Statewide Multimodal Transportation Plan: Trends Analysis Summary. 51 Minnesota Department of Health. Physical Activity: Active Transportation. Retrievd from http://www.health.state.mn.us/divs/hpcd/chp/cdrr/physicalactivity/activetrans.html 52 Minnesota Department of Health. Active Transportation. Retrieved from http://www.health.state.mn.us/divs/hpcd/chp/cdrr/physicalactivity/docs/promotingactivecommunitiesfactsheet.pdf
Nelson\Nygaard Consulting Associates, Inc. | 29
Greater Minnesota Transit Investment Plan TM#5: Trends & Opportunities | FINAL
5 EFFECTS ON PUBLIC TRANSPORTATION
Trends affecting transit service are summarized below.
DEMOGRAPHICS People in Greater Minnesota will remain spread out. Population is not set to
increase greatly, meaning very rural areas will likely remain very rural. Household size has decreased, meaning service reaches less people per mile provided.
Urban area population is increasing. Population in urban areas keeps rising. Access to transit and vibrant walkable/bikeable neighborhoods in city centers has made urban living more attractive to Millennials and older adults alike. With increased density arises opportunity to enhance urban services.
Increase in foreign population. Transit providers must provide bilingual information materials, so that foreign born and non-English speaking populations have equitable access to transit services.
New family definition. Smaller household size and larger nonfamily households redefines how outreach is conducted to a household, or the viability of “family” transit passes. Combined with the increasing population, an increase in housing units has potential to influence transit capacity and access needs. As female heads of household increase, accommodating trip chaining to multiple destinations is needed to attract and retain riders.
Large population of people with disabilities. Greater Minnesota has a very high percent of people with disabilities. These populations require accessible vehicles and meeting increasing demand over time must be achieved through partnerships with state human services agencies.
ECONOMY People in poverty lower than nationally. Greater Minnesota’s percent of population
in poverty remains lower than the United States overall. The Greater Minnesota economy has fared well. Unemployment rates bounced
back after the recession and are lower than the national average.
Nelson\Nygaard Consulting Associates, Inc. | 30
Greater Minnesota Transit Investment Plan TM#5: Trends & Opportunities | FINAL
The new economy is shifting transit demands. New forms of technology have spurred a sharing economy that has facilitated the development of new forms of transit contributing to a decrease in driving. Autonomous cars are likely to further affect this in the future.
Millennials and Baby Boomer are driving less and/or contributing to a decrease in driving. Both generations exhibit similar patterns of wanting to live in walkable communities and choosing to take transit, walk, or bicycle rather than drive.
DEVELOPMENT Suburban development pattern continues. While urban area population is
growing, much of that population is occurring outside the central city, expanding where transit needs to reach.
Job diversification with varied shift times. In certain parts of the state, manufacturing jobs are declining while in other areas it shows increases. These jobs have various shift times including first, second, and third shifts that are challenging for transit agencies. Growth in health care and professional services could mean an increase in those commuting during typical 9-5 hours. Schedules for service sector jobs, particularly late evenings and weekends, can be challenging to coordinate with transit.
Public health should be considered for future transit investments. Transportation investments in walking, bicycling, and transit infrastructure and programs can increase physical activity and support access to public transit.
Nelson\Nygaard Consulting Associates, Inc. | 31


![Saint Francis Xavier ParishNov 25, 2018 · Briefly, Wikipedia says, it was a “slow decline [that] occurred over a period of roughly 320 years, culminating on September 4, 476,](https://img.pdfslide.us/doc/110x75/5eaecc917a7a500eec727046/saint-francis-xavier-parish-nov-25-2018-briefly-wikipedia-says-it-was-a-aoeslow.jpg)