Embed Size (px)
Citation preview

Q1 2010 Investor Presentation
MARCH 2015 THE BANK OF NEW YORK MELLON

Q1 2010 Investor Presentation
Disclaimer
Marcato Capital Management LP (“Marcato”) is an SEC-registered investment adviser based in San Francisco, California. Marcato provides investment advisory services to its proprietary private investment funds and to certain funds and accounts pursuing a single investment idea (each a “Marcato Fund” collectively, the “Marcato Funds”).
This presentation with respect to The Bank of New York Mellon (the “Presentation”) is for informational purposes only and it does not have regard to the specific investment objective, financial situation, suitability or particular need of any specific person who may receive the Presentation, and should not be taken as advice on the merits of any investment decision. The views expressed in the Presentation represent the opinions of Marcato, and are based on publicly available information and Marcato analyses. Certain financial information and data used in the Presentation have been derived or obtained from filings made with the Securities and Exchange Commission (“SEC”) by the issuer or other companies that Marcato considers comparable. Marcato has not sought or obtained consent from any third party to use any statements or information indicated in the Presentation as having been obtained or derived from a third party. Any such statements or information should not be viewed as indicating the support of such third party for the views expressed in the Presentation. Information contained in the Presentation has not been independently verified by Marcato, and Marcato disclaims any and all liability as to the completeness or accuracy of the information and for any omissions of material facts. Marcato undertakes no obligation to correct, update or revise the Presentation or to otherwise provide any additional materials. Neither Marcato nor any of its affiliates makes any representation or warranty, express or implied, as to the accuracy, fairness or completeness of the information contained herein and the recipient agrees and acknowledges that it will not rely on any such information.
The Presentation may contain forward-looking statements which reflect Marcato’s views with respect to, among other things, future events and financial performance. Forward-looking statements are subject to various risks and uncertainties and assumptions. If one or more of the risks or uncertainties materialize, or if Marcato’s underlying assumptions prove to be incorrect, the actual results may vary materially from outcomes indicated by these statements. Accordingly, forward-looking statements should not be regarded as a representation by Marcato that the future plans, estimates or expectations contemplated will ever be achieved.
The securities or investment ideas listed are not presented in order to suggest or show profitability of any or all transactions. There should be no assumption that any specific portfolio securities identified and described in the Presentation were or will be profitable. Under no circumstances is the Presentation to be used or considered as an offer to sell or a solicitation of an offer to buy any security, nor does the Presentation constitute either an offer to sell or a solicitation of an offer to buy any interest in the Marcato Funds. Any such offer would only be made at the time a qualified offeree receives the Confidential Explanatory Memorandum of a Marcato Fund. Any investment in the Marcato Funds is speculative and involves substantial risk, including the risk of losing all or substantially all of such investment.
Marcato may change its views or its investment positions described in the Presentation at any time as it deems appropriate. Marcato may buy or sell or otherwise change the form or substance of any of its investments in any manner permitted by law and expressly disclaims any obligation to notify the market, a recipient of the Presentation or any other party of any such changes.
This document is confidential and intended solely for the addressee and may not be published or distributed without the express written consent of Marcato. This document is not intended for public use or distribution.
< 1 >

Q1 2010 Investor Presentation
Table of Contents
I. Executive Summary
II. Good Franchise In A Historically Good Business
III. The World Has Changed
IV. Poor Management Through A Changing Environment
V. No New Ideas For A Better Future
VI. Case Study: JPM 2015 Investor Day
VII. Unlocking Potential: Bold Action and New Ideas
A. Common Sense Principles
B. Business Opportunities
VIII. Unlocking Potential: New Leadership
IX. Valuation
< 2 >
Q1 2010 Investor Presentation
I. Executive Summary
< 3 >

Q1 2010 Investor Presentation
Executive Summary
1. BNY Mellon has a good franchise in what has been a good business
2. But the world has changed...
i. Low rates and volatility pressuring revenues (permanent?)
ii. Regulatory environment imposing new capital charges and operating burdens (permanent)
3. Management has done a poor job creating value through this changing environment and offers no new ideas for facing current and future challenges
4. BNY Mellon will not reach its potential with small, incremental adjustments but requires bold action and new ideas
5. New leadership will be necessary to conceive and execute the strategies necessary to compete in this new world
< 4 >

Q1 2010 Investor Presentation
Executive Summary
New Leadership Will Have Numerous Opportunities For Improvement:
1. Reconsider Value Proposition to Core Investment Servicing Customers
2. Raise IT Effectiveness to Top Company Priority
3. Reduce Headcount Aggressively
4. Reposition Asset Management
5. Establish Culture of Effectiveness, Urgency, and Accountability
6. Upgrade Regulatory Sophistication and Outreach
7. Refresh the Bank of New York Brand
< 5 >
Successful execution against this plan will produce a more powerful franchise with higher growth, a more efficient expense base, higher returns on capital, and a
market value that is more than double the current price

Q1 2010 Investor Presentation
II. Good Franchise In A Historically Good Business
< 6 >

Q1 2010 Investor Presentation
Leading Market Share in a Concentrated Industry
Source: Company filings, Marcato estimates, Wall Street and third-party researchNote: Estimated as of March 31, 2014
BK is a leading global custodian and operates in an industry dominated by three major global custodians (BNY Mellon, State Street, JP Morgan)Large client base drives high transaction volumes and economies of scale
< 7 >
Global Assets Under Custody Global Assets Under Administration
BNY Mellon, 19%
State Street, 14%
JP Morgan, 14%
Citi, 10%
BNP Paribas, 6%
Other, 37%
State Street, 22%
JP Morgan, 22%
BNY Mellon, 11%
HSBC, 9%
IFDS, 6%
Other, 30%
~$150 trillion market ~$30 trillion market

Q1 2010 Investor Presentation
Mission Critical, Trust-based Services To Customers Create Barriers to Entry
Large providers can leverage economies of scale to deliver custody services at significantly lower costs than small competitors § Custody involves large fixed costs to build out each processing service for the first customer
of that service
< 8 >
Economies of Scale
Preference to centralize back office with a single custody bank provider to maintain centralized oversight of operationsCustomers build their back-office infrastructure around the custodian Significant time and resources required to establish a custodial service relationship (3 month on-boarding process)Low customer attrition with average asset servicing relationships greater than a decadeLegally enforceable multiyear service contractsMission critical services at a small price in relation to the assets of its clients (.01% of assets)
High Switching Costs / Sticky Client Relationships

Q1 2010 Investor Presentation
Investment Servicing is a Business Process Outsourcing (“BPO”) Service
< 9 >
TraditionalBusiness Process
OutsourcerAsset Custodian
Specialization In Non-core Processes Yes Yes
Fixed-to-Variable Cost Conversion Yes Yes
Offshore Labor Inputs Yes Yes
Technology-Based Solutions Yes Yes
Differentiation Through Service Quality Yes Yes
Multi-year Contracts Yes Yes

Q1 2010 Investor Presentation
Attractive Fee-Based Business Model
BK primarily generates revenue from fees rather than net interest marginCounter-cyclical elements in fee revenue mitigate the impact of severe market downturns and provide earnings stability
< 10 >
Revenue Mix(1)
Source: Company filings; As of FY14Note: 2007 adjusted for 6 mos. of Mellon Financial (1) Adjusted for gains on sale of Wing Hang and One Wall Street building
Total Fee Revenue (2008 Financial Crisis)
$11,897 $12,342
$4,000
$7,000
$10,000
$13,000
2007 2008
Securities servicing Asset and wealth managementFX and other trading activities Other
-8%
+62%
-10%
+6%
FX volatility
Securities lending spreads
and volumes
+4%
Asset management
fees26%
Investment servicing
fees52%
Net interest revenue
19%
Other3%
Q1 2010 Investor Presentation
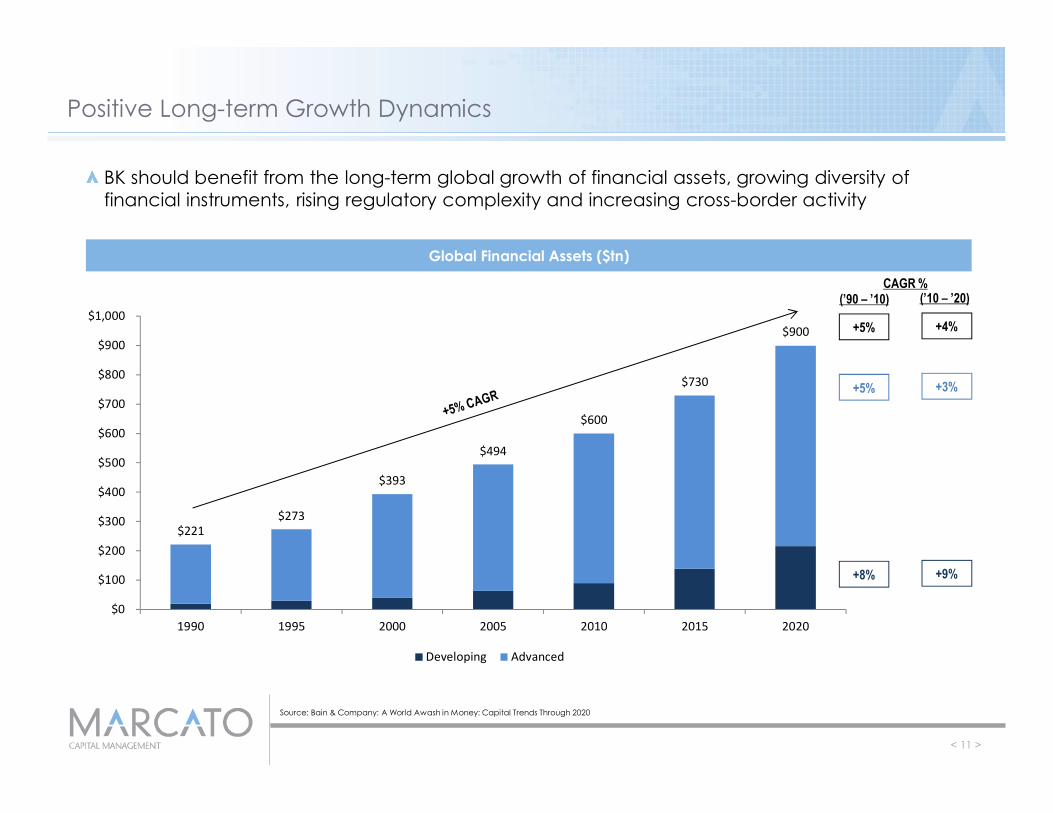
Positive Long-term Growth Dynamics
Source: Bain & Company: A World Awash in Money: Capital Trends Through 2020
BK should benefit from the long-term global growth of financial assets, growing diversity of financial instruments, rising regulatory complexity and increasing cross-border activity
< 11 >
Global Financial Assets ($tn)
$221 $273
$393
$494
$600
$730
$900
$0
$100
$200
$300
$400
$500
$600
$700
$800
$900
$1,000
1990 1995 2000 2005 2010 2015 2020
Developing Advanced
CAGR %(’90 – ’10) (’10 – ’20)
+5%
+5%
+8%
+4%
+3%
+9%

Q1 2010 Investor Presentation
Conservative Balance Sheet
BK’s balance sheet is primarily comprised of low-risk, short-duration assetsLoan accounts are a small and declining mix of total interest-earning assetsLow-yielding cash and interbank investments have accumulated on the balance sheet
< 12 >
Source: Company filings
Mix of Average Interest-Earning Assets
29% 38%
44% 44% 48% 43% 43% 45%
2%
1% 1% 2%
1% 2% 2% 2% 32%
30%
32% 34% 32% 38% 37% 35%
37% 31%
23% 21% 18% 17% 18% 18%
0%
10%
20%
30%
40%
50%
60%
70%
80%
90%
100%
2007 2008 2009 2010 2011 2012 2013 2014
Cash / interbank investments Trading account securities Securities Loans

Q1 2010 Investor Presentation
Conservative Balance Sheet: High-Quality Assets
BK’s loan portfolio has consistently experienced less charge-offs through a cycle than a typical commercial bankBK’s investment securities portfolio primarily consists of high-quality AAA / AA- rated securities
< 13 >
Loan Portfolio: Net Charge Off Ratio %
Source: Company filings, Wall Street research
Investment Securities Portfolio: Ratings Mix
87% 86% 87% 89% 89% 89% 90%
5% 3% 2% 5% 6% 5% 4% 8% 11% 11% 6% 5% 6% 6%
0%
20%
40%
60%
80%
100%
2008 2009 2010 2011 2012 2013 2014AAA / AA- A+ / A- Other
–
1.0%
2.0%
3.0%
4.0%
2008 2009 2010 2011 2012 2013 2014BK BAC WFC JPM

Q1 2010 Investor Presentation
Conservative Balance Sheet: Liabilities
BK’s assets are primarily funded by low-cost custody deposits, a high-quality wholesale funding source that has proven to be stable and predictable Custody deposits are attractive funding sources because they originate from very sticky custody relationships with high switching costs
< 14 >
Source: Company filings
Deposits
$66 $92 $98 $104
$125 $134 $152 $161 $22 –
$34 $36 $35
$58
$70 $73
$88 $92
$132 $141 $160
$192
$222 $234
79%
60%
82% 81%
72% 77%
81% 77%
–
10%
20%
30%
40%
50%
60%
70%
80%
90%
–
$50
$100
$150
$200
$250
$300
$350
$400
2007 2008 2009 2010 2011 2012 2013 2014
Inte
rest
-Ear
ning
Ass
ets %
of D
epos
its
Tota
l Dep
osits
Interest-bearing deposits Noninterest-bearing deposits Deposits / Interest-earning assets

Q1 2010 Investor Presentation
Conservative Balance Sheet: Safe Haven
BK has experienced deposit inflow surges during market crises because clients view BK’s balance sheet as a safe haven
< 15 >
September 2001 Attack Lehman Brothers Bankruptcy US Debt Ceiling 2011 US Fiscal Cliff 2012
Source: Company filings
$54 $53 $61 $57
$120 $140 $145
$132
$169
$199 $207 $192
$208 $223 $218
–
$50
$100
$150
$200
$250
1Q01 2Q01 3Q01 4Q01 3Q08 4Q08 1Q09 2Q09 2Q11 3Q11 4Q11 1Q12 3Q12 4Q12 1Q13

Q1 2010 Investor Presentation
0.5%
2.5%
4.5%
6.5%
8.5%
10.5%
12.5%
14.5%
16.5%
18.5%
1Q04 3Q04 1Q05 3Q05 1Q06 3Q06 1Q07 3Q07 1Q08 3Q08 1Q09 3Q09 1Q10 3Q10 1Q11 3Q11 1Q12 3Q12 1Q13 3Q13 1Q14 3Q14
High Capital Ratios
BK’s Tier 1 capital ratio has approached multi-year highs
Tier 1 Capital Ratio
< 16 >
Consolidation of certain investment
management funds(1)
(1) Reflects methodology revision implemented in June 30, 2014 that consolidates assets of certain investment management funds in risk-weighted assets. Basel III capital ratios are shown from 1Q14 onwards

Q1 2010 Investor Presentation
Attractive Balance Sheet: Stress Test Performance
BK’s business model performs well in government stress tests
< 17 >
Source: Federal Reserve March 2015 DFAST Stress Test

Q1 2010 Investor Presentation
III. The World Has Changed
< 18 >

Q1 2010 Investor Presentation
Net Interest Margin Pressure
Net Interest Margin (FTE) %
BK’s earnings are cyclically pressured by decade-low net interest margins due to a prolonged period of low global interest rates and a growing mix of excess deposits on the balance sheetLow global interest rates depress net interest revenue, depress trading volatility, increase money market fee waivers, and depress securities lending spreads
< 19 >
Source: Company filings
0.50%
0.70%
0.90%
1.10%
1.30%
1.50%
1.70%
1.90%
2.10%
2.30%
2.50%
1Q04
2Q04
3Q04
4Q04
1Q05
2Q05
3Q05
4Q05
1Q06
2Q06
3Q06
4Q06
1Q07
2Q07
3Q07
4Q07
1Q08
2Q08
3Q08
4Q08
1Q09
2Q09
3Q09
4Q09
1Q10
2Q10
3Q10
4Q10
1Q11
2Q11
3Q11
4Q11
1Q12
2Q12
3Q12
4Q12
1Q13
2Q13
3Q13
4Q13
1Q14
2Q14
3Q14
4Q14
Q1 2010 Investor Presentation
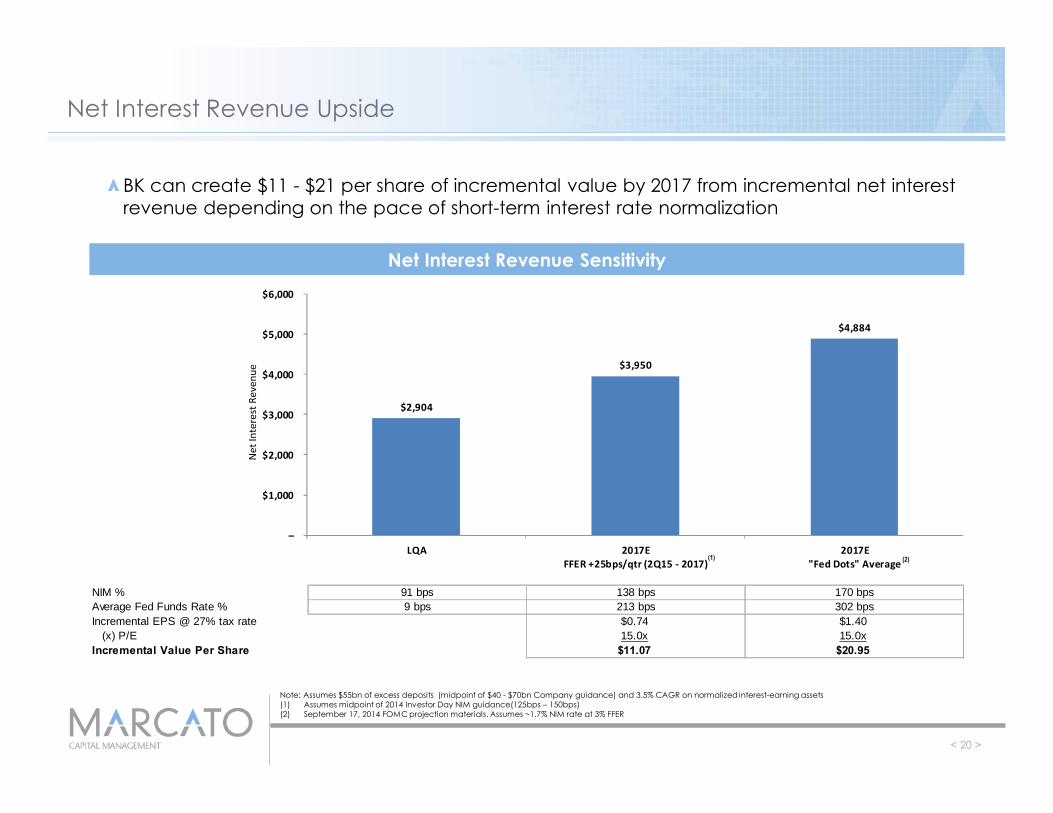
NIM % 91 bps 138 bps 170 bpsAverage Fed Funds Rate % 9 bps 213 bps 302 bpsIncremental EPS @ 27% tax rate $0.74 $1.40
(x) P/E 15.0x 15.0xIncremental Value Per Share $11.07 $20.95
$2,904
$3,950
$4,884
–
$1,000
$2,000
$3,000
$4,000
$5,000
$6,000
LQA 2017EFFER +25bps/qtr (2Q15 - 2017)
2017E"Fed Dots" Average
Net
Inte
rest
Rev
enue
Net Interest Revenue Upside
< 20 >
BK can create $11 - $21 per share of incremental value by 2017 from incremental net interest revenue depending on the pace of short-term interest rate normalization
Net Interest Revenue Sensitivity
(1)
Note: Assumes $55bn of excess deposits (midpoint of $40 - $70bn Company guidance) and 3.5% CAGR on normalized interest-earning assets(1) Assumes midpoint of 2014 Investor Day NIM guidance(125bps – 150bps)(2) September 17, 2014 FOMC projection materials. Assumes ~1.7% NIM rate at 3% FFER
(2)

Q1 2010 Investor Presentation
+ 100bps rate "ramp" $149 $326LTM Net Interest Revenue (FTE) $2,433 $2,942
% Upside 6.1% 11.1%
BNY Mellon Has Greater Rates Leverage than State Street
Net Interest Revenue Sensitivity
Impact on current net interest revenue over the next 12 months based on a quarterly 25 bps increase in global interest rates over the next four quarters (Company internal estimates)
Source: Company filings
< 21 >

Q1 2010 Investor Presentation
0
50
100
150
200
250
300
350
TED
Spre
ad
0
5
10
15
20
25
JPM
G7
Vola
tility
Inde
x
Securities Lending and FX Volatility
< 22 >
Higher interest rates may also potentially drive improvements in securities lending and FX trading revenues
Source: Bloomberg, Company transcripts
Indexed Ted Spread (3 Mo. LIBOR – T. Bills) FX Volatility
“The Fed Funds Rate has a big impact on the TED spread, which has a big impact on our securities lending activity...when rates eventually go up and you get back to the more normalized TED spread, this will be a much more attractive business financially”
- Bob Kelly, CEO, 3/2/10 CLSA Analyst Day
Averages:2001 – Present: 42
2001 – 2007: 362009 – Present: 30
~25
FX volatility now at all-time lows over the past 20 yearsAs interest rates rise and rate differentials increase, customers increase their use of carry trade strategies à higher FX volumes

Q1 2010 Investor Presentation
Money Market Fee Waivers
< 23 >
Higher interest rates will also recover significant money market fee waivers
Source: 4/8/14 Analyst Day, 9/4/14 Barclays Global Financial Services Conference
Pre-tax Money Market Fee Waivers Fee Waiver Recovery

Q1 2010 Investor Presentation
A Changing Regulatory Landscape
< 24 >
Basel Capital Ratios
Stress Testing (CCAR/ DFAST)
Dodd-Frank
Supplementary Leverage Ratio (SLR)
Liquidity Coverage Ratio (LCR)
European Market Infrastructure Regulation (EMIR)
Volcker Rule
Recovery and Resolution Plans
Foreign Account Tax Compliance Act (FATCA)
Markets in Financial Instruments Directive (MiFID)
Target2 Securities (T2S)
Alternative Investment Fund Managers Directive (AIFMD)
Tri-party Repo Reforms
Money Market Fund Reforms
Data Management Standards
Net Stable Funding Ratio (NSFR)
Total Loss Absorbing Capital (TLAC)
G-SIB Surcharges
Past Present FutureKey Regulations
Source: Company filings, Industry news, Wall Street research

Q1 2010 Investor Presentation
Key Business Model Implications
< 25 >
New Regulations Key ImplicationsSupplementary Leverage Ratio (SLR)
Higher capital retention, “low risk” assets need to generate higher returns, trading book contraction, deposit reduction and management, higher compliance costs,
Liquidity Coverage Ratio (LCR)
Lower NIM yields, reallocation of balance sheet towards HQLA, reduced appetite for non-operational deposits, liability optimization, higher compliance costs
Stress-Testing (CCAR / DFAST) Regulatory scrutiny of capital return policies, higher capital ratios, tighter risk management practices, higher compliance costs
Basel III Higher capital ratios, more onerous capital definitions and risk-weightings, less leverage, capital penalties for size, complexity and interconnectedness
Tri-party Repo Reform Lower intraday credit risk, higher compliance costs
Resolution Plans Higher compliance costs
More Capital &Reduced Leverage
Higher Compliance Expenses
Lower Market, Credit & Operational Risk
Source: Company filings, Industry news, Wall Street research
Reduced Size & Complexity

Q1 2010 Investor Presentation
109%
100%
–
25%
50%
75%
100%
125%
150%
BK ProjectedRegulatory
3.0%
2.0%
1.0%
4.4%
6.0%
–
2.0%
4.0%
6.0%
8.0%
BK @ 4Q14 ProjectedRegulatory
4.5%
2.5%
1.0% 0.5%
9.8%
8.5%
–
3.0%
6.0%
9.0%
12.0%
15.0%
BK @ 4Q14 ProjectedRegulatory
Rising Capital and Liquidity Requirements By 2019
< 26 >
CET1 SLR LCR
CapitalCons.Buffer
B3Minimum
B3 G-SIBSurcharge(2)
US G-SIB(1)
Source: Wall Street research, Company filings(1) Potential US G-SIB surcharge of up to 2%. Estimated 0.5% US surcharge for BK per Citigroup 12/8/14(2) B3 potential G-SIB surcharge of 1% - 3.5%. Estimated 1% surcharge for BK per Financial Stability Board(3) Per 10/28/14 Investor Day
Well-CapitalizedBuffer
Enhanced SLR Buffer
SLRMinimum
(3)

Q1 2010 Investor Presentation
Key Business Model Implications
< 27 >
Whether or not the rate / volatility environment ever returns to historical levels, the new regulatory world requires BNY Mellon to reconsider many aspects of the Company:
Business Lines Geographical Mix Client Selection & Economics
Asset Mix Labor Mix Deposit & Liability Structure
Q1 2010 Investor Presentation
IV. Poor Management Through A Changing Environment
< 28 >
Q1 2010 Investor Presentation
2007 Mellon Merger Has Failed to Deliver on Promises
< 29 >

Q1 2010 Investor Presentation
2007 Mellon Merger Has Failed to Deliver on Promise
Source: Mellon M&A presentation 12/4/2006
In its 12/4/2006 presentation on the merger with Mellon Financial (Mellon M&A Presentation), BK outlined a path towards $3.38 in cash EPS by 2009BK only achieved $2.56 of cash EPS in 2014 (24% below 2009 targets, 5 years later)
< 30 >
12/4/06 Mellon M&A Presentation – EPS Targets

Q1 2010 Investor Presentation
17%
2%
– 4% 8% 12% 16% 20% 24%
10%
4%
– 4% 8% 12% 16% 20% 24%
Dubious Claimed Merger Synergies
Source: M&A presentation 12/4/2006, Company presentation 11/11/08, 10K 2014(1) “Core revenue” adjusts for non-operating items such as securities gains (losses), FTE adjustments, discount accretion, earnings attributable to non-controlling interests of consolidated investment management funds and one-time gains / losses on asset sales (per BNY Mellon 10/28/14 Investor Day methodology)(2) Core expenses adjusted for intangible amortization, M&I, litigation and restructuring charges, support agreement charges, and charges related to investment management funds(3) Assumes $850mm of cost synergies and $375mm of revenue synergies
BK claims it achieved $850mm of expense synergies and $325 - $425mm of revenue synergies from the Mellon merger (claiming that it even exceeded its initial goals) Despite claimed synergies, revenue growth has been tepid and actual expenses have significantly outgrown revenuesClaimed synergies are dubious, as gross expenses would have massively outgrown revenues without synergy benefits
2007 Mellon Merger Targets
< 31 >
Without“Alleged”
Synergies(3)
Actual Results
Core Revenues
CoreExpenses
Core Revenues
CoreExpenses
6% ∆
15% ∆
Mellon merger synergies are unobservable based on post-merger results
FY2007 – FY2014 Total Growth %
(1)
(1)
(2)
(2)

Q1 2010 Investor Presentation
Noninterest Expense Has Grown Unsustainably
Source: Company filings(1) Noninterest expense excludes amortization of intangible assets, merger & integration charges, litigation and restructuring charges, support agreement charges, charges
related to investment management funds(2) Fee revenue excludes non-recurring asset-related gains
Margins have deteriorated as noninterest expense has grown rapidly against stagnant fee revenue
Noninterest Expense % of Fee Revenue(1)
< 32 >
77%
88% 87%
89%
92% 93%
91%
70%
75%
80%
85%
90%
95%
2008A 2009A 2010A 2011A 2012A 2013A 2014A

Q1 2010 Investor Presentation
$14.0
$14.6
$10.0
$11.0
$12.0
$13.0
$14.0
$15.0
$16.0
2007 2014
Unabated Headcount Growth
Source: Company filings, Marcato estimates(1) 2007 includes annualized impact of Mellon Financial(2) “Core revenue” adjusts for non-operating items such as securities gains (losses), FTE adjustments, discount accretion, earnings attributable to non-controlling interests of consolidated investment management funds and one-time gains / losses on asset sales (per BNY Mellon 10/28/14 Investor Day methodology)
Headcount has grown disproportionately versus revenues since the Mellon merger (22% total growth in headcount vs. 4% total growth in “Core” Revenue)
Total Headcount “Core” Revenue(2) ($bn)
< 33 >
41,200
50,300
25,000
30,000
35,000
40,000
45,000
50,000
55,000
2007 2014(1)

Q1 2010 Investor Presentation
Technology Fragmentation Is A Key Source of Excess Costs
Source: Company filings, Company transcript, HBS Case Study(1) Harvard Business School Case Study: “Merger of Equals: The Integration of Mellon Financial and The Bank of New York”
< 34 >
“And I think I’ve mentioned about the challenges with the merger & acquisitions is we have so many different fragmented technology in various businesses and various products...I think the
nature of the acquisitions have resulted in lots of fragmentation of technology”
- Suresh Kumar, BNY Mellon CTO, 3/13/13
Two Custody Platforms
Five Accounting Platforms
Major Redundancies- Back office headcount- Systems maintenance- Application development- Reporting costs
“The traditional approach for any of these acquisitions is steeped in the thesis that you’ll see more synergies the more simplified your back end, and the more common systems you share, especially those that benefit from scale. That’s been time-tested in the trust banking business”
- Tim Keaney, Former BNY Mellon CEO Investment Services, 2010(1)
“One of the things that is really setting us apart [from our competitors] post-transformation is the fact that we do have one global platform...When we spend dollars to build the future
functionality, we do it once. And then we leverage it across the world. If you have six accounting platforms and you were doing a regulatory change six times, that’s 1/6 the IT efficiency”
- Gunjan Kedia, State Street EVP, 2/25/15

Q1 2010 Investor Presentation
Costly M&A Activity
Source: Company filings, CapitalIQNote: Cutwater Asset Management acquisition announced in October 2014 and closed in January 2015
< 35 >
BK’s heavy cost structure reflects the significant M&A activity the Company has undertaken over the years
Portsmouth Financial Systems
BHF Asset Servicing
20072008200920102011201220132014
Broker-Dealer
Global Securities Services
Mellon Financial has not been fully integrated seven years after the acquisition

Q1 2010 Investor Presentation
Gerald Hassell’s 2011 Investor Day Targets Have Failed to Materialize
< 36 >
Q1 2010 Investor Presentation
'14A$2.56
'14A$2.56
$2.42 $2.52 $2.49
$2.96
$3.31
$1.00
$1.50
$2.00
$2.50
$3.00
$3.50
2011A 2012A 2013A 2014 (@7%) 2014 (@11%)
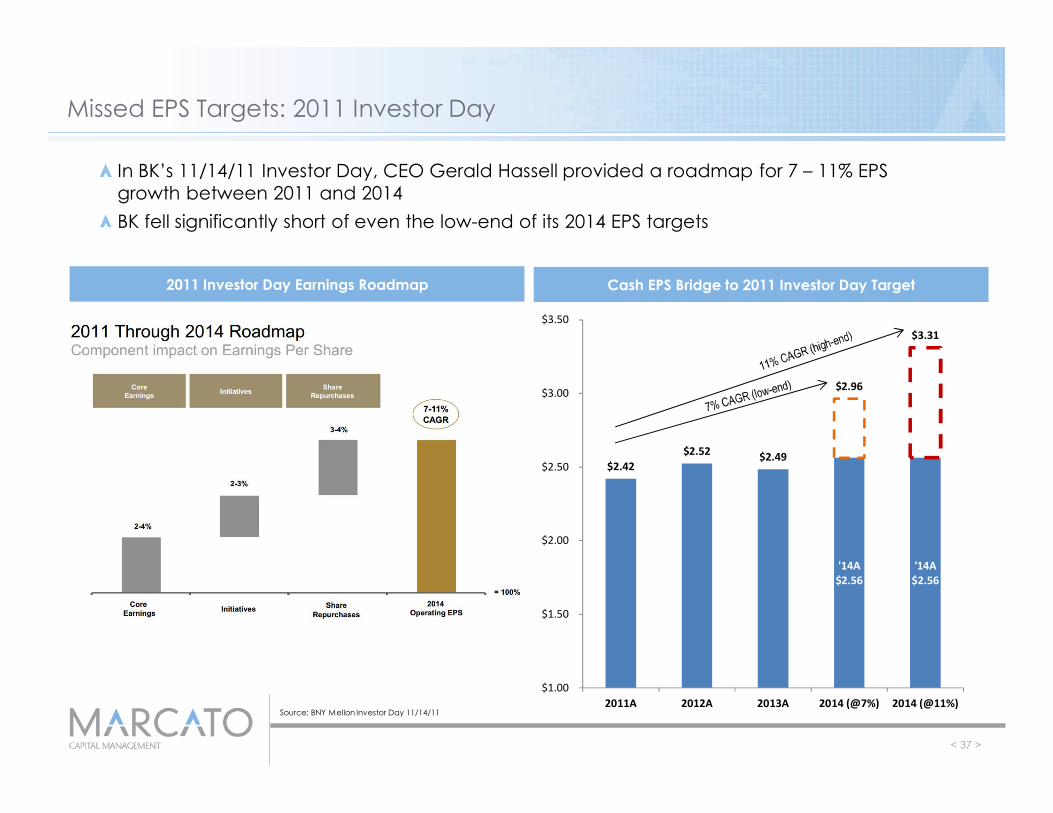
Missed EPS Targets: 2011 Investor Day
Source: BNY Mellon Investor Day 11/14/11
In BK’s 11/14/11 Investor Day, CEO Gerald Hassell provided a roadmap for 7 – 11% EPS growth between 2011 and 2014BK fell significantly short of even the low-end of its 2014 EPS targets
< 37 >
2011 Investor Day Earnings Roadmap Cash EPS Bridge to 2011 Investor Day Target

Q1 2010 Investor Presentation
9.0% 8.8%
8.3% 8.1%
7.0%
7.5%
8.0%
8.5%
9.0%
9.5%
10.0%
10.5%
2011 2012 2013 2014
Missed ROE Targets: 2011 Investor Day
(1) Reflects Company-reported non-GAAP ROE
In BK’s 11/14/11 Investor Day, BK Management also targeted a 10% ROE by FY14BK fell significantly short of this 10% ROE target in 2014ROE has deteriorated significantly since 2011
< 38 >
BK Return on Equity %(1)
ROE Gap

Q1 2010 Investor Presentation
100 104 103
106 100
105
118
132
50
75
100
125
150
2011 2012 2013 2014
9.0% 8.8%
8.3% 8.1%
10.0% 10.3%
10.5%
9.8%
7.0%
8.0%
9.0%
10.0%
11.0%
12.0%
2011 2012 2013 2014
BNY Mellon Has Underperformed State Street on Key Targets
< 39 >
Indexed EPS Growth(1) Return on Equity(2)
BK STT
(1) Adjusted for amortization of intangibles, acquisition and restructuring costs and other one-time items(2) Reflects State Street ROE adjusted for extraordinary losses and BK non-GAAP ROE %
While BK’s results have significantly deteriorated, State Street’s results have significantly improved

Q1 2010 Investor Presentation
Flat EPS Growth Despite Certain Beneficial Market Tailwinds
< 40 >
Source: Company filingsNote: Equity market indices represent daily averages over time series. Bond index represents period-ends over time series
“Using the S&P 500 Index as a proxy for the global equity markets, we estimate that a 100-point change in the value of the S&P 500 Index, sustained for one year, would impact...”─ “...fully diluted earnings per common share by $0.03 to $0.05” (BK 2011 Annual Report)─ “...fully diluted earnings per common share by $0.03 to $0.05” (BK 2012 Annual Report)─ “...fully diluted earnings per common share by $0.02 to $0.04” (BK 2013 Annual Report)─ “...fully diluted earnings per common share by $0.02 to $0.04” (BK 2014 Annual Report)
Indexed Growth (FY2011 = 100): BK EPS Growth vs. Market Indices Growth
152
134
118
107 106
90
100
110
120
130
140
150
160
2011 2012 2013 2014S&P 500 Index MSCI World IndexFTSE 100 Index Barclays Capital Global Aggregate Bond IndexBNY Mellon LTM EPS

Q1 2010 Investor Presentation
Margins have deteriorated despite “Operational Excellence Initiatives”, where BK laid out savings targets of $650 - $700mm by 2015BK claims that has significantly exceeded its targets through 2013 but there is no observable evidence in support of this claim
Unobservable “Cost Reductions”
Source: BNY Mellon 10K 2013
2011 Operational Excellence Targets
< 41 >

Q1 2010 Investor Presentation
2%
5%
12%
(1%)
3%
7%
11%
15%
Revenue Expenses, net Expenses, gross
Tota
l Gro
wth
(201
1 -20
14)
Expense Growth Does Not Show Evidence of Initiatives
Claimed cost savings imply gross expenses between 2011 and 2013 would have grown by $1.2bn (or ~12%) if management did not execute its “Operational Excellence” initiatives and achieve M&A synergies Revenue has barely grown over the same time period
< 42 >
2011 – 2014 Total Growth %
(1) (2) (3)
Source: Company filings(1) Adjusted for sale of Shareowner Services sale in 2011, gain/loss related to equity investments, and net income attributable to noncontrolling interest related to consolidated
investment management funds (per BNY 10/28/14 Investor Day pg. 10)(2) Adjusted for sale of Shareowner Services sale in 2011, amortization of intangible assets, M&I, litigation and restructuring charges and charges related to investment
management funds(3) Net expenses adjusted for $636 of “Operational Excellence” savings and claimed GIS acquisition expense synergies (2011 = $72mm, 2014 = $120mm)
Q1 2010 Investor Presentation
Implied Headcount (Asset Manager + Asset Servicer)Asset Managers
Capital JPMVanguard BLK BEN Group GIM (2) PIMCO
AUC/A ($tn) $29 $28 $21AUM ($bn) $1,710 $3,100 $4,652 $898 $1,147 $792 $747 $1,744 $709 $2,480 $1,680 $363
STT (IS)
JPM (TSS)
Ass
et
Serv
icer
s
32,700 29,490
29,96033,17041,670 39,670 36,736 34,470
41,200 39,200 36,266 34,000
50,300
27,470 ~27,000
~14,200 12,200
9,266 ~7,000 6,264 5,870 5,700
3,100 ~2,500 2,490 1,435 –
10,000
20,000
30,000
40,000
50,000
60,000
BK STT(Inv. Serv.)
JPM(TSS)
Vanguard BLK BEN Capital Group IVZ TROW JPM(Global Inv. Mgmt.)
LM STT(Inv. Mgmt.)
PIMCO FII
Tota
l Em
ploy
ees
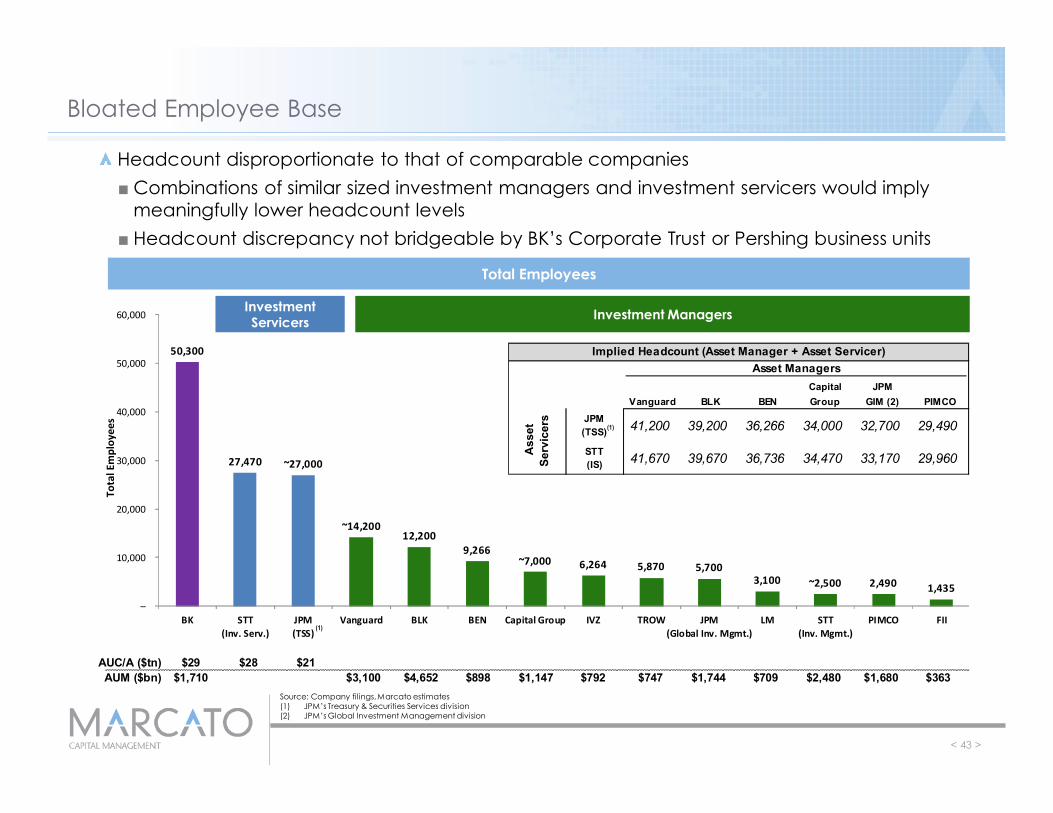
Bloated Employee Base
Source: Company filings, Marcato estimates(1) JPM’s Treasury & Securities Services division(2) JPM’s Global Investment Management division
Headcount disproportionate to that of comparable companies■ Combinations of similar sized investment managers and investment servicers would imply
meaningfully lower headcount levels■ Headcount discrepancy not bridgeable by BK’s Corporate Trust or Pershing business units
Total Employees
< 43 >
Investment ManagersInvestment Servicers
(1)
(1)

Q1 2010 Investor Presentation
$0.250
$0.280
$0.310
$0.340
$0.370
$0.400
2009 2010 2011 2012 2013 2014
Core
Rev
enue
/ A
vera
ge E
mpl
oyee
($bn
)
BK STT
BK’s ever-deepening gap of core revenues / average employee in comparison to State Street show significant increasing employee inefficiency
Employee Inefficiency
< 44 >
Source: Company filings(1) “Core revenue” adjusts for non-operating items such as securities gains (losses), FTE adjustments, discount accretion, earnings attributable to non-controlling interests of consolidated investment management funds and one-time gains / losses on asset sales (per BNY Mellon 10/28/14 Investor Day methodology). BNY Mellon adjusted for sale of Shareowner Services and acquisitions of PNC GIS and BHF Asset Servicing
Core Revenue / Average Employee(1)

Q1 2010 Investor Presentation
104% 103%
94%
78%
96%
93%
75%
80%
85%
90%
95%
100%
105%
110%
1Q11 2Q11 3Q11 4Q11 1Q12 2Q12 3Q12 4Q12 1Q13 2Q13 3Q13 4Q13 1Q14 2Q14 3Q14 4Q14
Inde
xed
Head
coun
t
BNY Mellon State Street JP Morgan (CIB = TSS + IB) Bank of America Goldman Sachs Citigroup
Relative Headcount Trajectory
Source: Company filings(1) CIB represents JP Morgan’s Corporate and Investment Bank, which includes the results of Investment Banking and Treasury & Securities Services segments
While macroeconomic factors and regulatory compliance have pressured headcount and costs for all G-SIB banks, BK has responded least forcefully to headcount
< 45 >
Indexed Headcount
(1)

Q1 2010 Investor Presentation
9.0%
8.2%
4.3%
2.9% 2.6%
1.1%
–
1.0%
2.0%
3.0%
4.0%
5.0%
6.0%
7.0%
8.0%
9.0%
10.0%
BK JPM STT BAC GS BLK
Disproportionately High Professional Fee & Outside Service Expense
While choices around insourcing vs. outsourcing impact headcount comparisons, BK also spends the greatest % of revenues on professional and outside service fees compared to other custody, asset management and G-SIB peers■ BK’s professional, legal and outside services expense has grown by over 10% since 2011
< 46 >
2014 Professional & Outside Service Fees % of Revenues
Source: Company filings
Q1 2010 Investor Presentation
25.0%
27.0%
29.0%
31.0%
33.0%
35.0%
4Q09 1Q10 2Q10 3Q10 4Q10 1Q11 2Q11 3Q11 4Q11 1Q12 2Q12 3Q12 4Q12 1Q13 2Q13 3Q13 4Q13 1Q14 2Q14 3Q14 4Q14
BK STT
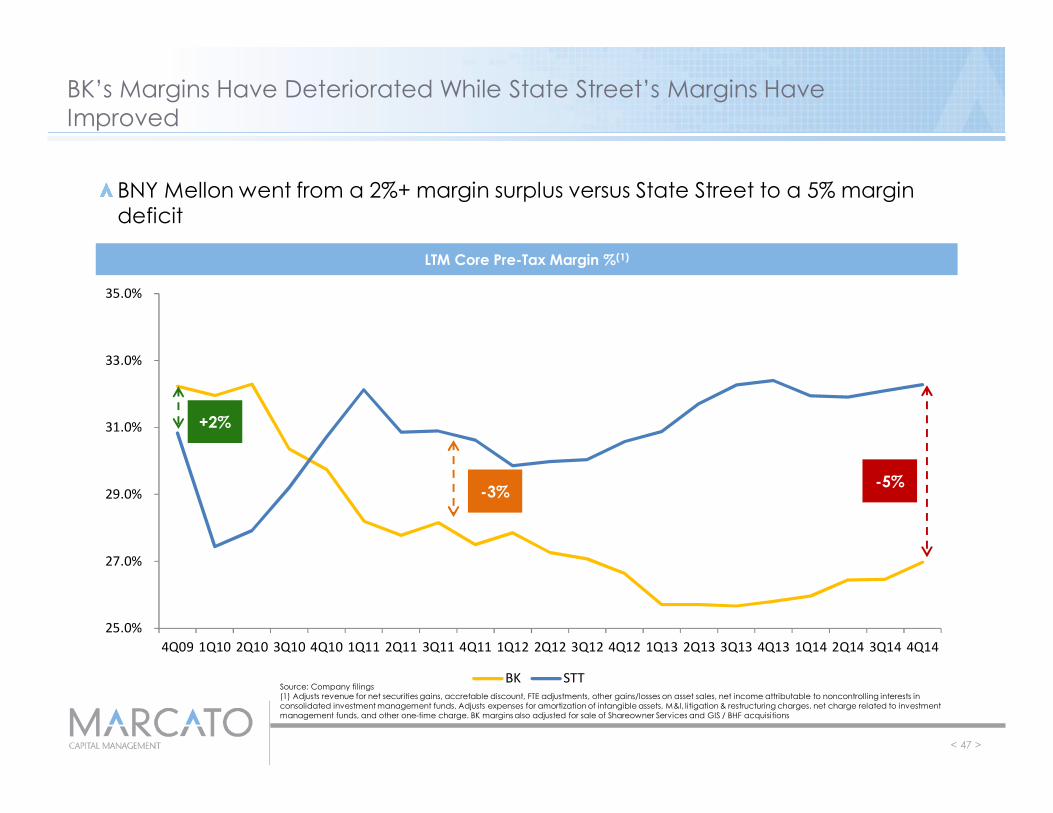
BK’s Margins Have Deteriorated While State Street’s Margins Have Improved
Source: Company filings(1) Adjusts revenue for net securities gains, accretable discount, FTE adjustments, other gains/losses on asset sales, net income attributable to noncontrolling interests in consolidated investment management funds. Adjusts expenses for amortization of intangible assets, M&I, litigation & restructuring charges, net charge related to investment management funds, and other one-time charge. BK margins also adjusted for sale of Shareowner Services and GIS / BHF acquisitions
< 47 >
LTM Core Pre-Tax Margin %(1)
BNY Mellon went from a 2%+ margin surplus versus State Street to a 5% margin deficit
+2%
-5%-3%

Q1 2010 Investor Presentation
Persistent Underperformance on Key Business Metrics
< 48 >

Q1 2010 Investor Presentation
$76 $83
$59 $53 $58 $56
$89 $84
$107 $95
$76
$42
$23
$48
–
$20
$40
$60
$80
$100
$120
3Q11 4Q11 1Q12 2Q12 3Q12 4Q12 1Q13 2Q13 3Q13 4Q13 1Q14 2Q14 3Q14 4Q14
Key Revenue Drivers Are Decelerating Under Current Management
Source: Company filings
< 49 >
Investment Servicing LTM Gross New Business Wins ($bn)
Investment Management LTM Long-Term Net Inflows ($bn)
$1,138 $1,219 $1,176
$1,294 $1,720
$1,479
$1,231 $1,118
$706 $639
$595 $524 $529 $536
$1,125
$1,415 $1,348 $1,201
$1,167 $1,226
$1,216 $1,284 $1,273
$1,016 $982
$1,031 $1,133 $1,141
$500
$700
$900
$1,100
$1,300
$1,500
$1,700
$1,900
3Q11 4Q11 1Q12 2Q12 3Q12 4Q12 1Q13 2Q13 3Q13 4Q13 1Q14 2Q14 3Q14 4Q14BK STT

Q1 2010 Investor Presentation
BK Has Lost Custody Market Share Under Current Management
(1) LTM 3Q11 – FY14 total growth. Reflects BK’s reported asset servicing fees less securities lending revenues within Investment Services segment. Reflects STT’s reported servicing fee revenues which excludes securities finance revenues
< 50 >
BK tells investors to not “get overly concerned about that new business win rate because less of the business is geared to AUC”(1) and argues that there has been a “real shift in non-AUC/A types of businesses”(2)
Management pronouncements may help explain inferior AUC/A growth rates but do not explain inferior asset servicing revenue growth rates
Asset Servicing Fee Growth %(1)
11%
17%
–
2%
4%
6%
8%
10%
12%
14%
16%
18%
1 2
Q1 2010 Investor Presentation
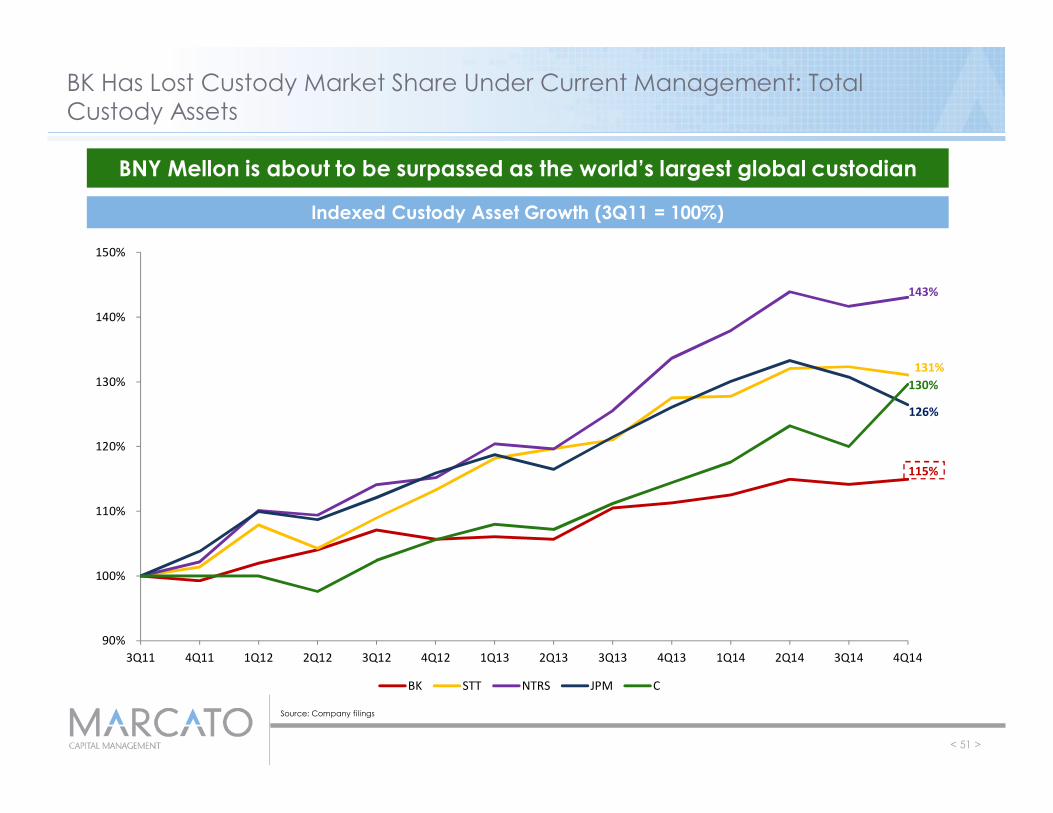
BK Has Lost Custody Market Share Under Current Management: Total Custody Assets
Source: Company filings
< 51 >
Indexed Custody Asset Growth (3Q11 = 100%)
BNY Mellon is about to be surpassed as the world’s largest global custodian
115%
131%
143%
126%
130%
90%
100%
110%
120%
130%
140%
150%
3Q11 4Q11 1Q12 2Q12 3Q12 4Q12 1Q13 2Q13 3Q13 4Q13 1Q14 2Q14 3Q14 4Q14
BK STT NTRS JPM C

Q1 2010 Investor Presentation
BK Has Lost Custody Market Share Under Current Management : Equity Assets
Source: Company filings, Wall Street estimates, Marcato estimates
< 52 >
Indexed Equity Custody Growth (3Q11 = 100%)
BNY Mellon is about to be surpassed as the world’s largest global custodian
144%
152% 152%
148%
100%
110%
120%
130%
140%
150%
160%
170%
3Q11 4Q11 1Q12 2Q12 3Q12 4Q12 1Q13 2Q13 3Q13 4Q13 1Q14 2Q14 3Q14 4Q14
BK STT NTRS JPM

Q1 2010 Investor Presentation
103%
105%
139%
113%
90%
100%
110%
120%
130%
140%
150%
3Q11 4Q11 1Q12 2Q12 3Q12 4Q12 1Q13 2Q13 3Q13 4Q13 1Q14 2Q14 3Q14 4Q14
BK STT NTRS JPM
BK Has Lost Custody Market Share Under Current Management : Fixed Income Assets
Source: Company filings, Wall Street estimates, Marcato estimates
< 53 >
Indexed Fixed Income Custody Growth (3Q11 = 100%)
BNY Mellon is about to be surpassed as the world’s largest global custodian

Q1 2010 Investor Presentation
Net Interest Revenue Is Under-earning Due to Excess Accumulation of Low-Yielding Cash / Interbank Investments (cont’d)
Source: Company filings(1) Fully-taxed equivalent
Net Interest Margin % (FY14)(1)
< 54 >
Cash / Interbank Investments % of Interest-Earning Assets (FY14)
0.97%
1.08%
1.16%
0.90%
0.95%
1.00%
1.05%
1.10%
1.15%
1.20%
1 2 3
45.0%
33.6% 28.4%
–
10.0%
20.0%
30.0%
40.0%
50.0%
1 2 3
Q1 2010 Investor Presentation
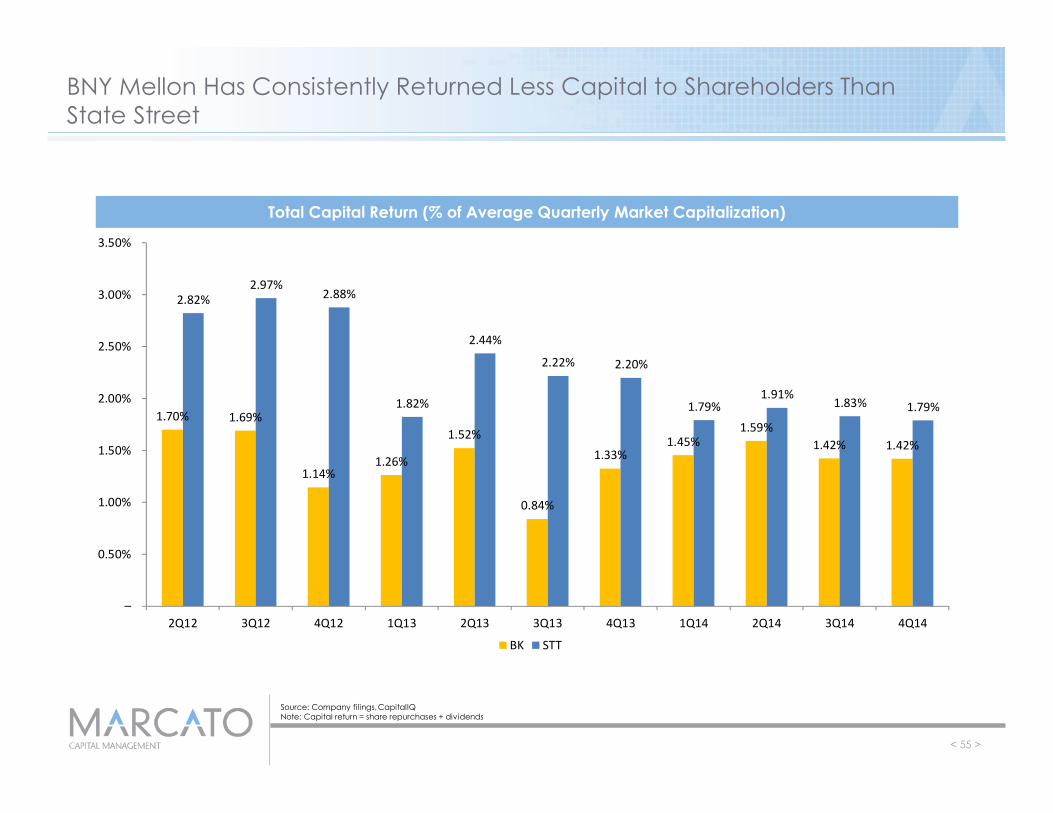
BNY Mellon Has Consistently Returned Less Capital to Shareholders Than State Street
Total Capital Return (% of Average Quarterly Market Capitalization)
< 55 >
Source: Company filings, CapitalIQNote: Capital return = share repurchases + dividends
1.70% 1.69%
1.14% 1.26%
1.52%
0.84%
1.33% 1.45%
1.59% 1.42% 1.42%
2.82% 2.97%
2.88%
1.82%
2.44%
2.22% 2.20%
1.79% 1.91%
1.83% 1.79%
–
0.50%
1.00%
1.50%
2.00%
2.50%
3.00%
3.50%
2Q12 3Q12 4Q12 1Q13 2Q13 3Q13 4Q13 1Q14 2Q14 3Q14 4Q14
BK STT

Q1 2010 Investor Presentation
V. No New Ideas For A Better Future
< 56 >

Q1 2010 Investor Presentation
“New” Strategy – No New Ideas
< 57 >
11/14/11 Investor Day 12/11/13 GS Conference
Despite rhetoric about “moving faster and with a greater sense of speed and urgency”, new targets imply business as usual
CEO Gerald Hassell: “It’s part of our goals that if we get a 4%, 5% revenue growth in a range, we should be able to produce positive operating leverage”CFO Todd Gibbons: “Our core fee business has been growing at about the 3% to 5% range...on the lower end of that, to generate positive operating leverage...is going to be challenging”
10/28/14 Investor Day (“Flat”)
Revenue CAGR
Expense CAGR
EPS CAGR
3 – 5%
2 – 3%
7 – 11%
3 – 5%
~3 – 4 %
3.5% – 4.5%
~4%(1)
7 – 9%
Source: 11/14/11 Investor Day, 12/11/13 GS Conference, 10/28/14 Investor Day(1) Per Marcato estimates, see slide 62

Q1 2010 Investor Presentation
No New Ideas
< 58 >
New guidance demonstrates little commitment to restoring or improving returns on tangible equity, even in a normal interest rate environment
Return on Tangible Equity (non-GAAP)
25%
22%
20%
18% 17 -19%
20 - 22%
10%
15%
20%
25%
30%
2011 2012 2013 9/30/14 2017Flat
2017Normalized
Source: 10/28/14 Investor Day
25%
22%
20%
18% 17 -19%
20 - 22%
10%
15%
20%
25%
30%
2011 2012 2013 2014 2017Flat
2017Normalized
Q1 2010 Investor Presentation
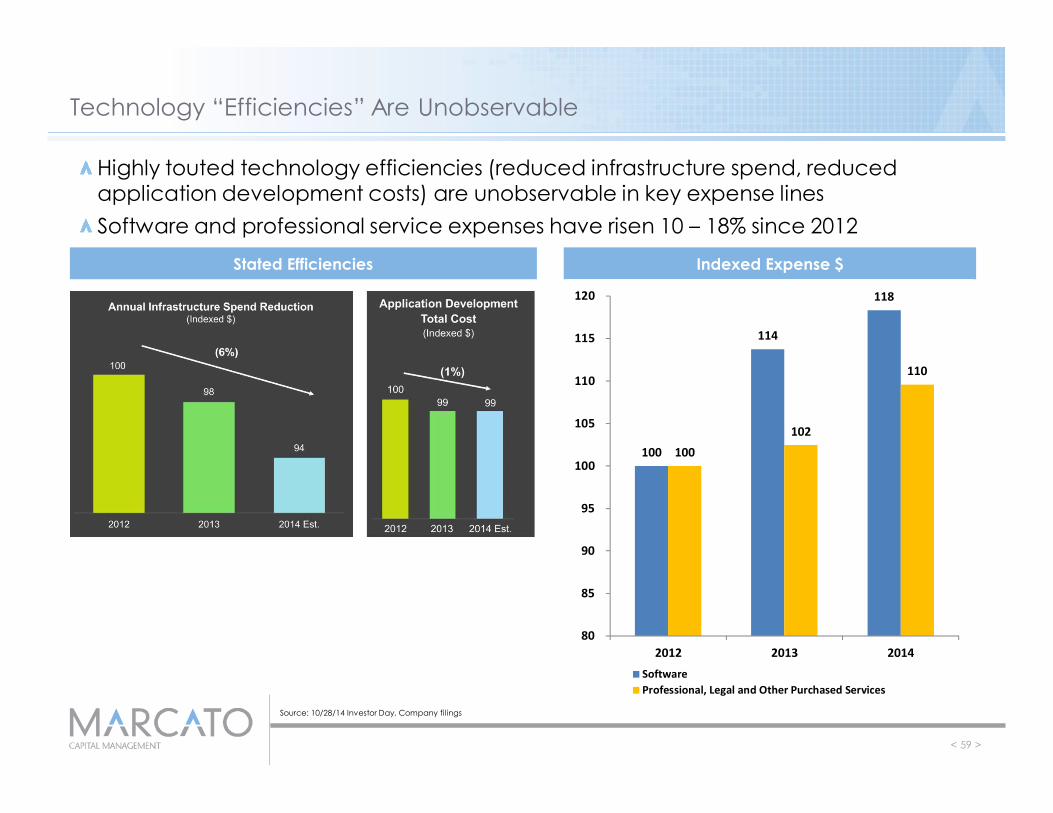
Technology “Efficiencies” Are Unobservable
< 59 >
Stated Efficiencies Indexed Expense $
Highly touted technology efficiencies (reduced infrastructure spend, reduced application development costs) are unobservable in key expense linesSoftware and professional service expenses have risen 10 – 18% since 2012
Source: 10/28/14 Investor Day, Company filings
100
114
118
100 102
110
80
85
90
95
100
105
110
115
120
2012 2013 2014SoftwareProfessional, Legal and Other Purchased Services

Q1 2010 Investor Presentation
Lack of Accountability on “Operating Leverage”
< 60 >
Source: Company transcripts, 2Q14 Earnings Release, 3Q14 Earnings Release, 10/28/14 Investor Day
Management claims to be focused on operating leverage but offers no consistent benchmark to be held accountable againstManagement has re-defined “operating leverage” three times in the past year
Operating Leverage Adjustments2Q14 3Q14 2014
Earnings Earnings Investor DayGAAP revenue ü ü ü
(-/+) Gain (loss) on assets / investments ü û ü(-) Investment and other income û ü û(-/+) Net securities gains (losses) û ü ü(-) Minority interest of cons. inv. mgmt. funds ü ü ü(-) Accretable discount û û ü(+) Fully-taxed equivalent adjustment û û ü
Adj. Revenue
GAAP Expenses ü ü ü(-) M&I, restructuring ü ü ü(-) Amortization ü ü ü(-) Charge related to i-mgmt funds ü ü ü
Adj. Expenses

Q1 2010 Investor Presentation
Lack of Accountability on “Operating Leverage”
< 61 >
Source: 10/28/14 Investor Day, Marcato estimates(1) Method 1: Adjusted revenue defined as GAAP revenue – investment and other income – net securities gains – minority interest. Adjusted expenses defined as GAAP
expenses – M&I and restructuring charges – amortization of intangibles – charges related to investment management funds(2) Method 2: Adjusted revenue defined as GAAP revenue – gains (losses) on assets and investments – net securities gains – minority interest – accretable discount + fully-taxed
equivalent. Adjusted expenses defined as GAAP expenses – M&I and restructuring charges – amortization of intangibles – charges related to investment management funds
Method 1(1): 3Q14 Earnings (10/17/14) Method 2(2): 2014 Investor Day (10/28/14)
Commentary “Our operating leverage was up 245 basis points year-over-year...” (Todd Gibbons)
“This is one of our real focuses, delivering positive operating leverage and improving the operating margins of our company...And so you can see over the last 12 months, the operating margin has in fact, improved by 78 bps across the firm” (Gerald Hassell)
Less than 2 weeks apart, Management showed two different methodologies to showcase the best version of “operating leverage” and “margin improvement” to investors
3Q14 vs. 3Q13 Results LTM 3Q14 vs. LTM 3Q13 Results
Results
245 bps
176 bps
14 bps 10 bps–
0.50%
1.00%
1.50%
2.00%
2.50%
3.00%
Operating Leverage Margin Expansion
77 bps
58 bps
107 bps
78 bps
–
0.20%
0.40%
0.60%
0.80%
1.00%
1.20%
Operating Leverage Margin Expansion
As presented
Method 1 Method 2
As presented

Q1 2010 Investor Presentation
'14A - '17E2014A 2015E 2016E 2017E CAGR
Revenue $14,856 $15,450 $16,068 $16,711 4%% growth 4% 4% 4%
(-) Accretable discount (163) (145) (120) (100)(-) Net securities gains (91) (91) (91) (91)(+) FTE 62 62 62 62(-) Minority interest (84) (70) (70) (70)
Core Revenue $14,580 $15,206 $15,849 $16,512 4%% growth 4% 4% 4%
Core Expense (implied) ($10,645) ($10,991) ($11,451) ($11,924) 4%% growth 3% 4% 4%
Core Pretax Income $3,935 $4,215 $4,398 $4,588 5%(+) Accretable discount 163 145 120 100(+) Net securities gains 91 91 91 91(-) FTE (62) (62) (62) (62)(+) Minority interest 84 70 70 70(+/-) Provision for credit losses 48 (10) (10) (10)(-) Intangible amortization (298) (268) (240) (216) (10%)
Pretax Income $3,961 $4,181 $4,367 $4,561 5%(-) Taxes @ 27% (1,038) (1,129) (1,179) (1,231)
Net Income $2,923 $3,052 $3,188 $3,329 4%(-) Minority interest (84) (70) (70) (70)(-) Preferred dividends (73) (73) (73) (73)(-) Participating securities (43) (43) (43) (43)
Net Income to common $2,723 $2,866 $3,002 $3,143 5%(/) FD shares outstanding 1,137 1,109 1,075 1,042 (3%)
Diluted EPS $2.39 $2.59 $2.79 $3.02 8%% growth 8% 8% 8%
Guidance Implies Virtually No Operating Leverage on a “Core Margin” Basis
< 62 >
Source: 10/28/14 Investor Day, Marcato estimates
Key Management Guidance Drivers4% Revenue Growth8% EPS Growth70% Buyback Ratio~$600mm of share dilution per annum
Where is the operating leverage?

Q1 2010 Investor Presentation
Expense Growth Assumptions Are Unrealistic
< 63 >
Source: 10/28/14 Investor Day, Marcato estimates
Higher expense growth in “flat scenario” than “normalized scenario”?
Investment Services Segment: 2014A 2015E 2016E 2017E CAGR
"FLAT SCENARIO":Revenue 10,059$ 10,411$ 10,775$ 11,153$ 3.5%Pretax Income (excl. intangible amort., M&I, litigation & restructuring) 3,063$ 3,216$ 3,377$ 3,546$ 5.0%Implied Pretax Expenses 6,996$ 7,195$ 7,398$ 7,607$ 2.8%
"NORMALIZED SCENARIO":Revenue 10,059$ 10,562$ 11,090$ 11,645$ 5.0%Pretax Income (excl. intangible amort., M&I, litigation & restructuring) 3,063$ 3,400$ 3,774$ 4,189$ 11.0%Implied Pretax Expenses 6,996$ 7,162$ 7,316$ 7,455$ 2.1%

Q1 2010 Investor Presentation
'14E - '17E2014A 2015E 2016E 2017E CAGR
PTI @ 8.0% EPS CAGR $3,961 $4,167 $4,353 $4,546 5%(-) M&I, restructuring and legal (1,130) (450) (450) (450)(-) i-mgmt. fund charges (104) – – –(+) FX litigation charge 779 – – –(+) Intangible amortization 298 268 240 216
Pretax Income (ex. amort) $3,804 $3,985 $4,143 $4,312 4%(-) Investment Management PTI ($1,116) ($1,216) ($1,326) ($1,445) 9%
% growth 9% 9% 9%(-) Investment Services PTI ($2,794) ($2,934) ($3,080) ($3,234) 5%
% growth 5% 5% 5%Other PTI ($106) ($165) ($264) ($368) 51%% growth 55% 60% 40%
Questionable Expense Allocation To Meet Segment Targets
< 64 >
Source: 10/28/14 Investor Day, Bloomberg consensus estimates, Marcato estimates, Management guidance(1) See page 62 for implied PTI at 8% EPS CAGR
Guidance implies ~$250mm of incremental excess expenses will be allocated into the “Other” segment “Other” has historically been a bucket for excess expensesWhose bonus is tied to “Other” expenses?
Illustrative Income Statement (Flat Environment)
(1)
Segment guidance
Segment guidance

Q1 2010 Investor Presentation
Speculative Investments in “Growth” Initiatives
< 65 >
BK will incur hundreds of millions of dollars of expenses to pursue strategic investments that will only become accretive to earnings in 2017 and 2018
Investment Management Investment Servicing
Source: 10/28/14 Investor Day

Q1 2010 Investor Presentation
2013 2014 2015 2016 2017 2018 2019Investment Management Initiatives ($36) ($74) ($39) – $44 $94 $99Strategic Platform Investments (120) (111) (135) (11) 145 150 155
Total Investments ($156) ($185) ($175) ($11) $189 $244 $255
Speculative Investments in “Growth” Initiatives (cont’d)
< 66 >
Strategic investments are unlikely to reach breakeven until at least 2019, assuming Management does not underperform on its current plan as it has in the past
Pre-Tax Impact of “Initiatives”
Cumulative Investment in “Initiatives”
Source: 10/28/14 Investor Day, 1/17/14 4Q13 Earnings Day Transcript, Marcato estimatesNote: 2013 total investment based on management commentary that 1 – 2% of 2013 expense growth was due to reinvestment in growth initiatives
($600)
($500)
($400)
($300)
($200)
($100)
–
$100
$200
2013 2014 2015 2016 2017 2018 2019

Q1 2010 Investor Presentation
0%
3%
6%
9%
12%
BK STT
Despite a commitment to “investments”, Management does not appear equally committed to “growth” BK’s normalized revenue growth targets are well below State Street’sRevenue growth disparity is striking because:1. BK has greater interest rate sensitivity than State Street 2. BK derives a greater mix of revenue from faster-growing asset management business lines3. BK has greater breadth of capabilities that should drive superior growth from cross-selling
(State Street targets 4 – 5% revenue CAGR from cross-selling(1))
Investments in “Growth” Initiatives – Where’s the Growth?
< 67 >
Long-term Guidance: Normalized Organic Revenue Growth
6% - 8%
7% - 10%
Source: 10/28/14 Investor Day(1) Per State Street 2/17/14 Investor & Analyst Forum. Reflects revenue growth targets attributable to cross-selling to existing clients

Q1 2010 Investor Presentation
$3,961
$500
$374 $82
$431
($787)
$4,561
$3,000
$3,500
$4,000
$4,500
$5,000
$5,500
$6,000
2014 PTI "TransformationProcess"
"Initiatives","Strategic Platform"
Incrementalamortization of
intangibles
Organic growth @3.5% CAGR,
constant margin
[Gap] 2017 Implied PTI @8% EPS CAGR
Deja Vu All Over Again
< 68 >
Source: 10/28/14 Investor Day, Marcato estimates(1) Assumes low-end of consolidated revenue growth guidance of 3.5% - 4.5% in “flat scenario”
At least $500mm Pg. 66 – 2014 Investor Day
2014 PTI drag of $185mm2017 PTI benefit of $189mm
Pg. 25, 64 – 2014 Investor Day
Natural organic growth and announced “Transformation Process”, “Initiatives” and “Strategic Platform” investments should imply higher EPS growth than guidance.......unless the collective financial impact of actions (yet again) do not drop to the bottom line, just as with Management’s “Operational Excellence” program launched in 2011
$3,961 @ 3.5% CAGR(1)
“Incremental regulatory costs” vs. Buffer for poor Management
execution?
Q1 2010 Investor Presentation < 69 >
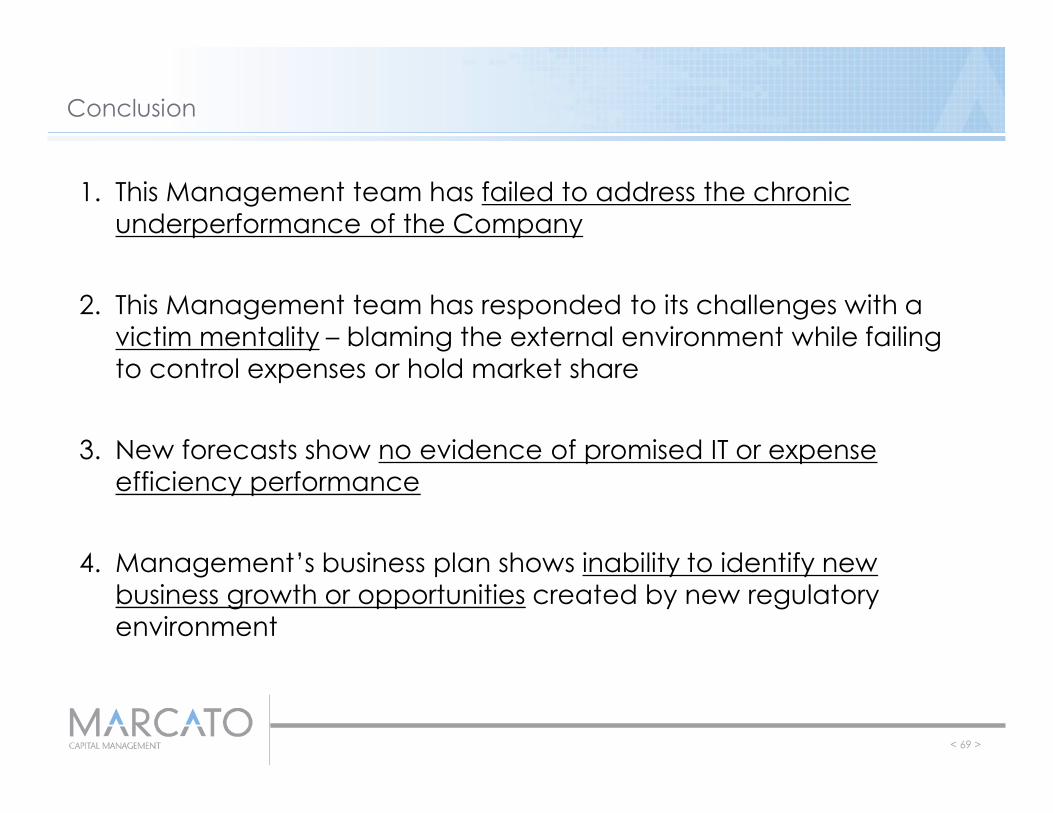
1. This Management team has failed to address the chronic underperformance of the Company
2. This Management team has responded to its challenges with a victim mentality – blaming the external environment while failing to control expenses or hold market share
3. New forecasts show no evidence of promised IT or expense efficiency performance
4. Management’s business plan shows inability to identify new business growth or opportunities created by new regulatory environment
Conclusion

Q1 2010 Investor Presentation
VI. Case Study: JPM 2015 Investor Day
< 70 >

Q1 2010 Investor Presentation
1
1
1
1
1
2012 2013 2014
1
1
1
1
2012 2013 2014
Case Study: JP Morgan Chase’s 2015 Investor Day
< 71 >
Source: 2/24/15 JP Morgan Investor Day, Company filings(1) Excludes impact of net interest revenue (not disclosed by business line. Consolidated investment Services net interest revenue is down 4% from 2012 to 2014)(2) Adjusted for M&I and restructuring charges
Revenue / Expense Growth Trends (Index)
Treasury Services
Custody and Fund Services
Treasury Services(1)
Asset Servicing(1)
Investment Services Noninterest Expense
111111
2012 2013 2014
+ 5%
+ 8%
+ 7%
+ 2%
Revenue
Revenue
ActualAdjusted(2)
Indexed to 2012
Indexed to 2012
Indexed to 2012
JP Morgan has delivered faster revenue growth and deeper expense reductions than BNY Mellon in key investment services business lines
Q1 2010 Investor Presentation
$10,170
($176)
$385 $10,379
($123) ($120)
($636)
$104
$2,573 $12,177
2010 ShareownerServices sale
GIS, BHFM&A
PF 2010 Amort.Intangible
CostSynergies
OperationalExcellence
Fund charges ∆ (Implied) 2014
Case Study: JP Morgan Chase’s 2015 Investor Day
< 72 >
Source: 2/24/15 JP Morgan Investor Day, Company filings(1) Reflects unadjusted total noninterest expense to provide comparability with JPM expense analysis(2) Adjusts for estimated annualized costs on acquired businesses. PNC GIS and BHF Asset Servicing acquired mid-year 2010. Per 2/2/10 PNC M&A investor presentation, PNC GIS
generated $910mm of revenue with 18% pretax margins. BHF expenses estimated by relative transaction value to PNC GIS acquisition(3) Per 2/20/10 PNC M&A investor presentation(4) Completed savings from initiatives as of 2013, excludes any additional initiatives achieved in 2014(5) Change from PF 2010 expense base
Corporate & Investment Bank – Expense Trend Noninterest Expense(1)
(2) (3) (4)
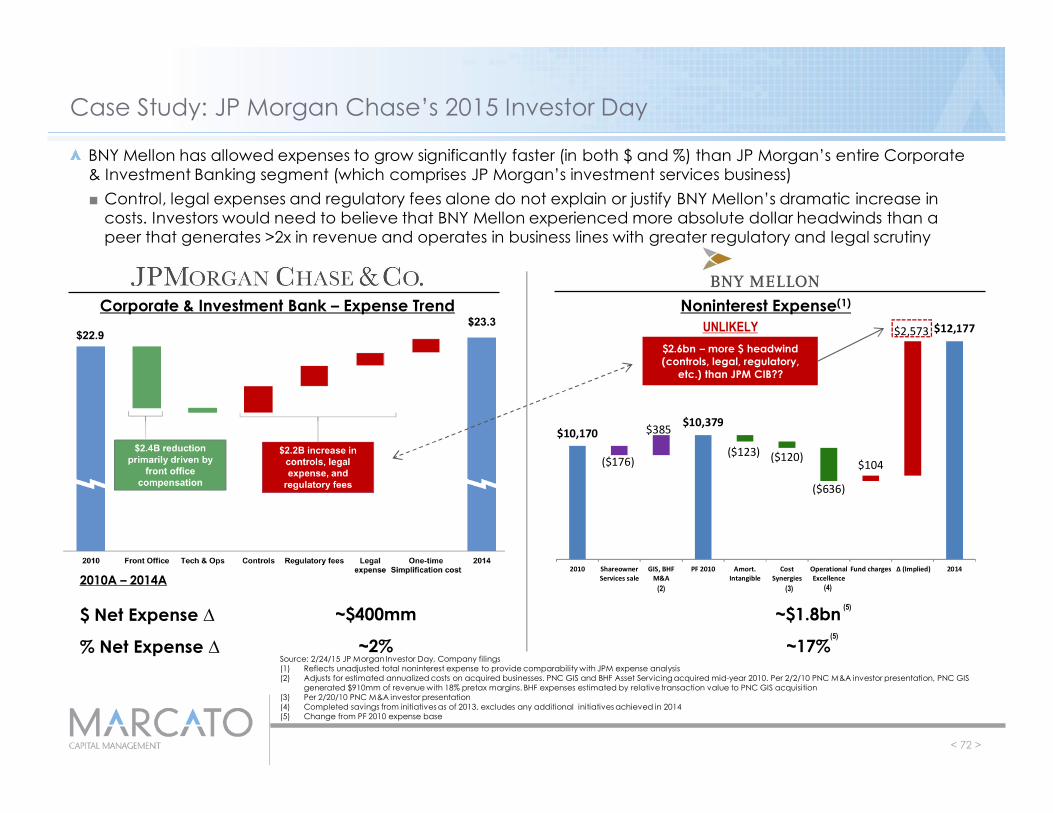
BNY Mellon has allowed expenses to grow significantly faster (in both $ and %) than JP Morgan’s entire Corporate & Investment Banking segment (which comprises JP Morgan’s investment services business)■ Control, legal expenses and regulatory fees alone do not explain or justify BNY Mellon’s dramatic increase in
costs. Investors would need to believe that BNY Mellon experienced more absolute dollar headwinds than a peer that generates >2x in revenue and operates in business lines with greater regulatory and legal scrutiny
$2.6bn – more $ headwind (controls, legal, regulatory,
etc.) than JPM CIB??
UNLIKELY
2010A – 2014A
$ Net Expense ∆ ~$400mm ~$1.8bn
% Net Expense ∆ ~2% ~17%
(5)
(5)

Q1 2010 Investor Presentation
Case Study: JP Morgan Chase’s 2015 Investor Day
< 73 >
Source: 2/24/15 JP Morgan Investor Day, Company filings(1) Implied expense growth based on flat interest rate scenario
2014A – 2017E
$ Net Expense ∆ -$2.8bn +$1.3bn
% Net Expense ∆ -12% +12%
JP Morgan is targeting significant net cost reductions in its Corporate & Investment Banking division between now and 2017 (versus significant expense growth for BNY Mellon)
“Every single number that is here is attached to a name and to a particular action. So this is not aspirational at all, just to be clear” (Daniel Pinto, JP Morgan CEO – Corporate & Investment Bank, 2/24/15 Analyst Day)
JP Morgan Corporate & Investment Bank – 2017 Expense Targets
(1)

Q1 2010 Investor Presentation
Case Study: JP Morgan Chase’s 2015 Investor Day
< 74 >
Source: 2/24/15 JP Morgan Investor Day, Company filings
All the efficiency opportunities available to JP Morgan Chase for achieving net cost reductions are equally available to BNY Mellon
AVAILABLE TO BNY MELLON?Corporate & Investment Bank – Expense Initiatives
ü
ü
ü
üüü
ü
ü
ü
ü
No Secret Playbook: better results come down to Management’s intent and capacity to EXECUTE

Q1 2010 Investor Presentation
Case Study: JP Morgan Chase’s 2015 Investor Day
< 75 >
Source: 2/24/15 JP Morgan Investor Day, 10/28/14 BNY Mellon Investor Day, Company filings(1) Adjusted for amortization of intangibles(2) Based on 2015 Investor Day targets of $15bn of revenue and $5bn of pretax income by 2016(3) Based on 2015-2017 financial goals under “normalized” rates
Within asset management, JP Morgan has delivered stronger historical results and laid out more ambitious 2 – 3 year financial targets
2014 momentum 2009 – 2014 CAGR
LT AUM +11% (-1%∆) +13% (-1%∆)
Revenue +1% (-4%∆) +5% (-3%∆)
Pretax Income(1) -1% (-6%∆) +6% (-2%∆)
Pretax margin(1) 28% (-1%∆) 28% (-1%∆)
Actual Results Medium-term Targets
CAGR(2)
Revenue ~12%
Pretax Income ~20%
J.P. Morgan Chase
BNYMellon
CAGR(3)
Revenue 8% - 10%
Pretax Income 12% - 14%

Q1 2010 Investor Presentation
Case Study: JP Morgan Chase’s 2015 Investor Day
< 76 >
Source: 2/24/15 JP Morgan Investor Day, Company filings
Within asset management, JP Morgan is delivering strong actual margins for shareholders, as opposed to adjusted, “pro-forma” illustrative margins that do not ultimately create shareholder value
Presented pre-tax margins are adjusted for:? Distribution and servicing expense (real)? Money market fee waivers (real)ü Amortization of intangible assets

Q1 2010 Investor Presentation
VII. Maximizing Value: Bold Action and New Ideas
< 77 >

Q1 2010 Investor Presentation
A. Common Sense Principles
< 78 >
Q1 2010 Investor Presentation
Common Sense Principles
< 79 >
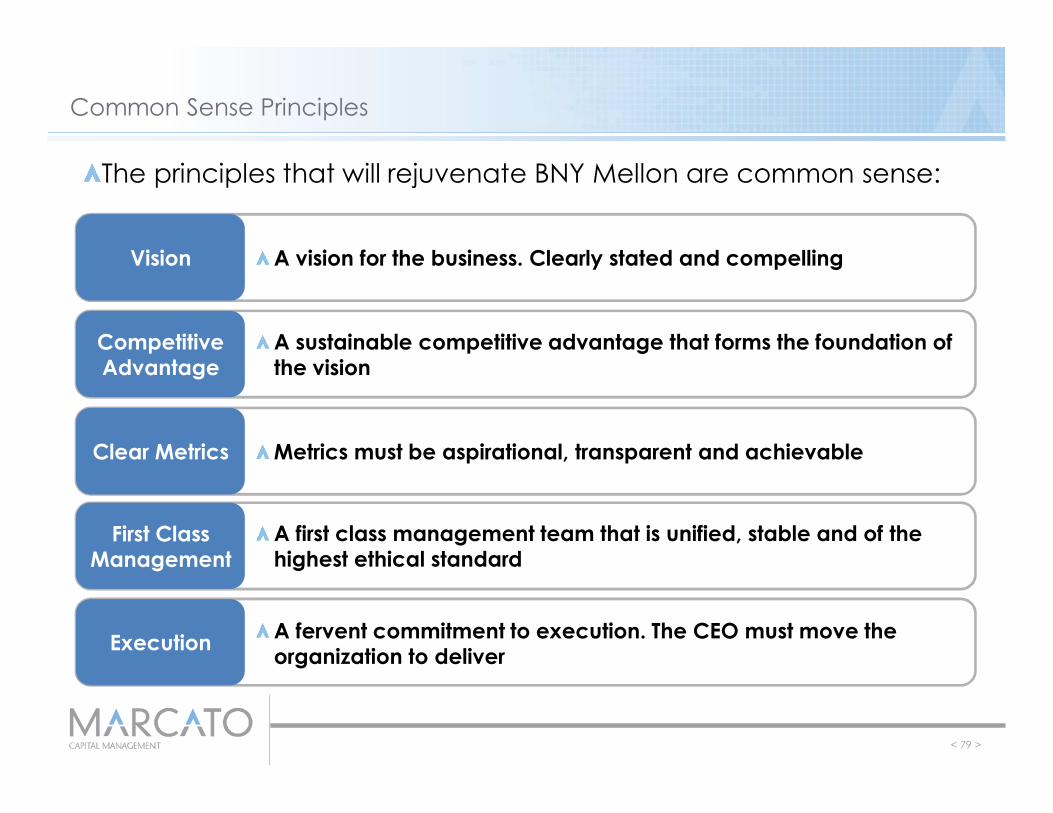
The principles that will rejuvenate BNY Mellon are common sense:
A vision for the business. Clearly stated and compelling
A sustainable competitive advantage that forms the foundation of the vision
Metrics must be aspirational, transparent and achievable
A first class management team that is unified, stable and of the highest ethical standard
A fervent commitment to execution. The CEO must move the organization to deliver
Vision
Competitive Advantage
Clear Metrics
First Class Management
Execution

Q1 2010 Investor Presentation
Vision
< 80 >
1. BNY Mellon will be the bank for the world’s asset managers■ Custody■ Investment Services■ Financing■ Risk Management
2. BNY Mellon will be a leader in Wealth Management■ Intermediate between the best active managers in the world and high net
worth clients■ Provide the best, low cost beta investment products for clients
3. BNY Mellon will excel in managing the most efficient balance sheet in the industry■ Balancing return, with risk, with regulatory requirements■ Far more complex in the post-crises world
4. BNY Mellon must win the technology race in finance■ Creativity, innovation, and production per technologist must be the best in
the industry■ Use technology to capitalize on scale
5. BNY Mellon must be the market’s safe harbor

Q1 2010 Investor Presentation
Global Presence
Sustainable Competitive Advantage
< 81 >
BNY Mellon must deliver the lowest cost platform for the asset management business
BNY Mellon must provide asset managers with an integrated platform that leverages scale and breadth of product; deliver the whole offering
BNY Mellon must maximize its global footprint
How BNY Mellon Will Win:
Low-Cost Structure
Integrated Solutions

Q1 2010 Investor Presentation
Clear Metrics
< 82 >
Management must establish Clear Metrics that are within Management’s control
Targeted operating margins of 35%+
Targeted ROE at 10%+
Target highest headcount productivity in the industry. Start with a 10% - 20% headcount reduction
Operating Margins
Returns on Equity
Headcount
Q1 2010 Investor Presentation
Execution
< 83 >
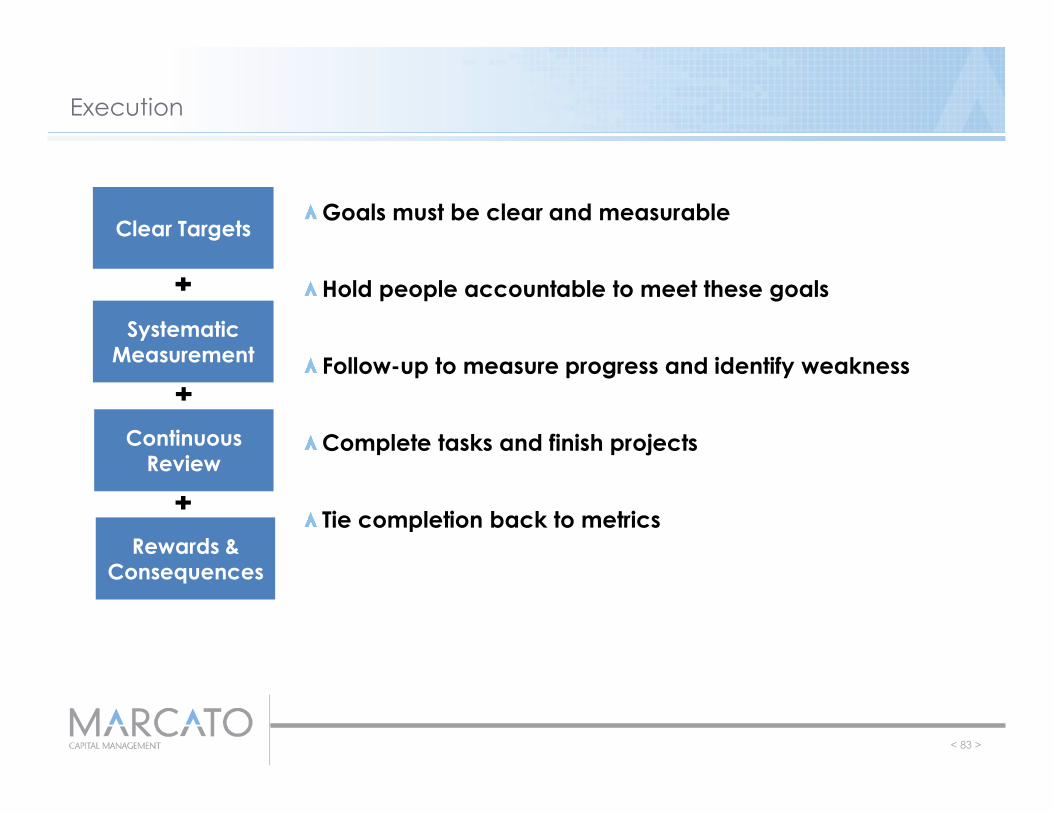
Goals must be clear and measurable
Hold people accountable to meet these goals
Follow-up to measure progress and identify weakness
Complete tasks and finish projects
Tie completion back to metrics
Clear Targets
Systematic Measurement
Continuous Review
Rewards & Consequences

Q1 2010 Investor Presentation
B. Business Opportunities
< 84 >

Q1 2010 Investor Presentation
1. Reconsider Value Proposition to Customers
< 85 >
Be the “Bank to the Buyside” by providing full-service outsourced functions that help buy-side clients manage new regulatory, liquidity and financing regulations Expand service potential for the “middle” and “front” offices, where new regulations and complexities are driving demand for a variety of value-added services that trust banks are uniquely positioned to provide• State Street is the market leader and BNY Mellon remains a follower in the middle and front officesIntegrate “front” and “back” office offerings to drive better client solutions and stickier relationships
Asset Manager Needs
Back Office
Middle Office
Front Office
Real-time, detailed data analytics Risk platformsClearing platformsCompliance platforms
Portfolio accountingRisk managementPerformance analyticsValuationTrade and settlement activity
CustodyFund accounting & administrationForeign exchangeTreasury & cash management
Full-
Serv
ice

Q1 2010 Investor Presentation
Illustrative Investment Services ROE %Consolidated ROE
8.6% 8.0% 8.5% 9.0% 9.5% 10.0%15.0% 6.9% 7.4% 8.0% 8.5% 9.0%17.5% 6.8% 7.3% 7.8% 8.3% 8.8%20.0% 6.7% 7.2% 7.6% 8.1% 8.6%22.5% 6.6% 7.1% 7.5% 8.0% 8.5%25.0% 6.5% 7.0% 7.4% 7.9% 8.4%27.5% 6.5% 6.9% 7.4% 7.8% 8.3%30.0% 6.4% 6.9% 7.3% 7.8% 8.2%In
vest
men
t Mgm
t. R
OE
30%
9%
–
5%
10%
15%
20%
25%
30%
35%
Adj. PBT Margin(Reported)
Adj. PBT Margin(ex. Net Interest Revenue)
1. Reconsider Value Proposition to Customers (cont’d)
< 86 >
Reconsider fee schedule and structure to earn appropriate margin for services and ROE
Investment Services ROE (Implied)(1)Investment Services Margins
Source: Company filings(1) BNY Mellon does not provide segment ROE. Investment Services ROE implied by assigning Investment Management a peer-level ROE and backing in from the consolidated ROE. Ignores Other segment for illustrative purposes
Without the subsidy from net interest revenues, BNY Mellon earns much thinner margins for the valuable services
it provides
Investment Services is unlikely earnings its cost of capital (~10% cost of equity)
Q1 2010 Investor Presentation
3-4%4-5% 5% 5%
5-6%
8-9%
12%
15-20% 15-20%
0%
5%
10%
15%
20%
25%
BK 2017 Targets US Insurance US Endowments US Foundations US RetirementMarket
Global Market US Alternatives(HF / PE)
Global ETFs Asia-Pacific
1. Reconsider Value Proposition to Customers (cont’d)
< 87 >
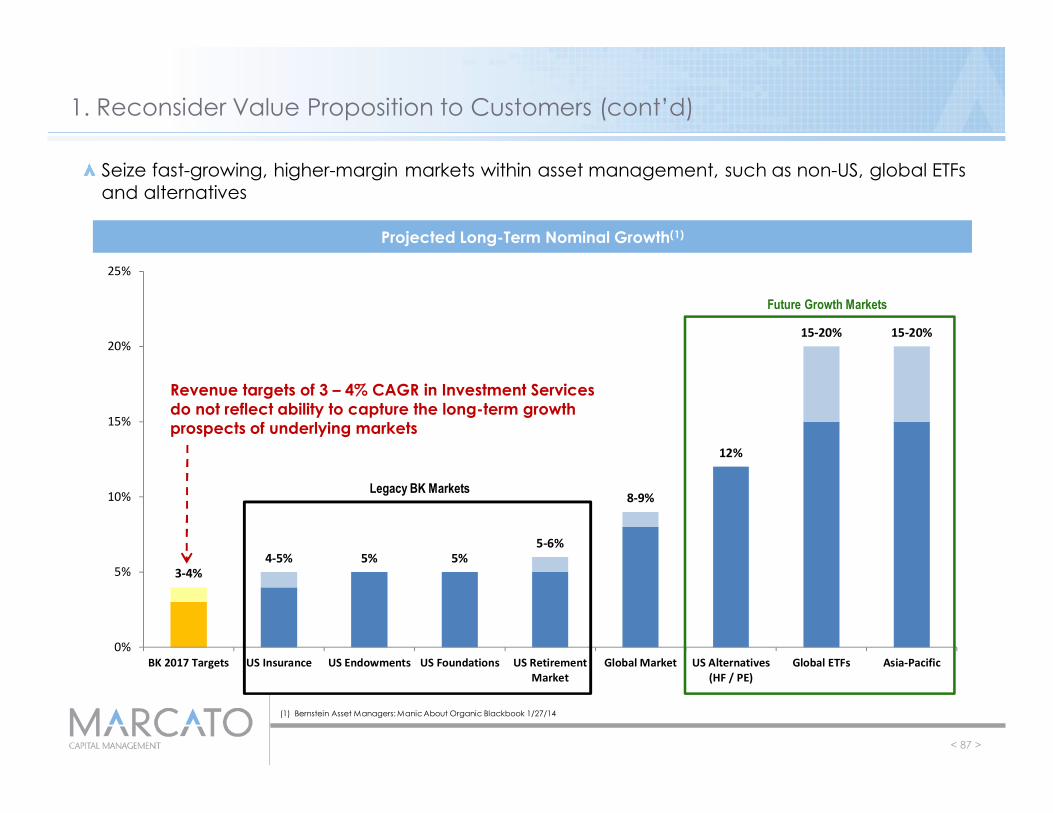
Seize fast-growing, higher-margin markets within asset management, such as non-US, global ETFs and alternatives
(1) Bernstein Asset Managers: Manic About Organic Blackbook 1/27/14
Projected Long-Term Nominal Growth(1)
Legacy BK Markets
Future Growth Markets
Revenue targets of 3 – 4% CAGR in Investment Services do not reflect ability to capture the long-term growth prospects of underlying markets

Q1 2010 Investor Presentation
1. Reconsider Value Proposition to Customers (cont’d)
< 88 >
Global Alternative Investments MarketGlobal ETF Market
Source: State Street 9/9/14 Barclays Conference
ETFs and Alternative Investments are key long-term growth priorities, where significant portions of the servicing functions remain insourced

Q1 2010 Investor Presentation
1. Reconsider Value Proposition to Customers (cont’d)
< 89 >
Lou Gerstner, CEO of IBM (1993 – 2002):
“I announced Operation Bear Hug. Each of the fifty members of the senior management team was to visit a minimum of five of our biggest customers during the next three months. The executives were to listen, to show the customer that we cared, and to implement holding action as appropriate. Each of their direct reports (a total of more than 200 executives) was to do the same. For each Bear Hug visit, I asked that a one- to two-page report be sent to me and anyone else who could solve that customer’s problems”
Senior leadership should be hands-on and actively focus on cultivating client relationships, and the CEO needs to be active as the face of the firm to clients
Source: Lou Gerstner “Who Says Elephants Can’t Dance”

Q1 2010 Investor Presentation
2. Raise I.T. Effectiveness To Top Company Priority
< 90 >
Scalable systems are a critical driver of business value and yet appear antiquated and inefficient to employees, clients and competitorsPlatforms have yet to be integrated and have been a major source of expense growthAn entire new architecture may be necessary
Two Custody Platforms
Five Accounting Platforms
Major Redundancies- Back office headcount- Systems maintenance- Application development- Reporting costs
“Upgrade your tech and bring your business processes and products into the 21st century. The competition is selling cars while BNY is proud of the fact that it sells the cheapest and fastest horse drawn buggy in town. Banking is not a labor intensive business yet BNY has managed to turn it into one via underinvestment in tech and revenue generating professionals”
Source: Glassdoor, R&M Global Custody Survey(1) Per Gunjan Kedia, EVP of State Street, 2/25/15 State Street Analyst Day
Employees
Clients“Bank of New York Mellon are letting themselves down with the continuing lack of merger in their systems”“BNYM continue to struggle with service differentials driven by their multiple platforms custody and accounting”
Competitors(1) “They’re going to get to a point when it becomes hard to catch up with us just because our future functionality is just 6x faster”

Q1 2010 Investor Presentation
2. Raise I.T. Effectiveness To Top Company Priority (cont’d)
< 91 >
BNY Mellon’s current model emphasizes labor over technology and automationHowever, investing in automation is a long-term competitive necessity for BNY Mellon to mitigate risk and improve client servicesMore investments in automation to reduce manual process may be useful but should take place only after legacy IT systems are re-architected
Labor Technology
Long-term Expense Growth Inflationary Deflationary
Innovation Potential & Velocity Medium High
Scalability Not Scalable Scalable
Operational Risk High (Human Error)
Medium (Straight-Through Processing)

Q1 2010 Investor Presentation
9.4x
4.2x
–
1.0x
2.0x
3.0x
4.0x
5.0x
6.0x
7.0x
8.0x
9.0x
10.0x
2. Raise I.T. Effectiveness To Top Company Priority (cont’d)
< 92 >
Staff Expense / Information Technology Expense (FY14)
Source: Company filings(1) At constant $620mm of software expense
Invest in I.T. to drive speed, accuracy and transparencyBNY Mellon’s antiquated I.T. systems and manual processes results in an unbalanced mix of spending on labor over technology and innovation
1x reduction = ~0.40 of potential incremental EPS(1)

Q1 2010 Investor Presentation
ü Compensation Expense â
ü Headcount â
ü Software Expense ä
ü Purchased Services â
ü Returns á
ü Speed & Transparency á
ü Operational Risk â
2. Raise I.T. Effectiveness To Top Company Priority (cont’d)
< 93 >
Applications
Cloud-Enabled Apps
Data Centers
Shared Services
ERP Systems
Custody Platforms
I.T. TRANSFORMATIONStrategy
BUSINESS IMPACT
Set Explicit Targets...How many systems today? How many in
the future?

Q1 2010 Investor Presentation
Implied Headcount (Asset Manager + Asset Servicer)Asset Managers
Capital JPMVanguard BLK BEN Group GIM (2) PIMCO
AUC/A ($tn) $29 $28 $21AUM ($bn) $1,710 $3,100 $4,652 $898 $1,147 $792 $747 $1,744 $709 $2,480 $1,680 $363
STT (IS)
JPM (TSS)
Ass
et
Serv
icer
s
32,700 29,490
29,96033,17041,670 39,670 36,736 34,470
41,200 39,200 36,266 34,000
50,300
27,470 ~27,000
~14,200 12,200
9,266 ~7,000 6,264 5,870 5,700
3,100 ~2,500 2,490 1,435 –
10,000
20,000
30,000
40,000
50,000
60,000
BK STT(Inv. Serv.)
JPM(TSS)
Vanguard BLK BEN Capital Group IVZ TROW JPM(Global Inv. Mgmt.)
LM STT(Inv. Mgmt.)
PIMCO FII
Tota
l Em
ploy
ees
3. Aggressive Headcount Reduction Initiative
Source: Company filings, Marcato estimates(1) JPM’s Treasury & Securities Services division(2) JPM’s Global Investment Management division
Headcount disproportionate to that of comparable companies■ Combinations of similar sized investment managers and investment servicers would imply
meaningfully lower headcount levels■ Headcount discrepancy not bridgeable by BK’s Corporate Trust or Pershing business units
Total Employees
< 94 >
Investment ManagersInvestment Servicers
(1)

Q1 2010 Investor Presentation
50,300
~40,000
30,000
35,000
40,000
45,000
50,000
55,000
BK Benchmarking Target
42,500 42,200
48,000 48,700
49,500
51,100
50,300
40,000
42,000
44,000
46,000
48,000
50,000
52,000
2008 2009 2010 2011 2012 2013 2014
3. Aggressive Headcount Reduction Initiative
< 95 >
Business model requires scalability, efficiency, accuracy, data capture and data security. Manual human processes are an impediment to all of these thingsBK needs better people, not more people
Total Headcount Trajectory Relative Headcount to Benchmark(1)
(1) Reference page 94 for analytical support
∆~10,000

Q1 2010 Investor Presentation
3. Aggressive Headcount Reduction Initiative (cont’d)
< 96 >
Successful restructuring precedents support a strategy of targeted, impactful headcount reductions
Headcount Restructuring in Historical Perspective
Source: Company filings, Company news
Starting Net Headcount % PeriodCompany Headcount (est.) Reductions (est.) Reduction (Yrs.) Date
Historical RestructuringsApple 10,896 4,238 38.9% ~ 2 1997 - 1998Xerox 94,600 33,500 35.4% ~ 4 2000 - 2003Credit Suisse First Boston 27,547 8,959 32.5% ~ 2 2002 - 2003IBM 301,542 81,703 27.1% ~ 2 1993 - 1994Merck 100,000 24,000 24.0% ~ 4 2010 - 2013Starbucks 176,000 39,000 22.2% ~ 2 2008 - 2010Heinz 41,000 8,000 19.5% ~ 2 2006 - 2007Legg Mason 3,550 571 16.1% ~ 2 2011 - 2012Lockheed Martin 140,000 17,000 12.1% ~ 2 2010 - 2011
Current RestructuringsCanadian Pacific 19,500 6,000 30.8% N/A 2012 - 2016EBarclays (Investment Bank) 26,000 7,000 26.9% N/A 2014E - TBUBank of America 284,000 46,000 16.2% N/A 2010 - TBUMicrosoft 128,000 18,000 14.1% N/A 2014E - TBUUBS 62,628 8,628 13.8% ~ 3 2013 - 2015EHewlett Packard 331,800 41,000 12.4% ~ 3 2012 - 2014EValeant 18,000 2,250 12.5% N/A 2013 - TBURoyal Bank of Scotland 141,000 14,000 9.9% ~ 4 2015 - 2019
Q1 2010 Investor Presentation
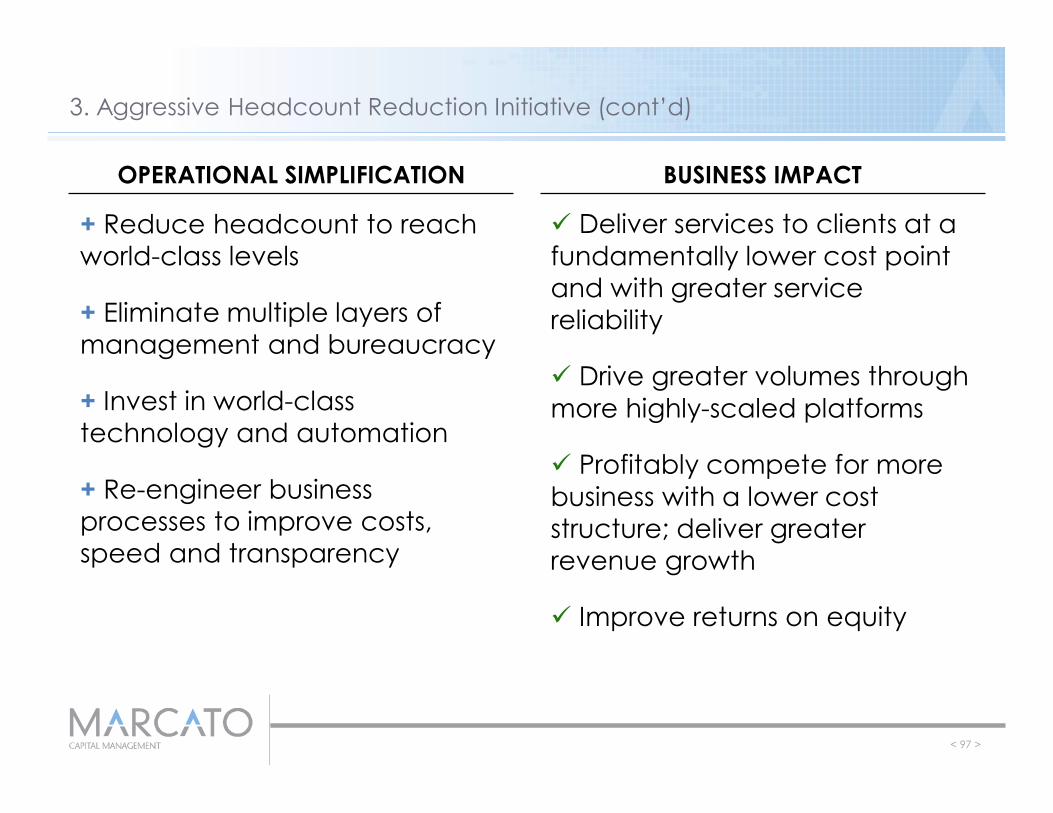
3. Aggressive Headcount Reduction Initiative (cont’d)
< 97 >
+ Reduce headcount to reach world-class levels
+ Eliminate multiple layers of management and bureaucracy
+ Invest in world-class technology and automation
+ Re-engineer business processes to improve costs, speed and transparency
ü Deliver services to clients at a fundamentally lower cost point and with greater service reliability
ü Drive greater volumes through more highly-scaled platforms
ü Profitably compete for more business with a lower cost structure; deliver greater revenue growth
ü Improve returns on equity
OPERATIONAL SIMPLIFICATION BUSINESS IMPACT

Q1 2010 Investor Presentation
3. Aggressive Headcount Reduction Initiative (cont’d)
< 98 >
Lou Gerstner, CEO of IBM (1993 – 2002):
“’If we have too many people, let’s right-size fast; let’s get it done by the end of the third quarter.’ I explained that what I meant by right-size is straightforward: ‘We have to benchmark our costs versus our competitors and then achieve best-in-class status’. I also remarked that we had to stop saying that IBM didn’t lay off people”
“I’ve had a lot of experience turning around troubled companies, and one of the first things I learned was that whatever hard or painful things you have to do, do them quickly and make sure everyone knows what you are doing and why. Whether dwelling on a problem, hiding a problem or dribbling out partial solutions to a problem while you wait for a high tide to raise your boat – dithering and delay almost always compound a negative situation. I believe in getting the problem behind me quickly and moving on”
Source: Lou Gerstner “Who Says Elephants Can’t Dance”

Q1 2010 Investor Presentation
4. Reposition Asset Management
< 99 >
The Index / ETF industry represents a highly compelling long-term growth opportunity for asset management
ETFs & Index Funds Total AUM ($tn)
Bernstein estimates Index & ETF AUM will grow by 4x over the next decade
BlackRock estimates the global ETF industry will grow by 11% CAGR into 2017, expanding by $3.6tn
High-Quality Growth PathwayLong runway for ETF growth supported by deepening adoption within new and existing client segments, financial products, and geographies
Source: Bernstein Asset Managers: Manic About Organic Blackbook 1/27/14, Blackrock 6/17/14 Analyst Day, WisdomTree Investments 11/20/14 Analyst Presentation
$2.6 $3.0 $3.3 $3.8 $4.3 $4.9 $5.5 $6.3 $7.1
$8.0 $8.9
$10.0 $11.1
$12.5
–
$5.0
$10.0
$15.0
'12 '13 '14 '15 '16 '17 '18 '19 '20 '21 '22 '23 '24 '25Index Mutual Funds ETFs

Q1 2010 Investor Presentation
$993
$417 $389
$104 $54 $49 $41 $35 $27 $27 –
$200
$400
$600
$800
$1,000
$1,200
iShares State Street Vanguard PowerShares db x-trackers Lyxor Nomura AMC Wisdom Tree ProShares First Trust
4. Reposition Asset Management (cont’d)
< 100 >
The ETF industry is highly concentrated due to the importance of economies of scaleIndex / ETF strategies have highly attractive incremental margins and can be highly profitable at scale
Top 10 ETF Providers by AUM globally ($bn)
Top 10 players control 87% of the Index / ETF market
Unit Economics
Index / ETF products carry the highest contribution margins of nearly all investment strategy
Source: Bernstein Asset Managers: Manic About Organic Blackbook 1/27/14, Blackrock 6/17/14 Analyst Day

Q1 2010 Investor Presentation
4. Reposition Asset Management (cont’d)
< 101 >
BNY Mellon is uniquely positioned to capture the HUGE opportunity in passive / index / beta products by leveraging its large infrastructure base and existing strengths in technology, distribution, human capital and branding■ Opportunity to serve as white-label asset management solution to other asset management
companies, some of whom may already be custody clients■ Leverage existing institutional distribution channels with RIAs and broker-dealers■ Leverage data, technology and investment insights to become a product development leaderBNY Mellon can scale its existing infrastructure to create a major passive asset manager, but successful execution requires new leadership, new technology, new product design teams and new marketing plan
Back Office Functions Front Office Functions
Fund Accounting & Administration
Portfolio Management
Index Calculation
Broker-Dealer Functions
Product Development
Sales & Distribution
Research & Product Development
Brand & Marketing
BK Competencies BK Competencies
Leverage & scale Develop & grow

Q1 2010 Investor Presentation
$186
$62
$24 $11
–
$20
$40
$60
$80
$100
$120
$140
$160
$180
$200
LDI Index Active Alternatives
4. Reposition Asset Management (cont’d)
< 102 >
BNY Mellon has experienced the greatest inflows into its more beta / process / scale-driven investment strategies like Liability-Driven Investments and Index businesses High-touch, alpha-oriented boutiques make no strategic sense for this Company and are hard to sell to clients...no competitive advantageAlpha boutiques should be sold or spun and BNY Mellon should focus its resources on its competitive advantages within asset management
BNY Mellon Investment Management Inflows (2011 – 2014) ($bn)
Source: Company filings
Strong: β Orientation
Weak: α Orientation

Q1 2010 Investor Presentation
5. Culture of Effectiveness, Urgency and Accountability
< 103 >
Employee Feedback
“Almost no career opportunities, non-existent training, terrible technology infrastructure, and overly bureaucratic. The fact that there is actually a committee to oversee other committees that set internal policies kind of says it all. Unimaginative senior management that is always reacting to competition. Bloated middle management while underinvesting in products, services, and line employees that actually drive revenues.”
“Depending on your point-of-view there aren't high standards for performance. It seems people get rewarded for providing the bare minimum and it seems cultural. Working with other service groups is a nightmare as that culture seems pervasive.”
“They have an ‘if it's not broke, don't fix it’ mentality, so the creativity and energy needed to drive ideas forward can only be done if you're truly passionate about what you do...But, I will say that it's near-impossible to get fired, so job security is incredible.”
“The merger, even six years later, still shows signs of growing pains. Advancement is nearly stagnant and so are the salaries. Communication between the various departments is a struggle and they're constantly shuffling and consolidating.”
Source: Glassdoor
Modernize the culture, with compensation to match – lean, faster, and commercially intenseEmployee feedback repeatedly emphasizes a culture of bureaucracy, lifetime employment, stifled creativity, out-of-touch leadership, lack of business integration and poor communication

Q1 2010 Investor Presentation
5. Culture of Effectiveness, Urgency and Accountability (cont’d)
< 104 >
Employee Feedback
“There seems to be a fairly large number of individuals who don't know what the company does beyond their own responsibilities and they are ok with that. There is little global awareness.”
“Politics, dysfunctional org structure, misalignment of systems, and the legacy of two strong financial institutions that have never ‘really’ merged.”
“Invest more in technology and training employees on topics that matter. Keep morale up in the company and take better steps to retain talented employees.”
“Main challenge is navigating the variety of corporate cultures which exist due to the lack of integration.Advice to Management: Focus on integrating, focus on the experienced employees, and consolidate the top three tiers of management.”
“Senior Executives and Senior Mgmt who have been with BONY for 15+ years are not the ones who will lead the bank to new successful strategies and profitability.”
“Very large company that can't get out of its own way. Bureaucracies are overwhelming, overly risk averse; little opportunity to make a value added contribution to the business of one's own client group...Stated initiatives by Chairman to improve on bureaucracies do not make it down to the operational level because people are fearful of losing their jobs (presumably). People are stifled of creativity and line managers are fearful to support and create change for fear of losing job. Massive culture change is needed.”
Source: Glassdoor

Q1 2010 Investor Presentation
5. Culture of Effectiveness, Urgency and Accountability (cont’d)
< 105 >
FAST ORGANIZATION
LOW-COST OPERATIONSBELIEF SYSTEMS
ALIGNED INCENTIVES+ Zero-based budgeting+ Consolidate systems and vendors+ Invest in digital automation+ Fewer layers of management & organizational bottlenecks+ Common metrics & reporting+ Hands-on management; less committee delegation
+ Greater % of processes as shared services+ Greater leveraging of systems+ Compensation and headcount levels â+ Purchased services costs â
+ “Outcomes drive compensation”+ “Clients define our success”+ “Deliver results in an uncertain world”+ “Adapt & learn”+ “Discipline improves execution”+ “Stay lean to go fast”
+ Targets-based program, reset annually+ Targets should be applied as far down the organization as practical (000s of eligible officers and executives)+ Focus on a mix of financial, strategic and total company performance goals+ Key metrics: operating margins, ROE, growth, risk and talent development
< 105 >

Q1 2010 Investor Presentation
6. Update Regulatory Sophistication and Outreach Strategy
< 106 >
Mixed Track Record of Anticipating Key Regulatory Trends
Mixed Track Record of Influencing Regulatory Changes
Todd Gibbons (4/19/11): “In terms of the leverage ratio, I really haven’t been overly focused on it at this point. I don’t think it will be the constraining ratio for us...I don’t think it’s going to change business behavior at this point as I look at it”
Todd Gibbons (10/28/14): “We now know most of what the rules are and so far it’s been the supplemental leverage ratio that is turning out to be our binding constraint”
Source: Company transcripts, 1/31/14 Liquidity Coverage Ratio Memo, 6/13/14 Regulatory Capital Rules Memo
Rule BNY Mellon Regulatory Proposal Final
SLR Balance sheet daily averaging üSLR Exclusion or caps on Central Bank deposits ûSLR Exemptions to leverage requirements for
cash deposit surges ûLCR Operational services (not deposits) subject
to legally binding written agreement üLCR Exclude deposits in connection with prime
brokerage services ûLCR Exclude from “operational deposits”
instances where bank provides services as an “agent or administrator
û
LCR Revise definition of “operational services” to include administration of investment assets, collateral management services, and settlement of FX transactions
û
BNY Mellon needs to hire key leaders and talent to develop a leadership position with regulatory groups in priority geographiesSophisticated regulatory outreach requires more than just subject matter experts but also relationship managersDemonstrate safety, soundness and vision that comforts key regulatory constituents

Q1 2010 Investor Presentation
6. Update Regulatory Sophistication and Outreach Strategy (cont’d)
< 107 >
Position BNY Mellon as a problem solver in the global risk management matrix by forming a sovereign advisory franchise like BlackRock Solutions■ In addition to being a $550mm+ revenue business, BlackRock Solutions helps BlackRock strengthen relationships with
key regulators and official institutions, while also burnishing BlackRock’s reputation from prestige advisory assignmentsBNY Mellon has a unique opportunity to leverage its size, data, systems, expertise, lack of trading conflicts, and low public profile to support regulatory bodies and official institutions with similar complex assignments
Risk analytics platformOperations outsourcingEnd-to-end investment system
Valuation and risk assessmentBalance sheet strategyDisposition of distressed assets
Financial Markets Advisory
Capabilities Clients & Assignments
Assisted in 2012 Prudential Capital Assessment Review (PCAR)
Reviewed and valued loan portfolio of 18 financial firms
Advised on the creation of a bad bank for certain RBS assets
Analyze assets of Fannie Mae and Freddie Mac; wind-down distressed debt book of Bear Stearns & AIG

Q1 2010 Investor Presentation
6. Update Regulatory Sophistication and Outreach Strategy (cont’d)
< 108 >
“If you can’t measure it, you can’t manage it”BNY Mellon blames a significant portion of its expense growth since 2011 on regulatory and compliance costsDespite the significant increases in regulatory & compliance costs, BNY Mellon has been unwilling or unable to quantify its compliance expensesWe question how the Company can manage this huge component of expense growth without detailed visibility and thoughtful analysis of its components and drivers
Compliance and Regulatory RestructuringFormulate a long-term strategy for tackling compliance and regulatory costsImmediately conduct a comprehensive review of compliance and regulatory operations to restructure and streamline the compliance chain, eliminate redundancies and reduce costs

Q1 2010 Investor Presentation
7. Consider A New Brand Image
< 109 >

BNY
1
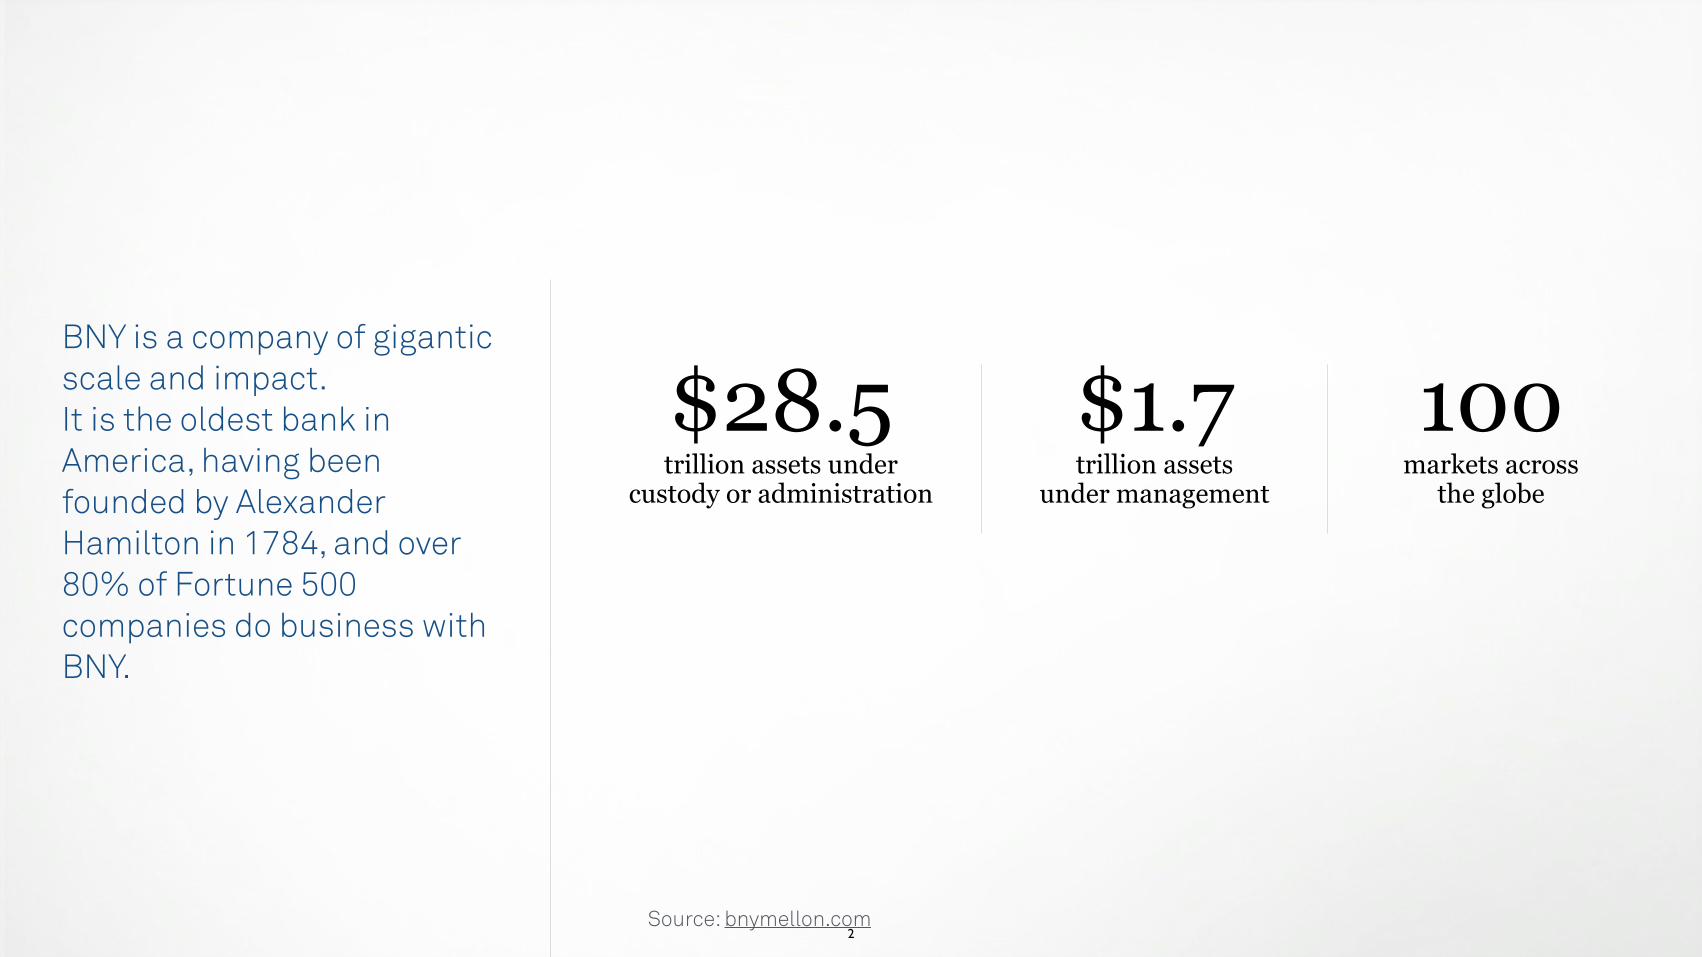
2
BNY is a company of gigantic scale and impact. It is the oldest bank in America, having been founded by Alexander Hamilton in 1784, and over 80% of Fortune 500 companies do business with BNY.
$28.5 trillion assets under
custody or administration
$1.7 trillion assets
under management
100 markets across
the globe
Source: bnymellon.com

3
Yet in today’s market, the share of conversation in the news media and among the public has BNY coming in behind the majority of its competitors.
7:1 JP Morgan Chase: BNY Mellon
6:1 Citigroup: BNY Mellon
1:1 State Street: BNY Mellon
Source: Google trend report compiling news articles and public search of each company name in Jan 2015

4
Over the course of the last decade, the majority of the conversation about BNY took place at the moment the two companies came together as one.
Source: Google trend report compiling news articles and public search of each term over the last 9 years.
- Bank of New York - Bank of New York Mellon - BNY - BNY Mellon

5
- Bank of New York - Bank of New York Mellon - BNY - BNY Mellon
Source: Google trend report compiling news articles and public search of each term over the last 9 years.
BNY went from being a relatively popular company in the public sphere, to losing its cache soon after the merger.
Over the course of the last decade, the majority of the conversation about BNY took place at the moment the two companies came together as one.

6Source: Google trend report compiling news articles and public search of each term over the last 9 years.
The merger did not leave a strong impression of the new brand, and today the
terms “Bank of New York”, “Bank of New York Mellon”, “BNY” and “BNY Mellon” are being
used interchangeably.
- Bank of New York - Bank of New York Mellon - BNY - BNY Mellon
Over the course of the last decade, the majority of the conversation about BNY Mellon took place at the moment the two companies came together as one.
BNY went from being a relatively popular company in the public sphere, to losing its cache soon after the merger.

7Source: bnymellon.com
What’s made this convergence of brands even more difficult is that BNY still operates with a multitude of “boutique” brands under its Investment Management wing - 14 as of today - most of which are not recognizable as a part of the parent company.
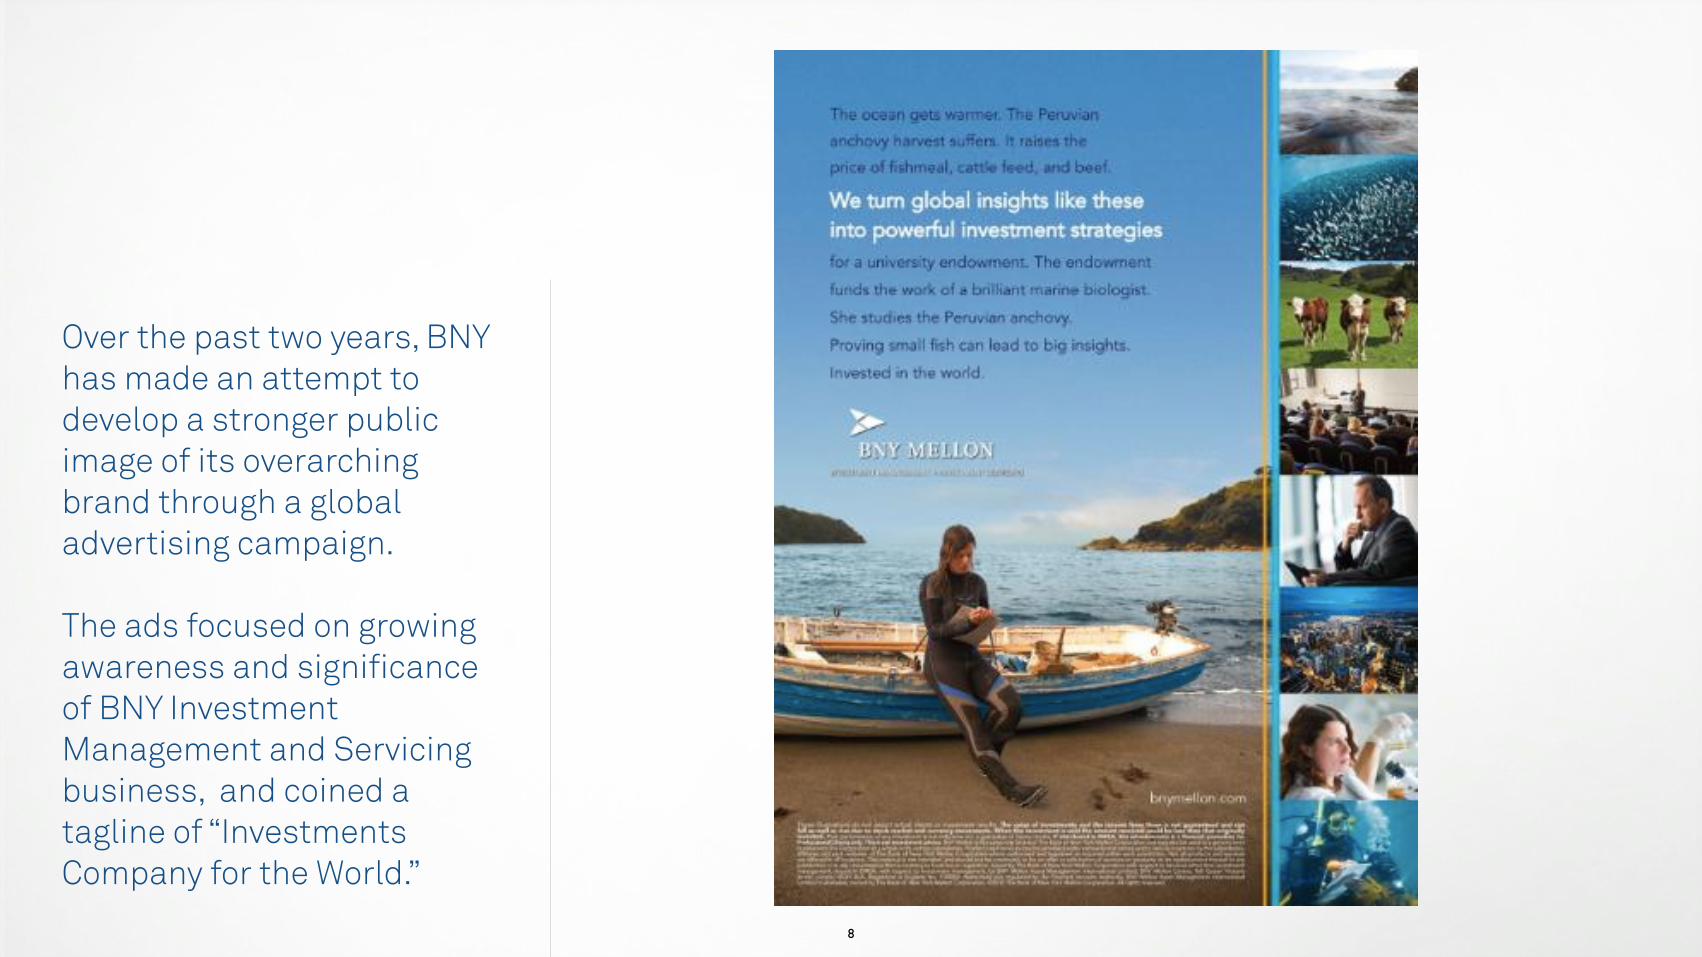
8
Over the past two years, BNY has made an attempt to develop a stronger public image of its overarching brand through a global advertising campaign.
The ads focused on growing awareness and significance of BNY Investment Management and Servicing business, and coined a tagline of “Investments Company for the World.”

9
And while the advertising was well executed, it may have been developed across the wrong strategic brief.
Without a singular brand, the company was still sending the majority of investors to work with one of its 14 boutiques, none of which are covered in the ads themselves.

10
What’s more, it did not seem to jar the opinions of individuals within the category.
We conducted an anonymous, informal survey with senior stakeholders in the finance sector in New York, and discovered that their opinions of BNY have not shifted.
traditional confused
custodian venerable rational old
boring stale Hamilton
Source: Most common words used by our sample to describe BNY Mellon today. Bigger words were mentioned more frequently.
big
unchanging

11
And that lackluster opinion and lack of interest in the BNY brand may be influencing more than just investors and peers - it may have a significant influence on the new talent vying to work at the company.
Source: quicksprout.com analysis of social media engagement in the past 60 days
BNY organic social media conversation is minimal in
comparison to the competition, especially where it matters most -
career interest. BNY
Mel
lon
Citig
roup
JP
Mor
gan
Chas
e

12
ALL OF THIS DATA LEADS US TO A SINGLE CONCLUSION:
The public brand of BNY has not taken root with the
press, investors, advisors, high net worth individuals nor potential employees.

13
ALL OF THIS DATA LEADS US TO A SINGLE CONCLUSION:
The public brand of BNY has not taken root with the
press, investors, advisors, high net worth individuals nor potential employees.
Instead, the BNY brand is splintered across a multitude
of names, entities and preconceptions, without a
motivating image the public can connect with.

14
In order to succeed, BNY must immediately
reconsider its marketing and services
offering in order to build a brand for the
future.
ALL OF THIS DATA LEADS US TO A SINGLE CONCLUSION:
The public brand of BNY has not taken root with the
press, investors, advisors, high net worth individuals nor potential employees.
Instead, the BNY brand is splintered across a multitude
of names, entities and preconceptions, without a
motivating image the public can connect with.

How does BNY approach this challenge?
THE QUESTION IS:

16
First, we must note that the industry itself has become revolutionized over the past decade. Banks today are as much technology services as they are finance institutions, and many have evolved to be massive marketing machines.
Source: McKinsey and Associates, How winning banks refocus their IT budgets for digital CMO Council Marketing Spend Factsheet 2013
“Digital technology is transforming the financial-
services industry, and banks face the challenge of
fully digitizing their businesses.”
Escalating competition has created a 5.6% marketing spend lift in the financial services sector, raising its
media expenditures beyond $4.6 billion in 2013.

17
BNY has remained traditional as other banks embraced calculated
risks to move forward.
GOING FORWARD, BNY MUST DEVELOP AN INTEGRATED MARKETING PLAN BASED ON THREE OBJECTIVES:
BUILD A SINGLE BRAND (MERGE ALL ENTITIES UNDER ONE NAME)
AND RAISE ITS PUBLIC IMAGE.
CONNECT WITH PRIORITY TARGETS THROUGH
DIGITAL AND MOBILE.
COMBAT CURRENT PRECONCEPTIONS OF THE BRAND THROUGH
BRAND ACTIONS.
OUR SOLUTION:

18
THE CAMPAIGN IDEA:

19
BUILD A SINGLE BRAND: IN ORDER TO INCREASE SCALE AND CONNECT WITH MORE INVESTORS, WE MUST START WITH A LARGE-SCALE EFFORT TO MAKE OUR BRAND MEMORABLE
Magazine Televison
We advise focusing this above-the-line effort in key financial capitals in the world: New York, London, Shanghai, Hong Kong, Chicago and San Francisco.
SEO Public Relations

20
PRINT EXECUTIONS:

21
DIGITAL BILLBOARDS:

22
CONNECT WITH PRIORITY TARGETS: HIGH NET WORTH INVESTORS, ADVISORS, AND TALENT IN THIS SEGMENT ARE AHEAD OF THE POPULATION IN DIGITAL, AND WE MUST MEET THEIR ON-DEMAND NEEDS THROUGH.
Responsive Brand Digital, Mobile & Tools
Digital/Mobile Video and Blog Content
Brand Social & CRM
Magazine Televison SEO Public Relations
In coordination with a mass effort, we will tailor digital and mobile media and services directly to our most desirable target market, connecting with them when they are most receptive to our message.

23
DIGITAL TAKEOVERS:

24
MOBILE APPLICATION:

25
COMBAT PRECONCEPTIONS THROUGH BRAND ACTIONS. BNY MUST NOT JUST TALK THE TALK, BUT WALK THE WALK. COORDINATING A SERIES OF PUBLIC EVENTS AND INTERNAL ACTIONS WILL GIVE THE WORLD PROOF THE BRAND HAS TRULY EVOLVED.
Responsive Brand Digital, Mobile & Tools
Digital/Mobile Video and Blog Content
Brand Social & CRM
Magazine Televison SEO Public Relations
Develop programs that gives the press & our target audience the proof that BNY Mellon has truly evolved.
New Tools
Public Events & Sponsorships

26
EXPERIENTIAL BRAND ACTION:

This integrated marketing approach will propel BNY to become a household name of significant value.
What’s more, it will assist the company in retaining current customers while encouraging new prospects to
experience BNY firsthand.
DESIRED RESULT
APPENDIX
Thank You

29
What we mean when we say “brand action”:
Develop a program that gives investors, advisors, institutions, high net worth individuals, potential employees and the press
the belief that BNY Mellon is one of the few globally great institutions.

30
EMOTIONALRATIONAL
Develop practices, policies, behaviors and comms that make the
public feel that BNY Mellon’s ambitions match its size.
With those actions in mind, BNY Mellon becomes an entity whose forward thinking create trust in
the future.
In order to do so, we must develop or promote our rational actions and services in order to feed a larger emotional message.

31
EMOTIONALRATIONAL
Employees are allowed to use up to 20% of their time on projects outside of their day to day work.
Google is a tech company that values humanity and innovation
over the pursuit of profit.
Instead of learning from our competitors, we should learn from brands outside of our category.

32
EMOTIONALRATIONAL
Ritz Carlton service employees are allowed to spend up to $2,000 per
customer to improve their stay.
The Ritz-Carlton is devoted to making sure I only have
the best experience.
Instead of learning from our competitors, we should learn from brands outside of our category.

33
EMOTIONALRATIONAL
Every Apple store comes equipped with the Genius Bar to help buyers
deal with product challenges.
Apple is a friendly face in a cold
technology landscape.
Instead of learning from our competitors, we should learn from brands outside of our category.

34
PRConsumer
engagement platform
Ad Campaign
PRCONSUMER
ENGAGEMENT PLATFORM
WE BELIEVEactions like these, communicated to the public, will cause a reappraisal of BNY Mellon.
One bank, many brands Stale, old fashioned and slow to advance
TO
FROM
One brand, one powerful entity: BNY Mellon Future thinking, with a discerning eye on the past
CORE BEHAVIOR
COMMUNICATIONS CAMPAIGN DIGITAL
TRADITIONAL ADVERTISING
ADVOCACY
SOCIAL
EXPERIENTIAL

Q1 2010 Investor Presentation
VIII. Unlocking Potential: New Leadership
< 110 >

Q1 2010 Investor Presentation
Reflections on Change
< 111 >
“And what's interesting, when you promote people into new jobs or bring in new talent from outside, how you get increasingly different insights into how we operate our business. Adding these people and promoting these people are making us a better company. They're raising the bar in terms of the excellence that we expect of ourselves and we expect of our staff. And it is in fact permeating the entire organization. As new people come in with new ideas and raise the expectations, it's helping us better perform as a company.”
- Gerald Hassell, CEO10/28/14 Investor Day
We Believe Shareholders Should Embrace This Advice And Seek New Leadership

Q1 2010 Investor Presentation
Key Leadership Needs
< 112 >
KEY LEADERSHIP ROLES KEY SKILLS AND EXPERIENCES
CEO Cultivate critical relationships with key clients and regulatorsTeam-building: identify internal and external talent that can drive organizational changeInvigorate culture by elevating H.R. and implementing organizational structures that drive accountability and emphasize clients“Block-and-tackle”: critically evaluate the business portfolio, focus the strategic priorities, enforce accountability
CFO Perform continuous benchmarking of growth, costs and operating metrics against competitorsImplement rigorous measurement and compensation systemsCentralize business planning and budgeting to drive a unified strategy and reduce duplicate spendingCritically evaluate return on investments for business initiativesImplement “zero-based budgeting” practicesOptimize balance sheet against onerous regulatory constraints
CTO Consolidate “mutant” IT systems and platforms that have proliferated over timeCull unproductive projects; manage, measure and prioritize technology initiativesDrive automation initiatives that increase employee productivity

Q1 2010 Investor Presentation
Leadership Tenure
< 113 >
@ BNY MellonExecutive Title Start Year Tenure (yrs.)Gerald Hassell CEO 1973 42Todd Gibbons CFO 1986 29Suresh Kumar CTO 1986 29Karen Peetz President 1998 17Brian Shea CEO, Investment Services 1983 32Kurt Woetzel President, BNY Mellon Markets Group 1985 30Curtis Arledge CEO, Investment Management 2010 5Average 26 yrsMedian 29 yrs
Nearly the entire Senior Management team has worked at BNY Mellon for 25+ years
Is this the team to deliver fresh perspectives and organizational change?

Q1 2010 Investor Presentation
Available Executive Talent For A New BNY Mellon (Anonymized)
< 114 >
Executive #1 Executive #2 Executive #3
Capital markets expertise ü ü üProven leadership at a large global financial institution ü ü üOperations, risk and technology experience ü ü üAsset management expertise ü ü üRegulatory credibility ü üEmerging markets expertise ü üShareholder credibility ü ü ü
We Have Identified Compelling Executive Talent

Q1 2010 Investor Presentation
IX. Valuation Potential
< 115 >

Q1 2010 Investor Presentation
Estimated Excess Headcount ~10,000BK Staff Expenses $5,845BK Staff Expenses per FTE $0.115Implied Excess Staff Expenses $1,148
Other Expense Opportunity:Software, furniture & equipment $942Professional, legal and other purchased services $1,339Net Occupancy Expenses $610"Other" $1,031
SubTotal $3,922Illustrative Pre-Tax Impact of 5% improvement $196
EPS ImpactExcess Staff Expense Savings $1,148Other OpEx Savings 196
Total Pre-Tax Savings $1,344Incremental Net Income $981
Fully Diluted Shares Outstanding (FY15) 1,107EPS Benefit $0.89Assumed P/E 15.0 xValue Creation Per Share $13.30
HQLA Assets ($bn) $164LCR Runoff ($bn) $151LCR Ratio % 109%Target LCR Ratio % 100%Excess HQLA ($bn) $13
HQLA Yield 0.7%Non-HQLA Yield 1.4%
Incremental Net Interest Revenue $182Incremental Net Income $133
Fully Diluted Shares Outstanding (FY15) 1,107EPS Benefit $0.12Assumed P/E 15.0 xValue Creation Per Share $1.80
Expense Base and Investment Yield Opportunity
Source: Company filings, Marcato estimates
< 116 >
Expense Reduction Categories Enhanced Investment Yield Potential
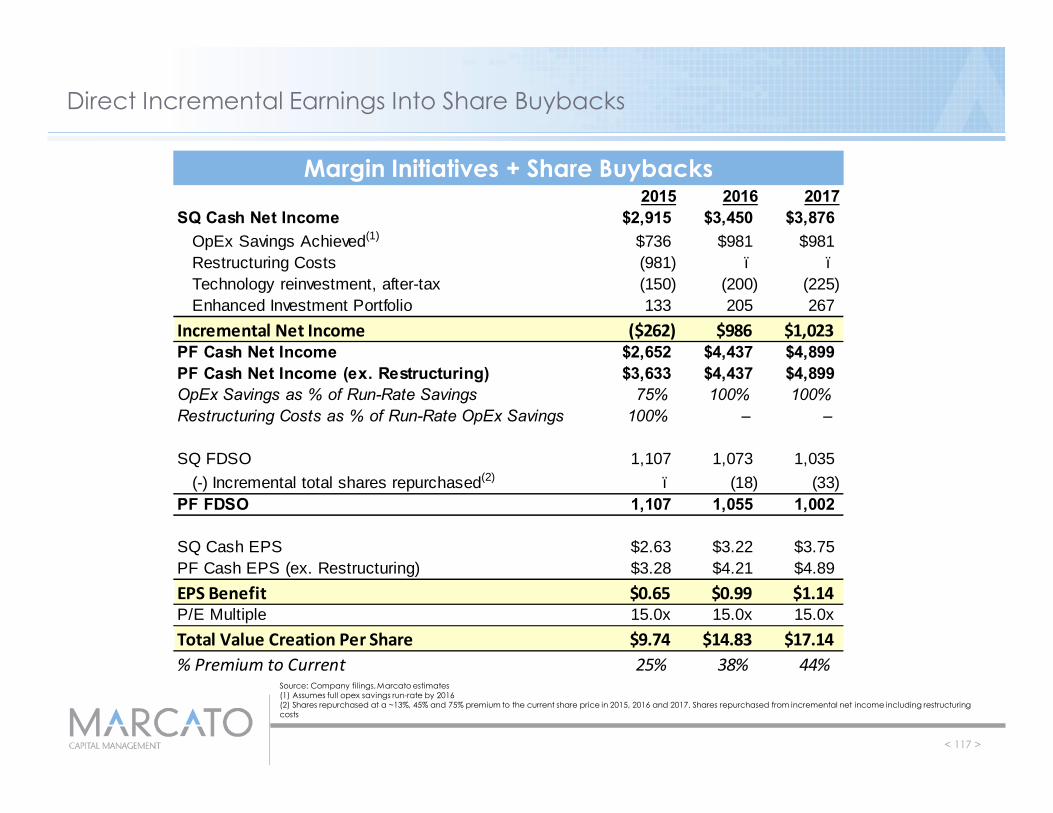
Q1 2010 Investor Presentation
2015 2016 2017SQ Cash Net Income $2,915 $3,450 $3,876
OpEx Savings Achieved(1) $736 $981 $981Restructuring Costs (981) – –Technology reinvestment, after-tax (150) (200) (225)Enhanced Investment Portfolio 133 205 267
Incremental Net Income ($262) $986 $1,023PF Cash Net Income $2,652 $4,437 $4,899PF Cash Net Income (ex. Restructuring) $3,633 $4,437 $4,899OpEx Savings as % of Run-Rate Savings 75% 100% 100%Restructuring Costs as % of Run-Rate OpEx Savings 100% – –
SQ FDSO 1,107 1,073 1,035(-) Incremental total shares repurchased(2) – (18) (33)
PF FDSO 1,107 1,055 1,002
SQ Cash EPS $2.63 $3.22 $3.75PF Cash EPS (ex. Restructuring) $3.28 $4.21 $4.89EPS Benefit $0.65 $0.99 $1.14P/E Multiple 15.0x 15.0x 15.0xTotal Value Creation Per Share $9.74 $14.83 $17.14% Premium to Current 25% 38% 44%
Direct Incremental Earnings Into Share Buybacks
Source: Company filings, Marcato estimates(1) Assumes full opex savings run-rate by 2016(2) Shares repurchased at a ~13%, 45% and 75% premium to the current share price in 2015, 2016 and 2017. Shares repurchased from incremental net income including restructuring costs
< 117 >
Margin Initiatives + Share Buybacks

Q1 2010 Investor Presentation
Marcato Proposal: Total Value Creation Opportunity
Source: Company filings, Marcato estimates(1) At 10% revenue CAGR (high-end of State Street’s long-term organic revenue goal) and PF 35% pre-tax margins under Marcato Plan. Assumes incremental net income enables 10mm of incremental cumulative share repurchases by 2017
< 118 >
By restoring BK’s earnings trajectory to its potential and eliminating the “credibility discount” created from years of stagnant earnings and missed targets, significant shareholder value can be created
2015 2016 2017SQ Cash EPS (LTM) $2.63 $3.22 $3.75
(+) Expense efficiencies & NIM yields 0.65 0.99 1.14(+) Improved growth profile(1) 0.10 0.25 0.45
PF Cash EPS (LTM) $3.39 $4.45 $5.34P/E Multiple 15.0x 15.0x 15.0xValue Per Share $50.78 $66.82 $80.05
(+) Cumulative DPS $0.74 $2.08 $3.68Adj. Value Per Share $51.52 $68.90 $83.73% Premium to Current 32% 76% 114%