Embed Size (px)
Citation preview

2 ALASKA ECONOMIC TRENDS MARCH 2012
March 2012Volume 32Number 3
ISSN 0160-3345
To contact us for more information, a free subscription, mailing list changes, or back
copies, e-mail [email protected] call (907) 465-4500.
Alaska Economic Trends is a monthly publication dealing with a wide variety of economic issues in the state. Its purpose
is to inform the public about those issues.
Alaska Economic Trends is funded by the Employment Security Division of the Alaska Department of Labor and
Workforce Development. It’s published by the Research and Analysis Section.
Alaska Economic Trends is printed and distributed by Assets, Inc., a vocational training and employment program, at a
cost of $1.37 per copy.
Material in this publication is public information, and with appropriate credit may be reproduced without permission.
Cover photo: A worker in the Alaska Railroad wheel shop, courtesy of Alaska
Railroad Corporation
On page 4, passengers wait for the train to depart on a trip from Anchorage to
Seward. Photo by Ciaran Bohane
Governor Sean ParnellCommissioner Click Bishop
The Span of Alaska’s Railways 4 Modern transportation, enduring piece of history
Workplace Deaths on Steady Decline 10 Even the most dangerous jobs become safer
Trends Index 2011 15Employment Scene 16 What if Alaska had followed the U.S. recession pattern?
Sam DapcevichCover Artist
Sara WhitneyEditor and Graphics Artist
To contact Trends authors or request a free electronic or print subscrip-tion, e-mail [email protected] or call (907) 465-4500. Trends is on the Web at labor.alaska.gov/trends.
Brynn KeithDirector, Administrative Services
Dan RobinsonChief, Research and Analysis
Trends Authors
Sara Verrelli, a re-search analyst at the Department of Labor in Juneau, manages the Census of Fatal Occupational Injuries and Occupational Safety and Health Statistics federal-state programs. Contact her at (907) 465-4539 or [email protected].
Caroline Schultz, an Alaska Department of Labor and Work-force Development economist in Juneau, specializes in housing market research. To reach her, call (907) 465-6027 or e-mail her at [email protected].
Dan Robinson is an economist and chief of the Research and Analysis Section at the Alaska Department of Labor and Workforce Development in Juneau. To reach him, call (907) 465-6040 or e-mail him at [email protected].
3MARCH 2012 ALASKA ECONOMIC TRENDS
Railroads helped shape transportation system, cities
By CommissionerClick Bishop
In this month’s Trends we examine the role railroads have played in Alaska’s economic development.
Modern Alaska probably wouldn’t exist without the mixed fortunes that have been the Alaska railways. Going back to the early 20th century, railroad transportation has been a key physical connection be-tween the interior and the tidewater ports. An early railroad camp on Ship Creek was the beginning of Anchorage, our larg-est city.
The Alaska Railroad continues to be an integral piece of our state’s transporta-tion system. Over the past century, the railroad’s role has evolved including the transition to state ownership in 1984. But it remains a profi table and signifi cant part of the transportation of both natural resources and almost half a million pas-sengers each year.
Making Alaska a saferplace to work and live
Also in this issue, we focus on workplace safety. Although even one accident, in-jury, or death is one too many, workplace illness and injury rates in Alaska have been dramatically reduced in the last two decades.
The national measure of workplace fatali-ties is the number per 100,000 workers. The most recent calculation is 5.6 in 2009, down from 31.4 in 1992.
The Governor’s Safety and Health Con-ference will be March 19–21 at the Egan Center in Anchorage. Administered by the Alaska Safety Advisory Council, the conference focuses on safety and health issues. Its training and networking op-portunities illustrate a strong commitment
and partnership among industry, govern-ment, and labor organizations. For more information about the conference, go to Labor.Alaska.Gov.
Young Alaskans also need positive ex-posure to safety and health. Over the last three years, the Alaska Department of Labor and Workforce Development has made aggressive efforts to provide work-place safety training to more than 12,000 K-12 students throughout Alaska.
With the help of agencies such as the Alaska Highway Safety Offi ce, we are seeing fewer alcohol related fatalities on our roads and highways.
How many of you religiously wear your seatbelts? I often have to look down to see if I buckled up since it’s become au-tomatic for me. Our next big challenge is to get people to recognize — and avoid — the dangers caused by distracted driving. Taking even one call on a cell phone is a distraction for a driver, so ask your friends to pull over before taking or placing a call.
There are many opportunities to join forces with the Alaska Department of Labor’s Division of Labor Standards and Safety through partnership, cooperative recognition programs like the Safety and Health Achievement Recognition Pro-gram and the Voluntary Protection Pro-gram, or our free consultation program.
We live and work in some of the most hazardous conditions on the planet, and Alaskans are famous for rugged individ-ualism and toughness: attitudes that can confl ict with safety. But we are changing attitudes and developing a culture that makes Alaska a safer place in which to work and live.
4 ALASKA ECONOMIC TRENDS MARCH 2012
By CAROLINE SCHULTZ, Economist
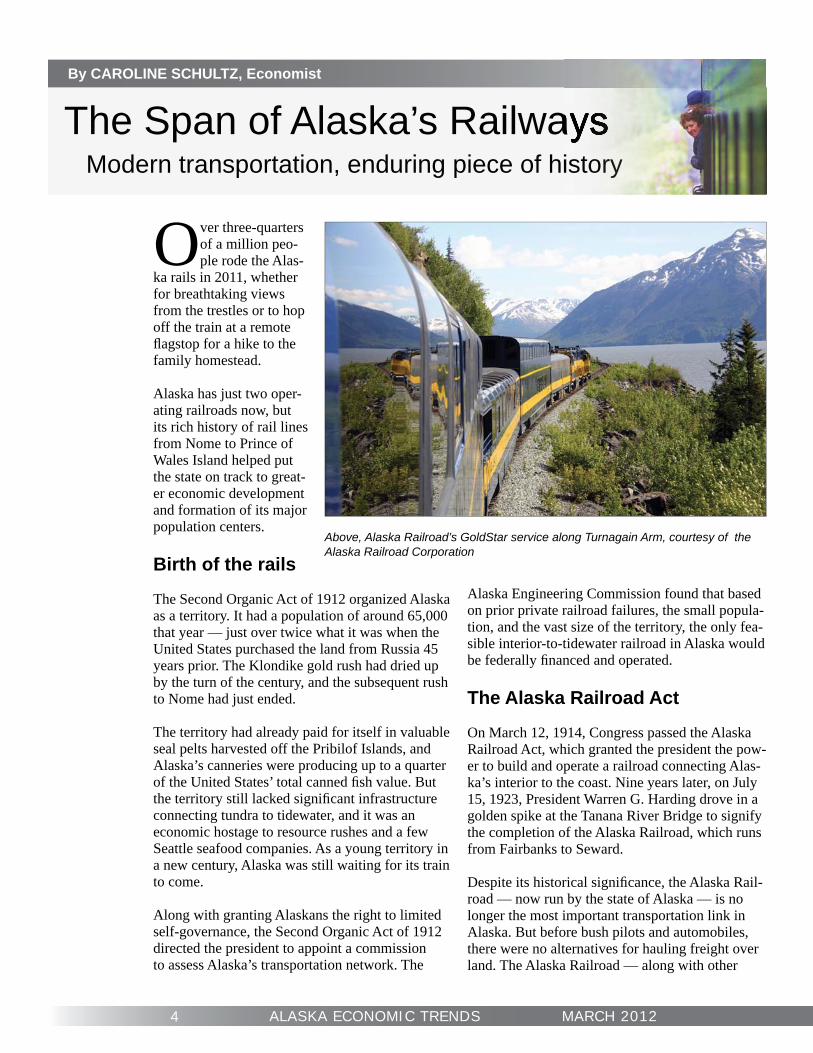
Above, Alaska Railroad’s GoldStar service along Turnagain Arm, courtesy of the Alaska Railroad Corporation
Over three-quarters of a million peo-ple rode the Alas-
ka rails in 2011, whether for breathtaking views from the trestles or to hop off the train at a remote fl agstop for a hike to the family homestead.
Alaska has just two oper-ating railroads now, but its rich history of rail lines from Nome to Prince of Wales Island helped put the state on track to great-er economic development and formation of its major population centers.
Birth of the rails
The Second Organic Act of 1912 organized Alaska as a territory. It had a population of around 65,000 that year — just over twice what it was when the United States purchased the land from Russia 45 years prior. The Klondike gold rush had dried up by the turn of the century, and the subsequent rush to Nome had just ended.
The territory had already paid for itself in valuable seal pelts harvested off the Pribilof Islands, and Alaska’s canneries were producing up to a quarter of the United States’ total canned fi sh value. But the territory still lacked signifi cant infrastructure connecting tundra to tidewater, and it was an economic hostage to resource rushes and a few Seattle seafood companies. As a young territory in a new century, Alaska was still waiting for its train to come.
Along with granting Alaskans the right to limited self-governance, the Second Organic Act of 1912 directed the president to appoint a commission to assess Alaska’s transportation network. The
Alaska Engineering Commission found that based on prior private railroad failures, the small popula-tion, and the vast size of the territory, the only fea-sible interior-to-tidewater railroad in Alaska would be federally fi nanced and operated.
The Alaska Railroad Act
On March 12, 1914, Congress passed the Alaska Railroad Act, which granted the president the pow-er to build and operate a railroad connecting Alas-ka’s interior to the coast. Nine years later, on July 15, 1923, President Warren G. Harding drove in a golden spike at the Tanana River Bridge to signify the completion of the Alaska Railroad, which runs from Fairbanks to Seward.
Despite its historical signifi cance, the Alaska Rail-road — now run by the state of Alaska — is no longer the most important transportation link in Alaska. But before bush pilots and automobiles, there were no alternatives for hauling freight over land. The Alaska Railroad — along with other
The Span of Alaska’s Railways Modern transportation, enduring piece of historyistorryyyy
5MARCH 2012 ALASKA ECONOMIC TRENDS
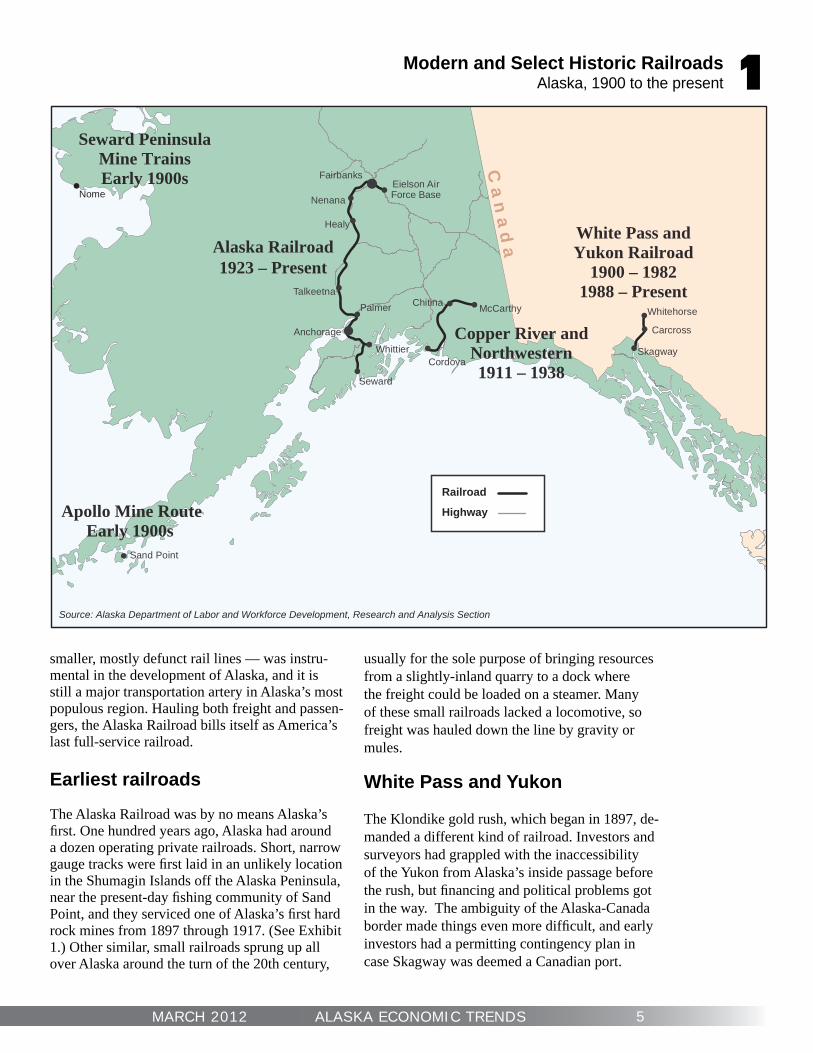
Modern and Select Historic RailroadsAlaska, 1900 to the present 1
smaller, mostly defunct rail lines — was instru-mental in the development of Alaska, and it is still a major transportation artery in Alaska’s most populous region. Hauling both freight and passen-gers, the Alaska Railroad bills itself as America’s last full-service railroad.
Earliest railroads
The Alaska Railroad was by no means Alaska’s fi rst. One hundred years ago, Alaska had around a dozen operating private railroads. Short, narrow gauge tracks were fi rst laid in an unlikely location in the Shumagin Islands off the Alaska Peninsula, near the present-day fi shing community of Sand Point, and they serviced one of Alaska’s fi rst hard rock mines from 1897 through 1917. (See Exhibit 1.) Other similar, small railroads sprung up all over Alaska around the turn of the 20th century,
usually for the sole purpose of bringing resources from a slightly-inland quarry to a dock where the freight could be loaded on a steamer. Many of these small railroads lacked a locomotive, so freight was hauled down the line by gravity or mules.
White Pass and Yukon
The Klondike gold rush, which began in 1897, de-manded a different kind of railroad. Investors and surveyors had grappled with the inaccessibility of the Yukon from Alaska’s inside passage before the rush, but fi nancing and political problems got in the way. The ambiguity of the Alaska-Canada border made things even more diffi cult, and early investors had a permitting contingency plan in case Skagway was deemed a Canadian port.
‘
!
!
!!
!
!
!
!
! !
!
!
Whitehorse
Carcross
Alaska Railroad1923 – Present
Copper River andNorthwestern1911 – 1938
White Pass andYukon Railroad
1900 – 19821988 – Present
Apollo Mine RouteEarly 1900s
!
!
!
Anchorage
Seward
SkagwayCordova
McCarthy
Whittier
Sand Point
Eielson AirForce Base
Healy
Nenana
Palmer ChitinaTalkeetna
Fairbanks
!C
an
ad
a
Seward PeninsulaMine TrainsEarly 1900s
!
Nome
Source: Alaska Department of Labor and Workforce Development, Research and Analysis Section
Highway
Railroad

6 ALASKA ECONOMIC TRENDS MARCH 2012
Alaska Railroad Employment1977 to 20102
Source: Alaska Department of Labor and Workforce Development, Research and Analysis Section
19771979
19811983
19851987
19891991
19931995
19971999
20012003
20052007
20090
200
400
600
800
1,000Average Annual Employment
Alaska Railroad Net Profi ts1990 to 20103
19901991
19921993
19941995
19961997
19981999
20002001
20022003
20042005
20062007
20082009
2010
0
$5 million
$10 million
$15 million
$20 million
-$5 million
Note: Profi ts include net operating income and net real estate and capital investment income.Source: Alaska Railroad Corporation
Finally, in 1898, construc-tion began in Skagway to link the riches of the Yu-kon to the tidewater port.
Completed just two years later, the White Pass and Yukon Railroad served as the Yukon’s only overland transportation corridor until the opening of the Alaska Highway in 1943.
The White Pass and Yukon Railroad operated until the Yukon mining industry collapsed in 1982, but it reopened in 1988 as a sea-sonal tourism operation. In 2011, Alaska’s oldest ma-jor railroad carried more than 381,000 passengers along the fi rst 67.5 miles of the original 110-mile line.
Copper River and Northwestern
When a mountain of copper ore was discovered near the present-day town of McCarthy in 1900, investors hurried to seize control of the minerals and access to the mine. Railroad route decisions could make or break the future of small Alaska cities. Valdez was a possible port, but the high grade at Thompson Pass made the route unpopu-lar with all but the Valdez Chamber of Com-
merce. The now-abandoned Gulf of Alaska town of Katalla, which was also home to Alaska’s fi rst commercial oil fi elds, was chosen as the railroad’s tidewater terminus. However, a storm washed out Katalla’s breakwater and badly damaged the jetty, and with copper ore piling up at the Kennecott Mine, the rail terminus was moved to Cordova.
Construction of the Copper River and Northwest-ern Railroad, which began in Cordova in 1906, was completed in 1911. The railroad operated for another 28 years, until ore depletion and the Great Depression dried up the Kennecott Mine. The last train left Kennecott in November 1938.
Construction of the Copper River and Northwestern Railroad cost more than $20 million, but the railway hauled up to $300 million in copper ore over its lifetime.
Building the Alaska Railroad
Several routes for the Alaska Railroad were on the table when the federal government involved itself in railroad building in 1914, after the passage of the Alaska Railroad Act. The possibilities included using the existing Copper River and Northwestern rail for the southern portion.
President Woodrow Wilson and the Alaska Engineering Commission eventually chose a route from Seward to Fairbanks through the Matanuska coal fi elds, a project with

7MARCH 2012 ALASKA ECONOMIC TRENDS
Alaska Railroad’s Yearly Passengers2001 to 2011 5
Source: Alaska Railroad Corporation
2001 2002 2003 2004 2005 2006 2007 2008 2009 2010 20110
100,000
200,000
300,000
400,000
500,000
600,000
Yearly Operating IncomeAlaska Railroad, 1995 to 2010 4
Note: Graph only shows operating income; it excludes nonoperating income such as real estate and capital investment earnings.Source: Alaska Railroad Corporation
1995 1996 1997 1998 1999 2000 2001 2002 2003 2004 2005 2006 2007 2008 2009 20100
$20 million
$40 million
$60 million
$80 million
$100 million
$120 million
$140 million
$160 million
$180 million
Freight IncomePassenger Income
Other Operating IncomeGrant Income
staggering logistics. The AEC purchased ex-isting track and equipment when and where possible — usually at pennies on the dollar — such as the 71 miles of track, three loco-motives, and nearly 40 cars from the Alaska Northern line out of Seward.
While the railroad was intended to enable economic development in Alaska through access to mineral deposits and water trans-portation, its construction resulted in signifi -cant development as well. Small coal mines opened near Palmer to replace the locomo-tive coal that was previously shipped from Seattle. Construction workers encountered further coal deposits such as those near Chickaloon and Nenana as it moved farther north into the interior.
The most important consequence of the railroad construction was development of the Ship Creek railroad construction camp, which AEC later selected as the railroad’s permanent headquarters based on its central, coastal location between Seward and Fairbanks and its proximity to Matanuska area coal fi elds.
When railroad construction began, a tent city sprang up on the Ship Creek fl ats, populated by thousands of construction workers and eager en-trepreneurs. The AEC saw the need to develop an actual town site on higher ground above the Ship Creek fl ats, and the General Land Offi ce quickly laid out 1,400 lots with space set aside for schools, parks, and public offi ces. The lots were auctioned off on July 10, 1914, and the AEC man-aged the town for the next fi ve years. In 1920, the AEC turned the town over to the newly incorpo-rated city of Anchorage.
Building the Alaska Railroad cost around $60 mil-lion, and employed 4,500 workers at its peak. Not just responsible for laying track, the AEC had far-reaching powers that included selling town lots, building schools, and managing the massive rail-road supply chain that involved running a cream-ery and cannery car.
Finally, a profi t
The Alaska Railroad’s spending exceeded its rev-enues during its fi rst 15 years of operation, but in 1938 the railroad turned its fi rst profi t and would henceforth remain operationally self-suffi cient.
The onset of World War II drastically increased the demand for the railroad’s services, and the bottle-neck and vulnerability risk at the railroad’s only deep-water port in Seward spurred the U.S. Army to punch out a cutoff to Whittier, a Kenai Penin-sula port in western Prince William Sound. The fi rst train rolled into Whittier in 1943, and with the construction of two new air bases near Anchorage and Fairbanks, the Army routed all of its freight through the new port.
World War II put other pressures on the Alaska Railroad. Labor shortages were rampant as em-ployees left for military service or higher paying jobs. There was also a shortage of rolling stock, or vehicles that can move on a railway. By 1943 the
8 ALASKA ECONOMIC TRENDS MARCH 2012
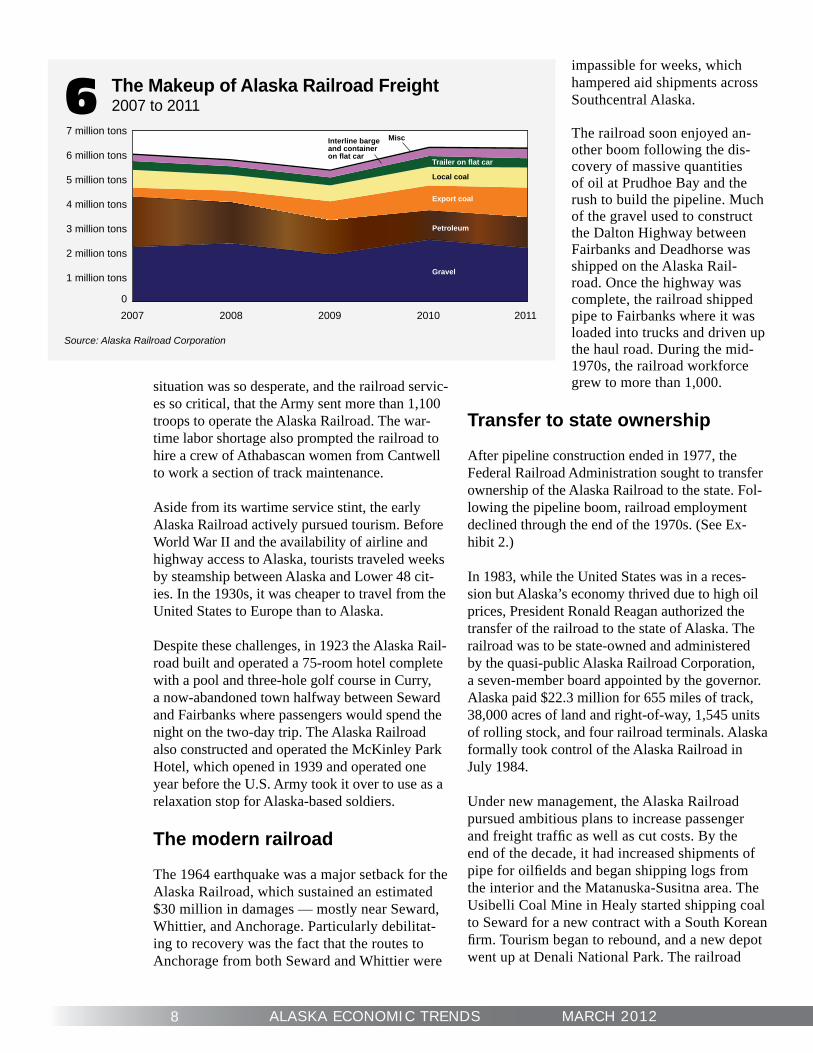
The Makeup of Alaska Railroad Freight2007 to 20116
Source: Alaska Railroad Corporation
2007 2008 2009 2010 20110
1 million tons
2 million tons
3 million tons
4 million tons
5 million tons
6 million tons
7 million tons
Gravel
Petroleum
Export coal
Local coal
Trailer on flat car
Interline bargeand containeron flat car
Misc
situation was so desperate, and the railroad servic-es so critical, that the Army sent more than 1,100 troops to operate the Alaska Railroad. The war-time labor shortage also prompted the railroad to hire a crew of Athabascan women from Cantwell to work a section of track maintenance.
Aside from its wartime service stint, the early Alaska Railroad actively pursued tourism. Before World War II and the availability of airline and highway access to Alaska, tourists traveled weeks by steamship between Alaska and Lower 48 cit-ies. In the 1930s, it was cheaper to travel from the United States to Europe than to Alaska.
Despite these challenges, in 1923 the Alaska Rail-road built and operated a 75-room hotel complete with a pool and three-hole golf course in Curry, a now-abandoned town halfway between Seward and Fairbanks where passengers would spend the night on the two-day trip. The Alaska Railroad also constructed and operated the McKinley Park Hotel, which opened in 1939 and operated one year before the U.S. Army took it over to use as a relaxation stop for Alaska-based soldiers.
The modern railroad
The 1964 earthquake was a major setback for the Alaska Railroad, which sustained an estimated $30 million in damages — mostly near Seward, Whittier, and Anchorage. Particularly debilitat-ing to recovery was the fact that the routes to Anchorage from both Seward and Whittier were
impassible for weeks, which hampered aid shipments across Southcentral Alaska.
The railroad soon enjoyed an-other boom following the dis-covery of massive quantities of oil at Prudhoe Bay and the rush to build the pipeline. Much of the gravel used to construct the Dalton Highway between Fairbanks and Deadhorse was shipped on the Alaska Rail-road. Once the highway was complete, the railroad shipped pipe to Fairbanks where it was loaded into trucks and driven up the haul road. During the mid-1970s, the railroad workforce grew to more than 1,000.
Transfer to state ownership
After pipeline construction ended in 1977, the Federal Railroad Administration sought to transfer ownership of the Alaska Railroad to the state. Fol-lowing the pipeline boom, railroad employment declined through the end of the 1970s. (See Ex-hibit 2.)
In 1983, while the United States was in a reces-sion but Alaska’s economy thrived due to high oil prices, President Ronald Reagan authorized the transfer of the railroad to the state of Alaska. The railroad was to be state-owned and administered by the quasi-public Alaska Railroad Corporation, a seven-member board appointed by the governor. Alaska paid $22.3 million for 655 miles of track, 38,000 acres of land and right-of-way, 1,545 units of rolling stock, and four railroad terminals. Alaska formally took control of the Alaska Railroad in July 1984.
Under new management, the Alaska Railroad pursued ambitious plans to increase passenger and freight traffi c as well as cut costs. By the end of the decade, it had increased shipments of pipe for oilfi elds and began shipping logs from the interior and the Matanuska-Susitna area. The Usibelli Coal Mine in Healy started shipping coal to Seward for a new contract with a South Korean fi rm. Tourism began to rebound, and a new depot went up at Denali National Park. The railroad

9MARCH 2012 ALASKA ECONOMIC TRENDS
purchased new passenger cars for daily express trains between Anchorage and Fairbanks.
Despite some early successes, the fi rst years of state ownership of the railroad were fraught with challenges. Car derailments, chemical spills, fl oods, track washouts, and harsh winters kept costs high for the new corporation and meant rail-road profi ts were volatile.
The economic downturns in Alaska in the late 1980s and in the Lower 48 in the early 1990s hurt both passenger and freight traffi c on the Alaska Railroad. Its average annual employment dropped 22 percent between 1984 and 1987, and 16 percent between 1992 and 1995. The railroad’s unpopularity came to a head in 1996, when the Alaska Legislature passed a bill to appraise it for sale, although Gov. Tony Knowles ultimately ve-toed the bill.
Twists and turns
Though the Alaska Railroad Corporation’s fi rst 20 years were marred by a few growing pains, it has turned a profi t each year since 2000. (See Exhibit 3.) The railroad began to qualify for federal grants in 1996 and used the funding to renovate and maintain dilapidated lines.
In 2000, the Alaska Railroad partnered with a Lynden Transport subsidiary to provide rail-barge services in Seward and Whittier, which substan-tially increased northbound freight traffi c. Rev-enues from freight topped $70 million in 2000 and peaked at $96 million in 2008. (See Exhibit 4.)
Passenger traffi c increased by nearly 20 percent between 2001 and its 2007 peak of 563,491, as the railroad made improvements to passenger facilities and implemented an online reservation system. (See Exhibit 5.) Between 1996 and 2007, annual Alaska Railroad employment grew at an average of 4 percent each year.
But the Alaska Railroad’s 12-year employment growth streak quickly came to a halt at the onset of the national recession in late 2007. Railroad passenger counts fell 4 percent in 2008, 13 percent in 2009, and 14 percent in 2010 as the depressed Lower 48 economy dampened tourism. Passenger revenue declined 13 percent, or $3 million, be-tween 2008 and 2009.
Freight traffi c also took a hit as Alaska’s economy felt the ripples from the national recession. Gravel shipments, which are the railroad’s greatest by ton-nage, dropped as construction slowed in-state.
The Alaska Railroad took another major blow in 2009 when the Flint Hills refi nery in North Pole closed a jet fuel processing unit because of lower demand at the Ted Stevens Anchorage Interna-tional Airport, a result of the global recession. The refi nery was one of the railroad’s largest freight customers, and the shutdown had serious conse-quences. The number of fuel cars shrunk from 80 to 40 a day, and freight revenues fell by 12 per-cent, or $11 million, between 2008 and 2009.
In reaction to the loss of freight and passenger traffi c, the Alaska Railroad announced it would lay off up to 20 percent of its workforce in 2009. Between 2008 and 2010, it shed 124 jobs. Severe cost reductions shrunk operating expenses by 11 percent in 2009, which allowed the corporation to earn a $13.9 million profi t in 2009.
Railroad keeps its niche
Though Alaska Railroad employment was still at a decade low in 2010, there was a light at the end of the tunnel. The number of passengers grew slightly in 2011 as tourism rebounded, with 5,000 more passengers than there were in 2010. Freight tonnage totaled 6.3 million in both 2010 and 2011, up from 2009’s 5.4 million tons. Record-level coal exports from the Usibelli Coal Mine were a major factor in the increase.
While local coal shipments have remained mostly fl at — around three-quarters of a million tons — coal for export has increased from 363,000 tons in 2007 to more than 1 million tons in 2010 and 2011. Coal now accounts for a third of total freight tonnage. (See Exhibit 6 .)
The Alaska Railroad has weathered both boom and bust and continues to be a key piece of an intermo-dal transportation network in a state where trans-portation infrastructure is dear. The corporation estimates that its gravel freight service alone saves Alaska’s highway network 192,000 one-way truck trips each summer. About four trains per week haul coal from Healy to Seward, which would be an unwelcome addition to the slow progression of motor homes along the Seward Highway if trucked instead.
10 ALASKA ECONOMIC TRENDS MARCH 2012
By SARA VERRELLI, Research Analyst
Workplace Deaths on Steady Decline Even the most dangerous jobs become safer
Alaska’s workplace fatality rate has always been high compared to the rest of the United States — not a
surprise when you consider the extreme conditions many Alaska workers face and the challenges of getting around the state.
Alaska’s isolated, remote communities require different modes of transportation, so aircraft travel is more common here — and because of the weather and terrain, it’s also more dangerous. Commercial fi shing, a notoriously hazardous occupation, is also a much larger part of the economy in Alaska than it is in the Lower 48.
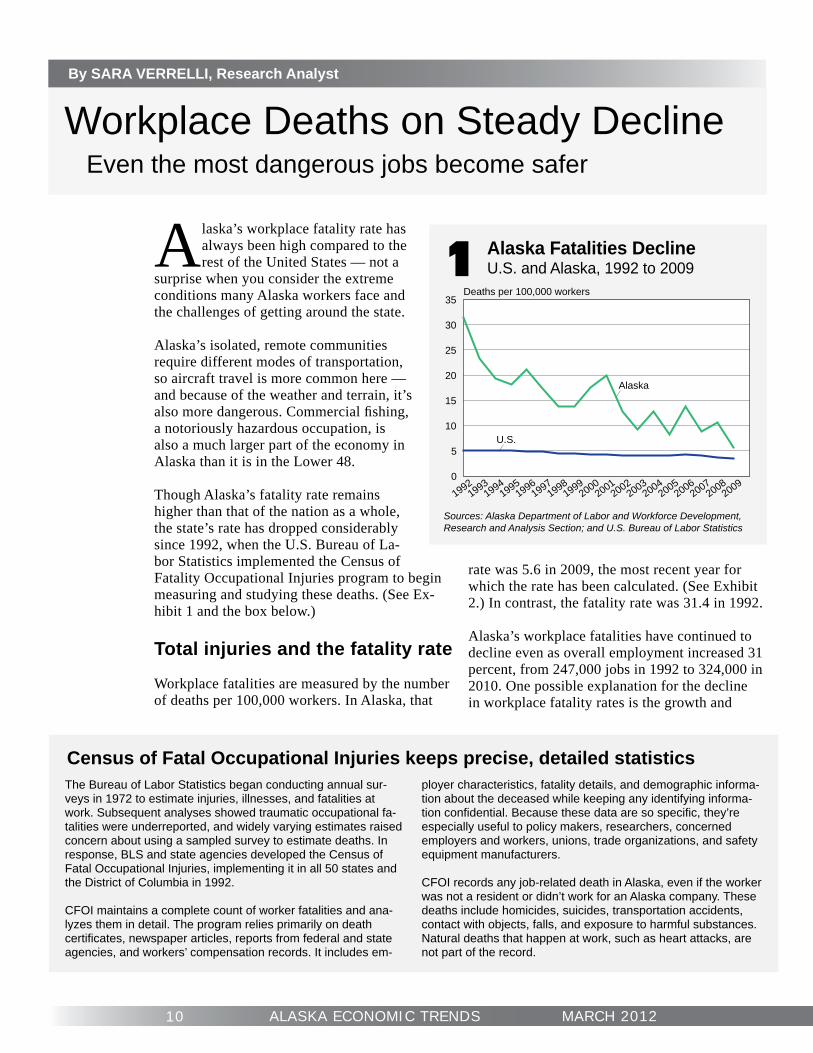
Though Alaska’s fatality rate remains higher than that of the nation as a whole, the state’s rate has dropped considerably since 1992, when the U.S. Bureau of La-bor Statistics implemented the Census of Fatality Occupational Injuries program to begin measuring and studying these deaths. (See Ex-hibit 1 and the box below.)
Total injuries and the fatality rate
Workplace fatalities are measured by the number of deaths per 100,000 workers. In Alaska, that
rate was 5.6 in 2009, the most recent year for which the rate has been calculated. (See Exhibit 2.) In contrast, the fatality rate was 31.4 in 1992.
Alaska’s workplace fatalities have continued to decline even as overall employment increased 31 percent, from 247,000 jobs in 1992 to 324,000 in 2010. One possible explanation for the decline in workplace fatality rates is the growth and
Alaska Fatalities DeclineU.S. and Alaska, 1992 to 20091
Sources: Alaska Department of Labor and Workforce Development, Research and Analysis Section; and U.S. Bureau of Labor Statistics
19921993
19941995
19961997
19981999
20002001
20022003
20042005
20062007
20082009
0
5
10
15
20
25
30
35Deaths per 100,000 workers
U.S.
Alaska
The Bureau of Labor Statistics began conducting annual sur-veys in 1972 to estimate injuries, illnesses, and fatalities at work. Subsequent analyses showed traumatic occupational fa-talities were underreported, and widely varying estimates raised concern about using a sampled survey to estimate deaths. In response, BLS and state agencies developed the Census of Fatal Occupational Injuries, implementing it in all 50 states and the District of Columbia in 1992.
CFOI maintains a complete count of worker fatalities and ana-lyzes them in detail. The program relies primarily on death certifi cates, newspaper articles, reports from federal and state agencies, and workers’ compensation records. It includes em-
ployer characteristics, fatality details, and demographic informa-tion about the deceased while keeping any identifying informa-tion confi dential. Because these data are so specifi c, they’re especially useful to policy makers, researchers, concerned employers and workers, unions, trade organizations, and safety equipment manufacturers.
CFOI records any job-related death in Alaska, even if the worker was not a resident or didn’t work for an Alaska company. These deaths include homicides, suicides, transportation accidents, contact with objects, falls, and exposure to harmful substances. Natural deaths that happen at work, such as heart attacks, are not part of the record.
Census of Fatal Occupational Injuries keeps precise, detailed statistics

11MARCH 2012 ALASKA ECONOMIC TRENDS
Rates by StateDeaths on the job2
Deaths per 100,000 workers
State 20091 2004-08New Hampshire 0.9 1.9Rhode Island 1.5 1.3Delaware 1.9 2.6Connecticut 2.0 2.3Hawaii 2.1 3.3Massachusetts 2.2 2.2Nevada 2.2 4.5New York 2.2 2.6Michigan 2.3 2.7Minnesota 2.4 2.8Maryland 2.5 3.0Washington 2.5 2.7California 2.6 2.7New Jersey 2.6 2.5Georgia 2.8 4.5Maine 2.8 2.9Ohio 2.8 3.2Arizona 2.9 3.4Illinois 2.9 3.2Vermont 2.9 2.8Pennsylvania 3.1 3.9Florida 3.2 4.3North Carolina 3.3 4.0Virginia 3.3 4.3Colorado 3.4 4.9Wisconsin 3.4 3.4U.S. Average 3.5 4.0Oregon 3.9 3.7Utah 3.9 4.9District of Columbia 4.0 3.7South Carolina 4.0 5.5Alabama 4.3 5.5Idaho 4.3 5.0Tennessee 4.5 5.2Texas 4.6 4.5Indiana 4.7 4.8New Mexico 5.2 5.4Oklahoma 5.3 5.9Alaska 5.6 10.8Iowa 5.6 5.3Missouri 5.6 5.7West Virginia 5.7 7.8Kansas 5.8 5.8South Dakota 5.9 6.8Kentucky 6.0 6.6Nebraska 6.2 5.4Mississippi 6.3 7.5Arkansas 6.4 6.3Wyoming 7.5 15.0North Dakota 7.9 7.7Louisiana 8.0 6.5Montana 12.1 9.2
1Most recent rates availableSource: U.S. Department of Labor, Bureau of Labor Statistics, in cooperation with state and federal agencies, Census of Fatal Occupational Injuries
maturation of the Alaska economy. The state has gained more than 70,000 jobs since 1992, and most of the growth has been in the service sectors, where workplace fatalities are much less common.
Deaths on the job in the nation as a whole have remained largely stable since 1992, declining slightly in the last few years. Overall, the U.S. fatality rate has ranged from four to fi ve deaths per 100,000 workers since 1992, reaching its lowest rate of 3.5 in 2009.
Characteristics of the workers
The overwhelming majority of those who lose their lives on the job are male — 94.9 percent of 39 total fatalities in 2010. (See Exhibits 3 through 5.) This is because men tend to dominate the more dangerous industries such as logging, commercial fi shing, and construction.
Among racial and ethnic groups, 74.4 percent of fatalities were among white, non-Hispanic workers, and 12.8 percent were Alas-ka Native or American Indian.
Deaths were also most common among those in their prime work-ing years — ages 35 to 54 — at 46.2 percent, followed by those aged 25 to 34, at 20.5 percent.
Although self-employed workers were about 6 percent of the state’s workforce, they made up 20.5 percent of workplace fatali-ties. The higher fatality rate among the self-employed is primarily due to deaths in seafood harvesting.
Highest fatalities by industry
Historically, the highest workplace death rates in Alaska have been in air transportation and seafood harvesting. Fatalities are
Number of Deaths on the JobAlaska, 1992 to 2010 3
Sources: Alaska Department of Labor and Workforce Development, Research and Analysis Section; and the U.S. Bureau of Labor Statistics
91
6660
78
63
51
43 42
53
64
42
28
42
29
45
30 33
17
39
19921993
19941995
19961997
19981999
20002001
20022003
20042005
20062007
20082009
2010

12 ALASKA ECONOMIC TRENDS MARCH 2012
also typically high in the construction industry, in which they rose to a high of 10 in 2010, or 25.6 percent of all work-related fatalities. (See Exhibit 6.) Nationally, construction fatalities declined by 10 percent between 2009 and 2010, but the con-struction industry still has the highest rate of work-place deaths in the nation.
Air travel
Alaska’s air transporta-tion industry, which includes commercial air taxi and helicopter services, accounted for 13 percent of all worker fa-talities in Alaska in 2010, and 50 percent of
transportation-related deaths. This was a major departure from the rest of the na-tion, where only 1 percent of workplace deaths were in air transportation the same year.
Alaska pilots are known for the danger and scope of their work. Because 82 percent of Alaska communities aren’t accessible by road, the state has grown a large aviation network whose 10,000 pilots operate in 700 registered airports and 1,200 air strips in more than 3 mil-lion square miles.
Flying into these remote and isolated locations can be fraught with hazards, including unpredictable and harsh weather. Despite these challenges, avia-tion fatalities in the state fell to their lowest level in 2005 and have remained low. (See Exhibit 7.)
The decrease in deaths may be partly due to safety improvements by the Fed-eral Aviation Administration, the pilots themselves, and other public and private
aviation agencies. One example is the Alaska Capstone Program, which uses new technology to improve instrumentation on aircrafts and on the ground. Other aviation safety programs in-clude the Medallion Foundation Five Star Shield Program and the Circle of Safety Program, which focuses on educating passengers. Seafood harvesting
Some of Alaska’s highest numbers of workplace deaths have been in seafood harvesting — 275 deaths since 1992, or 30 percent of the total.
Seafood harvesting has always been one of Alaska’s most dangerous industries. Fishermen are exposed to some of the harshest working con-ditions in the world — rough seas, extreme cold, ice, darkness, and high winds. Popular reality tele-vision shows such as The Deadliest Catch have boosted the industry’s notoriety. However, despite its reputation, Alaska’s fi shing industry has im-
Total Fatalities1992 to 20104
Year AlaskaUnited States
1992 91 6,2171993 66 6,3311994 60 6,6321995 78 6,2751996 63 6,2021997 51 6,2381998 43 6,0551999 42 6,0542000 53 5,9202001 64 5,9152002 42 5,5242003 28 5,5752004 42 5,7642005 29 5,7342006 45 5,8402007 30 5,6572008 33 5,2142009 17 4,5512010 39 4,547
Sources: Alaska Department of Labor and Workforce Development, Research and Analysis Section; and U.S. Bureau of Labor Statistics
Deceased Worker CharacteristicsAll Alaska industries, 20105
Total deaths Percent Total: 39 100.0%
Employee status: Wage and salary workers 31 79.5% Self-employed 8 20.5%
Gender: Men 37 94.9% Women 2 5.1%
Age: 20 to 24 years 5 12.8% 25 to 34 years 8 20.5% 35 to 44 years 9 23.1% 45 to 54 years 9 23.1% 55 to 64 years 5 12.8% 65 years and over 3 7.7%
Race or ethnic origin: White, non-Hispanic 29 74.4% Black, non-Hispanic – – American Indian, Aleut, Eskimo 5 12.8% Asian – –
Notes: May include volunteers and other workers receiving compensa-tion. Includes paid and unpaid family workers, and may include owners of incorporated businesses or members of partnerships. Totals for major categories may include subcategories not shown separately. Percentages may not sum to their totals because of rounding. A dash means data are unavailable or too small to publish due to confi dential-ity requirements.
Sources: Alaska Department of Labor and Workforce Development, Research and Analysis Section; and U.S. Bureau of Labor Statistics

13MARCH 2012 ALASKA ECONOMIC TRENDS
Deaths by IndustryAlaska, 2010 6
Sources: Alaska Department of Labor and Workforce Development, Research and Analysis Section; and the U.S. Bureau of Labor Statistics
5
10
10
10
4
Agriculture, Forestry,Fishing, and Hunting
Construction
Transportationand Warehousing
Government
Other
0 2 4 6 8 10 12
Aircraft Fatalities DeclineAlaska, 1992 to 2010 7
1992
-94
1995
-97
1998
-2000
2001
-03
2004
-06
2007
-09 2010
0
5
10
15
20
25
30
35Fatalities
proved its safety record, with its number of fatalities falling from 12 in 1992 to fi ve in 2010. A variety of programs have likely contributed to the re-duction in deaths, particularly individual fi shing quotas for halibut and black cod (1995), some pollock, and the Bering Sea-Aleutian Islands crab rationalization program (2005). Before IFQs, fi shing was literally a race to get as many fi sh as possible during short, derby-style openings, often in the middle of winter and regardless of conditions.
Congress enacted the Commercial Fishing Vessel Safety Act of 1988, which required fi shing vessels to carry spe-cifi c safety, survival, and fi refi ghting equipment starting in 1990. The act also required emergency drills and fi rst-aid training for crew members.
Industry groups such as the Alaska Marine Safety Edu-cation Association also educate commercial fi shermen about safety and the causes of fi shing-related injuries and deaths. AMSEA emphasizes survival skills and practices with fi shermen using equipment that would be used in an emergency.
A Coast Guard program called the Alternate Compliance Safety Agreement focuses on the Bering Sea-Aleutian Island trawl fl eet that fi shes for cod and sole. ACSA re-quires vessel inspections to improve hull and material condition, updated vessel stability guidance, additional lifesaving and fi refi ghting capabilities, and demonstration of emergency drills by crew.
The most hazardous jobs
In general, fatal injuries in Alaska are common among occupations that require manual labor — workers in construction, mining, and oil and gas accounted for 26 percent of workplace deaths in 2010. These workers are
Workplace Fatalities by TypeAlaska, 1992 to 20108
1992 1993 1994 1995 1996 1997 1998 1999 2000 2001 2002 2003 2004 2005 2006 2007 2008 2009 2010
Total 91 66 60 78 63 51 43 42 53 64 42 28 42 29 45 30 33 17 39
Transportation 69 47 30 67 51 33 30 31 39 48 30 13 31 21 25 17 23 9 24Assaults/violence 4 12 6 3 6 6 7 3 3 5 – 7 – – 4 – – – 4Contact with objects or equipment
10 4 9 4 4 6 – 5 8 5 6 3 – – 8 4 4 4 5
Exposure to harmful substances or environments
3 – 7 – – 3 -- – – 4 – 3 3 – 5 5 3 – 4
Note: Event groups are coded using the Bureau of Labor Statistics Occupational Injury and Illness Classifi cation Structure. Columns may not sum to their total be-cause they exclude fatality categories with data too small to publish. A dash means data are not available or are suppressed due to confi dentiality requirements.Sources: Alaska Department of Labor and Workforce Development, Research and Analysis Section; and U.S. Bureau of Labor Statistics
Sources: Alaska Department of Labor and Workforce Development, Research and Analysis Section; and the U.S. Bureau of Labor Statistics
much more likely to be in danger of falling, being caught in operating equipment or machinery, contacting electric-ity, and drowning.
Another 18 percent who died were aircraft pilots, and 10 percent were fi shermen. The other occupations with

14 ALASKA ECONOMIC TRENDS MARCH 2012
recorded deaths in 2010 included vehicle opera-tors, protective service workers, and mining workers.
The overall occupational mix varies greatly be-tween Alaska and the rest of the country. Fisher-men and aircraft pilots represented 40 percent of all occupational fatalities in Alaska from 2003 to 2010, but less than 3 percent nationwide.
In the U.S. as a whole, occupations in transporta-tion and the moving of materials had high rates along with those in construction and extraction.
Causes of Workplace Fatalities in Alaska20109
TransportationAccidents
61.5%
Contact with objectsand equipment
12.8%
Exposure to harmful substances or environments
10.3%
Assaults and violent acts
10.3%
Other5.1%
Aircraft 66.7%
Highway12.5%
Water vehicles12.5%
Unknown 8.3%
Transportation Accidents
Causes of Workplace Fatalities in the U.S.201010
Other0.2%
Fires and explosions
4.1%
Highway54.8%
Water vehicle2.9%
Railroad2.5%
Nonhighwayexcept rail,air, water
15.4%
Unknown0.1%
TransportationAccidents
38.8%
Assaults and violent acts17.8%
Contact with objectsand equipment
16.1%
Falls14.0%
Exposure to harmful substances or environments
9.0%
Pedestrian15.7%
Aircraft8.6%
Transportation Accidents
Vehicles the main cause of death
Transportation accidents were the leading cause of workplace death in Alaska and nationwide in 2010, accounting for 61.5 per-cent in the state and 38.8 percent in the nation. (See Exhibits 8 through 10.) The key difference is that most were aircraft-related in Alaska, but were high-way-related nationwide.
Alaska’s size and lack of roads means more workers travel by boat and airplane than they do in the Lower 48. In Alaska, 66.7 percent of transportation accidents were aircraft-related in 2010, in contrast to just 8.6 percent nationwide. Water vehicle accidents (mainly boats) followed at 12.5 percent in Alaska and 2.9 percent nationwide.
Just 12.5 percent of transporation fatalities were highway-related in Alaska, but highway acci-dents were the main cause of death in the U.S. at 54.8 percent. Pedestrians hit by vehicles represented 15.7 percent of the U.S. total.
After vehicle accidents, “contact with objects or equipment” was the second-leading cause of death on the job in Alaska at 12.8 percent, and third nationally at 16.1 percent. This category in-cludes those struck by falling objects and caught in equipment or collapsing structures.
Violence and assaults — which include suicide and animal attacks — and exposure to harmful substances or environments each made up 10 percent of workplace fatalities in Alaska in 2010. Exposure to harmful substances or environments
Sources: Alaska Department of Labor and Workforce Development, Research and Analysis Section; and the U.S. Bureau of Labor Statistics
Sources: Alaska Department of Labor and Workforce Development, Research and Analysis Section; and the U.S. Bureau of Labor Statistics

15MARCH 2012 ALASKA ECONOMIC TRENDS
JanuaryEmployment Forecast for 2011Employment Scene: Unemployment rate at 8.0 percent in November
FebruaryScience, Technology, Engineering, and Math: Knowledge-based occupations in AlaskaChanges in Unemployment Benefi ts: Eco- nomic effects of bigger payouts and new maximumEmployment Scene: Unemployment rate at 8.1 percent in December
MarchSocial Assistance in the Private Sector: A small, seldom-examined industry with a large reachNew ACS Data and the Census: How to use the American Community SurveyHow Alaskans Get to Work: A look at Ameri- can Community Survey commuter data AprilJuneau at a Glance: Government, natural resources buoy capital cityHiring on the Rise in Alaska: A look at pat- terns and seasonalityCivil Engineering in Alaska: Education, wages, and employment outlookEmployment Scene: Unemployment rate at 7.6 percent in February
MayThe Cost of Living in Alaska: How it’s mea- sured, and how we compareCommutes Are Shorter in Alaska: Times vary widely around the stateEmployment Scene: Unemployment rate at 7.4 percent in March
JuneLeisure and Hospitality in Alaska: Eat, play, and stayThe Makeup of Alaska’s Population: 2010 Census release includes race, ageAlaska’s Personal Income in Top 10: Growth recovers somewhat in 2010Employment Scene: Unemployment rate at 7.3 percent in April
JulyThe Trends 100, 25th Edition: Alaska’s Larg- est Private Employers in 2010Alaska’s Registered Apprenticeships: Employ- ers and workers make a solid investmentEmployment Scene: Unemployment rate at 7.4 percent in May
August Alaska’s Health Care Industry: Employment and costs continue their rapid rise2011 Alaska Rental Survey: Costs around the state for various types of homesEmployment Scene: Unemployment rate at 7.5 percent in June
SeptemberThe Decade in Review: 2000 to 2010Green Jobs Come Into Focus: State’s fi rst comprehensive survey shows a growing roleEmployment Scene: Unemployment rate at 7.7 percent in July
OctoberGender and Earnings in Alaska: Women’s earnings vary widely by occupationAlaska’s $49 Billion Economy: The makeup of the state’s gross domestic productEmployment Scene: Unemployment rate at 7.7 percent in August
NovemberFish Harvesting in Alaska: Survey provides updated estimates for 2010The Bristol Bay Region: Area relies on fi shing, synthesis of modern and traditionalEmployment Scene: Unemployment at 7.6 percent in September
DecemberAlaska Residential Construction: A look at the housing market and employmentAlaska Career Ladder Branches Out: Up- grade to lattice expands online job-seeking toolEmployment Scene: Unemployment at 7.4 percent in October
Trends Index 2011
represented 9 percent of workplace fatalities na-tionally.
U.S. workplace assaults have decreased over the years but were still a signifi cant cause of death in 2010, at 18 percent. NotesThe Alaska Department of Labor and Workforce Development’s Research and Analysis Section publishes fatal and nonfatal workplace injury and illness information and tables for download on its Web site: labor.alaska.gov/research/index.htm. Click on “Occupational Information” on the blue menu bar at the top, then “Workplace Fatalities” or “Workplace Injuries and Illnesses.” Na-tional data as well as information for all 50 states and the District of Columbia are available from the U.S. Bureau of Labor Statis-tics at www.bls.gov/iif/home.htm.

16 ALASKA ECONOMIC TRENDS MARCH 2012
How a Severe Recession May Have LookedAlaska jobs, 2005 to 20111
Sources: Alaska Department of Labor and Workforce Development, Research and Analysis Section; and U.S. Bureau of Labor Statistics
By DAN ROBINSON, Economist
Employment Scene What if Alaska had followed the U.S. recession pattern?thhhhhheeeeeee UUUUUUUUUUUUU.SSSSSSSSSSSSSSS. reeeeeeeeeceeeeeesssssssssiiiiiiionnnnnnnnn pppppppppppppaaaaaaaaaaatttttttteeeeeeeeeeeeeeernnnnnnnnnnnnnn???????????????
315,000
335,000
325,000
305,000
295,000
2005 2006 2007 2008 2009 2010 2011
Alaska wage and salary employmentAlaska employment if state had mirrored national pattern
Economy watchers are now more than famil-iar with how the Great Recession, which began in December 2007 and ended in June
2009, cost the nation millions of jobs and pushed the U.S. unemployment rate above 10 percent — more than double its pre-recession level.
Alaskans are also likely to have heard, in Alaska Economic Trends and elsewhere, that the nation’s worst downturn since the Great Depression in the 1930s did substantially less damage to the state’s economy than it did to the to the country as a whole.1
But explaining the difference between the severity of the U.S. recession and what Alaska experienced has been done more through adjectives and analo-gies than actual numbers. Exhibits 1 and 2 show the difference between Alaska’s actual job num-bers and unemployment rates over the last several years and how they would have looked if the state had mirrored national percent changes.
Two labor market indicators
The job numbers and unemployment rate are in-
fl uential and closely watched. Nationally, they move the stock market, drive policy decisions, and infl uence consumer confi dence. At the state level, the two indicators are the best overall gauge of an economy’s health compared to other states and the nation, and also compared to the state’s history.
Loss of 1,000 jobs versus 18,000
In 2009, Alaska lost jobs for the fi rst time in more than two decades — but if the magnitude of the state’s losses had matched the nation’s, the dip
of 1,000 jobs would have been a much more severe 14,000. What’s more, they would have been preceded by a loss of 2,000 jobs in 2008 and followed by an additional loss of 2,000 in 2010. (See Exhibit 1.)
To give context to those numbers, Alaska lost about 20,000 jobs during its deep recession of 1986 and 1987.
Then, the red-hot economy of the early 1980s, fueled by Prudhoe Bay oil production and a dramatic rise in state spending, cooled abrupt-ly when oil prices fell and the construction, banking, and real estate industries contracted harshly. Between 1985 and 1989, Alaska’s population dropped by 44,000 and the con-struction industry alone lost 10,000 jobs.
Numbers delayed each FebruaryBecause of the annual benchmarking and revision process, the data the Department of Labor typically uses to generate the monthly unemployment rate and job numbers were not available before publication of this month’s Trends. The department will release two months’ employment statistics and un-employment rates in March: the January 2012 rate on March 13 and the February rate on March 23.
17MARCH 2012 ALASKA ECONOMIC TRENDS
Alaska’s Rate Would Have Topped 13 PercentUnemployment, 2005 to 2011 2
Area Unemployment RatesAlaska, preliminary 20113
Sources: Alaska Department of Labor and Workforce Development, Research and Analysis Section; and U.S. Bureau of Labor Statistics
14.0
13.0
12.0
11.0
10.0
9.0
8.0
7.0
6.0
5.0
2005 2006 2007 2008 2009 2010 2011
Alaska unemployment rate Alaska rate if state had mirrored national pattern
Sources: Alaska Department of Labor and Workforce Development, Research and Analysis Section; and U.S. Bureau of Labor Statistics
Wade Hampton Census AreaYukon-Koyukuk Census Area
Hoonah-Angoon Census AreaBethel Census Area
Prince of Wales-Hyder Census AreaNorthwest Arctic Borough
SkagwayNome Census Area
Aleutians East BoroughSoutheast Fairbanks Census Area
YakutatDillingham Census AreaPetersburg Census Area
Denali BoroughKenai Peninsula Borough
Valdez-Cordova Census AreaMat-Su Borough
WrangellHaines Borough
Lake and Peninsula BoroughAleutians West Census Area
Alaska StatewideKetchikan Gateway Borough
Kodiak Island BoroughFairbanks
SitkaAnchorage, Municipality of
JuneauNorth Slope BoroughBristol Bay Borough
0.0% 5.0% 10.0% 15.0% 20.0% 25.0%
7.5%
Although the loss of 20,000 jobs in the 1980s is not signifi cantly more than the 18,000 Alaska would have shed during the recent recession if its declines mirrored national percentages, the state’s job count was about 100,000 smaller then than it is today. In other words, as diffi cult as the job losses would have been for Alaska, they still would have been milder than the per-centage losses from the 1986-87 state recession.
Rate increase palesin comparison
Alaska’s unemployment rates also rose noticeably in 2008 and 2009, but if the increases had matched the nation’s, the state’s unemployment rate would have soared to more than 13 percent in 2009 and still top 11 percent. (See Exhibit 2.) Instead, Alaska is in the unprec-edented position of having noticeably lower rates than the U.S. for three years and counting.
But if history is a guide, the state’s unemploy-ment rate would not have climbed quite that high, because job loss in the 1980s recession and the period following completion of the Trans-Alaska Oil Pipeline in the 1970s led to a combination of population loss and higher unemployment. On the whole, Alaska has one of the nation’s most migra-tory populations, and it is much easier to move from state to state than it is from country to coun-try, making unemployment rates in Alaska less fi rmly connected to the job numbers than they are for the U.S.
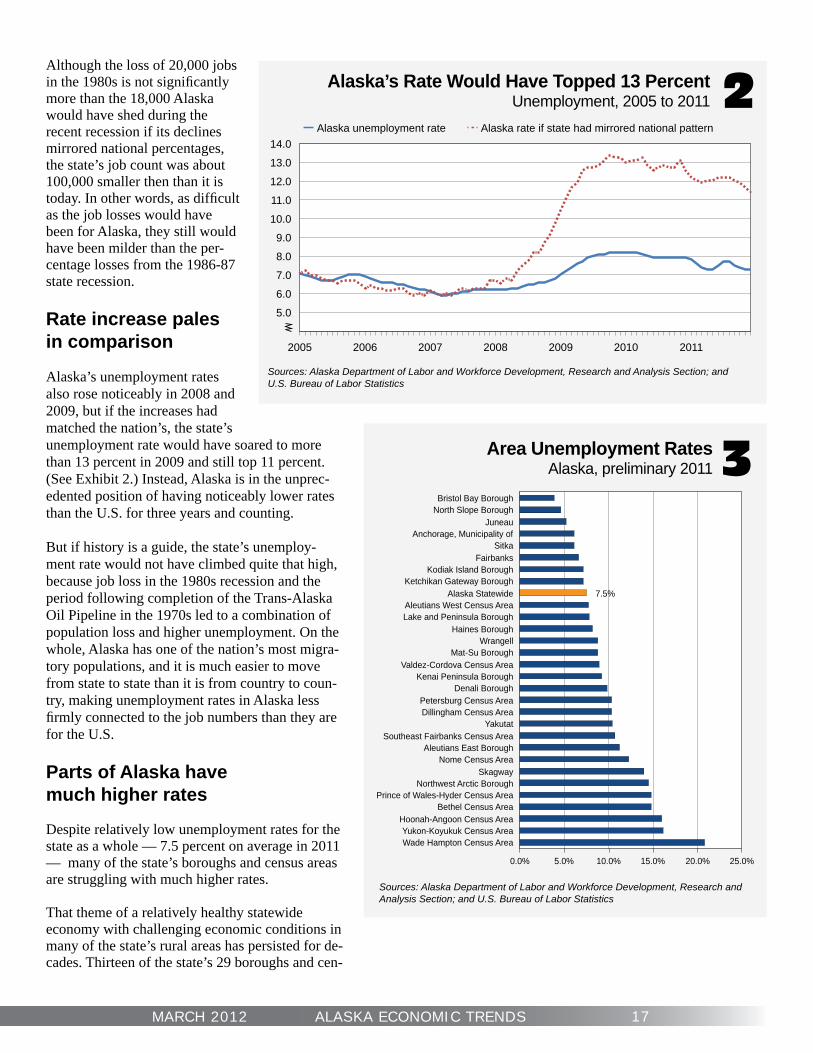
Parts of Alaska havemuch higher rates
Despite relatively low unemployment rates for the state as a whole — 7.5 percent on average in 2011 — many of the state’s boroughs and census areas are struggling with much higher rates.
That theme of a relatively healthy statewide economy with challenging economic conditions in many of the state’s rural areas has persisted for de-cades. Thirteen of the state’s 29 boroughs and cen-

18 ALASKA ECONOMIC TRENDS MARCH 2012
Alaska’s Winter Rates Especially HighUnemployment in December and August, 20114
Highest Unemployment Rates in U.S.December 2011 (preliminary)
Labor Force Unemployed Rate1 Imperial County, CA 75,250 20,166 26.8%2 Aleutians East Borough, AK 799 212 26.5%3 Skagway Borough/Municipality, AK 563 149 26.5%4 Colusa County, CA 11,414 2,664 23.3%5 Yuma County, AZ 91,429 21,146 23.1%6 Hoonah-Angoon Census Area, AK 856 184 21.5%7 Wade Hampton Census Area, AK 2,632 565 21.5%8 Denali Borough, AK 857 183 21.4%9 Aleutians West Census Area, AK 2,206 437 19.8%
10 Hancock County, GA 2,877 558 19.4%11 Sutter County, CA 42,555 8,196 19.3%12 Clay County, MS 7,111 1,357 19.1%13 Scott County, TN 8,079 1,516 18.8%14 Merced County, CA 103,694 19,410 18.7%15 Siskiyou County, CA 17,899 3,281 18.3%16 Mackinac County, MI 4,932 901 18.3%17 Baraga County, MI 3,787 685 18.1%18 Montmorency County, MI 3,595 644 17.9%19 Marion County, SC 12,201 2,186 17.9%20 Trinity County, CA 4,777 850 17.8%
Highest Unemployment Rates in U.S.August 2011
Labor Force Unemployed Rate1 Imperial County, CA 78,484 25,473 32.5%2 Yuma County, AZ 97,840 28,638 29.3%3 Menominee County, WI 1,793 391 21.8%4 Wilcox County, AL 3,345 725 21.7%5 Wade Hampton Census Area, AK 2,632 559 21.2%6 Hancock County, GA 2,897 577 19.9%7 Marion County, SC 12,682 2,527 19.9%8 Scott County, TN 8,074 1,587 19.7%9 Allendale County, SC 3,367 649 19.3%
10 Martinsville city, VA 6,009 1,149 19.1%11 Perry County, AL 3,627 689 19.0%12 Jenkins County, GA 2,459 463 18.8%13 Yuba County, CA 29,409 5,466 18.6%14 Marlboro County, SC 11,599 2,162 18.6%15 Zavala County, TX 4,052 749 18.5%16 Dallas County, AL 15,360 2,818 18.3%17 Clay County, MS 7,243 1,325 18.3%18 Holmes County, MS 7,123 1,300 18.3%19 Santa Cruz County, AZ 18,749 3,420 18.2%20 Hendry County, FL 16,199 2,945 18.2%
Sources: Alaska Department of Labor and Workforce Development, Research and Analysis Section; and U.S. Bureau of Labor Statistics
sus areas had average 2011 unemployment rates above 10 percent and well above the national average. Three census areas’ rates topped 15 percent. (See Exhibit 3.) In fact, during December, six of the na-tion’s 10 highest county-level unemploy-ment rates were in Alaska. (See Exhibit 4). Part of the explanation is Alaska’s dra-matic seasonality. Skagway and the Denali Borough in particular are entirely differ-ent economies in the summer than in the off-season. During August, only Alaska’s Wade Hampton Census Area was on the list of the nation’s 20 highest unemploy-ment rates.
It’s also worth noting that Alaska’s sparse-ly populated and heavily seasonal areas present special statistical challenges. As a result, the rates have much larger margins of error than the rates for larger places such as Anchorage or Fairbanks, or for California’s Imperial County, which topped the list of the nation’s highest unemploy-ment rates in both December and August.
Alaska has more extremes
Alaska’s size and variety of economic con-ditions distinguish it from other resource-rich states to which it is often compared. December unemployment rates in Wyo-ming at the county level, for example, were all in the range of 3 to 8 percent and in North Dakota they were between 3 and 9 percent.
In contrast, Alaska’s December rates ranged from a low of 4.4 percent in the North Slope Borough to a high of 26.5 percent in Skagway and the Aleutians East Borough. In that respect, Alaska has slight-ly more in common with Louisiana and Texas, which also have important oil and gas sectors. Both of those states had coun-ty-level unemployment rates in December that ranged from 3 to 13 percent.
Notes1For more on why the recent recession didn’t affect Alaska as severely as most other states, see “Decade in Review” in the September 2011 issue of Trends, and “Alaska’s $49 Billion Economy” in the October issue.

19MARCH 2012 ALASKA ECONOMIC TRENDS
The annual Governor’s Safety and Health Conference will be held March 19-21 at the Egan Civic and Con-vention Center in Anchorage. The conference theme this year is “Injury Prevention in Alaska – No One Left Behind.” The event is open to employers, employees, safety and health professionals, and the public. Sponsored by the Alaska Safety Advisory Council, the conference focuses safety needs unique to Alaska and on emerging safety and health issues. More than 300 Alaskans attended last year’s conference from a range of industries, including oil and gas, construction, health care, tourism, recreation, state and local government, Alaska Native corporations, aviation, mining, timber, and fi shing.
The list of course offerings includes certifi cations to meet the Occupational Safety and Health Administration’s 10-hour construction training and 10-hour general industry training. There will also be a workshop on Electrical Arc Flash. One highlight of the conference is recognition of Alaska businesses that exemplify good corporate citizenship and a commitment to worker health and safety. Awards will be given in three categories: the Governor’s Safety Award of Excellence, the Governor’s Special Achieve-ment Award, and the William “Tinker” Childress Memorial Award.
More information is available online at: http://www.labor.alaska.gov/lss/asac.htm or by calling (907) 269-4940.
Employer Resources
Governor’s Safety Conference to be held March 19–21
A Safety Minute
Falls a major cause of preventable deaths on the jobIn 2010, falls were the cause of 35 percent of workplace deaths in the U.S. construction industry, and nearly 14 percent of fatalities across all industries nationwide. Sadly, many of these deaths could have been prevented with proper training and adequate fall protection.
Of the 635 fatal falls in 2010, 129 were from ladders and 117 were from roofs. These numbers are signifi cant be-cause they center around common tasks that workers may not recognize as hazardous. However, it’s important to remember that a fall from 6 feet can be just as lethal as a fall from 600 feet. Employers can train their employees to recognize and deal appropriately with these hazards through these basic safety principles:
• When on a ladder, maintain three points of contact at all times (e.g., both feet and one hand).
• Maintain balance on a ladder by ensuring the center of your body does not go beyond the sides.
• Make sure the top of the extension ladder extends at least 36 inches beyond the top platform.
• When working on uneven or slippery ground, secure the bottom of the ladder to prevent it from sliding out.
• When working on surfaces higher than 6 feet, wear fall protection gear.
• When working on a roof, wear a fall harness and/or erect guardrails, regardless of the roof slope.
Occupational Safety and Health Administration regulations require that working platforms higher than 4 feet have guardrails. In construction, workers 6 feet or more from the ground must also have some kind of fall protection. OSHA also mandates safety training for all employees who use ladders and stairs.
For more on training and fall protection requirements, see OSHA regulations 1926 subpart M and 1926.1060. For additional information on general workplace safety and health, see www.osha.gov, or contact the Alaska Oc-cupational Safety and Health Consultation and Training program at (800) 656-4972.