Embed Size (px)
Citation preview
Transit to Parks Strategic Plan - Case Studies A
TRANSIT-TO-PARKS
Task 3 DeliverableMarch 1, 2018
Introduction
Summary Matrix
Case Studies: Local / Regional
Resources / Links
Case Studies: Other / National
p. 1
p. 42
p. 7
p. 46
p. 19
Overview of study, approach, cases included, organization of document, and key takeaways
Shuttle / bus programs within Los Angeles County
Collection of relevant reference documents and links used during the study
Summary matrix that describes and evaluates each program along with a series of indicators
Systems and programs outside of Los Angeles County
1
4
2
5
3
Transit to Parks Strategic Plan - Case Studies 1
INTRODUCTION
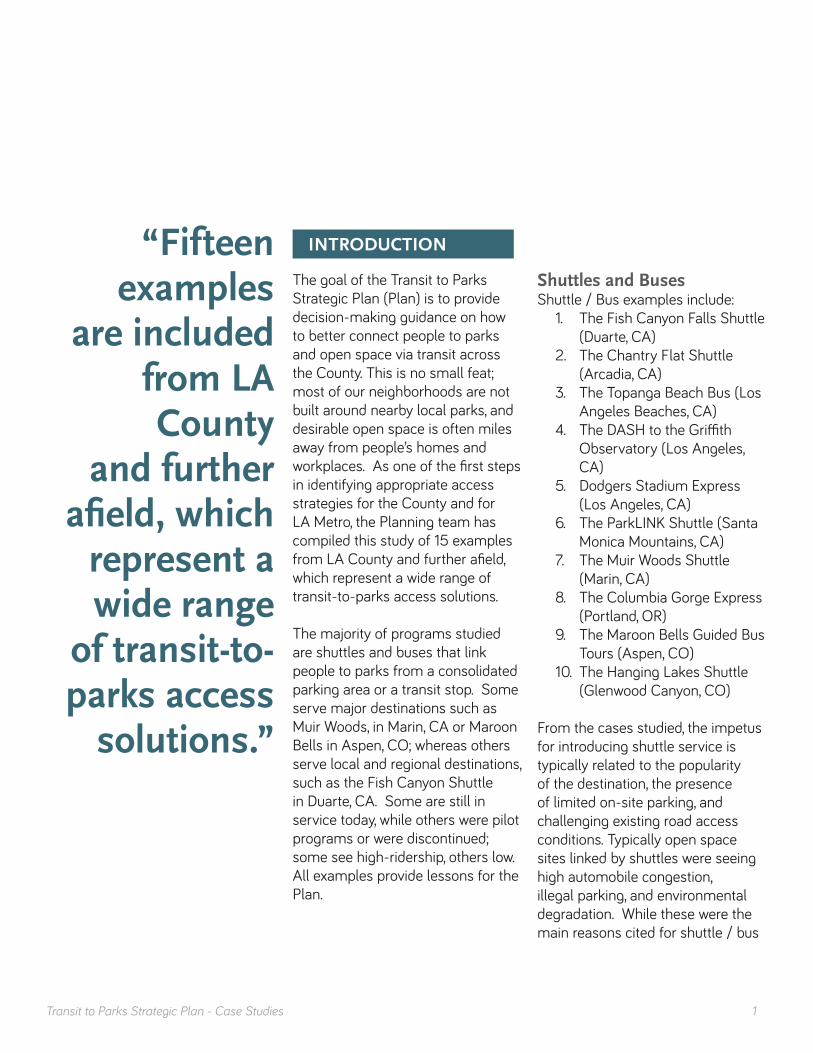
The goal of the Transit to Parks Strategic Plan (Plan) is to provide decision-making guidance on how to better connect people to parks and open space via transit across the County. This is no small feat; most of our neighborhoods are not built around nearby local parks, and desirable open space is often miles away from people’s homes and workplaces. As one of the first steps in identifying appropriate access strategies for the County and for LA Metro, the Planning team has compiled this study of 15 examples from LA County and further afield, which represent a wide range of transit-to-parks access solutions.
The majority of programs studied are shuttles and buses that link people to parks from a consolidated parking area or a transit stop. Some serve major destinations such as Muir Woods, in Marin, CA or Maroon Bells in Aspen, CO; whereas others serve local and regional destinations, such as the Fish Canyon Shuttle in Duarte, CA. Some are still in service today, while others were pilot programs or were discontinued; some see high-ridership, others low. All examples provide lessons for the Plan.
“Fifteen examples
are included from LA County
and further afield, which
represent a wide range
of transit-to-parks access
solutions.”
Shuttles and BusesShuttle / Bus examples include:
1. The Fish Canyon Falls Shuttle (Duarte, CA)
2. The Chantry Flat Shuttle (Arcadia, CA)
3. The Topanga Beach Bus (Los Angeles Beaches, CA)
4. The DASH to the Griffith Observatory (Los Angeles, CA)
5. Dodgers Stadium Express (Los Angeles, CA)
6. The ParkLINK Shuttle (Santa Monica Mountains, CA)
7. The Muir Woods Shuttle (Marin, CA)
8. The Columbia Gorge Express (Portland, OR)
9. The Maroon Bells Guided Bus Tours (Aspen, CO)
10. The Hanging Lakes Shuttle (Glenwood Canyon, CO)
From the cases studied, the impetus for introducing shuttle service is typically related to the popularity of the destination, the presence of limited on-site parking, and challenging existing road access conditions. Typically open space sites linked by shuttles were seeing high automobile congestion, illegal parking, and environmental degradation. While these were the main reasons cited for shuttle / bus
Transit to Parks Strategic Plan - Case Studies 2
service introduction or modification, the fact that non-auto owners had limited or no access to open space sites was also frequently cited. One of the main goals of the Plan is to provide access to disadvantaged and carless populations.
Thinking Beyond the Shuttle Beyond shuttle and bus programs, it was challenging to find examples of implemented or planned access solution types that have specifically been used to get people to parks. However, several national initiatives have been instrumental in providing funding to improve transit access to parks at a programmatic level.
One main framework, that may be gaining momentum is the Safe Routes to Parks movement (National Recreation and Park Association and the Safe Routes to School National Partnership). While not specifically profiled as part of a case study in this report, the Safe Routes to Parks action framework suggests some interesting best practices that align with this Plan, from a first/last mile perspective. While some solutions to increase and improve access to parks around the County will be shuttle- and bus-based, others may be first/last mile solutions for improving walking and biking conditions in between parks and transit stops and addressing concerns about walking and biking safety, navigability, and general access.
Safe Routes to Parks highlights the need for safety and perception of safety for walking (and biking) pathways between transit and parks, as well as improved navigability. This can manifest as street upgrades along routes that lead to a park, new crossings and improved park entrances, signage and wayfinding to parks, and heightened maintenance practices. It also points to the need for: finding solutions that are tailored to the desires of the community; cultivating relationships with law enforcement; partnering with local organizations and coalitions; and addressing street harassment issues.
Additionally, given Metro’s continued commitment to incorporating first/last mile strategies throughout the County, this report does not include first/last mile-specific case studies. Solutions identified in the 2014 First/Last Mile Strategic Plan include recommendations to: • Improve crossings and
connections to increase pedestrian visibility with enhanced crosswalks, curb extensions, and shortcuts;
• Increase signage and wayfinding by installing directional and informational signage on heavily trafficked corridors around transit stations, etc;
• Enhance multi-modal safety and comfort by installing lighting, improving freeway underpasses

Transit to Parks Strategic Plan - Case Studies 3
and bus waiting areas, and calming traffic;
• Redistribute streetspace by allocating dedicated space for busses, bicyclists and pedestrians;
• Incorporate other first/last mile amenities such as bike storage on busses, bike share stations, and rolling lanes.
See the First/Last Mile Strategic Plan Toolkit for a more exhaustive list of suggest solutions that may be applied to this Plan.
In addition to the shuttle / bus examples profiled in this memo, also included are a series of access solutions that represent interesting opportunities for LA Metro and the Strategic Plan. These additional five examples have not been explicitly employed to get people to parks and open space, but certainly could be in the future. They were chosen based on preliminary research that pointed to possible integration of non-traditional solutions relating to on-demand services, new autonomous technologies, web-based offerings, educational components, and incentive structures.
These examples include:1. Hybrid System: Chariot, On
Demand Vans with Fixed Routes (San Francisco, CA)
2. Education Program: The Transit and Trails Interactive
App and Website (San Francisco, CA)
3. Incentive Program: The Youth Opportunity Pass (Vancouver, WA)
4. Local Program: Save Passages (Chicago, IL)
5. New Technology: Autonomous Shuttles (Various)
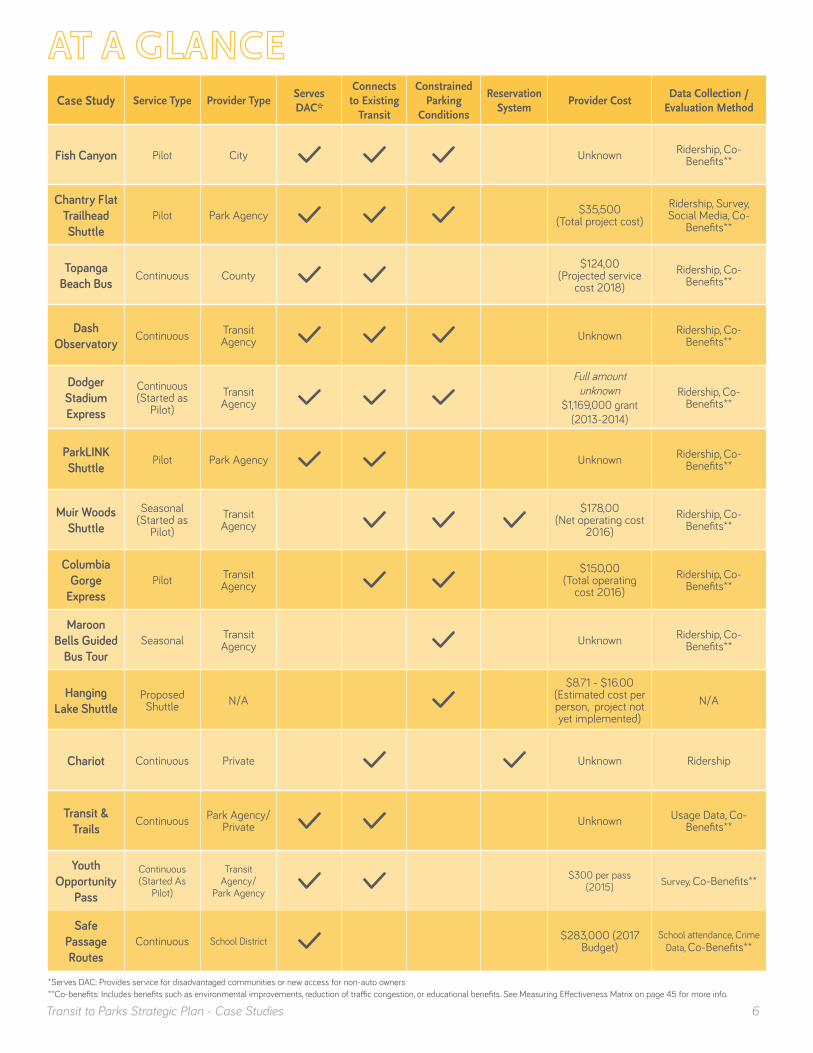
How this Study is OrganizedEach case example is presented through an Overview and Key Takeaways, along with a consistent set of indicators relating to elements like ridership/usage, frequency, cost, and key partners (as appropriate and as data was available). The Key Takeaways are specifically relevant for the Plan and our local context in the County. Local shuttles and buses are presented first, followed by national examples and then non-traditional examples. A series of summary matrices follows the case studies, comparing each on a variety of characteristics. Links and resources are listed at the end of the document. A quick “At a Glance Matrix” can be found on page 5.
Key LessonsWhile each case study lists specific takeaways relevant to the Plan there are some overarching lessons that are worth noting up front.
Transit to Parks Strategic Plan - Case Studies 4
Marketing and advertising play a big role. Programs need to be widely and appropriately advertised both before service commences and during service, including the possibility for in-the-field notice boards and signage. Programs may use multiple outlets to reach target audiences: press releases, flyers and brochures; in-the-field signage, banners, and branded shuttles/infrastructure; social media, city websites, transit agency websites, destination websites; hiking, visitor, and local blogs; articles, local public radio, etc.
Hours of operation and service capacity need to match demand. Hours of operation should reflect and adapt to demand trends. Parks and open space may be popular year-round, seasonally, or for special events/holidays. They likely also have visitation trends throughout the day and week. This may be further impacted by fluctuating recreational activity and weather conditions. Having variable and adaptive operating hours not only provides adequate service to park / open space for visitors, but also makes efficient use of resources. New technologies and handheld apps and devices may represent an important opportunity, however must also be put in the appropriate context as some communities may not have high rates of access to these technologies.
Shuttles or programs offered also need to be appropriately sized, not too large to be empty and wasting space and not too small to be overcrowded or undermanaged.
Consider a pilot. Introducing a shuttle or program as a temporary pilot or seasonal solution allows providers to measure effectiveness and adapt service features.
Rely on partners. Almost all of the cases studied highlight the fact that good partnerships are critical. Partners can help to run, fund, support, and publicize the service or program. Partnerships in the cases studied include parks, federal, state, and local governments, community organizations, non-profits, private companies and sponsors, and transit agencies.
Community input and political will are central to decide when, where, and how service and programs should be introduced or refined. This Strategic Plan is rooted in data, data that will help determine what sorts of service to recommend and where; the next layer that needs to be added is the more qualitative layer of what community members and leaders want to see and feel they would use.
Transit to Parks Strategic Plan - Case Studies 5
Provision of transit service can be tied to demand management at destinations. Restriction of parking or road access can further relieve automobile congestion and encourage transit-use. It can also improve transit efficiency to the destination.
Transit infrastructure introduced can be coupled with park orientation and educational components. If people can get to a park, but then do not know how to use the resource or navigate it when they are there, the program isn’t of much use. Some of the cases studied provided orientations and tours to help people get to know the parks and open space.
Education components can range from nature education about the plants, animals, and natural assets at the park, to education about health benefits and the positive impacts of using transit-to-parks as compared to driving (cost savings, environmental impacts, etc.). Introducing an educational component not only capitalizes on co-benefits, but can also unlock funding streams, programs, and partnerships within compatible non-transit arenas (e.g. health, environment, education, disadvantaged communities, etc.).
Assure comfort and ease of use. Comfort and ease for users are paramount. As an example, shuttles should provide amenities appropriate for recreational destinations, such as bike racks, places for bags and sports gear, surfboard racks, bathrooms for long trips, etc. Ease of use may mean considering on demand and flexible solutions, easy reservation systems, and appropriately cited stops and features.
Use data to track and modify. Data collection on user/rider satisfaction or usage statistics and data management is helpful to proactively manage service to meet needs and demand. Ridership trends can help forecast future need and make efficient use of transit services. Surveys can tell us who the service and programs are reaching, what outreach methods are most successful, and how the services and programs should be altered.
One size doesn’t fit all. Multiple solution types can be considered as a solution that works in one place, might not do well in another. Solutions should be rooted in community needs, as some solutions may inadvertently cause a barrier-to-entry. Tailored programs that are based on community needs will be the most successful and lasting solutions.
Transit to Parks Strategic Plan - Case Studies 6
Case Study Service Type Provider TypeServes DAC*
Connects to Existing
Transit
Constrained Parking
Conditions
Reservation System
Provider CostData Collection /
Evaluation Method
Fish Canyon Pilot City Unknown Ridership, Co-Benefits**
Chantry Flat Trailhead Shuttle
Pilot Park Agency $35,500(Total project cost)
Ridership, Survey, Social Media, Co-
Benefits**
Topanga Beach Bus Continuous County
$124,00(Projected service
cost 2018)Ridership, Co-
Benefits**
Dash Observatory Continuous Transit
Agency Unknown Ridership, Co-Benefits**
Dodger Stadium Express
Continuous (Started as
Pilot)Transit Agency
Full amount unknown
$1,169,000 grant (2013-2014)
Ridership, Co-Benefits**
ParkLINK Shuttle Pilot Park Agency Unknown Ridership, Co-
Benefits**
Muir Woods Shuttle
Seasonal(Started as
Pilot)Transit Agency
$178,00(Net operating cost
2016)Ridership, Co-
Benefits**
Columbia Gorge
ExpressPilot Transit
Agency$150,00
(Total operating cost 2016)
Ridership, Co-Benefits**
Maroon Bells Guided
Bus TourSeasonal Transit
Agency Unknown Ridership, Co-Benefits**
Hanging Lake Shuttle
Proposed Shuttle N/A
$8.71 - $16.00(Estimated cost per person, project not yet implemented)
N/A
Chariot Continuous Private Unknown Ridership
Transit & Trails Continuous Park Agency/
Private Unknown Usage Data, Co-Benefits**
Youth Opportunity
Pass
Continuous(Started As
Pilot)
Transit Agency/
Park Agency
$300 per pass(2015) Survey, Co-Benefits**
Safe Passage Routes
Continuous School District $283,000 (2017 Budget)
School attendance, Crime Data, Co-Benefits**
*Serves DAC: Provides service for disadvantaged communities or new access for non-auto owners**Co-benefits: Includes benefits such as environmental improvements, reduction of traffic congestion, or educational benefits. See Measuring Effectiveness Matrix on page 45 for more info.

Transit to Parks Strategic Plan - Case Studies 7
2
Case Studies
DUARTE, CA
Transit to Parks Strategic Plan - Case Studies 8
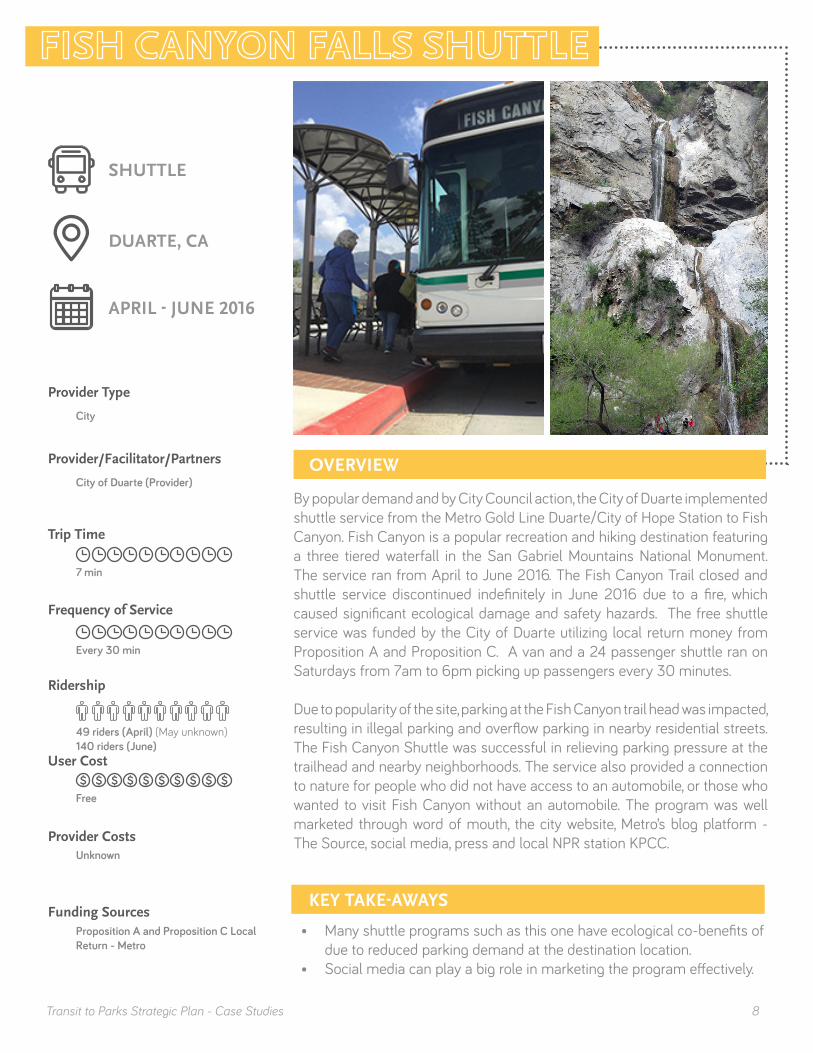
By popular demand and by City Council action, the City of Duarte implemented shuttle service from the Metro Gold Line Duarte/City of Hope Station to Fish Canyon. Fish Canyon is a popular recreation and hiking destination featuring a three tiered waterfall in the San Gabriel Mountains National Monument. The service ran from April to June 2016. The Fish Canyon Trail closed and shuttle service discontinued indefinitely in June 2016 due to a fire, which caused significant ecological damage and safety hazards. The free shuttle service was funded by the City of Duarte utilizing local return money from Proposition A and Proposition C. A van and a 24 passenger shuttle ran on Saturdays from 7am to 6pm picking up passengers every 30 minutes.
Due to popularity of the site, parking at the Fish Canyon trail head was impacted, resulting in illegal parking and overflow parking in nearby residential streets. The Fish Canyon Shuttle was successful in relieving parking pressure at the trailhead and nearby neighborhoods. The service also provided a connection to nature for people who did not have access to an automobile, or those who wanted to visit Fish Canyon without an automobile. The program was well marketed through word of mouth, the city website, Metro’s blog platform - The Source, social media, press and local NPR station KPCC.
OVERVIEWCity of Duarte (Provider)
7 min
Every 30 min
49 riders (April) (May unknown)140 riders (June)
$ $ $ $ $ $ $ $ $ $Free
Unknown
Proposition A and Proposition C Local Return - Metro
KEY TAKE-AWAYS
• Many shuttle programs such as this one have ecological co-benefits of due to reduced parking demand at the destination location.
• Social media can play a big role in marketing the program effectively.
SHUTTLE
APRIL - JUNE 2016
Provider/Facilitator/Partners
Trip Time
Frequency of Service
Ridership
User Cost
Provider Costs
Funding Sources
City
Provider Type

Transit to Parks Strategic Plan - Case Studies 9
The Chantry Flat Shuttle was a pilot program that provided shuttle service from the Metro Gold Line Arcadia Station to the Chantry Flat Recreation Area (Chantry Flat). Service was provided by the Angeles National Forest (ANF) for three consecutive weekends from September 24 to October 10, 2016. The Chantry Flat Shuttle was modeled after the success of the Fish Canyon Shuttle, which provided shuttle service from the Metro Gold Line Duarte/City of Hope Station to Fish Canyon in the spring of 2016.
In April 2016, a transportation workshop was facilitated by the Southern California Association of Governments (SCAG) and the Angeles National Forest. The ANF Transportation Working Group chose Chantry Flat to run a pilot shuttle following the City of Duarte’s Fish Canyon shuttle precedent. Chantry Flat was also chosen because of its location near the Supervisor’s Office in Arcadia for ease of logistics and planning.
Shuttle service was contracted through a private shuttle company with experience operating in mountainous terrain. The ANF working group looked into partnering with local cities and transit agencies; however, potential usage of city buses and shuttles was limited due to mountainous terrain, narrow passage, city’s priorities, and liability insurance issues for running a city bus outside city boundaries.
The program was funded by a one-time grant from CAR-LESS California. The cost of the shuttle service contract was approximately $15,000. Staffing for the Saturdays and Sundays, not counting the planning and preparation time for the project, was approximately $17,000. General public
OVERVIEW
ARCADIA, CA
SHUTTLE
SEPTEMBER - OCTOBER 2016
Angeles National Forest (Provider)SCAG (Partner)
$35,500 Total Project Cost
CAR LESS California
Provider/Facilitator/Partners
Trip Time
Frequency of Service
Ridership
User Cost
Funding Sources
20 - 25 min
Every 30 - 45 min
842 riders over 3 weekends
$ $ $ $ $ $ $ $ $ $Free
Park Agency
Provider Type
Provider Costs
Transit to Parks Strategic Plan - Case Studies 10
(CONTINUED)
volunteer time (128.5 Hours @ $24/Hour) was valued at $3,000. Estimated material cost was $500. The total cost of the project was $35,500.
The program was marketed through flyers at Chantry Flat and the Metro Gold Line station, banners on Santa Anita Avenue, a press release to local media outlets, social media, and advertised through various partners’ websites and networks. The shuttle was launched on National Public Lands Day and ended on the San Gabriel Mountains National Monument’s 2nd year anniversary. There was a total of 842 riders over the course of the 3 weekend pilot, with 416 riders on Saturdays and 426 riders on Sundays.
A survey was conducted by The Friends of the Angeles (volunteer non-profit organization) during the pilot and was completed by 2/3rds of total riders. Survey results indicated that 94% were highly satisfied with the shuttle, 39% took alternative transportation to Arcadia, and 90% would be willing to pay a small fee for the shuttle. Respondents reported that they heard about the shuttle primarily through social media and word of mouth.
The pilot shuttle was successful in providing access to Chantry Flat for non-automobile owners and for automobile users when the trailhead parking lot was full. Opportunities for improvement would be to incorporate traffic control at the base of the road leading to Chantry Flat. This would relieve traffic congestion by preventing unnecessary trips of driving up the road to a full parking lot and back down to take the shuttle. Improvements to radio communication technology were also a consideration, due to weak signal in the area. Radio communication is essential for logistics and emergency situations. Outreach and marketing efforts could also be improved by creating awareness of the ANF and the National Monument and by incorporating environmental education.
Following the pilot, the ANF is looking to implement a permanent program that provides shuttle service to Chantry Flat and other recreational opportunities in the area. The ANF identified the Federal Land Access Program and Caltrans Sustainable Transportation Planning Grant as potential funding sources.
Transit to Parks Strategic Plan - Case Studies 11
KEY TAKE-AWAYS
• Introducing new service as a pilot can allow for testing and refinement.• Collecting data and feedback from pilots is critical to fine-tuning the
approach and capitalizing on community / political support.• Mountainous terrain, narrow roads, and low-quality communication
signals can limit shuttle modes, quality, and service types available.• Insurance liability is a key issue for shared ride or partnership models
where buses and shuttles are borrowed from local agencies or leaving city/service boundaries. Insurance companies may not ensure routes outside designated boundaries until a negotiated rate in a new agreement is reached.
• It is important to allow extra time in the planning process for contracting.
• It may be smart to couple proposed shuttle/access with a parking strategy. While the Plan will aim to solve the transit-to-parks problem, some people may access the identified service using cars and therefore we may need a park-and-ride type of solution.
(CONTINUED)
The Topanga Canyon Beach Bus is an initiative of County Board Supervisor Sheila Kuehl’s office and a project of Los Angeles County, Department of Public Works. This bus service begins in Woodland Hills and travels through Topanga Canyon to local beaches and back. Destination stops include three public beaches and access to two Metro lines: Topanga Beach, Will Rogers State Beach, Santa Monica State Beach, Expo Line Santa Monica Station, and Orange Line. The bus initially began as a summer bus line but now operates 7 days a week from 9:30am to 6:00pm. The bus is funded by Supervisor Kuehl’s office and is a low cost transportation option to the beach. The line utilizes some existing Metro and Big Blue Bus stops and provides a new route from Woodland Hills to local beaches. The bus primarily serves SD3 residents, specifically, Topanga, Woodland Hills, & Santa Monica residents but also accommodates other San Fernando Valley residents.
This is a low-cost convenient bus line for those living in the Woodland Hills, Topanga, and Santa Monica areas. The bus line was built around a public transportation gap from the valley to the coast line and now connects these two areas year-round, with well visited interest points along the route. Something to consider with future transportation projects is how well they connect communities (who traditionally do not have access to parks and public beaches) to those sites while keeping costs and travel time in mind.
Overview
KEY TAKE-AWAYS
• Identifying and addressing transportation gaps through a local service line with funding by a supervisorial district is a tested solution.
• Connecting local transportation services to countywide transportation services offers comprehensive coverage for users
Los Angeles County Department of Public Works (Provider)
$124,000 projected service cost (2018)
Office of Sheila Kuehl - LA County Supervisor, District 3Shuttle Fare
Provider/Facilitator/Partners
Trip Time
Frequency of Service
Ridership
User Cost
Funding Sources
Provider Costs
Transit to Parks Strategic Plan - Case Studies 12
OVERVIEW
WOODLAND HILLS, CATOPANGA BEACHWILL ROGERS STATE BEACHSANTA MONICA STATE BEACH
SHUTTLE
2017 - PRESENT
1 hour to Beach1 hour 15 min to Valley
Every 2 hours 45 min to BeachEvery 3 hours 15 min to Valley
Average 20 riders per day
$ $ $ $ $ $ $ $ $ $$1.00 Base fare$0.50 Seniors and Persons w/ Disabilities
County
Provider Type

The Los Angeles Department of Transportation (LADOT) operates daily low cost DASH Observatory public bus service from the Vermont/Sunset Metro Red Line station to Griffith Observatory. Service runs daily, every 20-25 minutes from 12:00pm-10:00pm on weekdays and 10:00am-10:00pm on weekends. The cost is 50 cents, but only 35 cents with a Metro TAP card. Seniors and people with disabilities pay 25 cents. Children 4 years and under and LADOT or Metrolink pass holders ride for free.
The DASH Observatory makes the Observatory and surrounding trails more accessible to park visitors, especially non-auto owners and visitors with disabilities. The DASH Observatory’s origin at a major transit station (Red Line - Vermont/Sunset) allows easy access to the Observatory for non-auto owners in communities near the Red Line as well and connecting lines. The DASH Observatory has alleviated traffic congestion and parking difficulty near the Observatory. It has also allowed for the closure of Mount Hollywood Drive to vehicle access, allowing for greater safety and enjoyment for hikers and cyclists. The implementation of the DASH Observatory was coupled with paid parking in the lots near the Observatory with parking fees generating revenue to fund the Griffith Park Transportation Plan including the DASH Observatory line. At $0.50 per ride, the Dash Observatory is relatively low cost. LADOT has planned for increased weekend service based on user feedback and needs.
LOS ANGELES, CA
SHUTTLE
MARCH 2017 - PRESENT
LADOT DASH (Provider)Griffith Observatory (Partner)
Griffith Observatory parking fareShuttle Fare
Provider/Facilitator/Partners
Trip Time
Frequency of Service
Ridership
User Cost
Funding Sources
25 min
Every 20 min
Average 1,033 riders per day on weekends
$ $ $ $ $ $ $ $ $ $$0.50 Base fare$0.35 with TAP Card$0.25 Seniors & Persons w/ DisabilitiesFree Children age 0-4; LADOT or Metrolink pass
Transit Agency
Provider Type
Provider CostsUnknown
Transit to Parks Strategic Plan - Case Studies 13
OVERVIEW
KEY TAKE-AWAYS
• Beginning a new program with limited service allows for the opportunity to assess ridership and determine whether or not to expand service
• Alternate transportation options can be funded through paid parking.• There is an opportunity to publicize new service as part of a
comprehensive network approach provided by LA Metro (i.e. the “Transit-to-Parks” network with corresponding map(s).
• Service should be timed to be in sync with other connecting Metro route arrival times.
• Evaluation surveys and feedback should be used to adjust service.
(CONTINUED)
Transit to Parks Strategic Plan - Case Studies 14

Transit Agency
Provider Type
Transit to Parks Strategic Plan - Case Studies 15
Varies
Every 10 min
278,623 riders (2017)241,682 riders (2016)220,034 riders (2015)
$ $ $ $ $ $ $ $ $ $Free with Dodger Ticket
Provider/Facilitator/Partners
Trip Time
Frequency of Service
Ridership
User Cost
Funding Sources
Full amount unknown, grants below$1,169,000 Grant (2013-2014)$300,000 Grant (2010)
Mobile Source Air Pollution Reduction Review Committee
The Dodger Stadium Express provides service for Dodger Stadium visitors to and from Union Station. The service is free for game day ticket holders and also runs during special events at the Stadium. Dodger Stadium is impacted by heavy traffic and parking congestion (the stadium has 20,000 parking spots and 56,000 seats). The Dodger Stadium Express began in 2010 as a demonstration project, and was funded through a one year $300,000 grant provided by the Mobile Source Air Pollution Reduction Review Committee (MSRC). MSRC continues to fund the Express shuttle which has effectively reduced automobile trips and emissions.
Express service to Dodger Stadium runs every 10 minutes and often begins 90-120 minutes before game time. Shuttle start times vary based on anticipated game attendance, current ticket sales, prior year ticket sales, games with promotional giveaways, and special visiting team/rival games. Return service ends 45 minutes after the game or 20 minutes after a post game event (whichever is longer). In 2017, Metro ran between 10 and 15 compressed natural gas (CNG) buses during regular season games. 24 buses ran for the opening game, and 21-31 busses ran during playoff games. The trip time between Union Station and Dodger Stadium varies based on the time of day and demand. In 2016, the average trip between the Stadium and Union Station took approximately 17-18 minutes.
Key developments have been made to improve the efficiency of the shuttle service since its inception in 2010. For example, Metro strategically moved the bus stop location to the west of Union Station to avoid traffic congestion. This small change resulted in a significant reduction of travel time. A dedicated bus lane was also implemented in 2015, and Metro partnered
LOS ANGELES, CA
SHUTTLE
MARCH 2010 - PRESENT
OVERVIEWMetro (Provider)
Provider Costs
Transit to Parks Strategic Plan - Case Studies 16
KEY TAKE-AWAYS
• Strategic placement of stop locations and routes can significantly reduce trip travel time in high traffic areas.
• Proper use of dedicated bus lanes can be enforced through partnerships with transit and traffic enforcement agencies.
• A marketing campaign can be used to promote service and describe environmental benefits.
• A flexible number of shuttles can help match user demand.
(CONTINUED)
with the Los Angeles Department of Transportation and the Sheriffs Department to add cones, signage, enforcement officers, and traffic control to ensure proper use of the dedicated bus lane during games.
An extensive marketing campaign for the service attracts more riders each year: there were 220,034 riders in 2015, 241,682 riders in 2016, and 278,623 riders in 2017. Online, the service is promoted through the Dodger Stadium Express website, Metro website and blog, Dodger Stadium website, and other affiliated websites. The campaign includes advertisements on newspapers, radio, and television. Physical signs, electronic signs, posters, and banners were installed on Metro properties and at Dodger Stadium to publicize the shuttle. Announcements promoting the service are also made during Dodger games. Brochures and informational cards (produced in multiple languages) are distributed on Metro buses and trains. Additionally, the Dodger Stadium Express bus is branded and markets itself as it carries passengers.
From 2015-2017, the Dodger Stadium Express also provided service to and from Harbor Gateway, serving South Bay communities. In 2017, the South Bay service ran 7 to 8 buses during regular season, and up to 10 buses during playoffs. The South Bay service had 55,401 riders in 2017, 41,474 riders in 2016, 24,552 riders in 2015. The Harbor Gateway line was funded by Metro’s ExpressLanes Net Toll Reinvestment Grant Program and has since been terminated.
Prior to the Dodger Stadium Express shuttle, Metro operated seasonal shuttle service to Dodger Stadium from Downtown Los Angeles from 1962 through 1994. The service was discontinued in 1994 due to budgetary constraints and low ridership. In 2004, the Dodgers provided contractor-operated service for Friday night games from Patsaouras Plaza. This service utilized a temporary center bus lane on Sunset Blvd provided LADOT traffic control and traffic control officers. This service was ultimately discontinued due to low ridership and high operating costs.
SANTA MONICA MOUNTAINS, CA
SHUTTLE
JULY 2005 - NOVEMBER 2007
MRCA (Provider)Alternative Transportation in Parks & Public Lands (NPS) (Partner)
Varies
Santa Monica Mountains ConservancyNational Park ServiceShuttle fare
Provider/Facilitator/Partners
Trip Time
Frequency of Service
Ridership
User Cost
Funding Sources
Every 60 min
Average 80 riders per day
$ $ $ $ $ $ $ $ $ $$1.00 Base fare
Park Agency
Provider Type
Unknown
Transit to Parks Strategic Plan - Case Studies 17
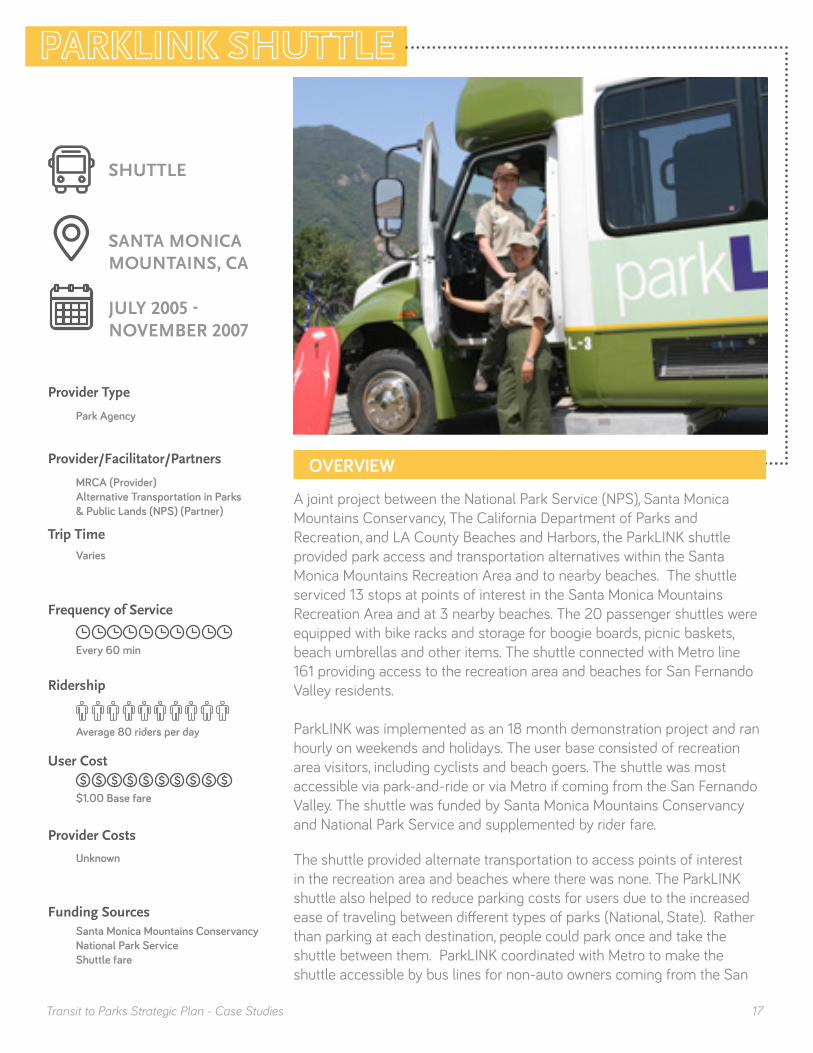
A joint project between the National Park Service (NPS), Santa Monica Mountains Conservancy, The California Department of Parks and Recreation, and LA County Beaches and Harbors, the ParkLINK shuttle provided park access and transportation alternatives within the Santa Monica Mountains Recreation Area and to nearby beaches. The shuttle serviced 13 stops at points of interest in the Santa Monica Mountains Recreation Area and at 3 nearby beaches. The 20 passenger shuttles were equipped with bike racks and storage for boogie boards, picnic baskets, beach umbrellas and other items. The shuttle connected with Metro line 161 providing access to the recreation area and beaches for San Fernando Valley residents.
ParkLINK was implemented as an 18 month demonstration project and ran hourly on weekends and holidays. The user base consisted of recreation area visitors, including cyclists and beach goers. The shuttle was most accessible via park-and-ride or via Metro if coming from the San Fernando Valley. The shuttle was funded by Santa Monica Mountains Conservancy and National Park Service and supplemented by rider fare.
The shuttle provided alternate transportation to access points of interest in the recreation area and beaches where there was none. The ParkLINK shuttle also helped to reduce parking costs for users due to the increased ease of traveling between different types of parks (National, State). Rather than parking at each destination, people could park once and take the shuttle between them. ParkLINK coordinated with Metro to make the shuttle accessible by bus lines for non-auto owners coming from the San
OVERVIEW
Provider Costs
Transit to Parks Strategic Plan - Case Studies 18
KEY TAKE-AWAYS
• Connecting local transportation services to specialized park transportation provides access for users from a certain locality.
• Decreases in park visitation during off-season will affect ridership.• Collecting data from a demonstration or pilot period is critical to gaging
the success and potential for longevity of a program.• The shuttle provided needed transportation within the recreation area,
but would have seen more use if it was connected to more than one bus line/ locality outside of the recreation area.
• It has proven helpful to provide room for bikes, backpacks, strollers, sports equipment, and other items that people frequently bring to parks.
• It should be easy for people to switch modes, for example providers can accept TAP cards or other system passes, rather than requiring a separate ticket.
• Limited service, low ridership, and funding cuts resulted in termination of service.
Fernando Valley. The shuttle was low cost and honored valid Metro passes. However, the shuttle was difficult to access for non-auto owners outside of the San Fernando Valley and offered limited service. ParkLINK ridership averaged approximately 80 people per day rather than the 100 people per day anticipated. Low ridership and funding cuts resulted in termination of the service.
(CONTINUED)
Transit to Parks Strategic Plan - Case Studies 19
3
Case Studies
Marin Transit (Provider)National Park Service (Partner)Parks and Public Lands (Partner)
$178,000 net operating costs (2016)
Initially by FHWA grantMarin TransitNational Park Service
Provider/Facilitator/Partners
Trip Time
Frequency of Service
Ridership
User Cost
Funding Sources
25 min (RT66)
55 min (RT66F)
Every 10 - 20 min (RT66)
Every 30 - 60 min (RT66F)
124,000 riders (2016)
$ $ $ $ $ $ $ $ $ $$3.00 Base fare
Transit Agency
Provider Type
Provider Costs
Transit to Parks Strategic Plan - Case Studies 20
OVERVIEW
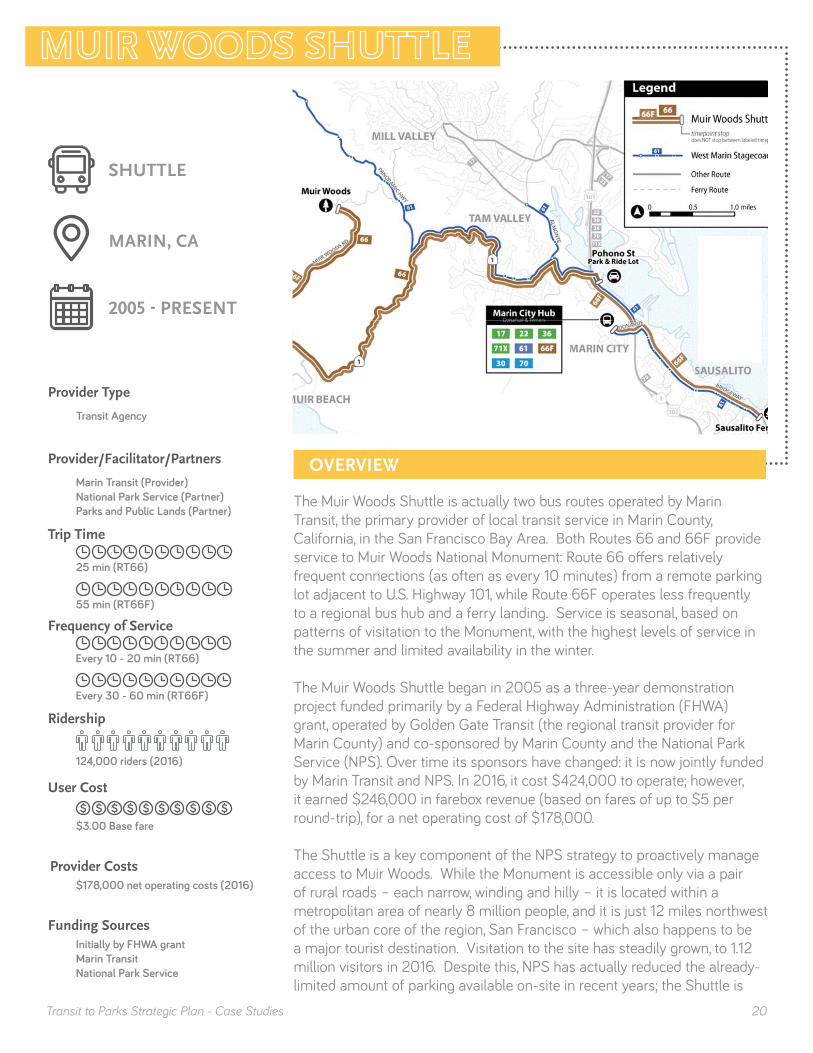
The Muir Woods Shuttle is actually two bus routes operated by Marin Transit, the primary provider of local transit service in Marin County, California, in the San Francisco Bay Area. Both Routes 66 and 66F provide service to Muir Woods National Monument: Route 66 offers relatively frequent connections (as often as every 10 minutes) from a remote parking lot adjacent to U.S. Highway 101, while Route 66F operates less frequently to a regional bus hub and a ferry landing. Service is seasonal, based on patterns of visitation to the Monument, with the highest levels of service in the summer and limited availability in the winter.
The Muir Woods Shuttle began in 2005 as a three-year demonstration project funded primarily by a Federal Highway Administration (FHWA) grant, operated by Golden Gate Transit (the regional transit provider for Marin County) and co-sponsored by Marin County and the National Park Service (NPS). Over time its sponsors have changed: it is now jointly funded by Marin Transit and NPS. In 2016, it cost $424,000 to operate; however, it earned $246,000 in farebox revenue (based on fares of up to $5 per round-trip), for a net operating cost of $178,000.
The Shuttle is a key component of the NPS strategy to proactively manage access to Muir Woods. While the Monument is accessible only via a pair of rural roads – each narrow, winding and hilly – it is located within a metropolitan area of nearly 8 million people, and it is just 12 miles northwest of the urban core of the region, San Francisco – which also happens to be a major tourist destination. Visitation to the site has steadily grown, to 1.12 million visitors in 2016. Despite this, NPS has actually reduced the already-limited amount of parking available on-site in recent years; the Shuttle is
MARIN, CA
SHUTTLE
2005 - PRESENT

Transit to Parks Strategic Plan - Case Studies 21
viewed by its partners as a critical tool for accommodating peak demand. Ridership reached 124,000 in 2016 – accounting for only about 6 percent of all trips to and from the Monument, but a much higher share on busy days (37,000 of those boardings came in the month of July alone).
In keeping with this mission, service was initially provided only from the remote parking lot – the Pohono Park-and-Ride – and much of its ridership was driven by a variable message sign posted alongside Highway 101 that would automatically begin posting notices at 10 a.m. on summer weekends that on-site parking was full and visitors should exit to take the shuttle instead. Later, service was added providing connections to the regional transit network, at the Marin City Hub, a major bus transfer point, and the Sausalito Ferry Landing, from which connections can be made to San Francisco.
In 2018, the Muir Woods Shuttle is undergoing the most radical change to the program since introduction of Route 66F service: it is now part of an integrated, reservation-based system for Monument access. All visitors will be required to have reservations, and as part of the reservations process, they must purchase either parking passes or shuttle fares. The cost to park is $8 per vehicle, and fares now cost $3 per person (per round trip).
The Shuttle has proven an invaluable tool for ensuring access to Muir Woods National Monument without expanding – and indeed, even reducing – on-site parking supply. On weekends and holidays when the park is busiest, about 18 percent of Muir Woods visitors arrive via shuttle. On some days in 2016, as many as 26 percent of visitors arrived by shuttle. This has allowed NPS to restrict parking on the shoulders of the rural roads near the site – a practice that was both dangerous (as visitors would hike in the roads themselves) and damaging to the sensitive ecosystem surrounding the Monument. It has also allowed an existing parking area adjacent to the Monument’s main entrance to be replaced by a new gateway meadow.
Since its expansion to a pair of regional transit hubs, the Shuttle allows car-free access to the Monument from a broad area – and serves a diverse range of users. The Monument is now accessible via a two-seat ride (requiring one transfer) from San Francisco, the densely populated center of the region that is also where most visitors to the Bay Area stay. It is also accessible from various points in Marin County and adjacent Sonoma County via transfers from eight different bus routes that connect to the Shuttle at a stop in Marin City, the lowest-income community in Marin County.
Unlike many such services that are free, the Muir Woods Shuttle has always charged a fare, reaching $5 per round trip in recent years. This was particularly problematic as long as parking at the site remained free. Since the switch to a reservations-based system, this equity gap has been reduced: shuttle fare is now $3, while parking costs $8 per vehicle.
(CONTINUED)
Transit to Parks Strategic Plan - Case Studies 22
KEY TAKE-AWAYS
• Shuttle service can ensure destination access while possibly also reducing on-site parking supply.
• Highlighting the co-benefit of reduced parking demand and reduced impact to natural ecosystems is helpful to the messaging about the service.
• Connecting local transportation services to regional transit hubs allows comprehensive coverage for users, especially non-auto owners.
• Minimizing transfers is helpful.• A reservation-based system may be helpful for certain destinations
and park types, but not all.• Parking should be priced appropriately at the destination (or at the
shuttle/service stop) to encourage shuttle/service usage.• Funding partnerships are critical to ensure long-term sustainability
and ensure political and stakeholder support.• Data collection is helpful to measure effectiveness and improve
service.• Shuttles to remote park areas are more likely to be successful when
there are disincentives for driving.
A funding partnership has helped make the service financially sustainable. The shuttle is funded on a 50-50 basis by Marin Transit and NPS. This cost-sharing arrangement has reduced costs for each agency, and has helped ensure a broader base of political support, with stakeholders both local and federal.
(CONTINUED)

PORTLAND, OR
SHUTTLE
2016 - PRESENT(2 YEAR PILOT)
Oregon Department of Transportation (Provider)
$150,000 total operating cost (2016)
Federal public transportation funds allocated by ODOTShuttle fare
Provider/Facilitator/Partners
Trip Time
Frequency of Service
Ridership
User Cost
Funding Sources
15 - 25 min
Every 45 - 60 min
Approx. 33,000 riders (2017) Approx. 30,000 riders (2016)
$ $ $ $ $ $ $ $ $ $$5.00 Base fare
Transit Agency
Provider Type
Provider Costs
Transit to Parks Strategic Plan - Case Studies 23
The Columbia Gorge Express is a shuttle service operating between Portland, Oregon and the scenic Multnomah Falls in the Columbia River Gorge, about 30 miles to the east. A two-year pilot program, it began during summer 2016. It operates Fridays, Saturdays, Sundays and holidays, making ten round trips a day with an average headway of 45 to 60 minutes. Fare is $5 for those who board at the Gateway Transit Center in Portland, and free from an interim stop at Rooster Rock State Park. The Gateway Transit Center offers connections to bus and rail lines operated by TriMet, the transit provider for the Portland region.
The pilot was launched by the Oregon Department of Transportation (ODOT) after the agency’s 2015 Columbia Gorge Transit Study found a decrease in visitor satisfaction due to congested roadways and limited parking availability. On holidays and weekends, visitors park illegally on grass patches and even on sidewalks.
The service is funded using a combination of federal and state funds. Partners include the Western Federal Lands Highway Division of the Federal Highway Administration, the U.S. Forest Service Columbia Gorge National Scenic Area, and TriMet. The total cost to operate the service for the first year was $150,000.
In 2016, annual ridership was approximately 30,000, including 775 riders alone on the Sunday of Fourth of July weekend. In 2017, ridership increased 10 percent. Only 28 percent of users are from the Portland area; a majority are visitors from out of state.
OVERVIEW

Transit to Parks Strategic Plan - Case Studies 24
KEY TAKE-AWAYS
• A majority of shuttle users started their trip on TriMet and had no other way of getting to Columbia Gorge, meaning that the program has greatly expanded access.
• Shuttle service can alleviate parking demand, decrease illegal parking behaviors, and improve safety for pedestrians and bicyclists.
• It is important to connect to larger transportation network.• Shuttle service should be flexible to adapt to demand.• Providers should consider fluctuating usage patterns for services
during holidays, weekend, and seasonally.• Many users may be visitors, especially to the County’s larger open
space assets.• Increased demand may lead to complaints of overcrowded buses or
poorly maintained services.• Providers should consider marketing to visitors and locals through
flyers, online websites, and social media outlets such as Facebook.
For the service’s second year, ODOT upgraded its fleet from cutaway vans to full-size coaches seating 56 passengers. It also added new stops with seating and shade. For 2018, ODOT is considering expansion to the Hood River and other Columbia Gorge destinations accessible from Interstate 84, as well as increased frequency and possible use of trailers or better accommodate bikes.
(CONTINUED)

Shuttle fare
Transit Agency
Provider Type
Unknown
Transit to Parks Strategic Plan - Case Studies 25
OVERVIEW
The Maroon Bells Bus Tours provide shuttle service for Maroon Bells visitors during peak hours. Maroon Bells is an iconic, popular recreational destination known for dramatic views of fall foliage, natural landscape features, and two 14,000 foot peak mountains. The Maroon Bells Bus Tours was implemented by the Roaring Fork Transportation Authority (RFTA) with the National Forest Service in response to the increase of automobile congestion and pollution degrading environmental quality in the area.
Currently, the Maroon Bells shuttle service runs June to October, 7:30am - 5:00pm. During this time the road to Maroon Bells is restricted to handicap vehicles, vehicles with 12 passengers or more, and the Maroon Bells Bus Tour. RFTA operates 36 seated passenger shuttles based on demand, with 6 shuttles at minimum and up to 13 shuttles in September during fall foliage. The shuttle loads visitors at Aspen Highlands Ski Area parking lot. A unique feature of the Maroon Bells shuttle includes an educational component. During the 25 minute trip, the driver/tour guide will point out areas of interest and geographical features, describe the wildlife, and provide a brief history of the area.
Since the Maroon Bells shuttle service was implemented, RFTA and the National Forest Service was successful in recovery of environmental quality of the area that was suffering due to automobile congestion and pollution. However, visitation to the site increases every year putting constraints on parking at Aspen Highlands and at the Maroon Bells trailhead before shuttle service begins.
ASPEN, CO
SHUTTLE
1977 - PRESENT
Roaring Fork Transportation Authority (provider)National Park Service (partner)
15 - 25 min
Every 20 min
215,575 riders (2017)199,768 riders (2016)174,202 riders (2015)
$ $ $ $ $ $ $ $ $ $$8.00 Base fare$6.00 Youth age 6-16 & SeniorsFree Children age 0-5
Provider/Facilitator/Partners
Trip Time
Frequency of Service
Ridership
User Cost
Funding Sources
Provider Costs
Transit to Parks Strategic Plan - Case Studies 26
KEY TAKE-AWAYS
• Consider pricing of tickets to cover or partially cover service costs.• There is an opportunity to provide an educational component as part
of trips to help people understand the park or open space destination, how to use and respect it, and how their use of a shuttle positively impacts their health and the environment.
• Using a large transit provider as a provider/resource allows adaptability to provide more shuttles based on demand.
• Seasonal trends allows predictability of ridership.• Appropriate staffing to carry out logistics and operations is an
important strategic consideration.
In 2017, RFTA implemented a remote overflow parking lot and free shuttle to relieve parking pressures at Aspen Highlands. A supervisor was also staged at Aspen Highlands to help with organization. In 2018, RFTA is considering starting the service in May and extending operating hours.
(CONTINUED)
Transit to Parks Strategic Plan - Case Studies 27
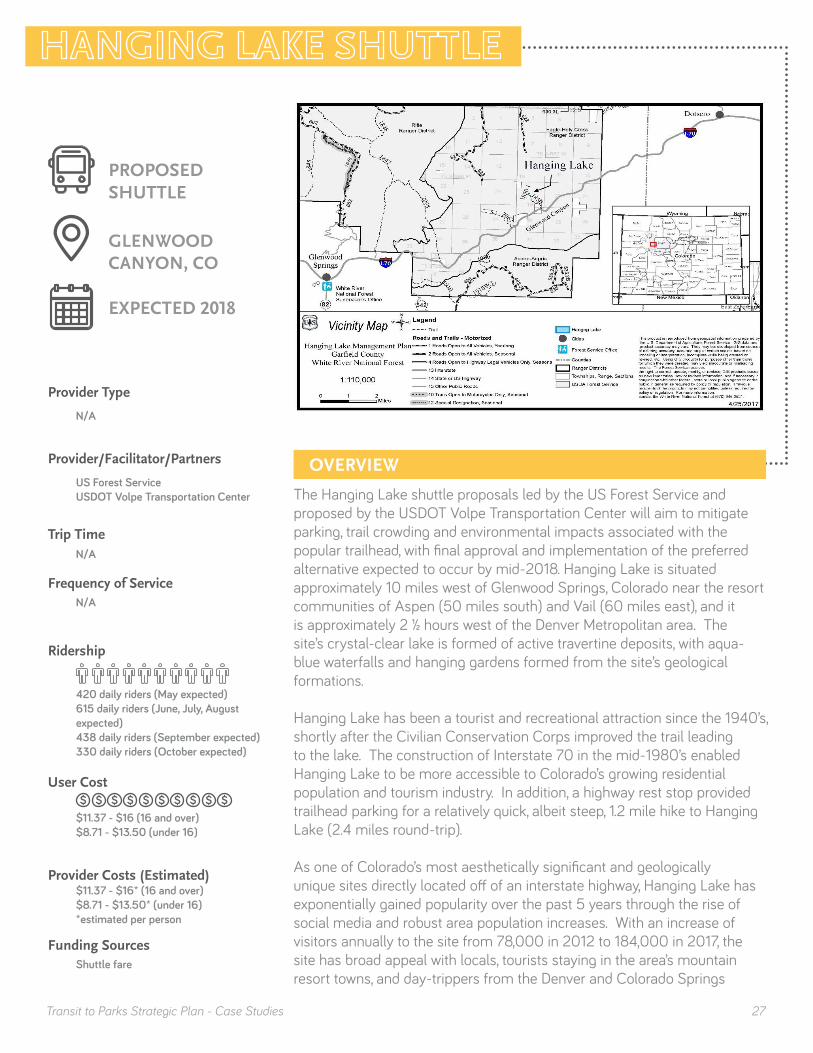
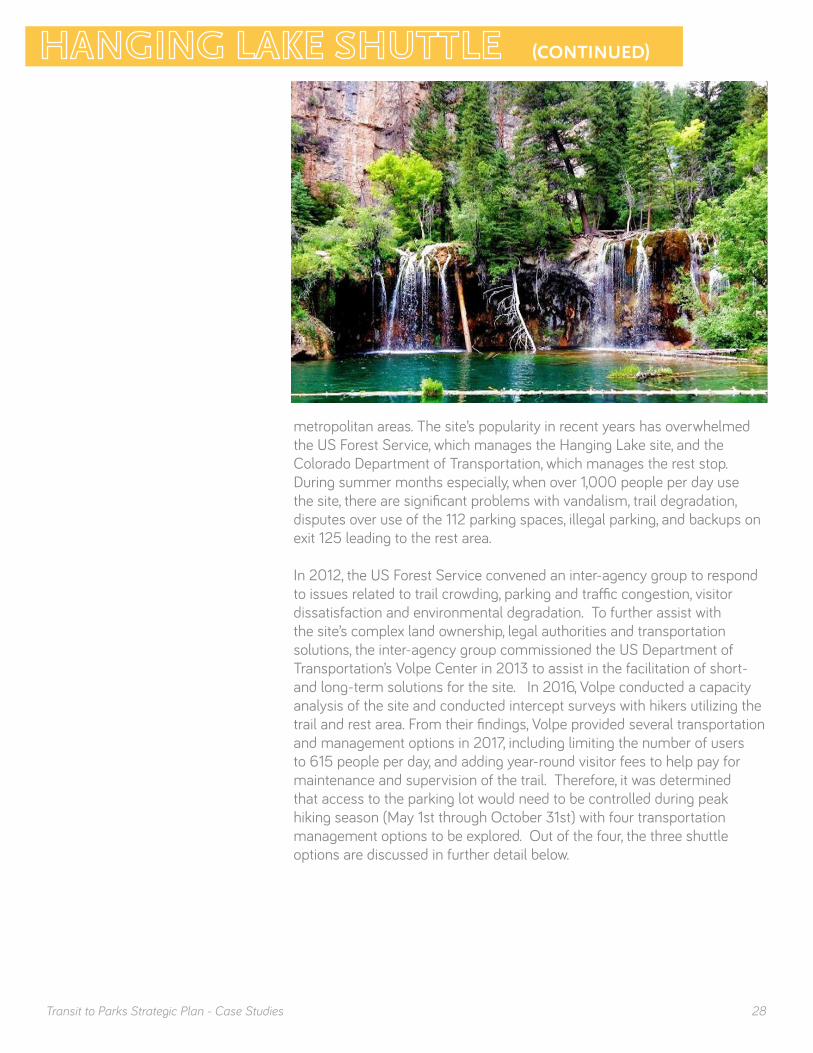
The Hanging Lake shuttle proposals led by the US Forest Service and proposed by the USDOT Volpe Transportation Center will aim to mitigate parking, trail crowding and environmental impacts associated with the popular trailhead, with final approval and implementation of the preferred alternative expected to occur by mid-2018. Hanging Lake is situated approximately 10 miles west of Glenwood Springs, Colorado near the resort communities of Aspen (50 miles south) and Vail (60 miles east), and it is approximately 2 ½ hours west of the Denver Metropolitan area. The site’s crystal-clear lake is formed of active travertine deposits, with aqua-blue waterfalls and hanging gardens formed from the site’s geological formations.
Hanging Lake has been a tourist and recreational attraction since the 1940’s, shortly after the Civilian Conservation Corps improved the trail leading to the lake. The construction of Interstate 70 in the mid-1980’s enabled Hanging Lake to be more accessible to Colorado’s growing residential population and tourism industry. In addition, a highway rest stop provided trailhead parking for a relatively quick, albeit steep, 1.2 mile hike to Hanging Lake (2.4 miles round-trip).
As one of Colorado’s most aesthetically significant and geologically unique sites directly located off of an interstate highway, Hanging Lake has exponentially gained popularity over the past 5 years through the rise of social media and robust area population increases. With an increase of visitors annually to the site from 78,000 in 2012 to 184,000 in 2017, the site has broad appeal with locals, tourists staying in the area’s mountain resort towns, and day-trippers from the Denver and Colorado Springs
OVERVIEW
GLENWOOD CANYON, CO
PROPOSED SHUTTLE
EXPECTED 2018
US Forest ServiceUSDOT Volpe Transportation Center
N/A
$11.37 - $16* (16 and over)$8.71 - $13.50* (under 16)*estimated per person
Shuttle fare
Provider/Facilitator/Partners
Trip Time
Frequency of Service
Ridership
User Cost
Funding Sources
N/A
420 daily riders (May expected)615 daily riders (June, July, August expected)438 daily riders (September expected)330 daily riders (October expected)
$ $ $ $ $ $ $ $ $ $$11.37 - $16 (16 and over)$8.71 - $13.50 (under 16)
N/A
Provider Type
Provider Costs (Estimated)
Transit to Parks Strategic Plan - Case Studies 28
metropolitan areas. The site’s popularity in recent years has overwhelmed the US Forest Service, which manages the Hanging Lake site, and the Colorado Department of Transportation, which manages the rest stop. During summer months especially, when over 1,000 people per day use the site, there are significant problems with vandalism, trail degradation, disputes over use of the 112 parking spaces, illegal parking, and backups on exit 125 leading to the rest area.
In 2012, the US Forest Service convened an inter-agency group to respond to issues related to trail crowding, parking and traffic congestion, visitor dissatisfaction and environmental degradation. To further assist with the site’s complex land ownership, legal authorities and transportation solutions, the inter-agency group commissioned the US Department of Transportation’s Volpe Center in 2013 to assist in the facilitation of short- and long-term solutions for the site. In 2016, Volpe conducted a capacity analysis of the site and conducted intercept surveys with hikers utilizing the trail and rest area. From their findings, Volpe provided several transportation and management options in 2017, including limiting the number of users to 615 people per day, and adding year-round visitor fees to help pay for maintenance and supervision of the trail. Therefore, it was determined that access to the parking lot would need to be controlled during peak hiking season (May 1st through October 31st) with four transportation management options to be explored. Out of the four, the three shuttle options are discussed in further detail below.
(CONTINUED)
Transit to Parks Strategic Plan - Case Studies 29
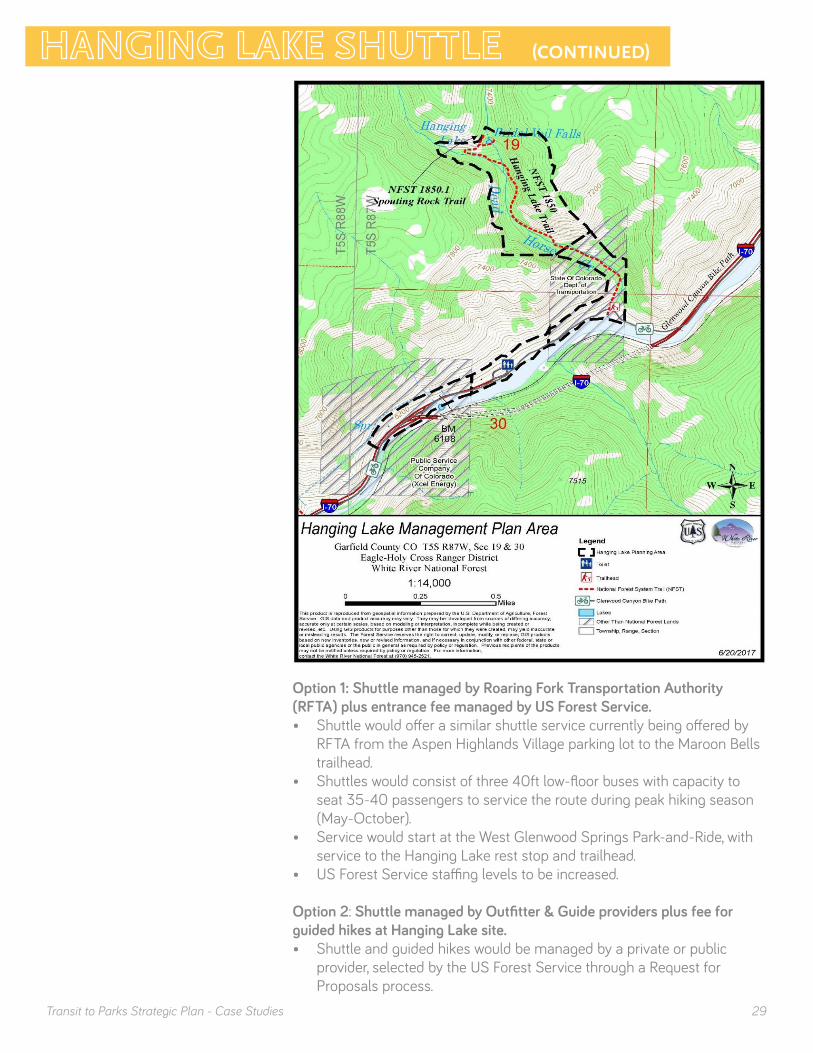
Option 1: Shuttle managed by Roaring Fork Transportation Authority (RFTA) plus entrance fee managed by US Forest Service. • Shuttle would offer a similar shuttle service currently being offered by
RFTA from the Aspen Highlands Village parking lot to the Maroon Bells trailhead.
• Shuttles would consist of three 40ft low-floor buses with capacity to seat 35-40 passengers to service the route during peak hiking season (May-October).
• Service would start at the West Glenwood Springs Park-and-Ride, with service to the Hanging Lake rest stop and trailhead.
• US Forest Service staffing levels to be increased.
Option 2: Shuttle managed by Outfitter & Guide providers plus fee for guided hikes at Hanging Lake site.• Shuttle and guided hikes would be managed by a private or public
provider, selected by the US Forest Service through a Request for Proposals process.
(CONTINUED)

Transit to Parks Strategic Plan - Case Studies 30
• While the fees from this option will cover shuttle services and guided hikes, it will not cover maintenance of the property, and US Forest Service staffing levels would remain unchanged.
Option 3: Shuttle managed by privately operated Outfitter & Guide providers plus entrance fee to Hanging Lake Site. • While the shuttle would be managed by a private provider through a
Request for Proposal process led by the US Forest Service (similar to Option 2), access into the site would be managed by the US Forest Service through an entrance fee into the site (similar to Option 1).
• Since US Forest Service staff will be in charge of managing the trailhead, staffing levels would be increased.
Estimated user and provider cost per person is $8.71 - $13.50 for ages under 16, and $11.37 - $16 for ages 16 and over. Ticket costs include operation of the shuttle, the reservation fee to purchase tickets through reservation.gov, marketing programs, staffing of the trail and shuttle, as well as trail maintenance. There is currently no proposal to subsidize the shuttle and reservation fees, despite recent concerns raised during the public comment process. If it is determined that RFTA will manage the shuttles, they will apply for grant funding to secure additional vehicles for service. 40’ buses that have a capacity of 35-40 passengers cost approximately $565,000 each and the larger, wi-fi equipped 57-passenger buses cost approximately $740,000 each.
Since each option explores the idea of charging visitors to Hanging Lake a fee to access the trail and amenities along it, the US Forest Service is required to conduct an environmental assessment per National Environmental Policy Act (NEPA) guidelines. This assessment was published in December 2017. Based on comments received during the Environmental Assessment, the preferred alternative will be selected before final approval is expected in May 2018.
KEY TAKE-AWAYS
• The inter-agency coordination process between US Forest Service, local municipalities, and transit agencies to determine shuttle service feasibility is a potential model for similar popular trailheads (especially those managed by the US Forest Service and with limited parking) in Los Angeles County.
• Solutions should explore the strengths and weaknesses of private and publicly managed shuttle options.
• Consider equity of access versus covering maintenance and operating costs for shuttles and trails.
(CONTINUED)
Transit to Parks Strategic Plan - Case Studies 31
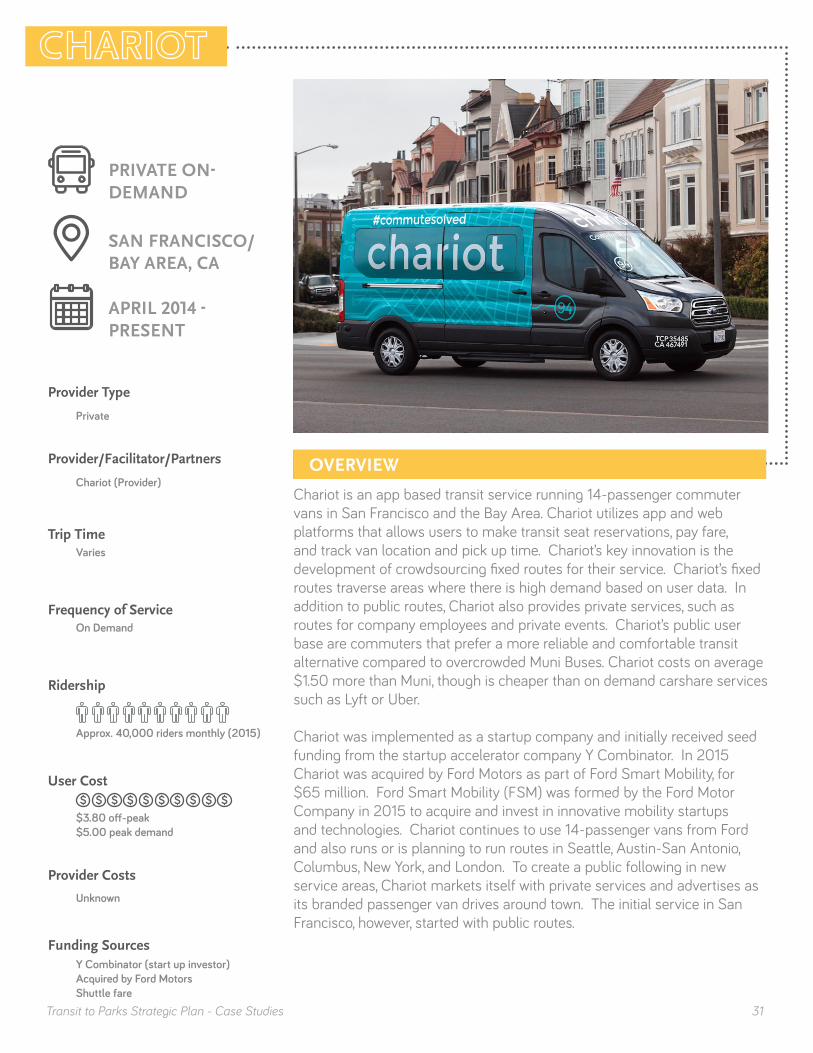
Chariot is an app based transit service running 14-passenger commuter vans in San Francisco and the Bay Area. Chariot utilizes app and web platforms that allows users to make transit seat reservations, pay fare, and track van location and pick up time. Chariot’s key innovation is the development of crowdsourcing fixed routes for their service. Chariot’s fixed routes traverse areas where there is high demand based on user data. In addition to public routes, Chariot also provides private services, such as routes for company employees and private events. Chariot’s public user base are commuters that prefer a more reliable and comfortable transit alternative compared to overcrowded Muni Buses. Chariot costs on average $1.50 more than Muni, though is cheaper than on demand carshare services such as Lyft or Uber.
Chariot was implemented as a startup company and initially received seed funding from the startup accelerator company Y Combinator. In 2015 Chariot was acquired by Ford Motors as part of Ford Smart Mobility, for $65 million. Ford Smart Mobility (FSM) was formed by the Ford Motor Company in 2015 to acquire and invest in innovative mobility startups and technologies. Chariot continues to use 14-passenger vans from Ford and also runs or is planning to run routes in Seattle, Austin-San Antonio, Columbus, New York, and London. To create a public following in new service areas, Chariot markets itself with private services and advertises as its branded passenger van drives around town. The initial service in San Francisco, however, started with public routes.
OverviewOVERVIEW
SAN FRANCISCO/BAY AREA, CA
PRIVATE ON-DEMAND
APRIL 2014 - PRESENT
Chariot (Provider)
Varies
On Demand
Y Combinator (start up investor)Acquired by Ford MotorsShuttle fare
Provider/Facilitator/Partners
Trip Time
Frequency of Service
Ridership
User Cost
Funding Sources
Approx. 40,000 riders monthly (2015)
$ $ $ $ $ $ $ $ $ $$3.80 off-peak$5.00 peak demand
Private
Provider Type
Provider Costs
Unknown

Transit to Parks Strategic Plan - Case Studies 32
KEY TAKE-AWAYS
• Transit-to-Parks solutions can consider crowd-sourced, fixed-route, or open-route on demand services.
• Consider equipment implications because of possible higher price tag, as well as smartphone and credit card requirements that some people might not have.
• Ability to couple fixed-routes with chartered, on-demand services.• Need to closely coordinate with public transportation offerings to avoid
redundancy and overlap.• Monitoring and oversight of these partner programs is important to
consider.
A major concern is Chariot’s potential conflict with public transportation services. The San Francisco Municipal Transportation Agency is proposing regulations and Private Transit Vehicle Permits to ensure private services operate safely, have minimal impact on public transit, and are responsive to the needs of the city.
(CONTINUED)

Transit to Parks Strategic Plan - Case Studies 33
Transit & Trails is an interactive app and web based platform that allows users to plan trips to outdoor recreational opportunities in the Bay Area. The trip planning tool allows users to search for open spaces and recreational opportunities in the Bay Area, and provides directions for transit, bicycling, and/or walking via Google Maps.
Transit & Trails is a program of The Bay Area Open Space Council - a network of nonprofits and public agencies that collaborates to foster an interconnected system of healthy communities with parks, trails, agricultural lands, and natural areas. Throughout development and maintenance of the app, the program was funded through various agencies and partners including: The David and Lucile Packard Foundation; San Francisco Foundation; State Coastal Conservancy; East Bay Regional Park District; Save Mount Diablo; and Sonoma County Agricultural Preservation and Open Space District. Partners include GreenInfo Network, Bay Nature, 511.org, Metropolitan Transportation Commission, and Bay Area Air Quality Management District.
Transit & Trails was innovative in providing a resource and intuitive platform that hosted a comprehensive collection of outdoor recreational opportunities. A key component of the data is the detailed attributes for each recreational activity including trip descriptions, photos, amenities, difficulty, surface conditions, trip type, and other descriptors for users to filter. The app also educates users with gas money and carbon savings based on their trip. Transit & Trails was marketed to the general public by public agencies and partners through their websites, social media, and blog.
OVERVIEW
SAN FRANCISCO/BAY AREA, CA
INTERACTIVE APP AND WEB PLATFORM
2009 - PRESENT
Bay Area Open Space CouncilTrailhead Labs
N/A
N/A
Multiple Agencies and Partners
Provider/Facilitator/Partners
Trip Time
Frequency of Service
Ridership / Users
User Cost
Funding Sources
25,000 - 30,000 unique visits per month at peak
$ $ $ $ $ $ $ $ $ $Free - Requires internet connection
Park Agency / Private
Provider Type
Provider Costs
Unknown

Transit to Parks Strategic Plan - Case Studies 34
KEY TAKE-AWAYS
• Consider partnering shuttle / transit service with educational information on how to best access and use the service.
• Educational information about gas money saved or health indicators achieved helps promote the services and helps users realize benefits.
• Upkeep of data requires ongoing maintenance and funding.• Providing trail and recreational activity descriptions, photos, and key
attributes brings quality and value to data.
Usage data of the app and web platform was available to the developer and agencies on the back-end, where they saw seasonal trends, spikes when their was an event or marketing campaign, and had peak visits of 25,000 - 30,000 unique visits a month.
The upkeep and maintenance of data collected from multiple agencies, along with evolving technological devices and trends presented a challenge during development of Transit & Trails. Although the Transit & Trails platform is still accessible to the public, due to a lack of a continued viable funding source, it is not actively being updated or promoted. As a result, the developers of the program have started their own company, Trailhead Labs, and built a new platform - Outerspatial. Outerspatial continues to allow agencies and partners to input and present trail data with an interactive platform. This new version, however, does not include transit data. Trailhead Labs is interested in working with transit agencies in the future.
(CONTINUED)

Transit to Parks Strategic Plan - Case Studies 35
The Youth Opportunity Pass (YOP) is a combined transit and community center pass provided to youth in Clark County, Washington, in the Portland, Oregon metropolitan area. The YOP program is a partnership of C-TRAN, the county’s transit provider, the County Parks and Recreation Department, and the school districts of the cities of Vancouver and Evergreen. The YOP provides free access to C-TRAN service as well as a pair of community centers, Firstenburg and Marshall/Luepke, for all participating middle and high school students.
The Firstenburg and Marshall/Luepke community centers are recreation centers with a basketball court, gymnasium, fitness center, climbing wall, pool, and game room. C-TRAN buses also provide connections to several parks, ensuring year-round indoor and outdoor recreational access.
The YOP began as a pilot program during the 2015 school year, and has since been continued. The value of the pass is more than $300, and the agency gave 1,500 passes to the Vancouver and Evergreen school districts. A survey of participants found that students have been taking full advantage of the pass, and would like to see the program continued.
OVERVIEW
VANCOUVER, WA
DISCOUNTED TRANSIT PASS
2015 - PRESENT
C-TRAN (Provider)City of Vancouver and school districts (Partners)
N/A
N/A
$300 per pass
C-TRAN funds the passes through its general fund - sales tax revenue increase
Provider/Facilitator/Partners
Trip Time
Frequency of Service
Ridership / Users
User Cost
Funding Sources
1,500 passes (2015)
$ $ $ $ $ $ $ $ $ $Free for students enrolled in participating school districts
Transit Agency / Park Agency
Provider Type
Provider Costs
Transit to Parks Strategic Plan - Case Studies 36
KEY TAKE-AWAYS
• Consider incentives to target certain audiences, like students or elderly.• By combining access to transit and recreation centers in a single pass,
the YOP program has increased the attractiveness and utility of both. • Including indoor recreation centers helps ensure that the program
remains useful and attractive year-round. • An ancillary benefit of the program is that it introduces participants to
transit at an early age, helping form habits that will hopefully continue as an adult.
• While the program is open to all students in the participating districts, students must apply. This has the effect of limiting overhead costs as well as ensuring that participants are interested and are likely to become committed, regular users.
• Like all transit pass programs, the YOP takes advantage of existing available capacity aboard buses, and thus results in very little marginal cost for the agency.
(CONTINUED)
Transit to Parks Strategic Plan - Case Studies 37
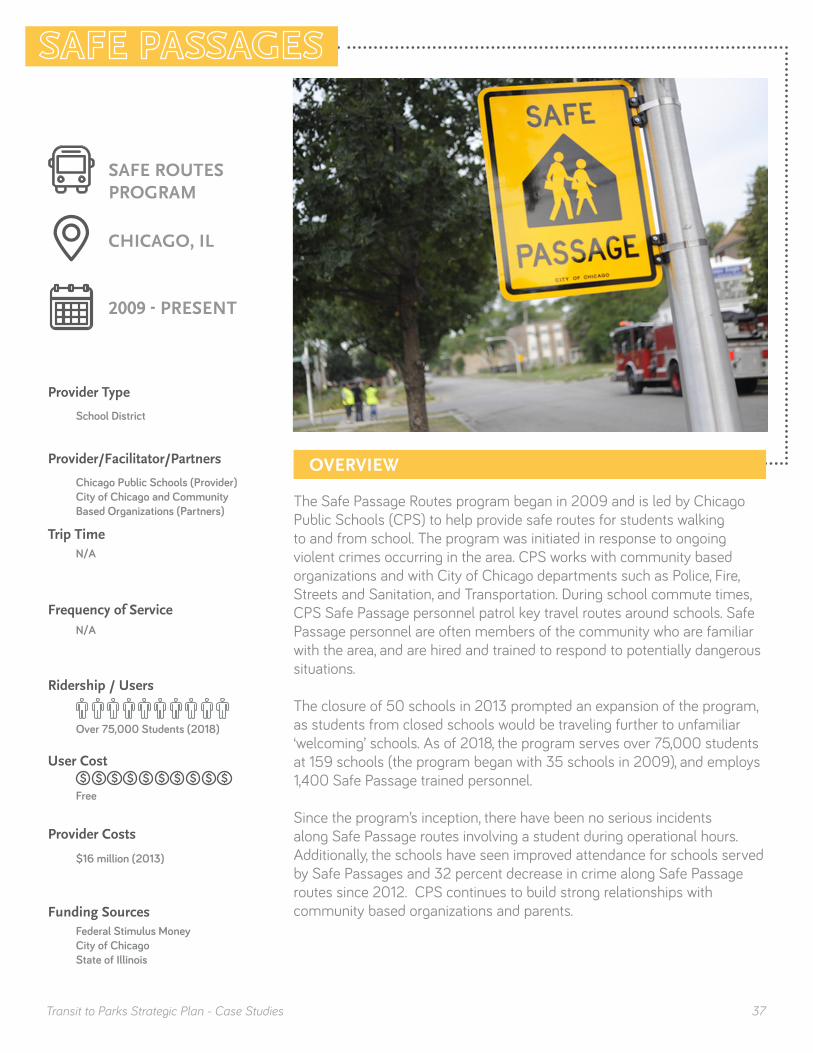
The Safe Passage Routes program began in 2009 and is led by Chicago Public Schools (CPS) to help provide safe routes for students walking to and from school. The program was initiated in response to ongoing violent crimes occurring in the area. CPS works with community based organizations and with City of Chicago departments such as Police, Fire, Streets and Sanitation, and Transportation. During school commute times, CPS Safe Passage personnel patrol key travel routes around schools. Safe Passage personnel are often members of the community who are familiar with the area, and are hired and trained to respond to potentially dangerous situations.
The closure of 50 schools in 2013 prompted an expansion of the program, as students from closed schools would be traveling further to unfamiliar ‘welcoming’ schools. As of 2018, the program serves over 75,000 students at 159 schools (the program began with 35 schools in 2009), and employs 1,400 Safe Passage trained personnel.
Since the program’s inception, there have been no serious incidents along Safe Passage routes involving a student during operational hours. Additionally, the schools have seen improved attendance for schools served by Safe Passages and 32 percent decrease in crime along Safe Passage routes since 2012. CPS continues to build strong relationships with community based organizations and parents.
OVERVIEW
CHICAGO, IL
SAFE ROUTES PROGRAM
2009 - PRESENT
Chicago Public Schools (Provider)City of Chicago and Community Based Organizations (Partners)
N/A
N/A
$16 million (2013)
Federal Stimulus Money City of ChicagoState of Illinois
Provider/Facilitator/Partners
Trip Time
Frequency of Service
Ridership / Users
User Cost
Funding Sources
Over 75,000 Students (2018)
$ $ $ $ $ $ $ $ $ $Free
School District
Provider Type
Provider Costs
Transit to Parks Strategic Plan - Case Studies 38
(CONTINUED)
KEY TAKE-AWAYS
• Coordination and distribution of information between multiple agencies, partners, and community based organizations plays a key role in ensuring a successful program.
• Increasing the number of eyes-on-the-street can improve safety and perceived safety in dangerous areas.
Transit to Parks Strategic Plan - Case Studies 39
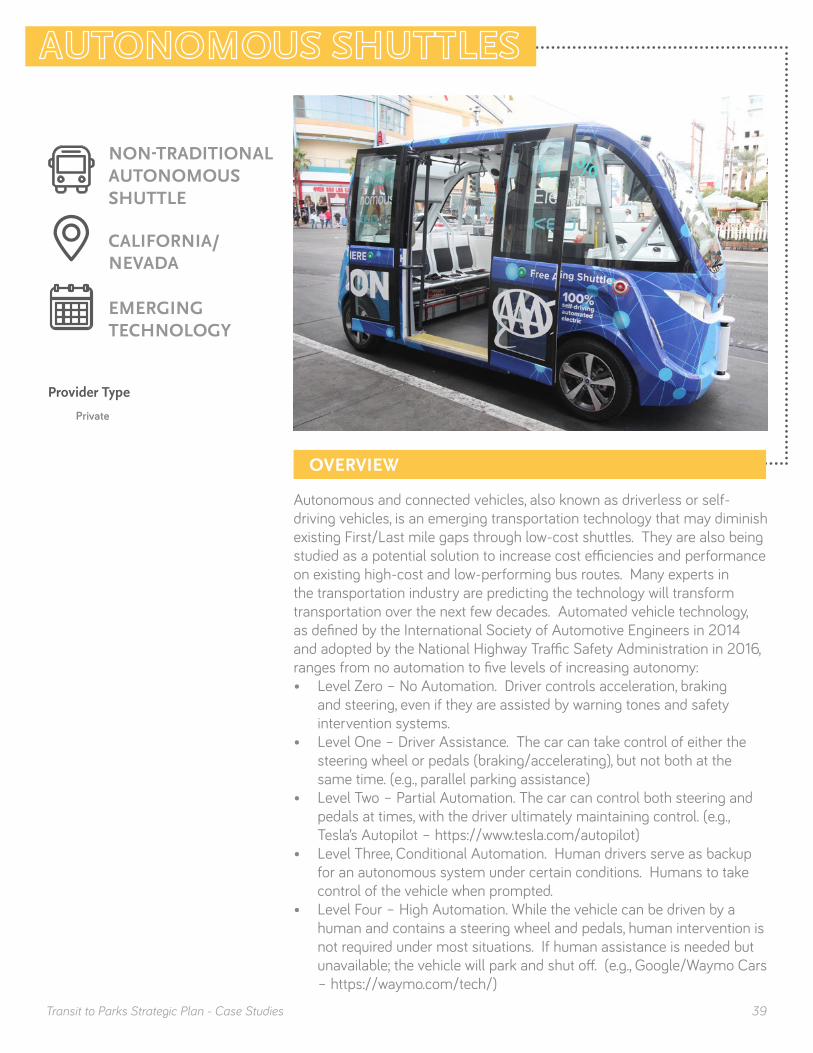
Autonomous and connected vehicles, also known as driverless or self-driving vehicles, is an emerging transportation technology that may diminish existing First/Last mile gaps through low-cost shuttles. They are also being studied as a potential solution to increase cost efficiencies and performance on existing high-cost and low-performing bus routes. Many experts in the transportation industry are predicting the technology will transform transportation over the next few decades. Automated vehicle technology, as defined by the International Society of Automotive Engineers in 2014 and adopted by the National Highway Traffic Safety Administration in 2016, ranges from no automation to five levels of increasing autonomy:• Level Zero – No Automation. Driver controls acceleration, braking
and steering, even if they are assisted by warning tones and safety intervention systems.
• Level One – Driver Assistance. The car can take control of either the steering wheel or pedals (braking/accelerating), but not both at the same time. (e.g., parallel parking assistance)
• Level Two – Partial Automation. The car can control both steering and pedals at times, with the driver ultimately maintaining control. (e.g., Tesla’s Autopilot – https://www.tesla.com/autopilot)
• Level Three, Conditional Automation. Human drivers serve as backup for an autonomous system under certain conditions. Humans to take control of the vehicle when prompted.
• Level Four – High Automation. While the vehicle can be driven by a human and contains a steering wheel and pedals, human intervention is not required under most situations. If human assistance is needed but unavailable; the vehicle will park and shut off. (e.g., Google/Waymo Cars – https://waymo.com/tech/)
OVERVIEW
CALIFORNIA/ NEVADA
NON-TRADITIONALAUTONOMOUS SHUTTLE
EMERGING TECHNOLOGY
Private
Provider Type
Transit to Parks Strategic Plan - Case Studies 40
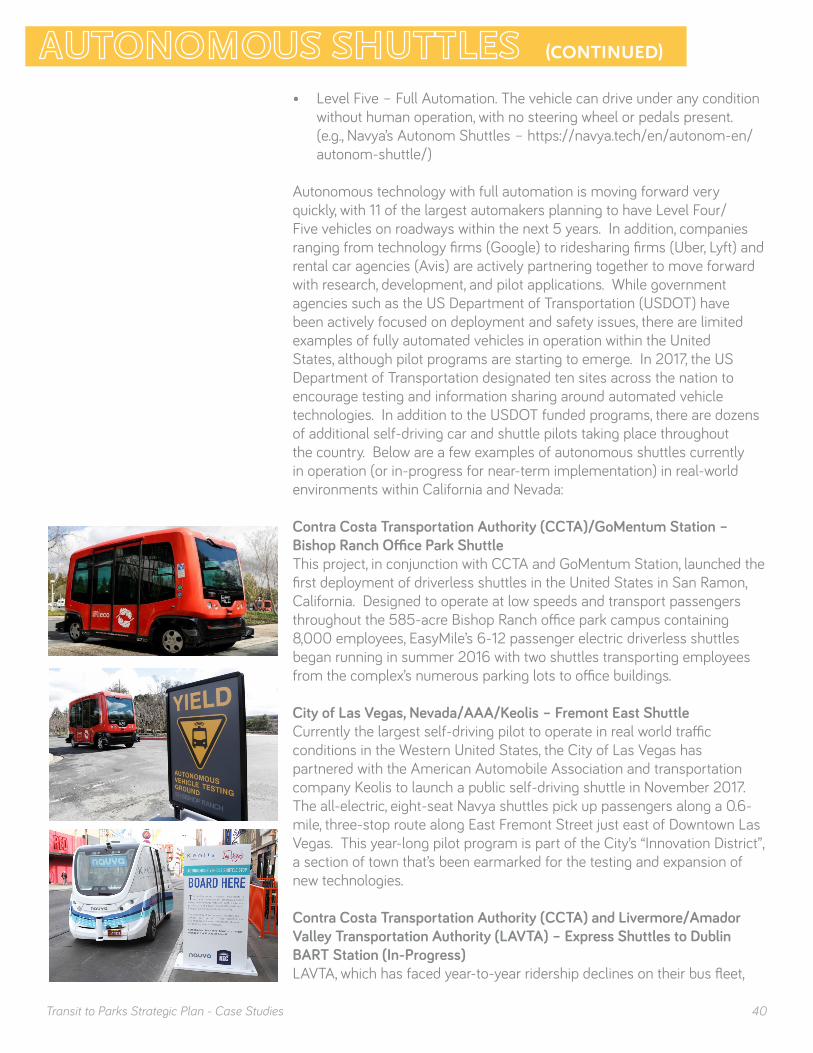
• Level Five – Full Automation. The vehicle can drive under any condition without human operation, with no steering wheel or pedals present. (e.g., Navya’s Autonom Shuttles – https://navya.tech/en/autonom-en/autonom-shuttle/)
Autonomous technology with full automation is moving forward very quickly, with 11 of the largest automakers planning to have Level Four/Five vehicles on roadways within the next 5 years. In addition, companies ranging from technology firms (Google) to ridesharing firms (Uber, Lyft) and rental car agencies (Avis) are actively partnering together to move forward with research, development, and pilot applications. While government agencies such as the US Department of Transportation (USDOT) have been actively focused on deployment and safety issues, there are limited examples of fully automated vehicles in operation within the United States, although pilot programs are starting to emerge. In 2017, the US Department of Transportation designated ten sites across the nation to encourage testing and information sharing around automated vehicle technologies. In addition to the USDOT funded programs, there are dozens of additional self-driving car and shuttle pilots taking place throughout the country. Below are a few examples of autonomous shuttles currently in operation (or in-progress for near-term implementation) in real-world environments within California and Nevada:
Contra Costa Transportation Authority (CCTA)/GoMentum Station – Bishop Ranch Office Park ShuttleThis project, in conjunction with CCTA and GoMentum Station, launched the first deployment of driverless shuttles in the United States in San Ramon, California. Designed to operate at low speeds and transport passengers throughout the 585-acre Bishop Ranch office park campus containing 8,000 employees, EasyMile’s 6-12 passenger electric driverless shuttles began running in summer 2016 with two shuttles transporting employees from the complex’s numerous parking lots to office buildings.
City of Las Vegas, Nevada/AAA/Keolis – Fremont East Shuttle Currently the largest self-driving pilot to operate in real world traffic conditions in the Western United States, the City of Las Vegas has partnered with the American Automobile Association and transportation company Keolis to launch a public self-driving shuttle in November 2017. The all-electric, eight-seat Navya shuttles pick up passengers along a 0.6-mile, three-stop route along East Fremont Street just east of Downtown Las Vegas. This year-long pilot program is part of the City’s “Innovation District”, a section of town that’s been earmarked for the testing and expansion of new technologies.
Contra Costa Transportation Authority (CCTA) and Livermore/Amador Valley Transportation Authority (LAVTA) – Express Shuttles to Dublin BART Station (In-Progress)LAVTA, which has faced year-to-year ridership declines on their bus fleet,
(CONTINUED)
Transit to Parks Strategic Plan - Case Studies 41
KEY TAKE-AWAYS
• Based on existing pilot programs, near-term advancements of autonomous vehicles will likely service First/Last Mile needs versus privately owned vehicles covering long distances.
• Autonomous vehicles operating within real-world environments are currently limited and therefore do not represent short-term solutions for transit-to-parks access.
• Coordination with local / regional / federal transportation agencies and private companies investing in autonomous technology is central.
• Consider using autonomous vehicles to improve cost effectiveness and operations for existing low-performing or expensive transit routes.
• Look at the potential of expanding new service to parks and trailheads with autonomous vehicles to close First/Last Mile gaps.
is exploring autonomous vehicle technology in the City of Dublin as a partner in CCTA’s Shared Autonomous Vehicle (SAV) project. LAVTA’s pilot will be funded with $1 million grant from Air Quality Management District (AQMD) “Spare the Air” funds. The funds will be used to join the GoMentum partnership with CCTA to purchase or lease two automated shuttles and fund the operation and testing during the pilot. LAVTA believes the vehicles can help increase transit ridership because they can provide express service between low-density suburbs and the Dublin/Pleasanton BART station, where it otherwise wouldn’t be cost effective to run regular bus routes.
While cost information for autonomous vehicles operating within the United States is limited, public agencies and private companies have put together a variety of funding proposals to purchase or lease, with examples provided below:
• Bishop Ranch Office Park (Sunset Development Company) – Purchase of two EasyMile EZ10 6-12 person passenger shuttles for $500,000. The shuttles are one part of a $5 million dollar investment between CCTA, GoMentum Station, and private companies in the San Francisco Bay Area. The budget includes funding for maintenance and software to deploy automated vehicle technologies throughout Contra Costa County.
• City of Arlington, Texas – Leased two EasyMile EZ10 6-12 passenger shuttles for $270,000 for use to connect people to attractions within their Entertainment District, with an option to extend the lease of the two shuttles for 6 more months for no additional charge. The lease covers all maintenance and software issues associated with the vehicles.
(CONTINUED)
Transit to Parks Strategic Plan - Case Studies 42
4
The Basics Analysis Measuring Effectiveness
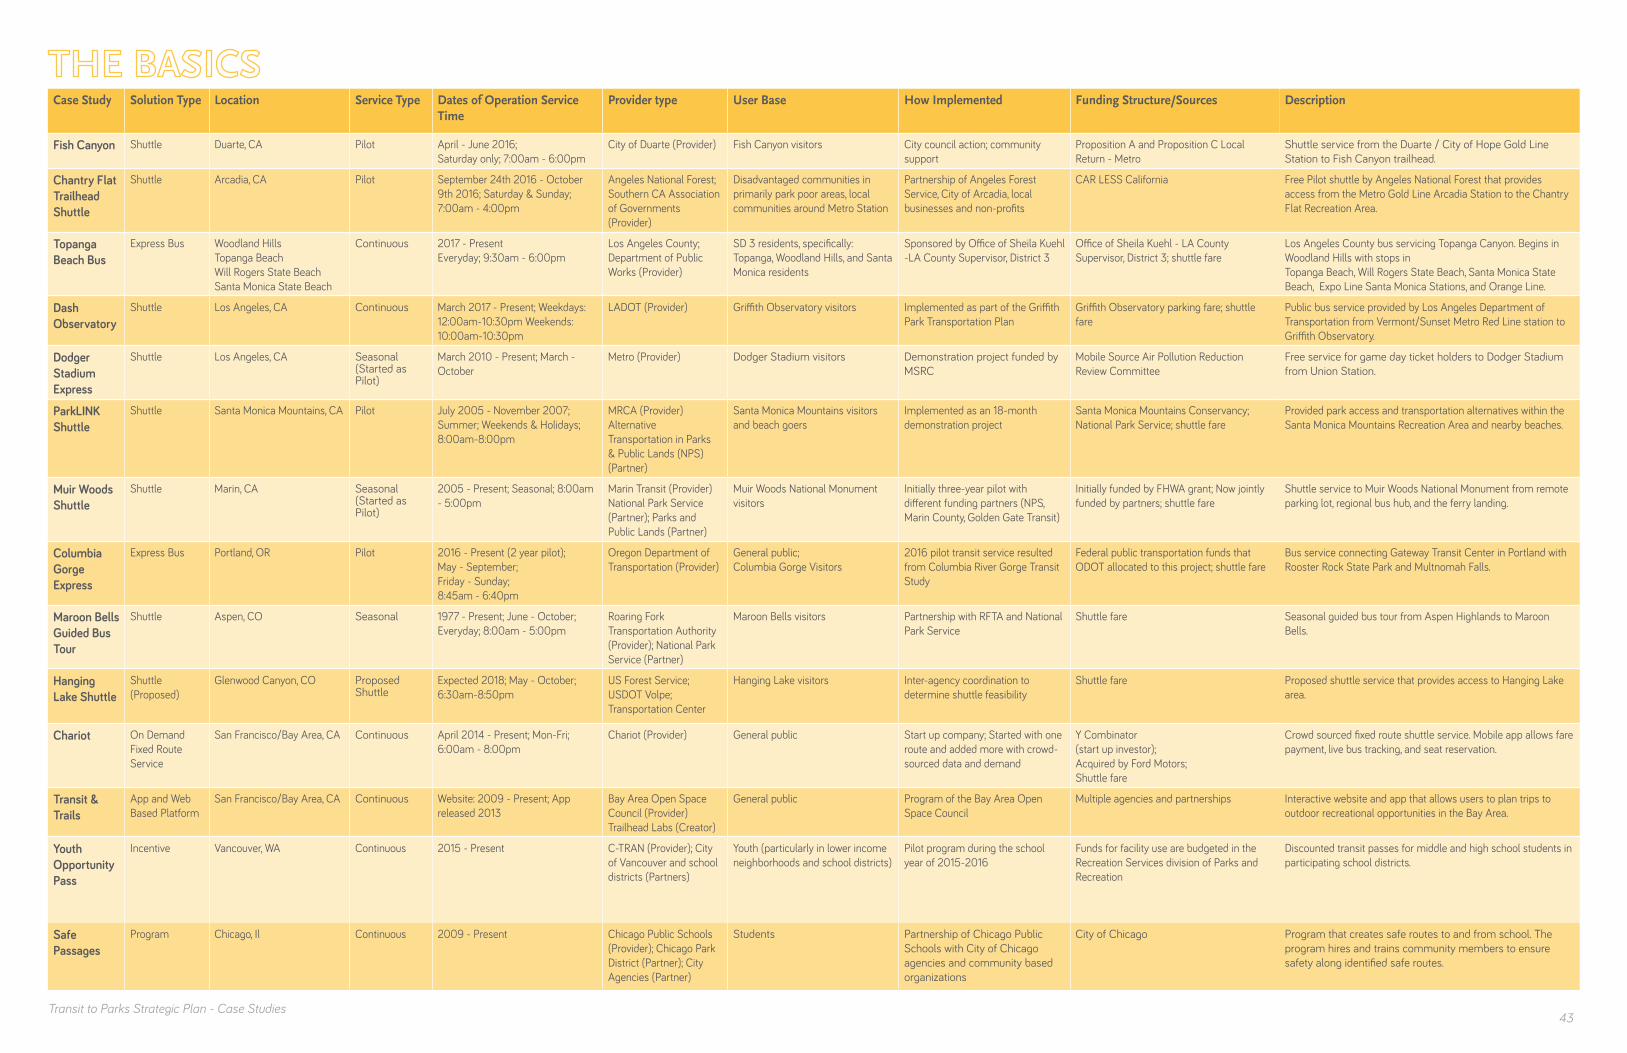
Case Study Solution Type Location Service Type Dates of Operation Service Time
Provider type User Base How Implemented Funding Structure/Sources Description
Fish Canyon Shuttle Duarte, CA Pilot April - June 2016;Saturday only; 7:00am - 6:00pm
City of Duarte (Provider) Fish Canyon visitors City council action; community support
Proposition A and Proposition C Local Return - Metro
Shuttle service from the Duarte / City of Hope Gold Line Station to Fish Canyon trailhead.
Chantry Flat Trailhead Shuttle
Shuttle Arcadia, CA Pilot September 24th 2016 - October 9th 2016; Saturday & Sunday; 7:00am - 4:00pm
Angeles National Forest; Southern CA Association of Governments (Provider)
Disadvantaged communities in primarily park poor areas, local communities around Metro Station
Partnership of Angeles Forest Service, City of Arcadia, local businesses and non-profits
CAR LESS California Free Pilot shuttle by Angeles National Forest that provides access from the Metro Gold Line Arcadia Station to the Chantry Flat Recreation Area.
Topanga Beach Bus
Express Bus Woodland HillsTopanga BeachWill Rogers State BeachSanta Monica State Beach
Continuous 2017 - PresentEveryday; 9:30am - 6:00pm
Los Angeles County; Department of Public Works (Provider)
SD 3 residents, specifically: Topanga, Woodland Hills, and Santa Monica residents
Sponsored by Office of Sheila Kuehl -LA County Supervisor, District 3
Office of Sheila Kuehl - LA County Supervisor, District 3; shuttle fare
Los Angeles County bus servicing Topanga Canyon. Begins in Woodland Hills with stops in Topanga Beach, Will Rogers State Beach, Santa Monica State Beach, Expo Line Santa Monica Stations, and Orange Line.
Dash Observatory
Shuttle Los Angeles, CA Continuous March 2017 - Present; Weekdays: 12:00am-10:30pm Weekends: 10:00am-10:30pm
LADOT (Provider) Griffith Observatory visitors Implemented as part of the Griffith Park Transportation Plan
Griffith Observatory parking fare; shuttle fare
Public bus service provided by Los Angeles Department of Transportation from Vermont/Sunset Metro Red Line station to Griffith Observatory.
Dodger Stadium Express
Shuttle Los Angeles, CA Seasonal(Started as Pilot)
March 2010 - Present; March - October
Metro (Provider) Dodger Stadium visitors Demonstration project funded by MSRC
Mobile Source Air Pollution Reduction Review Committee
Free service for game day ticket holders to Dodger Stadium from Union Station.
ParkLINK Shuttle
Shuttle Santa Monica Mountains, CA Pilot July 2005 - November 2007;Summer; Weekends & Holidays; 8:00am-8:00pm
MRCA (Provider)Alternative Transportation in Parks & Public Lands (NPS) (Partner)
Santa Monica Mountains visitors and beach goers
Implemented as an 18-month demonstration project
Santa Monica Mountains Conservancy; National Park Service; shuttle fare
Provided park access and transportation alternatives within the Santa Monica Mountains Recreation Area and nearby beaches.
Muir Woods Shuttle
Shuttle Marin, CA Seasonal(Started as Pilot)
2005 - Present; Seasonal; 8:00am - 5:00pm
Marin Transit (Provider)National Park Service (Partner); Parks and Public Lands (Partner)
Muir Woods National Monument visitors
Initially three-year pilot with different funding partners (NPS, Marin County, Golden Gate Transit)
Initially funded by FHWA grant; Now jointly funded by partners; shuttle fare
Shuttle service to Muir Woods National Monument from remote parking lot, regional bus hub, and the ferry landing.
Columbia Gorge Express
Express Bus Portland, OR Pilot 2016 - Present (2 year pilot);May - September; Friday - Sunday;8:45am - 6:40pm
Oregon Department of Transportation (Provider)
General public; Columbia Gorge Visitors
2016 pilot transit service resulted from Columbia River Gorge Transit Study
Federal public transportation funds that ODOT allocated to this project; shuttle fare
Bus service connecting Gateway Transit Center in Portland with Rooster Rock State Park and Multnomah Falls.
Maroon Bells Guided Bus Tour
Shuttle Aspen, CO Seasonal 1977 - Present; June - October; Everyday; 8:00am - 5:00pm
Roaring Fork Transportation Authority (Provider); National Park Service (Partner)
Maroon Bells visitors Partnership with RFTA and National Park Service
Shuttle fare Seasonal guided bus tour from Aspen Highlands to Maroon Bells.
Hanging Lake Shuttle
Shuttle (Proposed)
Glenwood Canyon, CO Proposed Shuttle
Expected 2018; May - October; 6:30am-8:50pm
US Forest Service; USDOT Volpe; Transportation Center
Hanging Lake visitors Inter-agency coordination to determine shuttle feasibility
Shuttle fare Proposed shuttle service that provides access to Hanging Lake area.
Chariot On Demand Fixed Route Service
San Francisco/Bay Area, CA Continuous April 2014 - Present; Mon-Fri; 6:00am - 8:00pm
Chariot (Provider) General public Start up company; Started with one route and added more with crowd-sourced data and demand
Y Combinator (start up investor); Acquired by Ford Motors; Shuttle fare
Crowd sourced fixed route shuttle service. Mobile app allows fare payment, live bus tracking, and seat reservation.
Transit & Trails
App and Web Based Platform
San Francisco/Bay Area, CA Continuous Website: 2009 - Present; App released 2013
Bay Area Open Space Council (Provider) Trailhead Labs (Creator)
General public Program of the Bay Area Open Space Council
Multiple agencies and partnerships Interactive website and app that allows users to plan trips to outdoor recreational opportunities in the Bay Area.
Youth Opportunity Pass
Incentive Vancouver, WA Continuous 2015 - Present C-TRAN (Provider); City of Vancouver and school districts (Partners)
Youth (particularly in lower income neighborhoods and school districts)
Pilot program during the school year of 2015-2016
Funds for facility use are budgeted in the Recreation Services division of Parks and Recreation
Discounted transit passes for middle and high school students in participating school districts.
Safe Passages
Program Chicago, Il Continuous 2009 - Present Chicago Public Schools (Provider); Chicago Park District (Partner); City Agencies (Partner)
Students Partnership of Chicago Public Schools with City of Chicago agencies and community based organizations
City of Chicago Program that creates safe routes to and from school. The program hires and trains community members to ensure safety along identified safe routes.
43Transit to Parks Strategic Plan - Case Studies
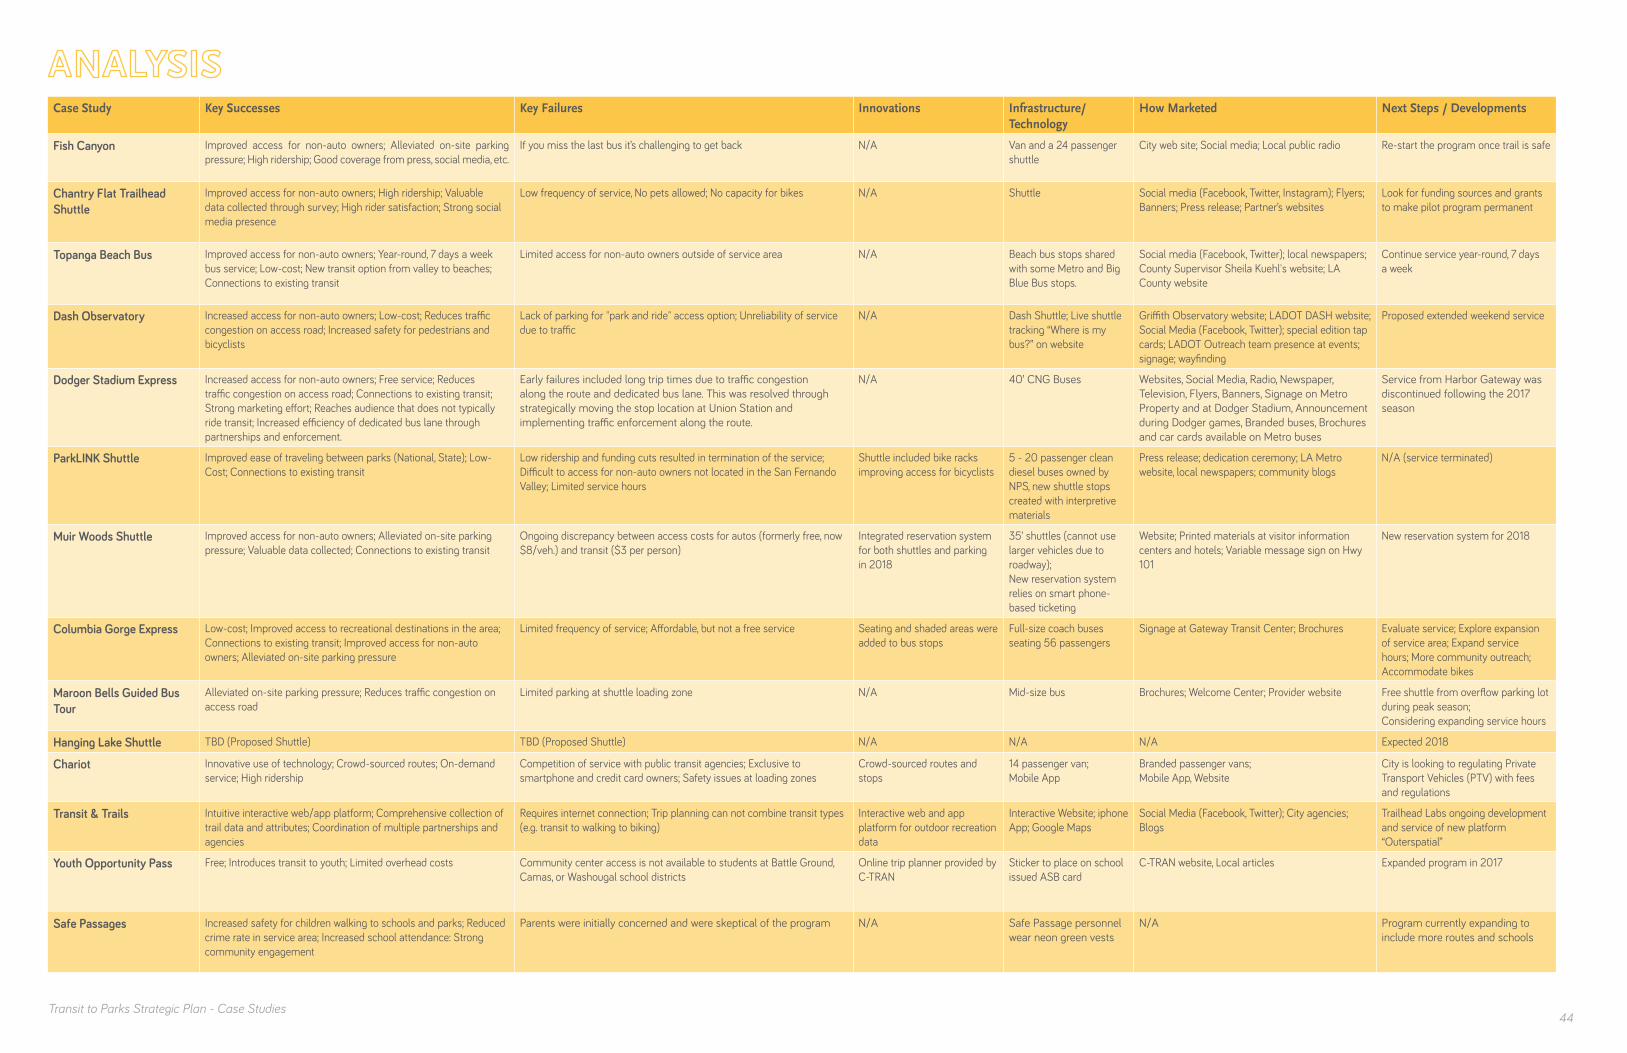
Case Study Key Successes Key Failures Innovations Infrastructure/Technology
How Marketed Next Steps / Developments
Fish Canyon Improved access for non-auto owners; Alleviated on-site parking pressure; High ridership; Good coverage from press, social media, etc.
If you miss the last bus it’s challenging to get back N/A Van and a 24 passenger shuttle
City web site; Social media; Local public radio Re-start the program once trail is safe
Chantry Flat Trailhead Shuttle
Improved access for non-auto owners; High ridership; Valuable data collected through survey; High rider satisfaction; Strong social media presence
Low frequency of service, No pets allowed; No capacity for bikes N/A Shuttle Social media (Facebook, Twitter, Instagram); Flyers; Banners; Press release; Partner’s websites
Look for funding sources and grants to make pilot program permanent
Topanga Beach Bus Improved access for non-auto owners; Year-round, 7 days a week bus service; Low-cost; New transit option from valley to beaches; Connections to existing transit
Limited access for non-auto owners outside of service area N/A Beach bus stops shared with some Metro and Big Blue Bus stops.
Social media (Facebook, Twitter); local newspapers; County Supervisor Sheila Kuehl's website; LA County website
Continue service year-round, 7 days a week
Dash Observatory Increased access for non-auto owners; Low-cost; Reduces traffic congestion on access road; Increased safety for pedestrians and bicyclists
Lack of parking for "park and ride" access option; Unreliability of service due to traffic
N/A Dash Shuttle; Live shuttle tracking “Where is my bus?” on website
Griffith Observatory website; LADOT DASH website; Social Media (Facebook, Twitter); special edition tap cards; LADOT Outreach team presence at events; signage; wayfinding
Proposed extended weekend service
Dodger Stadium Express Increased access for non-auto owners; Free service; Reduces traffic congestion on access road; Connections to existing transit; Strong marketing effort; Reaches audience that does not typically ride transit; Increased efficiency of dedicated bus lane through partnerships and enforcement.
Early failures included long trip times due to traffic congestion along the route and dedicated bus lane. This was resolved through strategically moving the stop location at Union Station and implementing traffic enforcement along the route.
N/A 40’ CNG Buses Websites, Social Media, Radio, Newspaper, Television, Flyers, Banners, Signage on Metro Property and at Dodger Stadium, Announcement during Dodger games, Branded buses, Brochures and car cards available on Metro buses
Service from Harbor Gateway was discontinued following the 2017 season
ParkLINK Shuttle Improved ease of traveling between parks (National, State); Low-Cost; Connections to existing transit
Low ridership and funding cuts resulted in termination of the service; Difficult to access for non-auto owners not located in the San Fernando Valley; Limited service hours
Shuttle included bike racks improving access for bicyclists
5 - 20 passenger clean diesel buses owned by NPS, new shuttle stops created with interpretive materials
Press release; dedication ceremony; LA Metro website, local newspapers; community blogs
N/A (service terminated)
Muir Woods Shuttle Improved access for non-auto owners; Alleviated on-site parking pressure; Valuable data collected; Connections to existing transit
Ongoing discrepancy between access costs for autos (formerly free, now $8/veh.) and transit ($3 per person)
Integrated reservation system for both shuttles and parking in 2018
35’ shuttles (cannot use larger vehicles due to roadway); New reservation system relies on smart phone-based ticketing
Website; Printed materials at visitor information centers and hotels; Variable message sign on Hwy 101
New reservation system for 2018
Columbia Gorge Express Low-cost; Improved access to recreational destinations in the area; Connections to existing transit; Improved access for non-auto owners; Alleviated on-site parking pressure
Limited frequency of service; Affordable, but not a free service Seating and shaded areas were added to bus stops
Full-size coach buses seating 56 passengers
Signage at Gateway Transit Center; Brochures Evaluate service; Explore expansion of service area; Expand service hours; More community outreach; Accommodate bikes
Maroon Bells Guided Bus Tour
Alleviated on-site parking pressure; Reduces traffic congestion on access road
Limited parking at shuttle loading zone N/A Mid-size bus Brochures; Welcome Center; Provider website Free shuttle from overflow parking lot during peak season; Considering expanding service hours
Hanging Lake Shuttle TBD (Proposed Shuttle) TBD (Proposed Shuttle) N/A N/A N/A Expected 2018
Chariot Innovative use of technology; Crowd-sourced routes; On-demand service; High ridership
Competition of service with public transit agencies; Exclusive to smartphone and credit card owners; Safety issues at loading zones
Crowd-sourced routes and stops
14 passenger van;Mobile App
Branded passenger vans;Mobile App, Website
City is looking to regulating Private Transport Vehicles (PTV) with fees and regulations
Transit & Trails Intuitive interactive web/app platform; Comprehensive collection of trail data and attributes; Coordination of multiple partnerships and agencies
Requires internet connection; Trip planning can not combine transit types (e.g. transit to walking to biking)
Interactive web and app platform for outdoor recreation data
Interactive Website; iphone App; Google Maps
Social Media (Facebook, Twitter); City agencies; Blogs
Trailhead Labs ongoing development and service of new platform “Outerspatial”
Youth Opportunity Pass Free; Introduces transit to youth; Limited overhead costs Community center access is not available to students at Battle Ground, Camas, or Washougal school districts
Online trip planner provided by C-TRAN
Sticker to place on school issued ASB card
C-TRAN website, Local articles Expanded program in 2017
Safe Passages Increased safety for children walking to schools and parks; Reduced crime rate in service area; Increased school attendance: Strong community engagement
Parents were initially concerned and were skeptical of the program N/A Safe Passage personnel wear neon green vests
N/A Program currently expanding to include more routes and schools
44Transit to Parks Strategic Plan - Case Studies

Case Study User Cost Provider Cost Ridership/User Data Trip Time Frequency of Service Other Measures of Effectiveness Co-benefits
Fish Canyon Free N/A
49 riders 1st month140 riders last month
7 min Every 30 min
N/A Access for non-auto owners; Relieved parking pressure at trailhead and nearby neighborhoods
Chantry Flat Trailhead Shuttle
Free $35,500 Total Project Cost;About $17 per rider
842 riders over 3 weekends 20-25 min Every 30-45 min
Other communities like Sierra Madre looking to implement similar programs in the spring of 2018
Reduces automobile congestion; Access for non-auto owners
Topanga Beach Bus $$1.00 Base fare$0.50 Seniors and Persons w/ Disabilities
$124,000 Projected Service Cost (2018)
Average 20 riders per day 1 hour to Beach 1 hour 15 min to Valley
Every 2 hours 45 min to BeachEvery 3 hours 15 min to Valley
Expanded service from seasonal to year round in September 2016
Reduces automobile congestion
Dash Observatory $$0.50 Base fare$0.35 with TAP Card$0.25 Seniors & Persons w/ DisabilitiesFree Children age 0-4; LADOT/Metrolink pass
N/A
Average 1,033 riders per day on weekends
25 min Every 20 min
Expanded service from weekends only to everyday in summer 2017; Proposed extended weekend hours
Reduces automobile congestion; Allows for closure of access road and improves safety for pedestrians and bicyclists
Dodger Stadium Express
Free for game day ticket holders $1,169,000 Grant (2013-2014)$300,000 Grant (2010)
220,034 riders (2015)241,682 riders (2016) 278,623 riders (2017)
17-18 min Every 10 min
N/A Reduces automobile congestion; Access for non-auto owners; Introduces transit to riders who do not normally take transit. Encourages public transportation to reduce air pollution
ParkLINK Shuttle $$1.00 Base fare
N/A
Average 80 riders per day
Varies
Every 60 min
Shuttle was able to coordinate with Metro bus line to increase access
Makes parks more accessible; Reduces automobile congestion
Muir Woods Shuttle $ $ $$3.00 Base fare
$178,000 Net Operating Costs (2016)
124,000 riders (2016) (5-6% of all park visitors; Ridership increasing)
25 min (Rt66)
55 min (Rt66F)
Every 10-20 min (Rt66)
30-60 min (Rt66F)
Farebox recovery rate in 2016 of ~58% (subsidy of $1.43 per trip)
Accommodates increasing visitor levels without increasing parking
Columbia Gorge Express
$ $ $ $ $$5.00 (from Gateway Transit Center)
$150,000 Net Operating Costs (2016)
Approx. 33,000 riders (2017)Approx. 30,000 riders (2016)
15-25 min Every 45-60 min
ODOT's plan to expand the bus service to Hood River in 2018 could possibly add more stops along the way (Cascade Locks and Eagle Creek)
Protects natural resources by reducing automobile emissions and illegal parking
Maroon Bells Guided Bus Tour
$ $ $ $ $ $ $ $$8.00 Adults$6.00 Youth age 6-16 & SeniorsFree Children under 5
N/A
215,575 riders (2017) 199,768 riders (2016)174,202 riders (2015)
25 min Every 20 min
N/A Protects natural resources by reducing automobile emissions; Educates passengers about the area
Hanging Lake Shuttle $ $ $ $ $ $ $ $ $$11.37 - $16 (16 and over)$8.71 - $13.50 (under 16)
$11.37 - $16 (16 and over)$8.71 - $13.50 (under 16)
615 riders (Daily cap per capacity study)
N/A N/A N/A N/A
Chariot $ $ $ $ $Off peak: $3.80Peak hours: $5.00
N/A
Approx. 40,000 riders per month (2015)
Varies On Demand Expanding to other service areas N/A
Transit & Trails Free (requires internet connection) N/A
25,000 - 30,00 unique visits each month at peak
N/A N/A Platform has evolved and continues to partner with agencies
Educates users on gas and carbon emission savings when using alternative transportation.
Youth Opportunity Pass
Free to students enrolled in participating school districts
$300 per pass
1,500 Passes (2015)
N/A N/A 90% of students plan to continue to ride the bus for the next school year
Program creates the opportunity for youth to ride transit at a young age, encouraging them to become long term users of C-TRAN
Safe Passages Free $283,000 (2017 Budget)$15.7 million (2013 Cost of Program)
75,000 Students (2018)
N/A N/A Crime Reduction, Increased school attendance, Expansion of program
Creates eyes-on-the-street to improve safety
= 6 minutes= 2,000 Riders per month= $1 = 6 minutes$
Transit to Parks Strategic Plan - Case Studies 45

Transit to Parks Strategic Plan - Case Studies 46
5
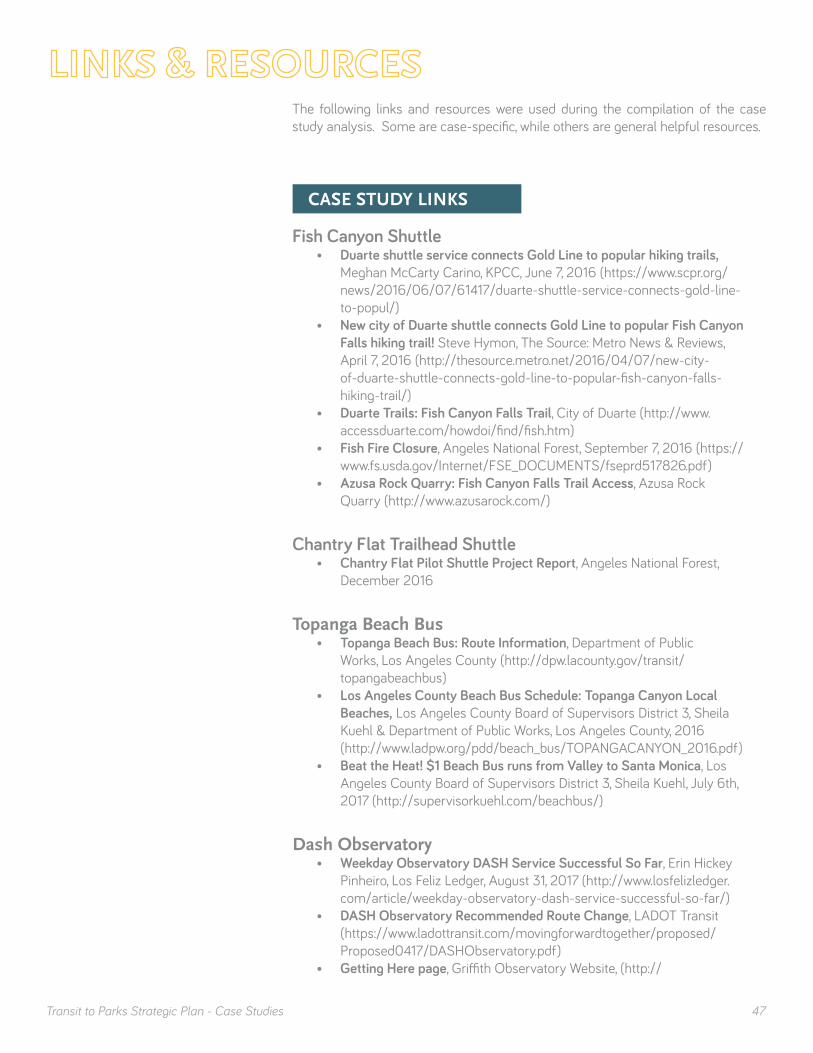
Transit to Parks Strategic Plan - Case Studies 47
The following links and resources were used during the compilation of the case study analysis. Some are case-specific, while others are general helpful resources.
CASE STUDY LINKS
Fish Canyon Shuttle• Duarte shuttle service connects Gold Line to popular hiking trails,
Meghan McCarty Carino, KPCC, June 7, 2016 (https://www.scpr.org/news/2016/06/07/61417/duarte-shuttle-service-connects-gold-line-to-popul/)
• New city of Duarte shuttle connects Gold Line to popular Fish Canyon Falls hiking trail! Steve Hymon, The Source: Metro News & Reviews, April 7, 2016 (http://thesource.metro.net/2016/04/07/new-city-of-duarte-shuttle-connects-gold-line-to-popular-fish-canyon-falls-hiking-trail/)
• Duarte Trails: Fish Canyon Falls Trail, City of Duarte (http://www.accessduarte.com/howdoi/find/fish.htm)
• Fish Fire Closure, Angeles National Forest, September 7, 2016 (https://www.fs.usda.gov/Internet/FSE_DOCUMENTS/fseprd517826.pdf)
• Azusa Rock Quarry: Fish Canyon Falls Trail Access, Azusa Rock Quarry (http://www.azusarock.com/)
Chantry Flat Trailhead Shuttle• Chantry Flat Pilot Shuttle Project Report, Angeles National Forest,
December 2016
Topanga Beach Bus• Topanga Beach Bus: Route Information, Department of Public
Works, Los Angeles County (http://dpw.lacounty.gov/transit/topangabeachbus)
• Los Angeles County Beach Bus Schedule: Topanga Canyon Local Beaches, Los Angeles County Board of Supervisors District 3, Sheila Kuehl & Department of Public Works, Los Angeles County, 2016 (http://www.ladpw.org/pdd/beach_bus/TOPANGACANYON_2016.pdf)
• Beat the Heat! $1 Beach Bus runs from Valley to Santa Monica, Los Angeles County Board of Supervisors District 3, Sheila Kuehl, July 6th, 2017 (http://supervisorkuehl.com/beachbus/)
Dash Observatory• Weekday Observatory DASH Service Successful So Far, Erin Hickey
Pinheiro, Los Feliz Ledger, August 31, 2017 (http://www.losfelizledger.com/article/weekday-observatory-dash-service-successful-so-far/)
• DASH Observatory Recommended Route Change, LADOT Transit (https://www.ladottransit.com/movingforwardtogether/proposed/Proposed0417/DASHObservatory.pdf)
• Getting Here page, Griffith Observatory Website, (http://
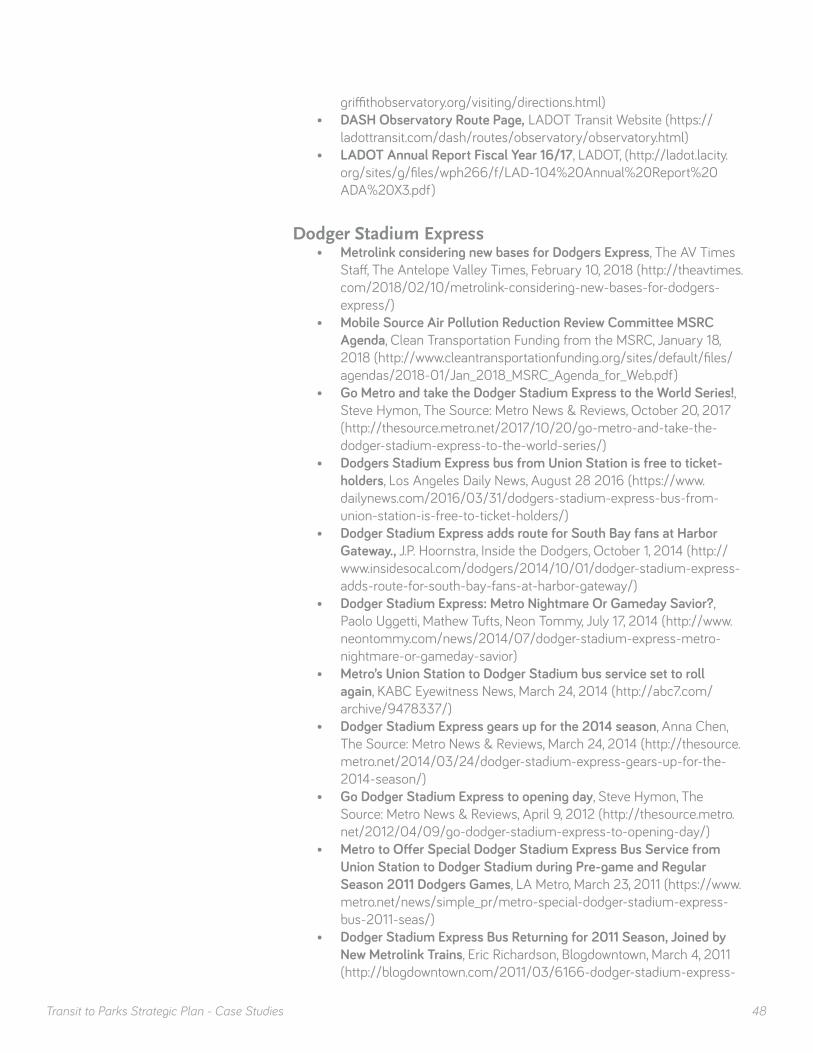
Transit to Parks Strategic Plan - Case Studies 48
griffithobservatory.org/visiting/directions.html)• DASH Observatory Route Page, LADOT Transit Website (https://
ladottransit.com/dash/routes/observatory/observatory.html)• LADOT Annual Report Fiscal Year 16/17, LADOT, (http://ladot.lacity.
org/sites/g/files/wph266/f/LAD-104%20Annual%20Report%20ADA%20X3.pdf)
Dodger Stadium Express• Metrolink considering new bases for Dodgers Express, The AV Times
Staff, The Antelope Valley Times, February 10, 2018 (http://theavtimes.com/2018/02/10/metrolink-considering-new-bases-for-dodgers-express/)
• Mobile Source Air Pollution Reduction Review Committee MSRC Agenda, Clean Transportation Funding from the MSRC, January 18, 2018 (http://www.cleantransportationfunding.org/sites/default/files/agendas/2018-01/Jan_2018_MSRC_Agenda_for_Web.pdf)
• Go Metro and take the Dodger Stadium Express to the World Series!, Steve Hymon, The Source: Metro News & Reviews, October 20, 2017 (http://thesource.metro.net/2017/10/20/go-metro-and-take-the-dodger-stadium-express-to-the-world-series/)
• Dodgers Stadium Express bus from Union Station is free to ticket-holders, Los Angeles Daily News, August 28 2016 (https://www.dailynews.com/2016/03/31/dodgers-stadium-express-bus-from-union-station-is-free-to-ticket-holders/)
• Dodger Stadium Express adds route for South Bay fans at Harbor Gateway., J.P. Hoornstra, Inside the Dodgers, October 1, 2014 (http://www.insidesocal.com/dodgers/2014/10/01/dodger-stadium-express-adds-route-for-south-bay-fans-at-harbor-gateway/)
• Dodger Stadium Express: Metro Nightmare Or Gameday Savior?, Paolo Uggetti, Mathew Tufts, Neon Tommy, July 17, 2014 (http://www.neontommy.com/news/2014/07/dodger-stadium-express-metro-nightmare-or-gameday-savior)
• Metro’s Union Station to Dodger Stadium bus service set to roll again, KABC Eyewitness News, March 24, 2014 (http://abc7.com/archive/9478337/)
• Dodger Stadium Express gears up for the 2014 season, Anna Chen, The Source: Metro News & Reviews, March 24, 2014 (http://thesource.metro.net/2014/03/24/dodger-stadium-express-gears-up-for-the-2014-season/)
• Go Dodger Stadium Express to opening day, Steve Hymon, The Source: Metro News & Reviews, April 9, 2012 (http://thesource.metro.net/2012/04/09/go-dodger-stadium-express-to-opening-day/)
• Metro to Offer Special Dodger Stadium Express Bus Service from Union Station to Dodger Stadium during Pre-game and Regular Season 2011 Dodgers Games, LA Metro, March 23, 2011 (https://www.metro.net/news/simple_pr/metro-special-dodger-stadium-express-bus-2011-seas/)
• Dodger Stadium Express Bus Returning for 2011 Season, Joined by New Metrolink Trains, Eric Richardson, Blogdowntown, March 4, 2011 (http://blogdowntown.com/2011/03/6166-dodger-stadium-express-
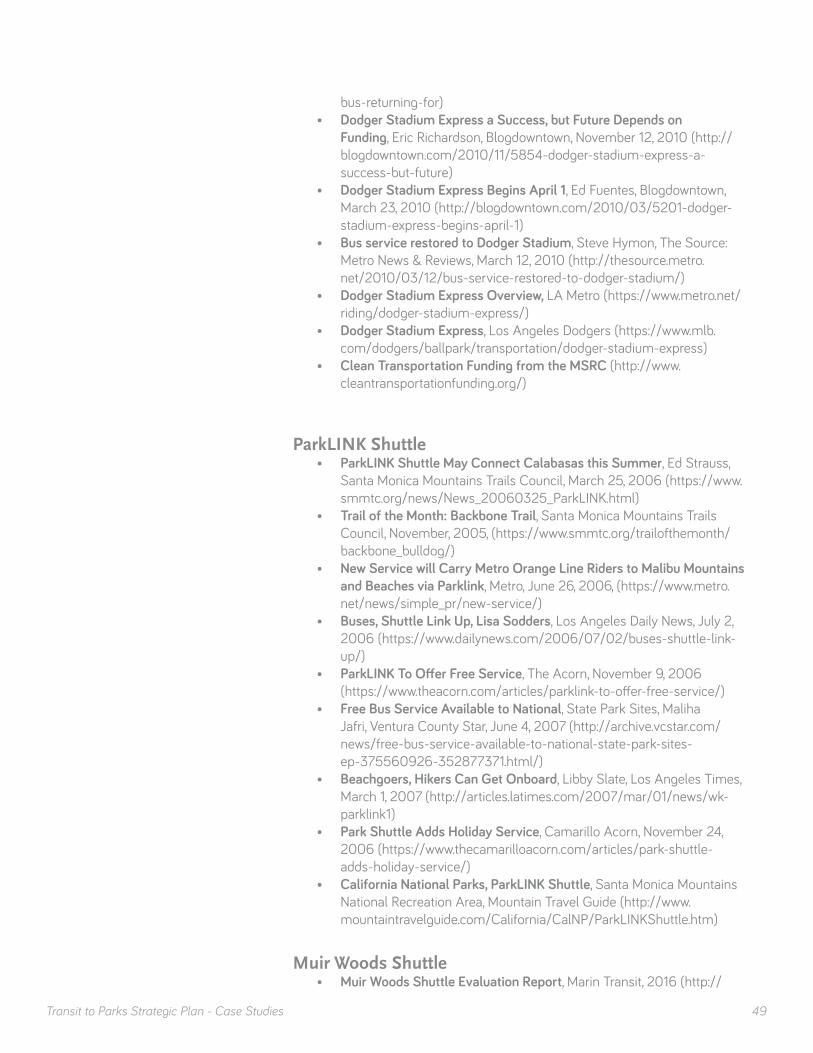
Transit to Parks Strategic Plan - Case Studies 49
bus-returning-for)• Dodger Stadium Express a Success, but Future Depends on
Funding, Eric Richardson, Blogdowntown, November 12, 2010 (http://blogdowntown.com/2010/11/5854-dodger-stadium-express-a-success-but-future)
• Dodger Stadium Express Begins April 1, Ed Fuentes, Blogdowntown, March 23, 2010 (http://blogdowntown.com/2010/03/5201-dodger-stadium-express-begins-april-1)
• Bus service restored to Dodger Stadium, Steve Hymon, The Source: Metro News & Reviews, March 12, 2010 (http://thesource.metro.net/2010/03/12/bus-service-restored-to-dodger-stadium/)
• Dodger Stadium Express Overview, LA Metro (https://www.metro.net/riding/dodger-stadium-express/)
• Dodger Stadium Express, Los Angeles Dodgers (https://www.mlb.com/dodgers/ballpark/transportation/dodger-stadium-express)
• Clean Transportation Funding from the MSRC (http://www.cleantransportationfunding.org/)
ParkLINK Shuttle• ParkLINK Shuttle May Connect Calabasas this Summer, Ed Strauss,
Santa Monica Mountains Trails Council, March 25, 2006 (https://www.smmtc.org/news/News_20060325_ParkLINK.html)
• Trail of the Month: Backbone Trail, Santa Monica Mountains Trails Council, November, 2005, (https://www.smmtc.org/trailofthemonth/backbone_bulldog/)
• New Service will Carry Metro Orange Line Riders to Malibu Mountains and Beaches via Parklink, Metro, June 26, 2006, (https://www.metro.net/news/simple_pr/new-service/)
• Buses, Shuttle Link Up, Lisa Sodders, Los Angeles Daily News, July 2, 2006 (https://www.dailynews.com/2006/07/02/buses-shuttle-link-up/)
• ParkLINK To Offer Free Service, The Acorn, November 9, 2006 (https://www.theacorn.com/articles/parklink-to-offer-free-service/)
• Free Bus Service Available to National, State Park Sites, Maliha Jafri, Ventura County Star, June 4, 2007 (http://archive.vcstar.com/news/free-bus-service-available-to-national-state-park-sites-ep-375560926-352877371.html/)
• Beachgoers, Hikers Can Get Onboard, Libby Slate, Los Angeles Times, March 1, 2007 (http://articles.latimes.com/2007/mar/01/news/wk-parklink1)
• Park Shuttle Adds Holiday Service, Camarillo Acorn, November 24, 2006 (https://www.thecamarilloacorn.com/articles/park-shuttle-adds-holiday-service/)
• California National Parks, ParkLINK Shuttle, Santa Monica Mountains National Recreation Area, Mountain Travel Guide (http://www.mountaintravelguide.com/California/CalNP/ParkLINKShuttle.htm)
Muir Woods Shuttle• Muir Woods Shuttle Evaluation Report, Marin Transit, 2016 (http://
Transit to Parks Strategic Plan - Case Studies 50
www.marintransit.org/pdf/planning/mws/mws2016report.pdf)• Muir Woods: Directions & Transportation, National Park Service (https://
www.nps.gov/muwo/planyourvisit/directions.htm)• Schedules: Muir Woods Shuttle: Route 66/66F, Marin Transit (http://
marintransit.org/routes/66.html)
Columbia Gorge Express• Columbia River Gorge Transit Study, Oregon Department of
Transportation and Nelson Nygaard, May 2016 (http://www.oregon.gov/ODOT/Projects/Project%20Documents/Gorge-Transit-Study-Final-Report.pdf)
• Columbia Gorge Express, Oregon Department of Transportation (http://columbiagorgeexpress.com/)
Maroon Bells Guided Bus Tour• Maroon Bells, Roaring Fork Transportation Authority (https://www.rfta.
com/routes/maroon-bells/)• Maroon Bells’ popularity prompts leaf-peeping change, transportation
study, The Aspen Times, July 27, 2017 (https://www.aspentimes.com/news/maroon-bells-impacts-prompt-leaf-peeping-change-study/)
• Ridership on RFTA’s Maroon Bells bus swelled to new heights Monday, Aspen Daily News. July 6, 2017 (https://www.aspendailynews.com/ridership-on-rfta-s-maroon-bells-bus-swelled-to-new/article_88ec38a1-31d8-5040-a666-2cfcf2065a8a.html)
• Maroon Bells bus starts today, operation changes in store, Aspen Daily News, June 9, 2017 (https://www.aspendailynews.com/maroon-bells-bus-starts-today-operations-changes-in-store/article_d46f5f11-8226-5138-ac10-81c0f574edc0.html)
• RFTA ridership tops record 5 million passengers in 2016, Post Independent, February 7, 2017 (https://www.postindependent.com/news/local/aspen-area-bus-ridership-tops-record-5-million-passengers-in-2016/)
• RFTA sets ridership record in 2014, The Aspen Times, March 3, 2015 (https://www.aspentimes.com/news/rfta-sets-ridership-record-in-2014/)
Hanging Lake Shuttle• Feds Seek Major Cutback in Visitors to Hanging Lake, Chad Abraham,
Aspen Daily News, August 22, 2017 (https://www.aspendailynews.com/feds-seek-major-cutback-in-visitors-to-hanging-lake/article_6e781955-cea5-5453-8cdb-e618a8d6df42.html)
• Hanging Lake Fee to Depend on Shuttle Service, Ryan Summerlin, Glenwood Springs Post Independent, December 27, 2017 (https://www.postindependent.com/news/local/hanging-lake-fee-to-depend-on-shuttle-service)
• Hanging Lake Management Plan Environmental Assessment, Eagle-Holy Cross Management District – White River National Forest/United States Forest Service and United States Department of Agriculture, December 2017 (http://a123.g.akamai.net/7/123/11558/abc123/forestservic.download.akamai.com/11558/www/nepa/105366_FSPLT3_4119549.pdf)
Transit to Parks Strategic Plan - Case Studies 51
• Permits, Caps and Fees Proposed to Balance Record Crowds and Protect Hanging Lake, Jason Blevins, Denver Post, August, 22, 2017 (https://www.denverpost.com/2017/08/22/hanging-lake-permits-daily-visitor-limit/)
• Proposed Hanging Lake Area Management Plan, Eagle-Holy Cross Management District – White River National Forest/United States Forest Service and United States Department of Agriculture, August 2017 (http://a123.g.akamai.net/7/123/11558/abc123/forestservic.download.akamai.com/11558/www/nepa/105366_FSPLT3_4049871.pdf)
• White River National Forest Hanging Lake Capacity Study, Benjamin Rasmussen and Lauren Deaderick, U.S. DOT Volpe Center, May 2016 (https://rosap.ntl.bts.gov/view/dot/12291)
• White River National Forest Hanging Lake Visitor Transportation Survey: Summary of Results, Benjamin Rasmussen and Lauren Deaderick, U.S. DOT Volpe Center, December 2016 (https://rosap.ntl.bts.gov/view/dot/12406)
• White River National Forest Hanging Lake Transportation Operations Study, Benjamin Rasmussen and Lauren Deaderick, U.S. DOT Volpe Center, May 2017 (https://rosap.ntl.bts.gov/view/dot/12499)
Chariot• Chariot Website FAQ Section (https://www.chariot.com/faqs)• New regulations for jitneys leave ban on Muni competition in flux,
SF Examiner, October 18, 2017 (http://www.sfexaminer.com/new-regulations-jitneys-leave-ban-muni-competition-flux/)
• Should San Francisco Regulate Chariot? StreetsBlog SF, October 3, 2017 (https://sf.streetsblog.org/2017/10/03/should-san-francisco-regulate-chariot/)
• Up for Approval: A New Permit Program for Private Transit, SF’s Modern ‘Jitneys’, San Francisco Municipal Transportation Agency, September 14, 2017 (https://www.sfmta.com/blog/approval-new-permit-program-private-transit-sf%E2%80%99s-modern-%E2%80%98jitneys%E2%80%99)
• Can Ford fix New York City’s transportation crisis with a crowd-sourced shuttle bus? The Verge, July 27, 2017 (https://www.theverge.com/2017/7/27/16036082/ford-chariot-nyc-crowdsource-microtransit-shuttle-bus)
• Chariot expands in S.F. and eyes Seattle, London, Toronto, SFGate, June 9, 2017 (http://www.sfgate.com/business/article/Chariot-expands-in-S-F-and-eyes-Seattle-London-11203865.php)
• SF planning first-of-its-kind laws for ‘jitney’ private bus system Chariot, SF Examiner, March 13, 2017 (http://www.sfexaminer.com/sf-planning-first-kind-laws-jitney-private-bus-system-chariot/)
• Can New Shuttle Service Curb San Francisco’s Transportation Trouble? Mission Local, February 22, 2016 (https://missionlocal.org/2016/02/can-new-shuttle-service-curb-san-franciscos-transportation-trouble/)
• Ford Partnering With Global Cities On New Transportation; Chariot Shuttle To Be Acquired, Ford GoBike To Launch In San Francisco, Ford Media, September 9, 2016 (https://media.ford.com/content/
Transit to Parks Strategic Plan - Case Studies 52
fordmedia/fna/us/en/news/2016/09/09/ford-partnering-with-global-cities-on-new-transportation--chario.html)
• The Last Bus Startup Standing: Chariot, TechCrunch, November 29, 2015 (https://techcrunch.com/2015/11/29/the-last-bus-startup-standing-chariot/)
Transit & Trails• Transit & Trails Website (http://www.transitandtrails.org/)• The First Ever Transit & Trails Triple Threat, Bay Area Open Space
Council, June 22, 2010 (https://openspacecouncil.org/the-first-ever-transit-trail-triple-threat/)
• Beyond Strava, Outside, June 10, 2014 (https://www.outsideonline.com/1924141/beyond-strava)
• Ditch Your Car, Find Adventure with Transit and Trails, Outside March 15, 2012 (https://www.outsideonline.com/1898011/ditch-your-car-find-adventure-transit-and-trails)
Youth Opportunity Pass• Opportunity Knocks for Area Middle and Senior High Schoolers,
C-Tran (https://www.c-tran.com/fares/youth-opportunity-pass)
Safe Passages• Mayor Emanuel and CPS Expand Safe Passage to 14 Additional
Schools, Chicago Mayor’s Office, Jan 21, 2018 (https://medium.com/@ChicagosMayor/mayor-emanuel-and-cps-expand-safe-passage-to-14-additional-schools-7c71daf73ce6)
• Safe Passage program expands to 14 more schools, Taylor Hartz, Chicago Sun Times, January 21, 2018 (https://chicago.suntimes.com/news/chicago-public-schools-safe-passage-expanded/)
• Data: Comparing CPS safe Passage routes and shootings, Kyle Bentle and Ryan Marx, Chicago Tribune, September 5, 2017 (http://www.chicagotribune.com/news/local/breaking/ct-cps-safe-passage-shootings-2017-htmlstory.html)
• Is Safe Passage Safe from Budget Cuts?, Rachel Kim, South Side Weekly, April 19, 2017 (https://southsideweekly.com/is-safe-passage-safe-from-budget-cuts/)
• CPS Says Crime Down by One-Third Along Safe Passage Routes, Matt Masterson, Chicago Tonight, May 26, 2017 (https://chicagotonight.wttw.com/2017/05/01/summer-safe-passage-program-growing-chicago)
• Summer Safe Passage Program Growing in Chicago, Matt Masterson, Chicago Tonight, May 1, 2017 (https://chicagotonight.wttw.com/2017/05/01/summer-safe-passage-program-growing-chicago)
• Chicago parents, students grateful for new Safe Passage routes, Diane Pathieu, Evelyn Holmes, ABC7 Eyewitness News, September 6, 2016 (http://abc7chicago.com/education/chicago-parents-grateful-for-new-safe-passage-routes/1500248/)
• Chicago’s $8 million push to protect students from gangs, Jamie Gumbrecht, CNN, April 10, 2014 (https://www.cnn.com/2014/04/10/
Transit to Parks Strategic Plan - Case Studies 53
us/chicagoland-safe-passage/index.html)• In Chicago, Campaign to Provide Safe Passage on Way to School,
Monica Davey, The New York Times, August 26, 2013 (http://www.nytimes.com/2013/08/27/education/in-chicago-campaign-to-provide-safe-passage-on-way-to-school.html)
• Will ‘Safe Passage’ Routes Really Keep Chicago Kids Safe?, Celeste Headlee, Linda Lutton, Tell Me More, National Public Radio, August 14, 2013 (https://www.npr.org/templates/story/story.php?storyId=212003852)
• Chicago Safe Passage Routes Map Released As Critics Worry The Program Is Not Ready, Huffington Post, August 9, 2013 (https://www.huffingtonpost.com/2013/08/09/chicago-safe-passage-routes_n_3732653.html)
• CPS Safe Passage Programs Expands, Lawndale News, June 27, 2013 (http://www.lawndalenews.com/2013/06/cps-safe-passage-programs-expands/)
• Safe Passage Flyer, Chicago Police, (https://home.chicagopolice.org/wp-content/uploads/2014/12/SafePassage.pdf)
Autonomous Shuttle• American Planning Association Knowledgebase Collection –
Autonomous Vechicles, American Planning Association (https://www.planning.org/knowledgebase/autonomousvehicles/)
• Cities Now Exploring Autonomous Buses – But Is It Worth It? Greg Rogers, Eno Transportation Weekly, April 10, 2017 (https://www.enotrans.org/article/cities-now-exploring-autonomous-buses-worth/)
• Driverless Cars – Who’s Doing What, And How It Impacts Urban Transportation, Patrick Sisson, Curbed, July 7, 2017 (https://www.curbed.com/2017/7/7/15935126/google-uber-driverless-car-waymo-autonomous)
• Driverless Shuttles Coming to the East Bay to be Tested, Patricia Torres, East Bay Times, July 23, 2016 (https://www.bishopranch.com/media-coverage/driverless-shuttles-coming-east-bay-tested/)
• How Will Autonomous Vehicles Change Public Transit? Chrissy Nichols, Remix, July 24, 2017 (https://blog.remix.com/how-will-autonomous-vehicles-change-public-transit-e6a47a161779)
• Self Driving Vehicles – What are the Six Levels of Autonomy? Loz Blain, New Atlas, June 7, 2017 (https://newatlas.com/sae-autonomous-levels-definition-self-driving/49947/)
• Shared Autonomous Vehicles Update, Christy Wegener, Livermore Amador Valley Transit Authority, February 6, 2017 (http://www.wheelsbus.com/wp-content/uploads/2017/02/6.1_SR_Shared-Autonomous-Vehicles.pdf)
• Shared Automated Vehicles – Review of Business Models, Adam Stocker and Susan Shaheen, The International Transport Forum, July 2017 (https://www.itf-oecd.org/sites/default/files/docs/shared-automated-vehicles-business-models.pdf)
• Top Misconceptions of Autonomous Cars and Self-Driving Vehicles, Alexander Hars, Inventivio, September 2016 (http://www.inventivio.com/innovationbriefs/2016-09/Top-misconceptions-of-self-driving-
Transit to Parks Strategic Plan - Case Studies 54
cars.pdf)• US Department of Transportation Designates 10 Automated Vehicle
Proving Grounds to Encourage Testing of New Technologies, USDOT, January 19, 2017 (https://www.transportation.gov/briefing-room/dot1717)
Park Access, Equity, Health• Every Kid in a Park, United States Government (https://www.
everykidinapark.gov/)• Healthy Parks, Schools and Communities: Mapping Green Access
and Equity for Southern California, The City Project (http://sustain.scag.ca.gov/Sustainability%20Portal%20Document%20Library/TheCityProjSouthern_California_Report_Final_Medium_Res.2.pdf)
• Healthy Parks, Healthy People, National Park Service (https://www.nps.gov/public_health/hp/hphp/press/HealthyParksHealthyPeople_eGuide-acc.pdf)
• The First National Study of Neighborhood Parks: Implications for Physical Activity, Cohen et al, American Journal of PReventive Medicine, 2016 (https://www.ncbi.nlm.nih.gov/pmc/articles/PMC5030121/)
Transit to Parks• Public Transportation to Local National Forests, University of
Southern California, April 15, 2004 (https://www.cityprojectca.org/pdf/uscgeogstudy.pdf)
Transportation/ Technology• A People’s History of Recent Urban Transportation Innovation, Transit
Center, 2016 (http://transitcenter.org/wp-content/uploads/2016/10/A-Peoples-History-of-Recent-Urban-Transportation-Innovation-Report-Pages.pdf)
• Beyond Traffic 2045 Final Report, US Department of Transportation, 2017 (https://www.transportation.gov/sites/dot.gov/files/docs/BeyondTraffic_tagged_508_final.pdf)
• Mobility on Demand, USDOT (https://www.its.dot.gov/factsheets/pdf/MobilityonDemand.pdf)
• Private Mobility, Public Interest, Transit Center, 2016 (http://transitcenter.org/wp-content/uploads/2016/10/TC-Private-Mobility-Public-Interest-20160909.pdf)
Safe Routes to Parks, Safe Routes to Play, Safe Park Zones• Creating Safe Park Zones for Communities in Illinois, Active
Transportation Alliance, January 2012 (http://atpolicy.org/wp-content/uploads/2016/05/Creating-a-Safe-Park-Zone-for-Communities-in-Illinois-Active-Transportation-Alliance_BGW.pdf)
OTHER STUDIES

Transit to Parks Strategic Plan - Case Studies 55
• Complete Parks Playbook, ChangeLab Solutions, 2015 (http://changelabsolutions.org/sites/default/files/Complete-Parks-Playbook_FINAL_20150706_0.pdf)
• Improving Health through Public Parks and Trails: Eight Common Measures, National Park Service and Center for Disease Prevention, 2017 (https://npgallery.nps.gov/RTCA/GetAsset/f09e69fc-2696-45e8-b4d5-90e4cea5e689)
• Safe Routes to Parks: Improving Access to Parks through Walkability, National Recreation and Park Association (https://www.nrpa.org/contentassets/f768428a39aa4035ae55b2aaff372617/park-access-report.pdf)
• Safe Routes to Parks: Action Framework, National Recreation and Park Association (https://www.nrpa.org/contentassets/64ee196b5bf241c6ac3462b8d42d1e66/safe-routes-action-framework.pdf)
• Safe Routes to Play: City of Lebanon, Upper Valley Lake Sunapee Regional Planning Commission (http://www.gpred.org/wp-content/uploads/2014/09/Lebanon-SRTP-CompleteFinal11182014.pdf)
• Safe Access to Recreational Opportunities Blueprint, Institute for Public Health Innovation (http://www.institutephi.org/wp-content/uploads/2015/01/SARO-Executive-Summary-Final.pdf)
• Sheridan Safe Routes to S, Institute for Public Health Innovation (http://www.institutephi.org/wp-content/uploads/2015/01/SARO-Executive-Summary-Final.pdf)

Transit to Parks Strategic Plan - Case Studies 56