Embed Size (px)
Citation preview

Marc LefebvreResources, Research, Evaluation and Development Division
June , 2013
Social Inequities in Health in the City of Greater Sudbury
Data Analysis Using a Deprivation Index

Health Equity Vision - 2020
• The Sudbury & District Health Unit will work to improve the overall health equity of area citizens so that:• Systemic and avoidable health disparities are
steadily reduced and the gap in health between the best and worst off is narrowed;
• All citizens have equal opportunities for good health and well-being; and
• All citizens have equitable access to a full range of high quality public health programs and services

10 Promising Local Public Health Practices to Reduce Social Inequities in Health
Lifestyle-focused public health actions Policy-focused public health actions
1. Targeting with Universalism
4. Social Marketing
5. Early Child Development
6. Purposeful Reporting
2. Intersectoral Action
3. Equity Focused Health Impact
Assessment
7. Competencies and
Organizational Standards
8. Contribution to Evidence Base
9. Community Engagement
10. Health Equity Target Setting
Sutcliffe, Laclé, Snelling, EXTRA Fellowship Final Project Report. 2010 Canadian Health Services Research Foundation, Executive Training for Research Application

Opportunity for All A path to health equityhttp://www.sdhu.com/uploads/content/listings/SIHReport_EN_FINAL_forweb.pdf

HealthData
1998-2010
2006 Census Population
INSPQ Deprivation
Index
DA
DA
DA
Ecological Analysis
Greater Sudbury Dissemination
Areas

Our Analysis
Who• Population of Greater Sudbury
What• Ecological Analysis using Deprivation Index (DI)
When• 2006 census of population• 1998- 2010 health behaviours, utilization, vital stats
Where• Small Area / Neighbourhood (2006 census)
Why• Purposeful reporting• Understanding of population health

*Deprivation Index developed by Institut national de santé publique du Québec (INSPQ)
*

INSPQ Deprivation Index*—2 Dimensions
Material Component• Education (% <high school)• Employment (# employed/population)• Income (mean personal income)
Social Component• Marital Status (% separated, divorced or
widowed)• Family Structure (% single parent families)• Persons living along (% single-person
households)*Deprivation Index developed by Institut national de santé publique du Québec (INSPQ)
Pampalon, R.M., Hamel, D., Gamache, P., & Raymond, G. (2009). A deprivation index for health planning in Canada. Chronic Diseases in Canada, 29, 178–191.

DI - Regrouping the Quintiles (CIHI)
SOCIAL COMPONENT
MATERIAL COMPONE
NT
Quintile 1 Quintile 2 Quintile 3 Quintile 4 Quintile 5
Quintile 1 LEAST DEPRIVED 1 2 2 2
Quintile 2 1 1 2 2 2
Quintile 3 2 2 Neutral 2 2
Quintile 4 2 2 2 3 3
Quintile 5 2 2 2 3 MOST DEPRIVED
Increased deprivation
Increased deprivation

Most Deprived AreasNeutral AreasLeast Deprived Areas
Rat
e p
er 1
00,0
00 p
op
ula
tio
n
Deprivation Index Category
Rate of ‘X’ per 100,000 Population, by Deprivation Index

Key Findings
Ten promising practices to reduce health inequities include Purposeful Reporting, of which this is one clear example because it:• Uncovers neighbourhood inequities rather than masking them within
an average value for the entire City of Greater Sudbury• Can be shared with community partners to raise awareness and
prompt action
Concretely confirms what we know intuitively about our city
We have tools such as equity-focused Health Impact Assessments that are supported by this information
• Identified most deprived areas in City of Greater Sudbury using Deprivation Index
• Areas of highest deprivation have poorer health outcomes
• Profiles allow us to shape policies, programs, and services to benefit those most in need
• If everyone in the City of Greater Sudbury had the same opportunities for health as those living in its least deprived areas, each year in the City there would be:• 14,077 fewer emergency department visits for all
causes• 131 fewer residents who die before age 75• 11,231 fewer people who are obese

ANALYSIS RESULTS

Walden
Valley East
Sudbury
Nickel Centre
Capreol
Rayside-Balfour
Onaping Falls
City of Greater Sudbury Deprivation Index
Deprivation Index by Dissemination Area
CGSCommunities
Census Tracts (Neighbourhoods)
Major Hwy
Lakes
Deprivation Index
Least Deprived
Neutral
Most Deprived
No Data
0 10 20 30
km
.Source: INSPQ 2011; Statistics Canada 2006 Census of Population

69
Elm
Lasalle
Par
is
Re
ge
nt
Froo
d No
tre
Da
me
Bar
rydo
wn
e
Hwy 17
City of Greater Sudbury (Core) Deprivation Index
Deprivation Index by Dissemination Area
Census Tracts (Neighbourhoods)
Major Roads
Lakes
Deprivation IndexLeast Deprived
Neutral
Most Deprived
No Data
0 2.5 5 7.5
km
.Source: INSPQ 2011; Statistics Canada 2006 Census of Population

INSPQ DEPRIVATION INDEX GREATER THAN THE SUM OF ITS PARTS
ANALYSIS RESULTS

% French Mother Tongue
08
1624
3240
Per
cent
(%
) of
the
Pop
ulat
ion
Least Deprived Most DeprivedDeprivation Index - 3 Categories
Source: INSPQ 2011; Statistics Canada 2006 Census of Population

% Aboriginal Identity
02
46
810
Per
cent
(%
) of
the
Pop
ulat
ion
Least Deprived Most DeprivedDeprivation Index - 3 Categories
Source: INSPQ 2011; Statistics Canada 2006 Census of Population

WORSE OUTCOMES IN MOST DEPRIVED AREAS WHERE DIFFERENCES ARE STATISTICALLY SIGNIFICANT
ANALYSIS RESULTS

Self-Rated Health(Excellent/Very Good)
Least Deprived Most Deprived
Excellent/Very Good Health 68.37516 62.32607 54.65572
5
15
25
35
45
55
65
75
Deprivation Index
Per
cen
t (%
) o
f th
e P
op
ula
tio
n 1
2+
Source: Ontario Share File, Canadian Community Health Survey 2005-10, Statistics Canada Age Standardized using the 1991 Canadian Population

Premature Mortality (Dying Before Age 75)
Least Deprived Most Deprived
Premature Mortality 193.1 266 359.5
25
75
125
175
225
275
325
375
Deprivation Index
Dea
ths
per
100
,000
P
op
ula
tio
n p
er Y
ear
Source: Vital Statistics Data (2003–2007), IntelliHEALTH Ontario, Ontario MOHLTC, Extracted July 2011; Geography Division, Statistics Canada, Postal Code Conversion File 2011 (PCCF); and 2006 Census, Statistics Canada. Age Standardized using the 1991 Canadian Population

Infant Mortality
Least Deprived Most Deprived
Infant Mortality 2.8 3.7 6.7
1
2
3
4
5
6
7
8
Deprivation Index
Cru
de
Rat
e p
er 1
,000
Liv
e B
irth
s
Source: Vital Statistics Data (1998–2007), IntelliHEALTH Ontario, Ontario MOHLTC, Extracted July 2011; Geography Division, Statistics Canada, Postal Code Conversion File 2011 (PCCF); and 2006 Census, Statistics Canada. Age Standardized using the 1991 Canadian Population

Maternal Age (% of Live Births to Teenage Mothers)
Least Deprived Most Deprived
Live Births Born to Teenage Mothers 2.1 2.9 6.4
1.0
3.0
5.0
7.0
9.0
Deprivation Index
Pe
rce
nt
of
Liv
e B
irth
s
Source: Vital Statistics Data (1998–2007), IntelliHEALTH Ontario, Ontario MOHLTC, Extracted July 2011; Geography Division, Statistics Canada, Postal Code Conversion File 2011 (PCCF); and 2006 Census, Statistics Canada. Age Standardized using the 1991 Canadian Population

Hospitalizations (All Causes)
Least Deprived Most Deprived
All-Cause Hospitalization 94.6 98 114.7
10
30
50
70
90
110
130
Deprivation Index
Dis
ch
arg
es
pe
r 1
,00
0
Po
pu
lati
on
pe
r Y
ea
r
Source: Inpatient Discharge Data (2005–2009), IntelliHEALTH Ontario, Ontario MOHLTC, Extracted July 2011; and 2006 Census, Statistics Canada Age Standardized using the 1991 Canadian Population
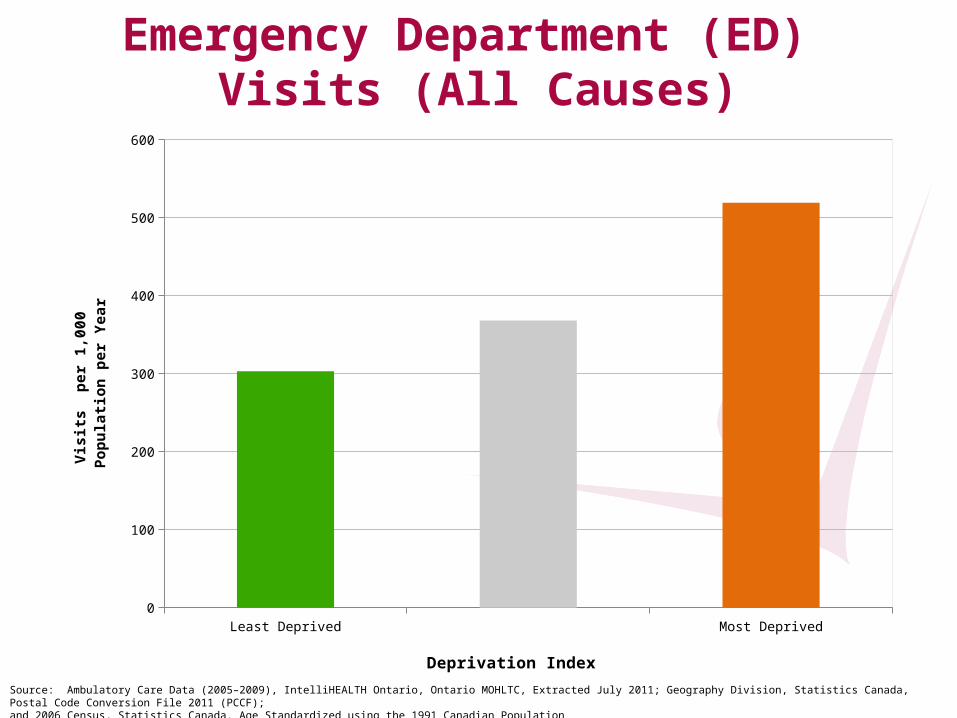
Emergency Department (ED) Visits (All Causes)
Least Deprived Most Deprived
All-Cause ED Visits 303.3 368.4 519.5
50
150
250
350
450
550
Deprivation Index
Vis
its
per
1,0
00
Po
pu
lati
on
per
Yea
r
Source: Ambulatory Care Data (2005–2009), IntelliHEALTH Ontario, Ontario MOHLTC, Extracted July 2011; Geography Division, Statistics Canada, Postal Code Conversion File 2011 (PCCF); and 2006 Census, Statistics Canada. Age Standardized using the 1991 Canadian Population

Mental Health EpisodesHospitalizations
Least Deprived Most Deprived
Hospitalizations Mental Health Episodes 164.9 256.4 639.1
50
150
250
350
450
550
650
750
Deprivation Index
SR
ate
per
10
0,00
0 P
op
ula
tio
n
Source: Inpatient Discharge Data (2005–2009), IntelliHEALTH Ontario, Ontario MOHLTC, Extracted July 2011; Geography Division, Statistics Canada, Postal Code Conversion File 2011 (PCCF); and 2006 Census, Statistics Canada. Age Standardized using the 1991 Canadian Population

Thank youMiigwech
Merci

This presentation was prepared by staff at the Sudbury & District Health Unit.
This resource may be reproduced, for educational purposes, on the condition that full credit is given to the Sudbury & District Health Unit.
This resource may not be reproduced or used for revenue generation purposes.
© Sudbury & District Health Unit, 2013


![[2010] Revisiting Lefebvre](https://img.pdfslide.us/doc/110x75/577d38561a28ab3a6b979d59/2010-revisiting-lefebvre.jpg)