Embed Size (px)
Citation preview
C H A P T E R 2 • R E P R E S E N TAT I O N S O F E A R T H38
The Global Positioning SystemThe Global Positioning System (GPS) is a modern technol-ogy for determining a location on Earth. This high-tech system was originally created for military applications but today is be-ing adapted to many public uses, from surveying to navigation. The global positioning system uses radio signals, transmitted by a network of satellites orbiting 17,700 kilometers (11,000 mi) above Earth ( ● Fig. 2.14). By accessing signals from several sat-ellites, a GPS receiver calculates the distances from those satel-lites to its location on Earth. GPS is based on the principle of triangulation, which means that if we can find the distance to our position, measured from three or more different locations (in this case, satellites), we can determine our location. GPS receivers vary in size, and handheld units are common ( ● Fig. 2.15). Small GPS receivers are very useful to travelers, hikers, and backpackers who need to keep track of their location. The distances from a receiver to the satellites are calculated by measuring the time it takes for a satellite radio signal, broadcast at the speed of light, to arrive at the receiver. A GPS receiver performs these calculations and displays a locational readout in latitude, longitude, and elevation, or on a map display. Map-based GPS systems—where GPS data is trans-lated to a map display—not only are becoming popular for hik-ers, but larger units are widely used in vehicles and also on boats and aircraft. With sophisticated GPS equipment and techniques, it is possible to find locational coordinates within small fractions of a meter ( ● Fig. 2.16).
Maps and Map ProjectionsMaps can be reproduced easily, can depict the entire Earth or show a small area in great detail, are easy to handle and transport, and can be displayed on a computer monitor. There are many
different varieties of maps, and they all have qualities that can be either advantageous or problematic, depending on the application. It is impossible for one map to fit all uses. Knowing some basic concepts concerning maps and car-tography will greatly enhance a person’s ability to effectively use a map, and to select the right map for a particular task.
Advantages of MapsIf a picture is worth a thousand words, then a map is worth a million. Because they are graphic representations and use symbolic language, maps show spatial relationships and portray geographic information with great efficiency. As visual rep-resentations, maps supply an enormous amount of information that would take many pages to describe in words (probably less successfully).
GPS satellites
Location
EARTH
● FIGURE 2.14The global positioning system (GPS) uses signals from a network of sat-ellites to determine a position on Earth. A GPS receiver on the ground calculates the distances from several satellites (a minimum of three) to find its location by longitude, latitude, and elevation. With the distance from three satellites, a position can be located within meters, but with more satellite signals and sophisticated GPS equipment, the position can be located very precisely.
● FIGURE 2.15A GPS receiver provides a readout of its latitudinal and longitudinal po-sition based on signals from a satellite network. Small handheld units provide an accuracy that is acceptable for many uses, and many can also display locations on a map. This receiver was mounted on a motorcycle for navigation on a trip to Alaska; the latitude shown is at the Arctic Circle.What other uses can you think of for a small GPS unit like this that displays its longitude and latitude as it moves from place to place?
© Te
d Ti
mm
ons
55061_02_Ch02_p028_063 pp3.indd 3855061_02_Ch02_p028_063 pp3.indd 38 6/10/08 11:23:42 AM6/10/08 11:23:42 AM
39
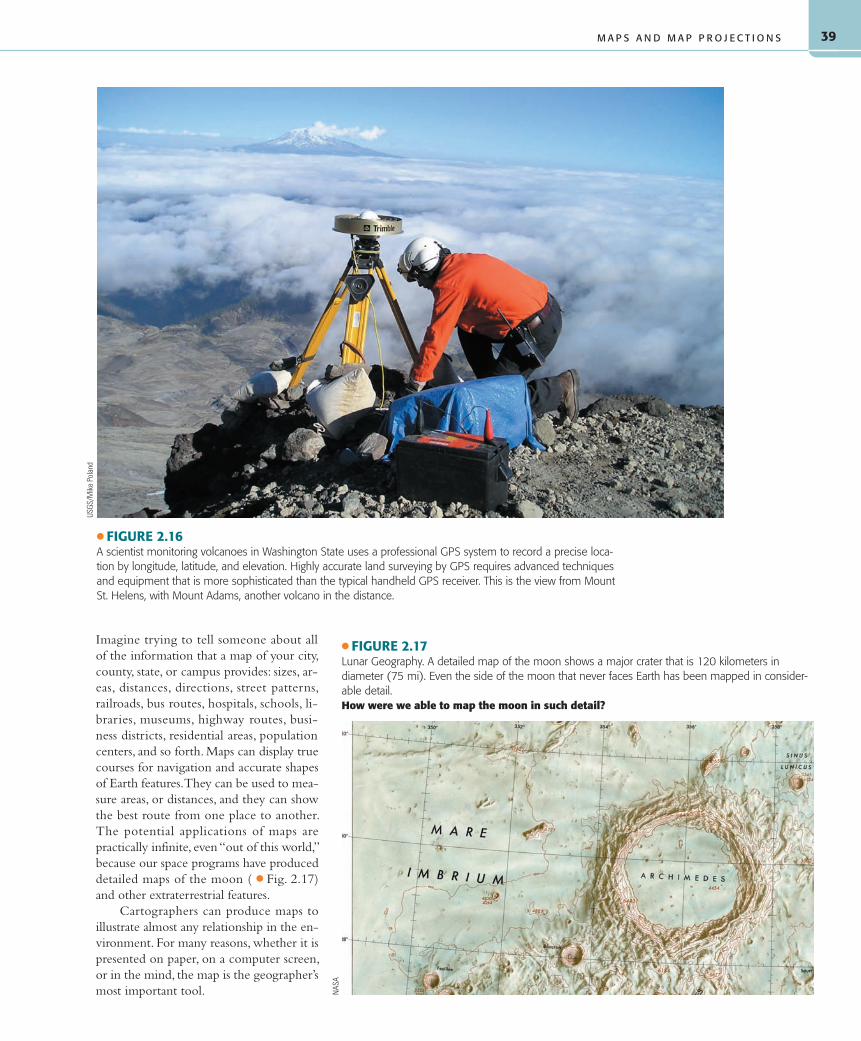
Imagine trying to tell someone about all of the information that a map of your city, county, state, or campus provides: sizes, ar-eas, distances, directions, street patterns, railroads, bus routes, hospitals, schools, li-braries, museums, highway routes, busi-ness districts, residential areas, population centers, and so forth. Maps can display true courses for navigation and accurate shapes of Earth features. They can be used to mea-sure areas, or distances, and they can show the best route from one place to another. The potential applications of maps are practically infinite, even “out of this world,” because our space programs have produced detailed maps of the moon ( ● Fig. 2.17) and other extraterrestrial features.
Cartographers can produce maps to illustrate almost any relationship in the en-vironment. For many reasons, whether it is presented on paper, on a computer screen, or in the mind, the map is the geographer’s most important tool.
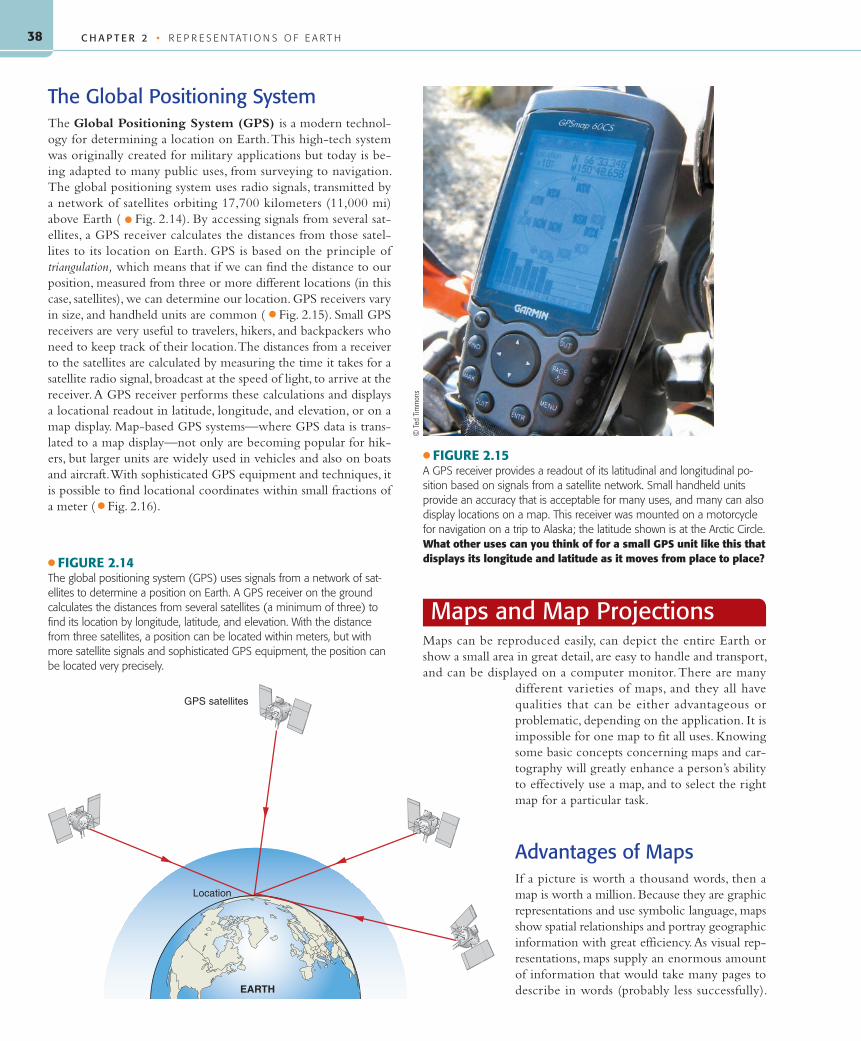
● FIGURE 2.16A scientist monitoring volcanoes in Washington State uses a professional GPS system to record a precise loca-tion by longitude, latitude, and elevation. Highly accurate land surveying by GPS requires advanced techniques and equipment that is more sophisticated than the typical handheld GPS receiver. This is the view from Mount St. Helens, with Mount Adams, another volcano in the distance.
USGS
/Mik
e Po
land
● FIGURE 2.17Lunar Geography. A detailed map of the moon shows a major crater that is 120 kilometers in diameter (75 mi). Even the side of the moon that never faces Earth has been mapped in consider-able detail.How were we able to map the moon in such detail?
NAS
A
M A P S A N D M A P P R O J E C T I O N S
55061_02_Ch02_p028_063 pp3.indd 3955061_02_Ch02_p028_063 pp3.indd 39 6/10/08 11:23:43 AM6/10/08 11:23:43 AM
C H A P T E R 2 • R E P R E S E N TAT I O N S O F E A R T H40
Limitations of MapsOn a globe, we can directly compare the size, shape, and area of Earth features, and we can measure distance, direction, shortest routes, and true directions. Yet, because of the distortion inherent in maps, we can never compare or measure all of these properties on a single map. It is impossible to present a spherical planet on a flat (two-dimensional) surface and accurately maintain all of its geometric properties. This process has been likened to trying to flatten out an eggshell.
Distortion is an unavoidable problem of representing a sphere on a flat map, but when a map depicts only a small area, the dis-tortion should be negligible. If we use a map of a state park for hiking, the distortion will be too small to affect us. On maps that show large regions or the world, Earth’s curvature causes appar-ent and pronounced distortion. To be skilled map users, we must know which properties a certain map depicts accurately, which features it distorts, and for what purpose a map is best suited. If we are aware of these map characteristics, we can make accurate comparisons and measurements on maps and better understand the information that the map conveys.
Properties of Map ProjectionsThe geographic grid has four important geometric properties: (1) Parallels of latitude are always parallel, (2) parallels are evenly spaced, (3) meridians of longitude converge at the poles, and (4) meridians and parallels always cross at right angles. There are thousands of ways to transfer a spherical grid onto a flat surface to make a map projection, but no map projection can maintain all four of these properties at once. Because it is impossible to have all these properties on the same map, cartographers must decide which properties to preserve at the expense of others. Closely examining a map’s grid system to determine how these four properties are affected will help us discover areas of greatest and least distortion.
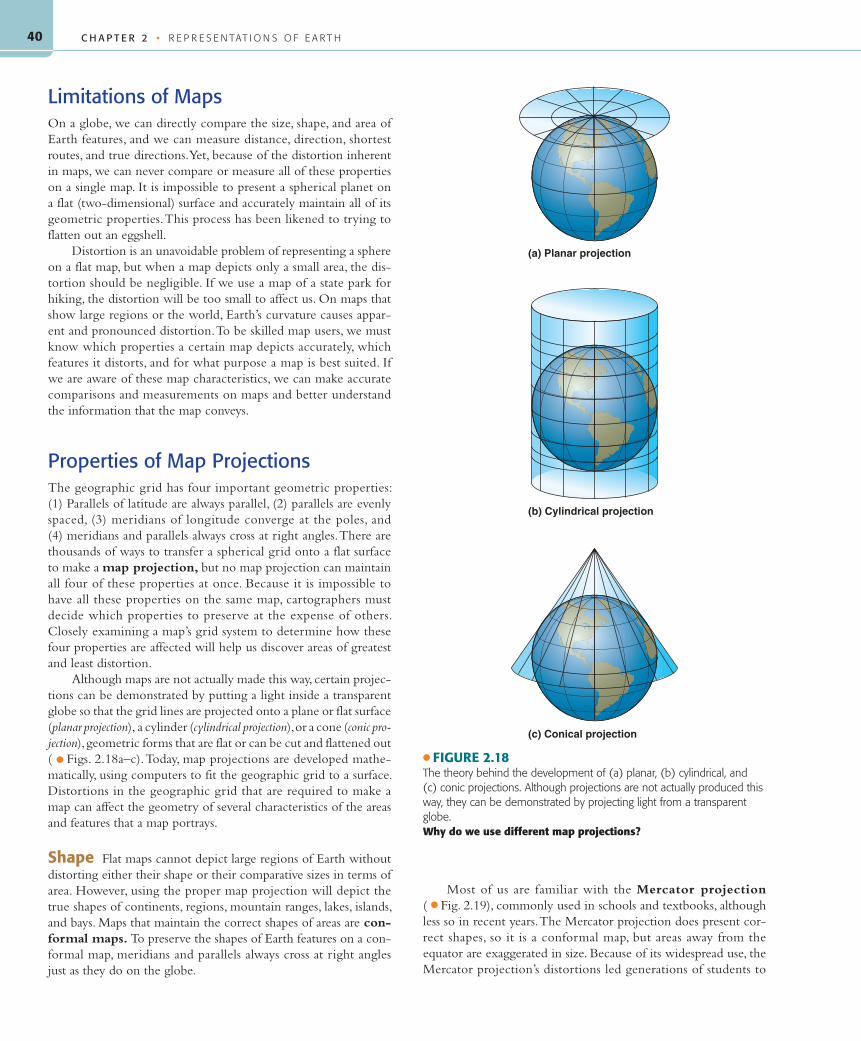
Although maps are not actually made this way, certain projec-tions can be demonstrated by putting a light inside a transparent globe so that the grid lines are projected onto a plane or flat surface (planar projection), a cylinder (cylindrical projection), or a cone (conic pro-jection), geometric forms that are flat or can be cut and flattened out ( ● Figs. 2.18a–c). Today, map projections are developed mathe-matically, using computers to fit the geographic grid to a surface. Distortions in the geographic grid that are required to make a map can affect the geometry of several characteristics of the areas and features that a map portrays.
Shape Flat maps cannot depict large regions of Earth without distorting either their shape or their comparative sizes in terms of area. However, using the proper map projection will depict the true shapes of continents, regions, mountain ranges, lakes, islands, and bays. Maps that maintain the correct shapes of areas are con-formal maps. To preserve the shapes of Earth features on a con-formal map, meridians and parallels always cross at right angles just as they do on the globe.
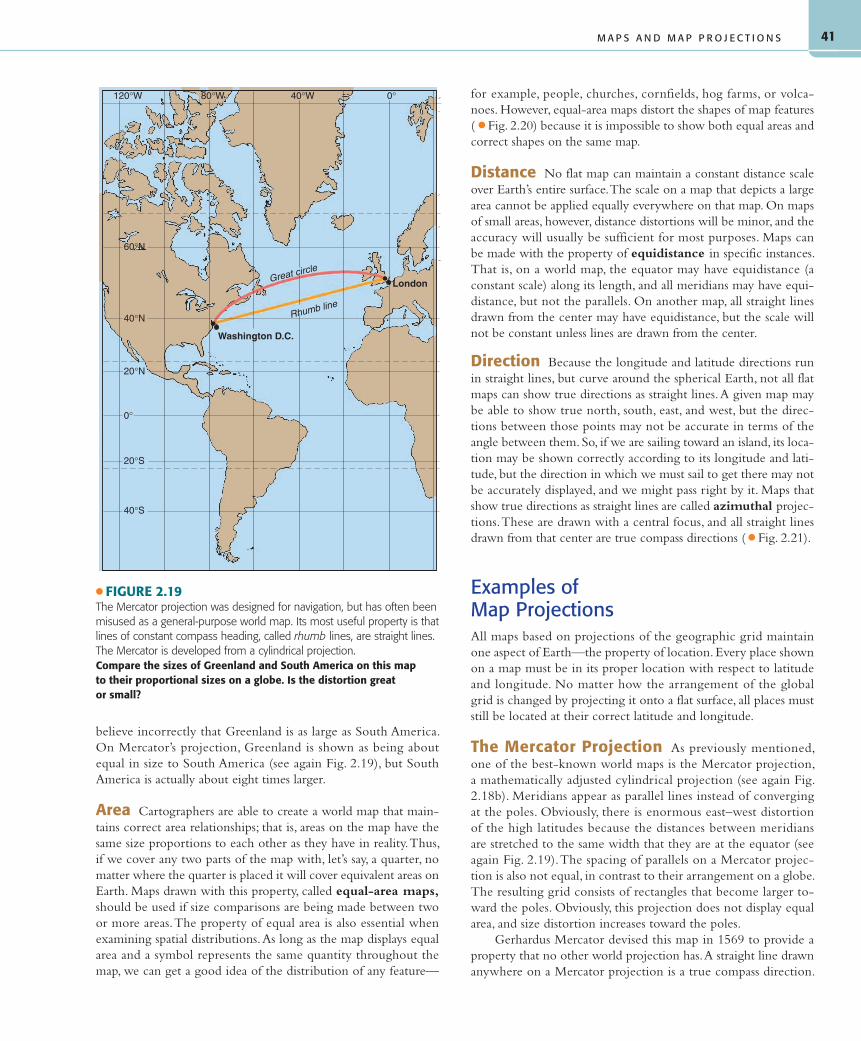
Most of us are familiar with the Mercator projection ( ● Fig. 2.19), commonly used in schools and textbooks, although less so in recent years. The Mercator projection does present cor-rect shapes, so it is a conformal map, but areas away from the equator are exaggerated in size. Because of its widespread use, the Mercator projection’s distortions led generations of students to
● FIGURE 2.18The theory behind the development of (a) planar, (b) cylindrical, and (c) conic projections. Although projections are not actually produced this way, they can be demonstrated by projecting light from a transparent globe.Why do we use different map projections?
(a) Planar projection
(b) Cylindrical projection
(c) Conical projection
55061_02_Ch02_p028_063 pp3.indd 4055061_02_Ch02_p028_063 pp3.indd 40 6/10/08 11:23:44 AM6/10/08 11:23:44 AM
41
believe incorrectly that Greenland is as large as South America. On Mercator’s projection, Greenland is shown as being about equal in size to South America (see again Fig. 2.19), but South America is actually about eight times larger.
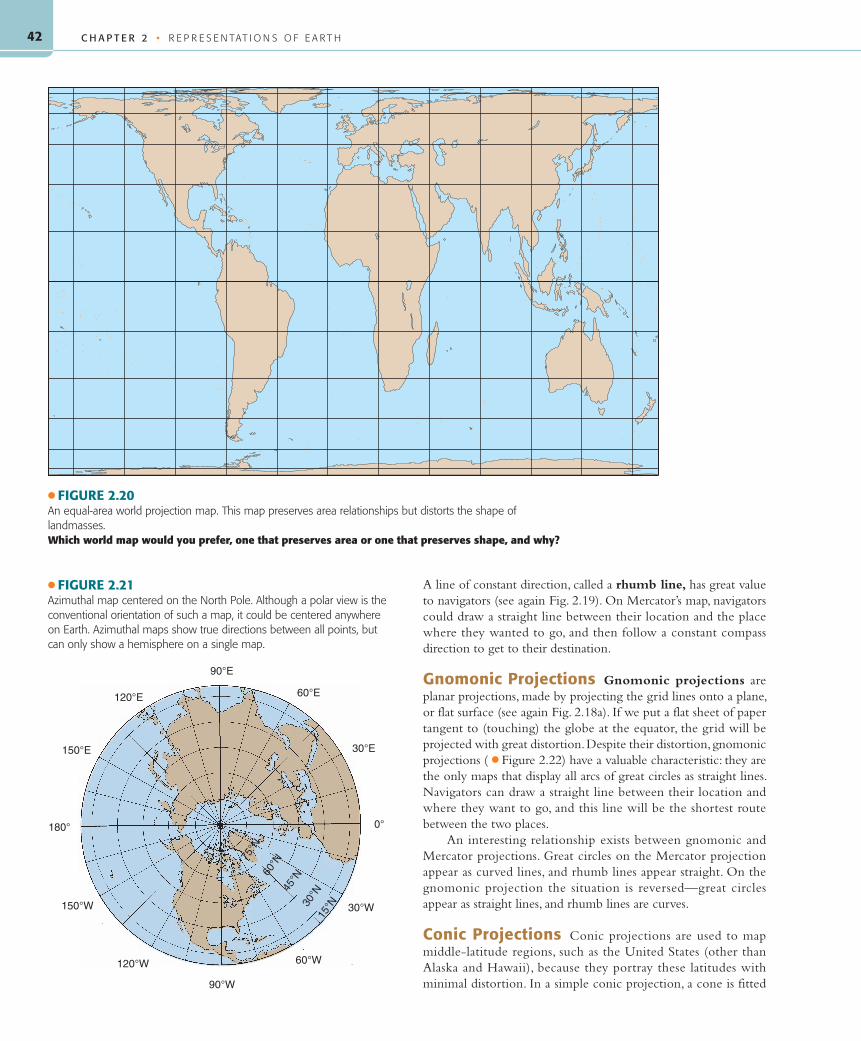
Area Cartographers are able to create a world map that main-tains correct area relationships; that is, areas on the map have the same size proportions to each other as they have in reality. Thus, if we cover any two parts of the map with, let’s say, a quarter, no matter where the quarter is placed it will cover equivalent areas on Earth. Maps drawn with this property, called equal-area maps, should be used if size comparisons are being made between two or more areas. The property of equal area is also essential when examining spatial distributions. As long as the map displays equal area and a symbol represents the same quantity throughout the map, we can get a good idea of the distribution of any feature—
for example, people, churches, cornfields, hog farms, or volca-noes. However, equal-area maps distort the shapes of map features ( ● Fig. 2.20) because it is impossible to show both equal areas and correct shapes on the same map.
Distance No flat map can maintain a constant distance scale over Earth’s entire surface. The scale on a map that depicts a large area cannot be applied equally everywhere on that map. On maps of small areas, however, distance distortions will be minor, and the accuracy will usually be sufficient for most purposes. Maps can be made with the property of equidistance in specific instances. That is, on a world map, the equator may have equidistance (a constant scale) along its length, and all meridians may have equi-distance, but not the parallels. On another map, all straight lines drawn from the center may have equidistance, but the scale will not be constant unless lines are drawn from the center.
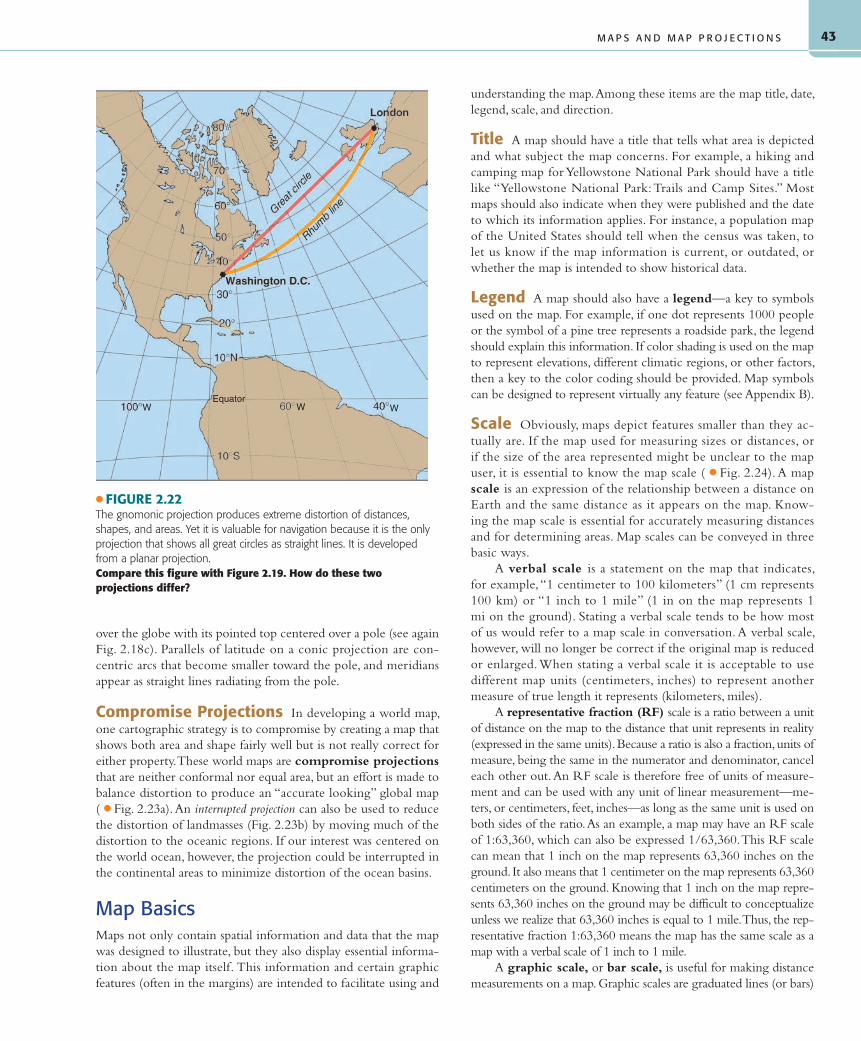
Direction Because the longitude and latitude directions run in straight lines, but curve around the spherical Earth, not all flat maps can show true directions as straight lines. A given map may be able to show true north, south, east, and west, but the direc-tions between those points may not be accurate in terms of the angle between them. So, if we are sailing toward an island, its loca-tion may be shown correctly according to its longitude and lati-tude, but the direction in which we must sail to get there may not be accurately displayed, and we might pass right by it. Maps that show true directions as straight lines are called azimuthal projec-tions. These are drawn with a central focus, and all straight lines drawn from that center are true compass directions ( ● Fig. 2.21).
Examples of Map ProjectionsAll maps based on projections of the geographic grid maintain one aspect of Earth—the property of location. Every place shown on a map must be in its proper location with respect to latitude and longitude. No matter how the arrangement of the global grid is changed by projecting it onto a flat surface, all places must still be located at their correct latitude and longitude.
The Mercator Projection As previously mentioned, one of the best-known world maps is the Mercator projection, a mathematically adjusted cylindrical projection (see again Fig. 2.18b). Meridians appear as parallel lines instead of converging at the poles. Obviously, there is enormous east–west distortion of the high latitudes because the distances between meridians are stretched to the same width that they are at the equator (see again Fig. 2.19). The spacing of parallels on a Mercator projec-tion is also not equal, in contrast to their arrangement on a globe. The resulting grid consists of rectangles that become larger to-ward the poles. Obviously, this projection does not display equal area, and size distortion increases toward the poles.
Gerhardus Mercator devised this map in 1569 to provide a property that no other world projection has. A straight line drawn anywhere on a Mercator projection is a true compass direction.
Great circle
Rhumb line
London
Washington D.C.
120°W
60°N
40°N
20°N
20°S
40°S
0°
80°W 40°W 0°
● FIGURE 2.19The Mercator projection was designed for navigation, but has often been misused as a general-purpose world map. Its most useful property is that lines of constant compass heading, called rhumb lines, are straight lines. The Mercator is developed from a cylindrical projection.Compare the sizes of Greenland and South America on this map to their proportional sizes on a globe. Is the distortion great or small?
M A P S A N D M A P P R O J E C T I O N S
55061_02_Ch02_p028_063 pp3.indd 4155061_02_Ch02_p028_063 pp3.indd 41 6/10/08 11:23:45 AM6/10/08 11:23:45 AM
C H A P T E R 2 • R E P R E S E N TAT I O N S O F E A R T H42
A line of constant direction, called a rhumb line, has great value to navigators (see again Fig. 2.19). On Mercator’s map, navigators could draw a straight line between their location and the place where they wanted to go, and then follow a constant compass direction to get to their destination.
Gnomonic Projections Gnomonic projections are planar projections, made by projecting the grid lines onto a plane, or flat surface (see again Fig. 2.18a). If we put a flat sheet of paper tangent to (touching) the globe at the equator, the grid will be projected with great distortion. Despite their distortion, gnomonic projections ( ● Figure 2.22) have a valuable characteristic: they are the only maps that display all arcs of great circles as straight lines. Navigators can draw a straight line between their location and where they want to go, and this line will be the shortest route between the two places.
An interesting relationship exists between gnomonic and Mercator projections. Great circles on the Mercator projection appear as curved lines, and rhumb lines appear straight. On the gnomonic projection the situation is reversed—great circles appear as straight lines, and rhumb lines are curves.
Conic Projections Conic projections are used to map middle-latitude regions, such as the United States (other than Alaska and Hawaii), because they portray these latitudes with minimal distortion. In a simple conic projection, a cone is fitted
● FIGURE 2.20An equal-area world projection map. This map preserves area relationships but distorts the shape of landmasses.Which world map would you prefer, one that preserves area or one that preserves shape, and why?
● FIGURE 2.21Azimuthal map centered on the North Pole. Although a polar view is the conventional orientation of such a map, it could be centered anywhere on Earth. Azimuthal maps show true directions between all points, but can only show a hemisphere on a single map.
90°E
90°W
120°E
120°W
150°E
150°W
60°E
60°N75
°N
45°N
30°N
15°N
60°W
30°E
30°W
180° 0°
55061_02_Ch02_p028_063 pp3.indd 4255061_02_Ch02_p028_063 pp3.indd 42 6/10/08 11:23:45 AM6/10/08 11:23:45 AM
43
over the globe with its pointed top centered over a pole (see again Fig. 2.18c). Parallels of latitude on a conic projection are con-centric arcs that become smaller toward the pole, and meridians appear as straight lines radiating from the pole.
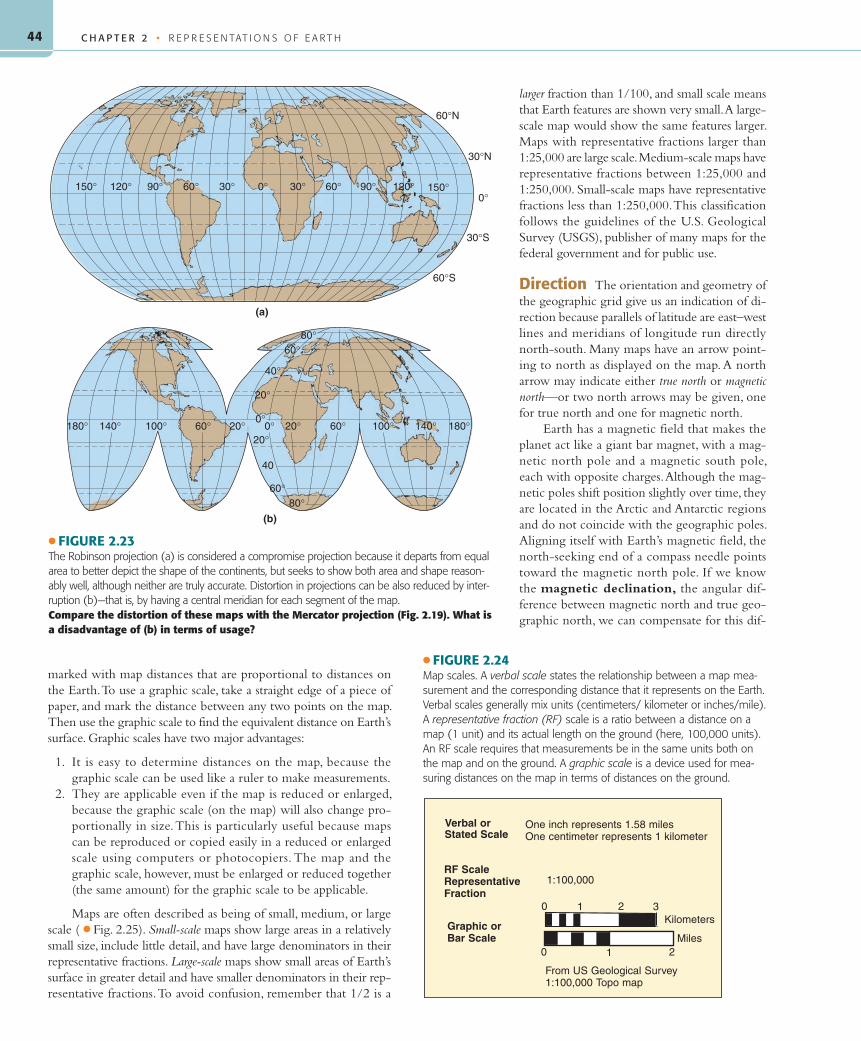
Compromise Projections In developing a world map, one cartographic strategy is to compromise by creating a map that shows both area and shape fairly well but is not really correct for either property. These world maps are compromise projections that are neither conformal nor equal area, but an effort is made to balance distortion to produce an “accurate looking” global map ( ● Fig. 2.23a). An interrupted projection can also be used to reduce the distortion of landmasses (Fig. 2.23b) by moving much of the distortion to the oceanic regions. If our interest was centered on the world ocean, however, the projection could be interrupted in the continental areas to minimize distortion of the ocean basins.
Map BasicsMaps not only contain spatial information and data that the map was designed to illustrate, but they also display essential informa-tion about the map itself. This information and certain graphic features (often in the margins) are intended to facilitate using and
understanding the map. Among these items are the map title, date, legend, scale, and direction.
Title A map should have a title that tells what area is depicted and what subject the map concerns. For example, a hiking and camping map for Yellowstone National Park should have a title like “Yellowstone National Park: Trails and Camp Sites.” Most maps should also indicate when they were published and the date to which its information applies. For instance, a population map of the United States should tell when the census was taken, to let us know if the map information is current, or outdated, or whether the map is intended to show historical data.
Legend A map should also have a legend—a key to symbols used on the map. For example, if one dot represents 1000 people or the symbol of a pine tree represents a roadside park, the legend should explain this information. If color shading is used on the map to represent elevations, different climatic regions, or other factors, then a key to the color coding should be provided. Map symbols can be designed to represent virtually any feature (see Appendix B).
Scale Obviously, maps depict features smaller than they ac-tually are. If the map used for measuring sizes or distances, or if the size of the area represented might be unclear to the map user, it is essential to know the map scale ( ● Fig. 2.24). A map scale is an expression of the relationship between a distance on Earth and the same distance as it appears on the map. Know-ing the map scale is essential for accurately measuring distances and for determining areas. Map scales can be conveyed in three basic ways.
A verbal scale is a statement on the map that indicates, for example, “1 centimeter to 100 kilometers” (1 cm represents 100 km) or “1 inch to 1 mile” (1 in on the map represents 1 mi on the ground). Stating a verbal scale tends to be how most of us would refer to a map scale in conversation. A verbal scale, however, will no longer be correct if the original map is reduced or enlarged. When stating a verbal scale it is acceptable to use different map units (centimeters, inches) to represent another measure of true length it represents (kilometers, miles).
A representative fraction (RF) scale is a ratio between a unit of distance on the map to the distance that unit represents in reality (expressed in the same units). Because a ratio is also a fraction, units of measure, being the same in the numerator and denominator, cancel each other out. An RF scale is therefore free of units of measure-ment and can be used with any unit of linear measurement—me-ters, or centimeters, feet, inches—as long as the same unit is used on both sides of the ratio. As an example, a map may have an RF scale of 1:63,360, which can also be expressed 1/63,360. This RF scale can mean that 1 inch on the map represents 63,360 inches on the ground. It also means that 1 centimeter on the map represents 63,360 centimeters on the ground. Knowing that 1 inch on the map repre-sents 63,360 inches on the ground may be difficult to conceptualize unless we realize that 63,360 inches is equal to 1 mile. Thus, the rep-resentative fraction 1:63,360 means the map has the same scale as a map with a verbal scale of 1 inch to 1 mile.
A graphic scale, or bar scale, is useful for making distance measurements on a map. Graphic scales are graduated lines (or bars)
WEquator
W W
● FIGURE 2.22The gnomonic projection produces extreme distortion of distances, shapes, and areas. Yet it is valuable for navigation because it is the only projection that shows all great circles as straight lines. It is developed from a planar projection.Compare this figure with Figure 2.19. How do these two projections differ?
M A P S A N D M A P P R O J E C T I O N S
55061_02_Ch02_p028_063 pp3.indd 4355061_02_Ch02_p028_063 pp3.indd 43 6/10/08 11:23:45 AM6/10/08 11:23:45 AM
C H A P T E R 2 • R E P R E S E N TAT I O N S O F E A R T H44
marked with map distances that are proportional to distances on the Earth. To use a graphic scale, take a straight edge of a piece of paper, and mark the distance between any two points on the map. Then use the graphic scale to find the equivalent distance on Earth’s surface. Graphic scales have two major advantages:
1. It is easy to determine distances on the map, because the graphic scale can be used like a ruler to make measurements.
2. They are applicable even if the map is reduced or enlarged, because the graphic scale (on the map) will also change pro-portionally in size. This is particularly useful because maps can be reproduced or copied easily in a reduced or enlarged scale using computers or photocopiers. The map and the graphic scale, however, must be enlarged or reduced together (the same amount) for the graphic scale to be applicable.
Maps are often described as being of small, medium, or large scale ( ● Fig. 2.25). Small-scale maps show large areas in a relatively small size, include little detail, and have large denominators in their representative fractions. Large-scale maps show small areas of Earth’s surface in greater detail and have smaller denominators in their rep-resentative fractions. To avoid confusion, remember that 1/2 is a
larger fraction than 1/100, and small scale means that Earth features are shown very small. A large-scale map would show the same features larger. Maps with representative fractions larger than 1:25,000 are large scale. Medium-scale maps have representative fractions between 1:25,000 and 1:250,000. Small-scale maps have representative fractions less than 1:250,000. This classification follows the guidelines of the U.S. Geological Survey (USGS), publisher of many maps for the federal government and for public use.
Direction The orientation and geometry of the geographic grid give us an indication of di-rection because parallels of latitude are east–west lines and meridians of longitude run directly north-south. Many maps have an arrow point-ing to north as displayed on the map. A north arrow may indicate either true north or magnetic north—or two north arrows may be given, one for true north and one for magnetic north.
Earth has a magnetic field that makes the planet act like a giant bar magnet, with a mag-netic north pole and a magnetic south pole, each with opposite charges. Although the mag-netic poles shift position slightly over time, they are located in the Arctic and Antarctic regions and do not coincide with the geographic poles. Aligning itself with Earth’s magnetic field, the north-seeking end of a compass needle points toward the magnetic north pole. If we know the magnetic declination, the angular dif-ference between magnetic north and true geo-graphic north, we can compensate for this dif-
80°60°
40°
20°
0°0° 20°20° 60° 100° 140°60°100°140°180° 180°
20°
40
60°80°
60°N
60°S
30°N
30°S
0°150°90°60°30°0°30°60°90°120° 120°150°
(a)
(b)
● FIGURE 2.23The Robinson projection (a) is considered a compromise projection because it departs from equal area to better depict the shape of the continents, but seeks to show both area and shape reason-ably well, although neither are truly accurate. Distortion in projections can be also reduced by inter-ruption (b)—that is, by having a central meridian for each segment of the map.Compare the distortion of these maps with the Mercator projection (Fig. 2.19). What is a disadvantage of (b) in terms of usage?
● FIGURE 2.24Map scales. A verbal scale states the relationship between a map mea-surement and the corresponding distance that it represents on the Earth. Verbal scales generally mix units (centimeters/ kilometer or inches/mile). A representative fraction (RF) scale is a ratio between a distance on a map (1 unit) and its actual length on the ground (here, 100,000 units). An RF scale requires that measurements be in the same units both on the map and on the ground. A graphic scale is a device used for mea-suring distances on the map in terms of distances on the ground.
RF ScaleRepresentativeFraction
Graphic orBar Scale
Stated Scale
From US Geological Survey1:100,000 Topo map
One inch represents 1.58 milesOne centimeter represents 1 kilometer
0 1 2 3Kilometers
Miles0 1 2
Verbal or
1:100,000
55061_02_Ch02_p028_063 pp3.indd 4455061_02_Ch02_p028_063 pp3.indd 44 6/10/08 11:23:46 AM6/10/08 11:23:46 AM
45
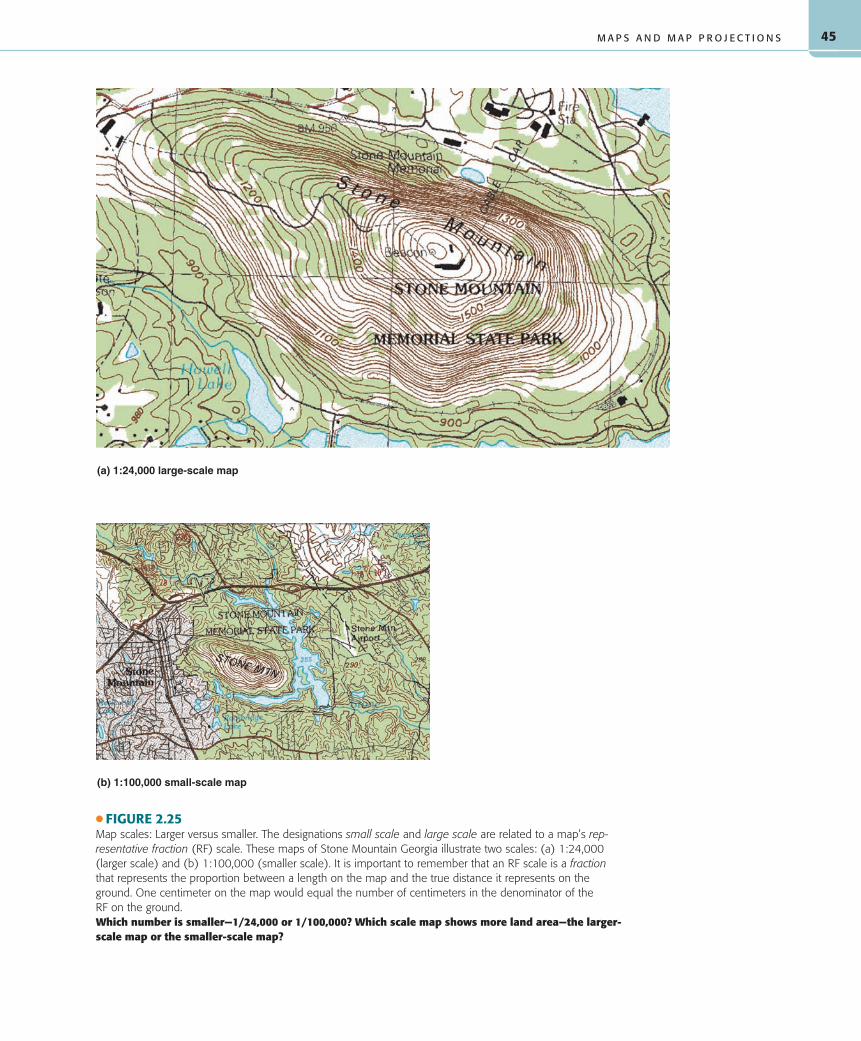
● FIGURE 2.25Map scales: Larger versus smaller. The designations small scale and large scale are related to a map’s rep-resentative fraction (RF) scale. These maps of Stone Mountain Georgia illustrate two scales: (a) 1:24,000 (larger scale) and (b) 1:100,000 (smaller scale). It is important to remember that an RF scale is a fraction that represents the proportion between a length on the map and the true distance it represents on the ground. One centimeter on the map would equal the number of centimeters in the denominator of the RF on the ground.Which number is smaller—1/24,000 or 1/100,000? Which scale map shows more land area—the larger-scale map or the smaller-scale map?
M A P S A N D M A P P R O J E C T I O N S
(a) 1:24,000 large-scale map
(b) 1:100,000 small-scale map
55061_02_Ch02_p028_063 pp3.indd 4555061_02_Ch02_p028_063 pp3.indd 45 6/10/08 11:23:46 AM6/10/08 11:23:46 AM
C H A P T E R 2 • R E P R E S E N TAT I O N S O F E A R T H46
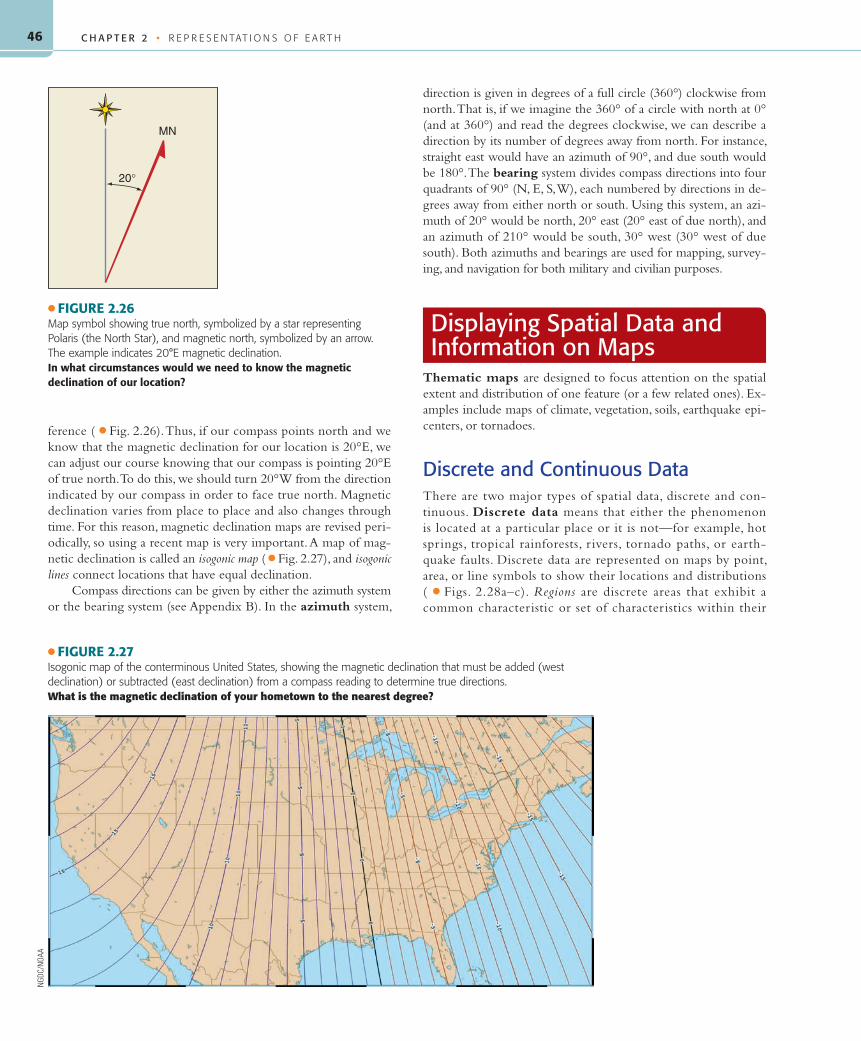
ference ( ● Fig. 2.26). Thus, if our compass points north and we know that the magnetic declination for our location is 20°E, we can adjust our course knowing that our compass is pointing 20°E of true north. To do this, we should turn 20°W from the direction indicated by our compass in order to face true north. Magnetic declination varies from place to place and also changes through time. For this reason, magnetic declination maps are revised peri-odically, so using a recent map is very important. A map of mag-netic declination is called an isogonic map ( ● Fig. 2.27), and isogonic lines connect locations that have equal declination.
Compass directions can be given by either the azimuth system or the bearing system (see Appendix B). In the azimuth system,
direction is given in degrees of a full circle (360°) clockwise from north. That is, if we imagine the 360° of a circle with north at 0° (and at 360°) and read the degrees clockwise, we can describe a direction by its number of degrees away from north. For instance, straight east would have an azimuth of 90°, and due south would be 180°. The bearing system divides compass directions into four quadrants of 90° (N, E, S, W), each numbered by directions in de-grees away from either north or south. Using this system, an azi-muth of 20° would be north, 20° east (20° east of due north), and an azimuth of 210° would be south, 30° west (30° west of due south). Both azimuths and bearings are used for mapping, survey-ing, and navigation for both military and civilian purposes.
Displaying Spatial Data and Information on Maps
Thematic maps are designed to focus attention on the spatial extent and distribution of one feature (or a few related ones). Ex-amples include maps of climate, vegetation, soils, earthquake epi-centers, or tornadoes.
Discrete and Continuous DataThere are two major types of spatial data, discrete and con-tinuous. Discrete data means that either the phenomenon is located at a particular place or it is not—for example, hot springs, tropical rainforests, r ivers, tornado paths, or earth-quake faults. Discrete data are represented on maps by point, area, or line symbols to show their locations and distributions ( ● Figs. 2.28a–c). Regions are discrete areas that exhibit a common characteristic or set of characteristics within their
MN
20°
● FIGURE 2.26Map symbol showing true north, symbolized by a star representing Polaris (the North Star), and magnetic north, symbolized by an arrow. The example indicates 20°E magnetic declination.In what circumstances would we need to know the magnetic declination of our location?
● FIGURE 2.27Isogonic map of the conterminous United States, showing the magnetic declination that must be added (west declination) or subtracted (east declination) from a compass reading to determine true directions.What is the magnetic declination of your hometown to the nearest degree?
NGD
C/N
OAA
55061_02_Ch02_p028_063 pp3.indd 4655061_02_Ch02_p028_063 pp3.indd 46 6/10/08 11:23:47 AM6/10/08 11:23:47 AM