Embed Size (px)
Citation preview
Stuart Corbridge and Manoj Srivastava
Mapping the social order by fund flows: the political geography of employment assurance schemes in India Article (Published version) (Refereed)
Original citation: Corbridge, Stuart and Srivastava, Manoj (2013) Mapping the social order by fund flows: the political geography of employment assurance schemes in India. Economy and Society, 42 (3). pp. 455-479. ISSN 1469-5766
DOI: 10.1080/03085147.2013.772758 © 2013 Taylor & Francis This version available at: http://eprints.lse.ac.uk/45829/ Available in LSE Research Online: August 2014 LSE has developed LSE Research Online so that users may access research output of the School. Copyright © and Moral Rights for the papers on this site are retained by the individual authors and/or other copyright owners. Users may download and/or print one copy of any article(s) in LSE Research Online to facilitate their private study or for non-commercial research. You may not engage in further distribution of the material or use it for any profit-making activities or any commercial gain. You may freely distribute the URL (http://eprints.lse.ac.uk) of the LSE Research Online website.
Mapping the social orderby fund flows: the politicalgeography of employmentassurance schemes in India
Stuart Corbridge and Manoj Srivastava
Abstract
Economic growth in India has failed to reduce extreme income poverty or providedecent jobs as effectively as growth has done in East Asia. Mindful of a political threatfrom the labouring poor, successive governments have offered India’s ‘surpluspopulations’ guaranteed work, first through the Employment Assurance Scheme(EAS) and more recently under the National Rural Employment Guarantee Act(NREGA). This paper uses ethnographic and large-n datasets to examine how the EASworked in Bihar and Madhya Pradesh; it also utilizes a preliminary dataset for NREGAin Madhya Pradesh. We show that understandings of the EAS were poor amongintended beneficiaries in both states. We also show that the EAS did not work better forthe rural poor in Madhya Pradesh than in Bihar, notwithstanding the existence offunctioning panchayati Raj institutions in the former. Importantly, this calls intoquestion aspects of a conventional decentralization agenda. Most significantly, thepaper suggests that geographies of EAS fund flows illuminate the nature and workingsof the local state. Distribution of EAS funds within districts and blocks is most unevenwhere allocative power is effectively monopolized by a regional political boss and/or isunchallenged by bureaucratic oversight mechanisms. We discuss how far the sameproblems might affect NREGA schemes notwithstanding the more effectiveinformation flows and accountability mechanisms that surround them.
Keywords: EAS; NREGA; mapping power; fund flows; labour.
Stuart Corbridge, Department of International Development (ID), London School of
Economics and Political Science, Houghton Street, London WC2A 2AE, UK. E-mail:
Manoj Srivastava, Chief Secretary, Government of Bihar, Patna 800 001, Bihar, India.
E-mail: [email protected]
Economy and Society Volume 42 Number 3 August 2013: 455�479http://dx.doi.org/10.1080/03085147.2013.772758
# 2013 The Author(s). Published by Taylor & Francis.
This is an Open Access article distributed under the terms of the Creative Commons
Attribution License (http://creativecommons.org/licenses/by/3.0), which permits
unrestricted use, distribution, and reproduction in any medium, provided the original
work is properly cited. The moral rights of the named author(s) have been asserted.
Introduction
[T]here is a pattern, clearest in India, in which successful poverty-reducing
agencies decline and are replaced by new successes, which then decline in
turn. . . .Most of these big programmes started well. However, each gradually
succumbs to rent-seeking by non-poor clients or administrators, or to rivalry
from line ministries. Some programmes live on in attenuated form, but
usually they are replaced by new schemes, also initially successful. New
schemes attract public scrutiny; old schemes accumulate clients.
(Lipton, 1996, p. 2)
The Indian economy has grown every year since 1980�1 and annual per capita
income growth in this period has on average been three times as high as it was
in the 1970s. Significantly, however, while economic growth in India in the
1970s delivered the highest returns to rural labour, post-1980 growth has
favoured the urban well to do. Petia Topolova estimates that between 1983 and
1993�4, ‘Distribution neutral growth would have generated a poverty decline
in rural India that was 22 percent higher; in urban areas, the decline in poverty
would have been 76 percent higher’ (2008, p. 8). India’s social structures of
accumulation make it difficult for poor women and men � not least Muslims,
Scheduled Castes (SCs) and Scheduled Tribes (STs) � to access secure
employment opportunities, especially when employment-generation rates have
been much lower than expected (Corbridge et al., 2013; Harriss-White, 2003).
Lacking in human capital and immoveable assets, nearly 80 per cent of Indians
continue to get by on less than $2 a day.
Mindful that India’s dangerous (or ‘surplus’) classes need to be kept at bay
(see Chatterjee, 2008; Li, 2010), and ever keen to signal the fact that economic
reform has been coupled to significant attempts at subaltern self-improvement,
successive governments in India have sought since 1993 to provide the
country’s Below Poverty Line (BPL) households with assured employment in
weak labour markets. When the Congress-led United Democratic Alliance
(UDA) government removed a Bharatiya Janata Party (BJP)-led coalition
government from power in New Delhi in 2004 a lot was made of a supposed
rural backlash against the urban strongholds of ‘Shining India’. The UDA
government promptly signalled its commitment to the neglected rural majority
by introducing its flagship anti-poverty initiative: the National Rural Employ-
ment Guarantee Act of 2005.1
For the very first time, it was argued, at least on a national basis (there were
antecedents in the Maharashtra Employment Guarantee Scheme of the 1970s
and 1980s), the Government of India sought to guarantee in law the right to
work. The architects of NREGA made determined efforts to ensure that
NREGA schemes did not suffer from the same high fund leakage rates that
affected earlier employment assurance schemes. Since 2006, the payment of
wages to NREGA workers has supposedly been through bank accounts and
post offices (although this has not always happened in practice) and linked to
456 Economy and Society
the prior issuance of job cards (Roy & Dey, 2009). Stealing from workers’
wages has also been made difficult where social audits of NREGA funds have
been effectively implemented by village mass meetings (gram sabhas).
Importantly, too, workers have greater opportunities under NREGA than
previous schemes to find out whether they are being cheated and by roughly
how much. Unusually, the Government of India has endorsed the setting up of
a scheme that can be expected to produce discontent among cheated workers.
It did so in the belief that civil society actions from below are important in
making government more responsive to the needs of poorer citizens.2
In short, there are good reasons to assume that NREGA has built into it
important transparency and accountability mechanisms that were not available
to the Employment Assurance Scheme, in key respects its major antecedent
and from the mid-1990s to the mid-2000s the largest anti-poverty scheme in
rural India. The current Congress government has also invested in the scheme
politically, in the pursuit of increased rural votes. But there are also substantial
similarities between EAS and NREGA, and these should not be overlooked
when intuitions are being advanced about the likely success or failure of the
latter. Like NREGA, the EAS offered up to 100 days of paid labour to two
adult householders presenting a demand for work to their elected local
government officials (sarpanchs, pradhans, mukhiyas). The government’s
assurance of work functioned as a de facto employment guarantee, albeit there
was no governing statute prior to NREGA. It also proposed that schemes built
with EAS labour should be chosen by villagers themselves in open public
meetings (gram sabhas), subject to sign off from higher authority. The EAS was
the very model of a demand-driven development scheme and it took shape
within a restructured system of democratic local government post-1993: what
in India is called panchayati Raj.3 Particularly in the centre and east of the
country, where long-standing under-investment in state capacity has left
schools without teachers and clinics without doctors, poor men and women
were offered an assurance of off-season employment as the principal means of
protecting them against extreme income poverty � and, possibly, against the
temptations of organized left-wing politics.
It is too soon yet to assess the long-run effectiveness of NREGA. Solid
academic studies of the scheme remain thin on the ground, although they are
accumulating rapidly (see especially Banerjee & Saha, 2010; Dreze, 2010; Joshi,
2010; Khera, 2011; see also the interesting reports in The Hindu by Vidhya
Subrahmaniam (2009a, 2009b) on corruption in NREGA schemes in
Rajasthan). Given the strong similarities between NREGA and the EAS,
however, and being mindful of Michael Lipton’s commentary on ‘scheme
clientelism’, we believe that a lot can still be learned about employment
guarantees from studies of the EAS in central and eastern India in the 1990s and
early 2000s. Accordingly, this paper considers the politics of employment
assurance in two of India’s poorest states: Bihar in 1999�2000, at a time when
panchayati Raj institutions (PRIs) had not been re-activated in the state (local
government functions instead were discharged by public officials), and Madhya
Stuart Corbridge and Manoj Srivastava: The social order by fund flows 457
Pradesh (MP), a state where, under the leadership of Chief Minister Digviyay
Singh (1993�2003), democratic localism was put on a pedestal in this same
period and offered up to the rest of India as a successful example of participatory
self-governance. The paper utilizes large official datasets and ethnographic
fieldwork in two different political settings to examine how the Employment
Assurance Scheme (EAS) worked in practice and to test whether democratic
self-governance led to improved pro-poor outcomes. It also presents some
preliminary findings on NREGA in MP in 2009. Most significantly, the paper
follows the money. It proposes that the local state � and state-society
interactions � in central and eastern India can usefully be understood through
a political geography of scheme fund flows.
The rest of the paper is organized as follows. The second section reviews our
fieldwork, major datasets and working assumptions. The third section outlines
the main provisions of the EAS and follows the reported flow of funds from
New Delhi and Patna/Bhopal to our field sites. The fourth section reports on
the workings and local understandings of the EAS in our field localities. We
note that the main provisions of the EAS were poorly understood in both Bihar
and MP, notwithstanding clear differences in political regime types. We also
show how EAS schemes were diverted from employment provision to
expensive road-building projects (not all of which were disapproved of by
local people). In the fifth section we show how EAS performance levels
reflected differences in political competition and bureaucratic oversight far
more than the presence or absence of PRIs. In the two field sites dominated by
high-level political bosses (Rewa District in MP and Vaishali in Bihar), levels of
social and spatial exclusion from EAS schemes were far greater than in tribal
districts where bureaucrats were less intimidated by political oligarchs (Mandla
in MP and Ranchi in Bihar-Jharkhand). We provide detailed figures on EAS
spending across different blocks and panchayats within these districts to
demonstrate the connections between political regime types and the workings
of India’s pre-eminent anti-poverty scheme in the 1990s and early 2000s. We
also suggest that an apparently more equitable distribution of NREGA funds in
Rewa in 2009 may be as much a consequence of a change in the local political
order as it is a result of improved accountability mechanisms (although we
accept this finding must remain provisional). Finally, in the sixth section, we
suggest that maps of EAS spending in Bihar and MP serve as accurate pointers
both to geographies of local power and to the intensity of local political
competition. We also consider whether and how pro-poor outcomes can be
better engineered by NREGA schemes that might contest the classic logics of
scheme clientelism or imperfect political markets.
Fieldwork, data and methods
Research on the EAS in Bihar was carried out in 1999�2001 as part of a larger
project that sought to understand how poor people see and engage the state in
458 Economy and Society
eastern India. Four modes of governance were studied: development (proxied
by the EAS), empowerment (primary education), social protection (resort to
law or other conflict resolution mechanisms) and disciplinary (police, forest
guards, Border Security personnel, etc.). Multi-scalar fieldwork was conducted
in three districts/blocks/panchayats, each of which was chosen to exemplify a
different political regime type. In Bidupur Block, Vaishali District, north
Bihar, political competition was confined within a general framework of
dominance by members of the Yadav community. The Yadavs are an officially
designated Other Backward Caste (OBC) that at the time supplied the main
political leader of Bihar, Lalu Prasad Yadav (notwithstanding that his wife,
Rabri Devi, was nominally the Chief Minister of the State), and the de facto
political boss of Bidupur Block, Bhola Babu, a local member of the Legislative
Council. Sahar Block in Bhojpur District, then in central Bihar, was chosen for
its long-standing history of counter-state actions by organized labour and some
parts of the peasantry. It remains a hotbed of Maoism. Finally, Murhu Block in
Ranchi District, then in south Bihar (post-15 November 2000, part of the new
State of Jharkhand), is an area where locally dominant adivasi (tribal)
populations have sought to keep the state at bay (Shah, 2010). Levels of
social stratification are lower than in central and northern Bihar and gender
relations more symmetrical. At the time of fieldwork PRIs had not been
activated in Bihar, notwithstanding the provisions of the 1993 legislation. Anti-
poverty schemes such as the EAS, which are 80 per cent funded by New Delhi,
had to be operated by local government officials, especially panchayat sewaks
and block development officers (BDOs). They effectively played the part of
elected representatives.4
The main results of the Bihar EAS studies have already been published
(Corbridge et al., 2005), along with a detailed account of our field methods
(Corbridge et al., 2003). Work was carried out over a fourteen-month period,
including by field assistants who lived in villages in each of the research
blocks/districts. The panchayat field sites were also visited by the authors, who
in addition worked at block, district and state levels to record more than 160
taped interviews in three languages with key informants: contractors,
government officials, politicians, teachers, lawyers, journalists, labourers, trade
unionists, social workers and so on (parallel work was carried out in two field
localities in West Bengal: in Midnapore and Malda Districts). Throughout, the
detailed workings of the EAS were understood to provide a constructive and in
key respects comprehensive way of understanding what Joel Migdal (2001) has
called ‘the trenches’ of the everyday state.
Fieldwork in MP was carried out in 2003 and 2009. Greater use was made
there of published data on the EAS, which was in operation in parts of the state
from 1993 to 2003. Data were also collected on the early workings of NREGA.
Three field sites were selected in MP, in part to furnish useful comparisons
with the Bihar field sites. Unlike in Bihar, PRIs were well established
throughout the period of the EAS; indeed, the state has been seen as a beacon
of local self-government in India (Melo et al., 2012). Rewa District is more
Stuart Corbridge and Manoj Srivastava: The social order by fund flows 459
classically ‘feudal’ than Vaishali District in Bihar, but in key respects it offers a
good point of comparison. In Bidupur Block, the local BDO had complained to
us that ‘[e]very Yadav in this area bosses around the Block Office as if he
himself is Lalu Yadav’.5 In Rewa, Srinivas Tiwari, at the time of the EAS the
Brahmin Speaker of the MP Legislative Assembly, presented himself as a sort
of ‘Chief Minister’ of Rewa, supposedly leaving the real Chief Minister of MP,
Digvijay Singh, in charge of MP’s 44 remaining districts. The ‘White Tiger’ of
Rewa was widely thought to rule the district as his personal fiefdom.
Rickshaw wallahs maintained that ‘not even a fig tree swings here without
the permission of Tiwari-ji!’, and this largely proved to be the case when it
came to the EAS.
Rewa and Vaishali Districts provide the main substantive comparison in this
paper. Fieldwork in MP was also carried out, however, in Ghughri Block,
Mandla District, which, like Murhu Block in Ranchi District, Bihar (Jhark-
hand), is predominantly an adivasi area, as well as in Manasa Block, Neemuch
District. Neemuch is an imperfect counterpart to Bhojpur District in Bihar,
lacking as it does a long history of Left political insurgencies. Nevertheless,
‘feudal’ social relations are largely absent from Neemuch, where the dominant
social groups are entrepreneurial peasants from the Backward Caste Patel and
Patidar communities. Unlike at our other research sites, both the Congress and
the BJP, the two main contending parties in MP, have built operations that
reach down to the village level, where they have contributed significantly to a
process of empowerment among ordinary people.
Our studies of the EAS in MP and Bihar present a rare opportunity to test
whether fundamental differences in local governance structures determine
pro-poor outcomes in any meaningful way. Unlike in Bihar, to repeat, the EAS
in MP worked throughout in political settings characterized formally by high
levels of elected self-government. Even in Rewa District, as can be seen from
Table 1, elected representatives in Raipur Block came as much from the
region’s historically subaltern populations (its Scheduled Castes and Tribes
and Other Backward Castes (OBCs)) as from the General Caste communities
which contributed the area’s traditional landed elites. Most of these
representatives were far better educated than their local peers: less than 19
per cent of panchs were illiterate, while as many as 50 per cent of district-level
representatives from the block were graduates. (Experimental work in south
India has suggested that education reduces the possibility than an elected
politician will use power opportunistically: Besley et al., 2004). In Ghugri
Block, Mandla District, elected representatives are drawn overwhelmingly
from the ST population, as would be expected, while in Manasa Block,
Neemuch District, it is the OBC Patels and Patidars that mainly occupy
elected office. Here too educational levels of elected officials are higher than
would be found today in the counterpart field localities in Bihar and
Jharkhand.
460 Economy and Society
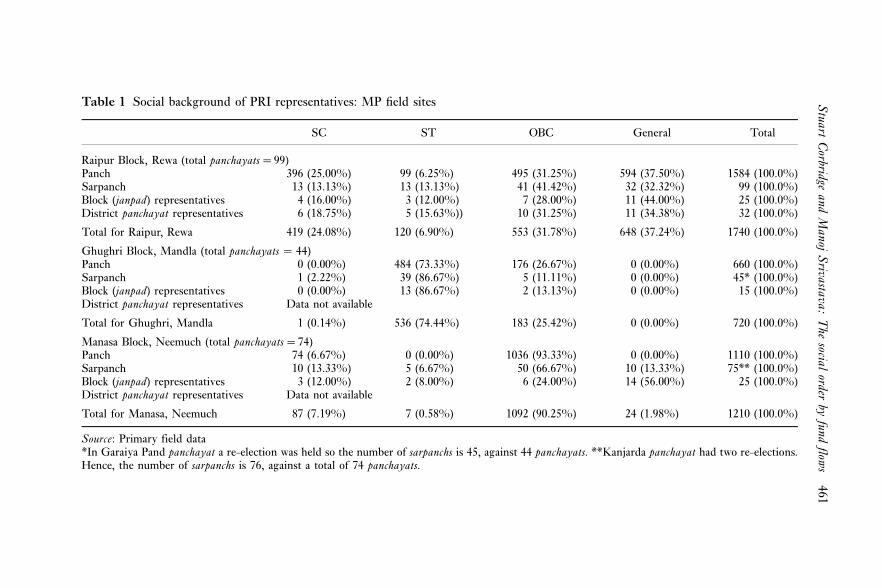
Table 1 Social background of PRI representatives: MP field sites
SC ST OBC General Total
Raipur Block, Rewa (total panchayats�99)Panch 396 (25.00%) 99 (6.25%) 495 (31.25%) 594 (37.50%) 1584 (100.0%)Sarpanch 13 (13.13%) 13 (13.13%) 41 (41.42%) 32 (32.32%) 99 (100.0%)Block (janpad) representatives 4 (16.00%) 3 (12.00%) 7 (28.00%) 11 (44.00%) 25 (100.0%)District panchayat representatives 6 (18.75%) 5 (15.63%)) 10 (31.25%) 11 (34.38%) 32 (100.0%)
Total for Raipur, Rewa 419 (24.08%) 120 (6.90%) 553 (31.78%) 648 (37.24%) 1740 (100.0%)
Ghughri Block, Mandla (total panchayats � 44)Panch 0 (0.00%) 484 (73.33%) 176 (26.67%) 0 (0.00%) 660 (100.0%)Sarpanch 1 (2.22%) 39 (86.67%) 5 (11.11%) 0 (0.00%) 45* (100.0%)Block (janpad) representatives 0 (0.00%) 13 (86.67%) 2 (13.13%) 0 (0.00%) 15 (100.0%)District panchayat representatives Data not available
Total for Ghughri, Mandla 1 (0.14%) 536 (74.44%) 183 (25.42%) 0 (0.00%) 720 (100.0%)
Manasa Block, Neemuch (total panchayats�74)Panch 74 (6.67%) 0 (0.00%) 1036 (93.33%) 0 (0.00%) 1110 (100.0%)Sarpanch 10 (13.33%) 5 (6.67%) 50 (66.67%) 10 (13.33%) 75** (100.0%)Block (janpad) representatives 3 (12.00%) 2 (8.00%) 6 (24.00%) 14 (56.00%) 25 (100.0%)District panchayat representatives Data not available
Total for Manasa, Neemuch 87 (7.19%) 7 (0.58%) 1092 (90.25%) 24 (1.98%) 1210 (100.0%)
Source: Primary field data*In Garaiya Pand panchayat a re-election was held so the number of sarpanchs is 45, against 44 panchayats. **Kanjarda panchayat had two re-elections.Hence, the number of sarpanchs is 76, against a total of 74 panchayats.
Stuart
Corbridge
andM
anojS
rivastava:T
hesocial
orderby
fundflow
s461
The EAS: design and flows of funds to the field
The EAS was inaugurated on 2 October, 1993. It was first confined to 1778
blocks in 261 districts that were defined as drought-prone, desert, tribal or hill
areas. During 1994�5 it was extended to 409 blocks having large concentra-
tions of adivasis and 256 blocks in flood-prone zones, until finally, in 1997�8,
all 5448 rural blocks of the country were made EAS operational. As previously
noted, it was by some way the most important poverty-alleviation programme
in India from c. 1993�2003, a period which broadly overlapped with the first
10 years of pro-market economic reforms.
The EAS manual set out the following design principles: The primary
objective of the EAS is to offer 100 days assured employment in the lean
season(s) for a maximum of two labourers from each registered rural household.
Its secondary objective is to strengthen the infrastructural development of a
village through the creation of durable assets. The manual also decrees that the
EAS will be demand-led in two senses: first, if a minimum of 20 (but in special
circumstances 10) labourers from registered households demand employment,
the state is obliged to start a suitable employment-generating project within 15
days of the demand and within five kilometres of the householders’ residences;
second, projects are to be selected in the first instance in village open meetings.
Resource-wise, EAS funds are to be made available until demand for work is
exhausted (within the scheme’s rules), with funding shared by centre and state
governments on an 80:20 basis.6 Finally, the manual suggests that at least 60 per
cent of EAS funds should be spent on labour, which in turn implied, it
proposed, an illustrative sectoral distribution of resources something like this:
water and soil conservation including afforestation and agro-horticulture �40
per cent; minor irrigation works �20 per cent; link roads �20 per cent;
primary school and anganwadi (child care) buildings �20 per cent.
Overall, Rs 114.6 billion (roughly US$3.3 billion) was made available by the
Government of India and all sub-national states for EAS projects during
1993�8, of which just over Rs 13.6 billion and Rs 11.1 billion reached MP and
Bihar, respectively. Almost two billion work days were generated with these
funds (CAG Report, 2000). Within MP, EAS resources were reportedly
distributed as shown in Figure 1. According to official records, which, of
course, are not always to be trusted and which we tried to cross-check in the
field, EAS funds totalling Rs 27.44 million, Rs 22.88 million and Rs 16.45
million were funnelled to Raipur, Ghughri and Manasa blocks respectively
during this period. Funds were then allocated across panchayats to execute
EAS schemes. Tracking the fund flow down to our research panchayats, it was
found that Rs 299,000 came to Delhi panchayat (Rewa) for one road scheme,
Rs 300,000 to Ramhepur (Mandla District) for one road scheme, and Rs
350,000 to Sandiya (Neemuch District) for two drainage schemes (Rs 300,000)
and one road scheme.
462 Economy and Society
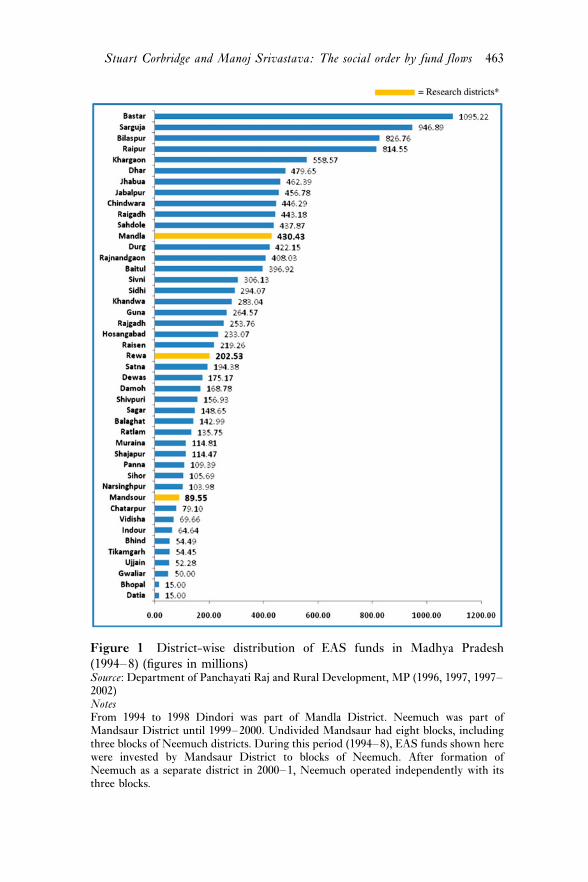
Figure 1 District-wise distribution of EAS funds in Madhya Pradesh
(1994�8) (figures in millions)Source: Department of Panchayati Raj and Rural Development, MP (1996, 1997, 1997�2002)NotesFrom 1994 to 1998 Dindori was part of Mandla District. Neemuch was part ofMandsaur District until 1999�2000. Undivided Mandsaur had eight blocks, includingthree blocks of Neemuch districts. During this period (1994�8), EAS funds shown herewere invested by Mandsaur District to blocks of Neemuch. After formation ofNeemuch as a separate district in 2000�1, Neemuch operated independently with itsthree blocks.
Stuart Corbridge and Manoj Srivastava: The social order by fund flows 463
How was the EAS understood in Bihar and MP?
Previously reported work from Bihar established that EAS schemes were often
delivered on the ground without any of the programme’s statutory provisions
being acted upon and in the face of widespread ignorance of or misunder-
standings about the rights-based and participatory nature of the scheme.
Aggregating across our three research panchayats (Korendehri in Bhojpur,
Mahil in Ranchi and Dhubauli in Vaishali) we found that close to 91 per cent
of poor villagers had not heard of the EAS by name, and that no-one at all was
aware of its rights-based guarantee of employment (Corbridge et al., 2005,
ch. 4). Naturally, gram sabhas were not held to select the projects that were paid
for by EAS funds and run by contractors selected in theory by government
officials. Interestingly, EAS job cards had been provided to a small number of
poor villagers in Dhubauli, but none of the recipients understood how they
might use the cards specifically to access EAS work. Again, this is not
surprising since the SC labourers who did receive cards had been sent them by
clients of a prominent SC politician, Ramvilas Paswan, with the express aim of
helping them to get jobs in a nearby railway works (Paswan at the time was the
national Railways Minister). In fact, no-one in our Vaishali field site gained
work on local EAS schemes: work was performed there but diverted by
contractors to outside labourers, who were cheaper or considered easier to
manage. Meanwhile, in Korendheri and Mahil panchayats, about one quarter of
poor villagers had gained work on EAS projects, even though the vast majority
of these people were unaware that the work they had gained (and which we
were able to check independently) was EAS work.
But what of MP, which at the time was a beacon of democratic local
activism, at least according to its Chief Minister and a growing number of
academics and journalists: surely things would be better there? Depressingly,
this was not the case. Starting first with our small-n samples, Table 2 shows
that levels of awareness about the EAS were barely any better in MP than in
Bihar, democratic self-government notwithstanding, while the distribution of
job cards was no more conducted in an appropriate manner than was the
holding of village open meetings.
As in Bihar, however, a dismal level of awareness in MP about the statutory
provisions of the EAS did not mean that people were unaware of EAS projects
executed in their areas. People were far more aware of EAS projects than of the
smaller schemes provided for by the Jawahar Rozgar Yajna (JRY: food for work)
programme. In Delhi panchayat, a 1.5 km road from Delhi to Mohgarh village
costing Rs 2.99 lakhs (one lakh�100,000) had clearly been executed on the
ground: everybody pointed to it in the field, although not without veiled
comments about corruption in its delivery. Similarly, in Ramhepur and Sandiya
panchayats a number of respondents recognized EAS projects from the official
lists that we shared with them. In MP, road projects were preferred in two
research blocks, notwithstanding official guidance to the contrary in the EAS
manual. As in Bihar, too, road projects were largely metalled (pucca), which made
464 Economy and Society
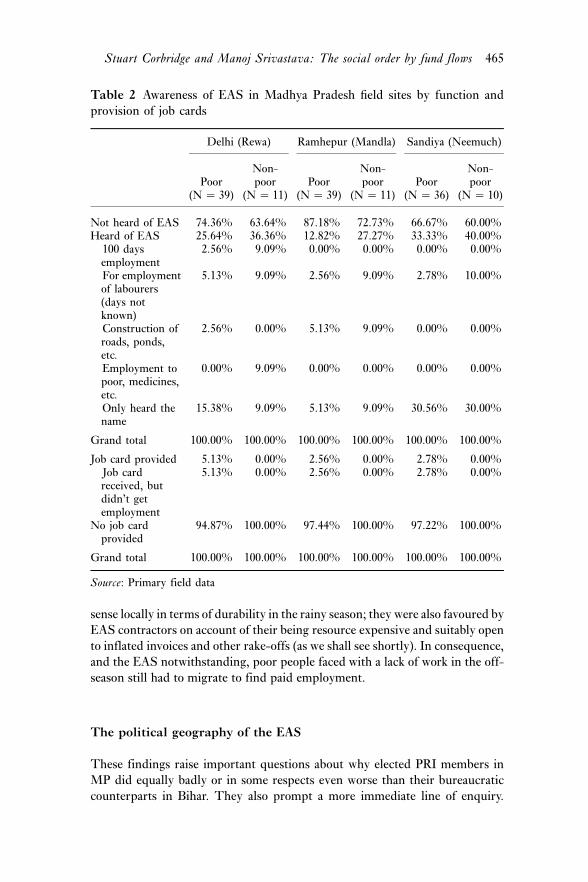
sense locally in terms of durability in the rainy season; they were also favoured by
EAS contractors on account of their being resource expensive and suitably open
to inflated invoices and other rake-offs (as we shall see shortly). In consequence,
and the EAS notwithstanding, poor people faced with a lack of work in the off-
season still had to migrate to find paid employment.
The political geography of the EAS
These findings raise important questions about why elected PRI members in
MP did equally badly or in some respects even worse than their bureaucratic
counterparts in Bihar. They also prompt a more immediate line of enquiry.
Table 2 Awareness of EAS in Madhya Pradesh field sites by function and
provision of job cards
Delhi (Rewa) Ramhepur (Mandla) Sandiya (Neemuch)
Poor(N � 39)
Non-poor
(N � 11)Poor
(N � 39)
Non-poor
(N � 11)Poor
(N � 36)
Non-poor
(N � 10)
Not heard of EAS 74.36% 63.64% 87.18% 72.73% 66.67% 60.00%Heard of EAS 25.64% 36.36% 12.82% 27.27% 33.33% 40.00%
100 daysemployment
2.56% 9.09% 0.00% 0.00% 0.00% 0.00%
For employmentof labourers(days notknown)
5.13% 9.09% 2.56% 9.09% 2.78% 10.00%
Construction ofroads, ponds,etc.
2.56% 0.00% 5.13% 9.09% 0.00% 0.00%
Employment topoor, medicines,etc.
0.00% 9.09% 0.00% 0.00% 0.00% 0.00%
Only heard thename
15.38% 9.09% 5.13% 9.09% 30.56% 30.00%
Grand total 100.00% 100.00% 100.00% 100.00% 100.00% 100.00%
Job card provided 5.13% 0.00% 2.56% 0.00% 2.78% 0.00%Job cardreceived, butdidn’t getemployment
5.13% 0.00% 2.56% 0.00% 2.78% 0.00%
No job cardprovided
94.87% 100.00% 97.44% 100.00% 97.22% 100.00%
Grand total 100.00% 100.00% 100.00% 100.00% 100.00% 100.00%
Source: Primary field data
Stuart Corbridge and Manoj Srivastava: The social order by fund flows 465
Given that a large number of EAS projects were executed on the ground, what
can we learn about local politics on a larger spatial scale by looking at the
geographical distribution of EAS-funded projects across the research blocks
and districts?
To address this question, we collected data for 1451 EAS projects covering
1487 panchayats in all 21 blocks of the three research districts. In Mandla
District, we have data on 677 projects amounting to Rs 242.02 million over a
period of seven years in nine blocks and 472 panchayats. In Rewa district, we
have records for 463 EAS projects amounting to Rs 230.35 million over a
period of six years in nine blocks and 801 panchayats, and in Neemuch 311
EAS projects amounting to Rs 47.13 million over a period of four years in
three blocks and 214 panchayats.
The distribution of EAS resources within MP districts is heavily skewed,
albeit in varying degrees. In Rewa, Gangev Block received Rs 325.95 lakhs over
four years, compared to Hanumana Block’s Rs 222.06 lakhs over six years.7
Similarly in Mandla, where every block had received EAS funds for the whole
seven years, the highest amount of Rs 428.00 lakhs went to Mandla Block,
whereas Mawai received only Rs. 166.80 lakhs. Neemuch also showed an
asymmetry in fund distribution, though not as sharply as the other districts.
Far more significantly, a number of panchayats had received absolutely no EAS
funds. In our research districts, the highest level of exclusion was found in
Rewa, where 66.30 per cent of panchayats had not received EAS funds. In
Mandla District, 35.17 per cent of panchayats had received nothing. The
number of panchayats excluded or covered by EAS funds also varied from
block to block. (Although our data for Bihar are less robust than for MP,
Bidupur Block in Vaishali appears to have the highest exclusion level, with
73 per cent of its villages untouched by EAS funds; Tribal Murhu Block shows
less exclusion � 44.20 per cent � while 45 per cent of Sahar villages received
no benefit from EAS.)
It is possible that skewness of this sort reflects some underlying objective
factors, such as the population size of different blocks or local consistency with
stated EAS criteria. We would not expect an entirely even distribution of EAS
funds across either blocks or districts in Bihar or MP. To make our findings
more robust, sensitivity tests were performed for eight parameters that might
be thought to explain or influence the distribution of EAS resources,
including: population size; size of SC and ST population; means of livelihood;
house type; and education level. We use the corrected data from these tests in
the analysis which follows of EAS spending in Rewa and Mandla Districts (and
their pairs in Bihar/Jharkhand: Vaishali and Ranchi).8
Rewa and Vaishali districts
Table 3 presents our corrected data for Rewa District. Controlling for eight
possible sources of skewness does not affect our initial interpretation of EAS
466 Economy and Society
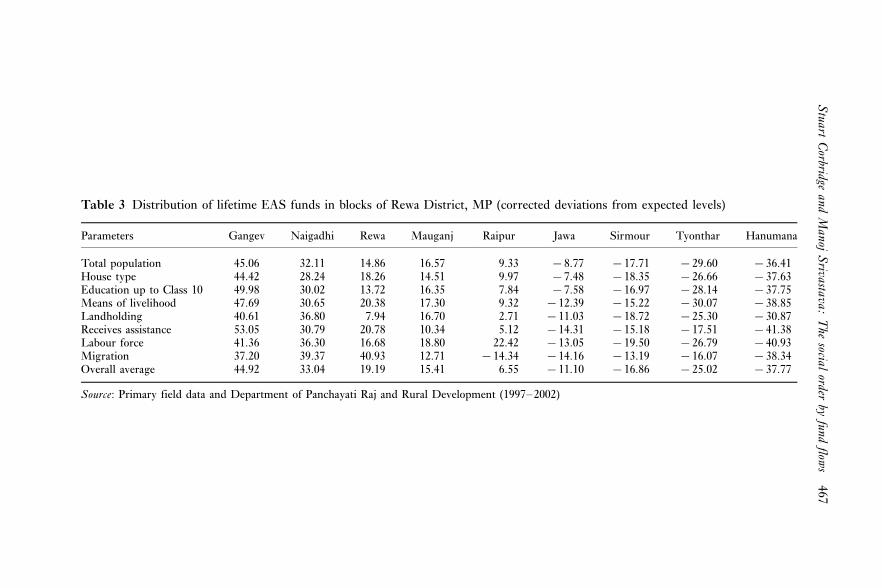
Table 3 Distribution of lifetime EAS funds in blocks of Rewa District, MP (corrected deviations from expected levels)
Parameters Gangev Naigadhi Rewa Mauganj Raipur Jawa Sirmour Tyonthar Hanumana
Total population 45.06 32.11 14.86 16.57 9.33 �8.77 �17.71 �29.60 �36.41House type 44.42 28.24 18.26 14.51 9.97 �7.48 �18.35 �26.66 �37.63Education up to Class 10 49.98 30.02 13.72 16.35 7.84 �7.58 �16.97 �28.14 �37.75Means of livelihood 47.69 30.65 20.38 17.30 9.32 �12.39 �15.22 �30.07 �38.85Landholding 40.61 36.80 7.94 16.70 2.71 �11.03 �18.72 �25.30 �30.87Receives assistance 53.05 30.79 20.78 10.34 5.12 �14.31 �15.18 �17.51 �41.38Labour force 41.36 36.30 16.68 18.80 22.42 �13.05 �19.50 �26.79 �40.93Migration 37.20 39.37 40.93 12.71 �14.34 �14.16 �13.19 �16.07 �38.34Overall average 44.92 33.04 19.19 15.41 6.55 �11.10 �16.86 �25.02 �37.77
Source: Primary field data and Department of Panchayati Raj and Rural Development (1997�2002)
Stuart
Corbridge
andM
anojS
rivastava:T
hesocial
orderby
fundflow
s467
spending in the district at the block level. Clearly, Gangev Block is the most
privileged, having received on average about 45 per cent more resources than it
merited along any of the eight listed parameters. Likewise, the concentration of
EAS funds in Gangev and a few other blocks came at the cost of people in the
remaining four blocks, which had an average negative percentage adjusted
deviation ranging from �37.8 per cent to �11.1 per cent. Just as Gangev was
the most privileged block, Hanumana is the most deprived.
The distribution of EAS funds was even more uneven within our
research block, Raipur. Roughly 70 per cent of the total amount was taken
by just 17 of 99 panchayats. Additionally, each panchayat in this group was
repeatedly the recipient of a number of schemes in different years, always
amounting to more than Rs 5 lakhs, and in Ukata-kanchanpur reaching as
much as Rs. 2.4 million. Yet 56 of 99 panchayats in this block were entirely
deprived of EAS resources.
Table 4 identifies five distinct groups of panchayats in Raipur, the first of
which comprises four panchayats that received at least six times their due. Had
Ukata-kanchanapur received funds in accordance with the average effect of the
eight adjustment parameters, the total would have been no more than Rs 1.9
lakhs, as opposed to the Rs 23.74 lakhs it actually received. Interestingly, in
three of these four panchayats, women were listed as sarpanchs, which at first
glance provides grist for those who believe that female local officials perform
better than their male counterparts (Beaman et al., 2009). Sadly, we discovered
that in all three cases it was the husband of the sarpanch who called the shots.
For example, PT was the sarpanch of Delhi panchayat during the period of
fieldwork.9 It was clear, however, that her husband, UKT, a powerful Brahmin
landlord, was not only the de facto but in most key respects the de jure sarpanch.
PT lived in the district headquarter town 35 kilometres away from the village,
mainly to ensure a good education for the couple’s children. UKT managed
the business of the panchayat in the open, conducting meetings, signing
proceedings and drawing money from the bank. Nobody minded; even
government banks honoured checks signed by him where he had faked his
wife’s signature or simply added his own.
To understand how these political geographies of the EAS were created we
have to step back from official datasets. In the field, we first gained a sense of
what was happening episodically and inductively. We asked, for example, about
how an EAS project of Rs.7.74 lakhs was brought to Hinauti panchayat. Why
did this panchayat get more than four times its due?
Mrs GS was the de jure sarpanch during 1994�9, but her husband NS was
the de facto sarpanch. In a frank interview he revealed that he had initially
prepared a check dam project for Rs 2.97 lakhs and sent it upwards to the
district via the block for approval (under the then prevalent rules, a panchayat
was authorized to take up construction work for projects valued at Rs 3 lakhs or
less). A senior janpad (block) panchayat representative opposed to NS did not
want the scheme to go to him. He coerced a junior engineer in the block to
inflate the estimate to Rs 4.5 lakhs, thus bringing the execution under control
468 Economy and Society
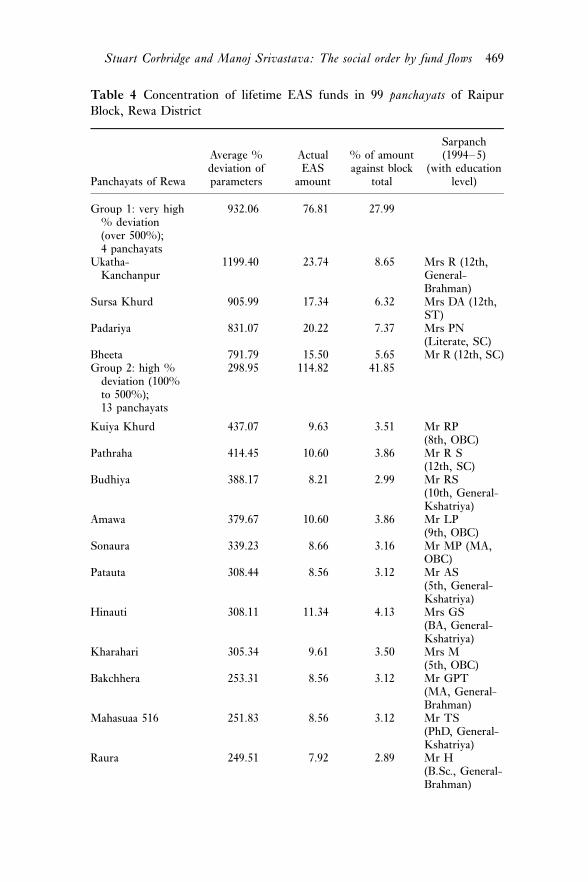
Table 4 Concentration of lifetime EAS funds in 99 panchayats of Raipur
Block, Rewa District
Panchayats of Rewa
Average %deviation ofparameters
ActualEAS
amount
% of amountagainst block
total
Sarpanch(1994�5)
(with educationlevel)
Group 1: very high% deviation(over 500%);4 panchayats
932.06 76.81 27.99
Ukatha-Kanchanpur
1199.40 23.74 8.65 Mrs R (12th,General-Brahman)
Sursa Khurd 905.99 17.34 6.32 Mrs DA (12th,ST)
Padariya 831.07 20.22 7.37 Mrs PN(Literate, SC)
Bheeta 791.79 15.50 5.65 Mr R (12th, SC)Group 2: high %
deviation (100%to 500%);13 panchayats
298.95 114.82 41.85
Kuiya Khurd 437.07 9.63 3.51 Mr RP(8th, OBC)
Pathraha 414.45 10.60 3.86 Mr R S(12th, SC)
Budhiya 388.17 8.21 2.99 Mr RS(10th, General-Kshatriya)
Amawa 379.67 10.60 3.86 Mr LP(9th, OBC)
Sonaura 339.23 8.66 3.16 Mr MP (MA,OBC)
Patauta 308.44 8.56 3.12 Mr AS(5th, General-Kshatriya)
Hinauti 308.11 11.34 4.13 Mrs GS(BA, General-Kshatriya)
Kharahari 305.34 9.61 3.50 Mrs M(5th, OBC)
Bakchhera 253.31 8.56 3.12 Mr GPT(MA, General-Brahman)
Mahasuaa 516 251.83 8.56 3.12 Mr TS(PhD, General-Kshatriya)
Raura 249.51 7.92 2.89 Mr H(B.Sc., General-Brahman)
Stuart Corbridge and Manoj Srivastava: The social order by fund flows 469
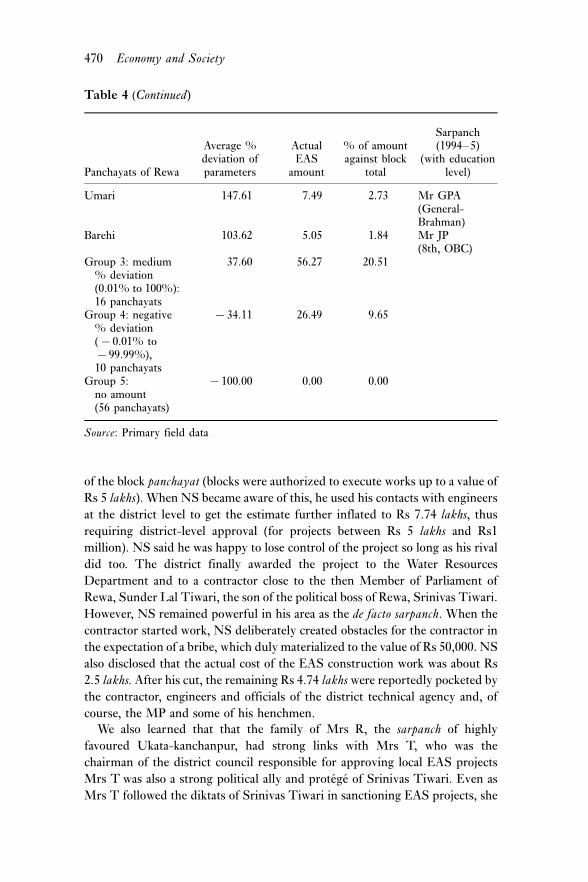
of the block panchayat (blocks were authorized to execute works up to a value of
Rs 5 lakhs). When NS became aware of this, he used his contacts with engineers
at the district level to get the estimate further inflated to Rs 7.74 lakhs, thus
requiring district-level approval (for projects between Rs 5 lakhs and Rs1
million). NS said he was happy to lose control of the project so long as his rival
did too. The district finally awarded the project to the Water Resources
Department and to a contractor close to the then Member of Parliament of
Rewa, Sunder Lal Tiwari, the son of the political boss of Rewa, Srinivas Tiwari.
However, NS remained powerful in his area as the de facto sarpanch. When the
contractor started work, NS deliberately created obstacles for the contractor in
the expectation of a bribe, which duly materialized to the value of Rs 50,000. NS
also disclosed that the actual cost of the EAS construction work was about Rs
2.5 lakhs. After his cut, the remaining Rs 4.74 lakhs were reportedly pocketed by
the contractor, engineers and officials of the district technical agency and, of
course, the MP and some of his henchmen.
We also learned that that the family of Mrs R, the sarpanch of highly
favoured Ukata-kanchanpur, had strong links with Mrs T, who was the
chairman of the district council responsible for approving local EAS projects
Mrs T was also a strong political ally and protege of Srinivas Tiwari. Even as
Mrs T followed the diktats of Srinivas Tiwari in sanctioning EAS projects, she
Table 4 (Continued)
Panchayats of Rewa
Average %deviation ofparameters
ActualEAS
amount
% of amountagainst block
total
Sarpanch(1994�5)
(with educationlevel)
Umari 147.61 7.49 2.73 Mr GPA(General-Brahman)
Barehi 103.62 5.05 1.84 Mr JP(8th, OBC)
Group 3: medium% deviation(0.01% to 100%):16 panchayats
37.60 56.27 20.51
Group 4: negative% deviation(�0.01% to�99.99%),10 panchayats
�34.11 26.49 9.65
Group 5:no amount(56 panchayats)
�100.00 0.00 0.00
Source: Primary field data
470 Economy and Society
apparently did not forget to extract her own pay-off. A tribal ex-sarpanch, BK
of Tatihara panchayat, had proudly shown us a one-kilometre-long approach
road costing Rs 2.99 lakhs, constructed under the EAS in 1998�9. He said that
Mrs T had demanded Rs 15,000 for this project. He claimed that he had paid
the commission through her broker, a school teacher, before obtaining project
approval.
Finally, consider this response from a very active ex-sarpanch in one of the
56 panchayats which had not received any funding under EAS. Like several
other respondents he told us that in the period from 1993 to 2003 almost all
local MPs and MLAs came from the Brahman and Rajput Forward Castes.
Only sarpanchs with connections to this political class (and plenty of money)
could get EAS projects.10 This was additionally confirmed by another insider,
SP, the panchayat secretary of Silpari, who suggested that since Silpari
panchayat was dominated by Backward Castes, this worked against it when the
Forward Caste MLAs and MPs controlled the flow of EAS resources from the
district level downwards. This prompted us to find out whether Backward
Caste-dominated panchayats were generally excluded or not. We found that
twenty-seven out of fifty-six panchayats which did not get any EAS fund were
headed by sarpanchs from the Patel (OBC) community alone � more than twice
what we would have expected. Panchayats with Forward Castes sarpanchs were
by a long way the least excluded from EAS funds. The biggest losers, of
course, were the labourers for whom the EAS was supposedly designed. They
suffered from extraordinarily high leakage rates on the EAS projects which
were commissioned � as well as from the simple absence of EAS projects in
politically disenfranchised panchayats.11
What we were observing in all these cases was the power of high-level
politicians to push resources down to their preferred areas and clients, and the
machinations and networking of individual sarpanchs. Srinivas Tiwari was
undoubtedly the key player in Rewa. This was confirmed not only by
interviews with politicians, PRI representatives, officers and ordinary villagers,
but also by what happened to the geography of NREGA spending in Rewa
once Tiwari lost his seat as the local MLA in the 2003 elections. During the
time that Tiwari was an MLA (1990�2003), EAS and other funds flowed
disproportionately to his supporters, notably in Gangev Block, which forms
the major part of his Mangawan constituency. After his removal from power,
however, which occurred just two years before the National Rural Employment
Guarantee scheme was inaugurated, Gangev received 97 per cent of its
expected NREGA entitlement from 2006�2008, way down on its ‘plus 44 per
cent’ shares during the EAS years. Set against this, Jawa Block, in the Sirmaur
legislative constituency, which had received only 76 per cent of the average
EAS amount, jumped to a 107 per cent share of expected NREGA funds.
It now benefited from political representation at the MLA level as well as from
better accountability mechanisms in the scheme itself. (Happily, the degree of
bias in the geography of NREGA fund allocations had not, by the time of
Stuart Corbridge and Manoj Srivastava: The social order by fund flows 471
fieldwork in 2009, reached the levels that characterized the EAS regime under
Srinivas Tiwari.)
Interestingly, the story of the EAS in Rewa was mirrored in Vashaili District,
Bihar. Six of 24 panchayats in Bidupur were entirely cut off from EAS funds.
This may appear small beer against the exclusion of 56 out of 99 panchayats in
Raipur in Rewa. However, panchayats in Bihar are about six times larger than
in Rewa, so a truly comparative view would suggest that just over 70 per cent
of villages were excluded in Bidupur against 57 per cent in Raipur. The
capture of 74.09 per cent of EAS funds by just 10 per cent of villages in
Bidupur is very similar to the capture rate in Raipur (79 per cent of funds in
21.21 per cent of panchayats).
Field-work in Bidupur unambiguously showed that the local strongman and
member of the legislative council, Bhola Babu, a key protege and ally of Lalu
Yadav at the time of our research, controlled access to all EAS funds. Here too
we found a story of huge cuts and commissions, and the conversion of such
EAS spending as there was into a large-scale road-building project which sank
funds into those of Bidupur’s panchayats which provided political support to
Bhola Babu. Bhola Babu was a hard-line Backward Caste politician, a strong
supporter of Lalu Yadav and a fighter against Forward Caste dominance in
Bihari society and politics. Srinivas Tiwari was in many respects the polar
opposite: a well-heeled member of the local feudal elite and a lifelong
supporter of a Congress Party that in MP had always been dominated by the
Forward Castes. None of these differences mattered, however, when it came to
their ability and willingness to control the distribution of EAS resources in
constituencies where they faced no effective opposition (for general discussion
of distorted political markets, see Keefer & Khemani, 2005). The existence of
1,500 to 1,600 elected representatives from all three tiers of panchayati Raj in
Rewa District counted for nothing in the face of the power of Srinivas Tiwari.
On the contrary, elected representatives, where they were successful in EAS
terms, partnered with Tiwari to have their own bite at the cherry. The fact that
Bhola Babu exercised a similar degree of power in Bidupur Block, Bihar, and
achieved similar results for himself and his clients, suggests that the remedy in
Bihar is unlikely to be found in the formal trappings of democratic self-
governance, at least not in the short run.
Mandla and Ranchi Districts
The distribution of EAS funds was less distorted in the two tribal-dominated
districts that we studied, Mandla and Ranchi. Our unadjusted figures reveal
that Mandla Block received the highest amount of EAS funding (Rs 428 lakhs),
followed by Nainpur and Bichiya Blocks (Rs 378 and Rs 317 lakhs
respectively), all of which seemed consistent with local political realities.
Mandla was represented by Devendra Tekam, an important cabinet minister in
Digvijay Singh’s government at that time. Nainpur seemed privileged because
472 Economy and Society
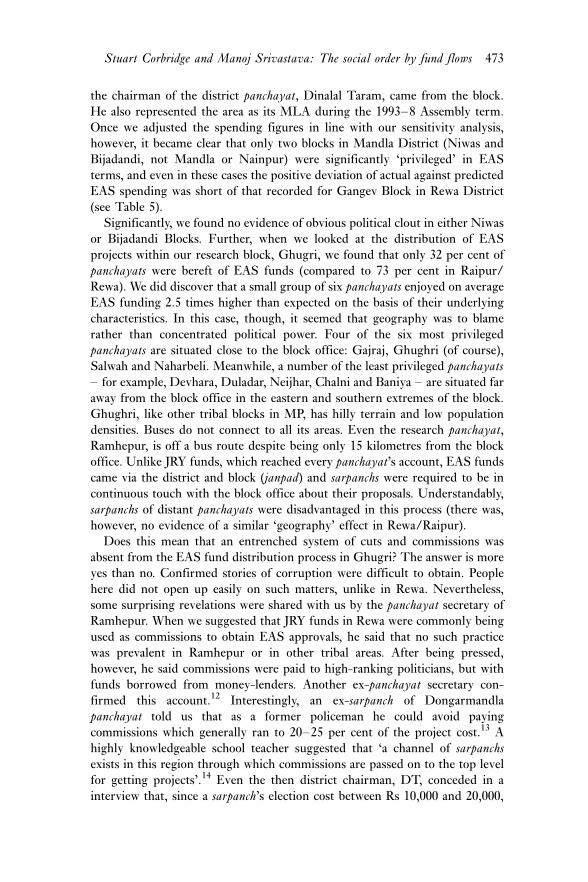
the chairman of the district panchayat, Dinalal Taram, came from the block.
He also represented the area as its MLA during the 1993�8 Assembly term.
Once we adjusted the spending figures in line with our sensitivity analysis,
however, it became clear that only two blocks in Mandla District (Niwas and
Bijadandi, not Mandla or Nainpur) were significantly ‘privileged’ in EAS
terms, and even in these cases the positive deviation of actual against predicted
EAS spending was short of that recorded for Gangev Block in Rewa District
(see Table 5).
Significantly, we found no evidence of obvious political clout in either Niwas
or Bijadandi Blocks. Further, when we looked at the distribution of EAS
projects within our research block, Ghugri, we found that only 32 per cent of
panchayats were bereft of EAS funds (compared to 73 per cent in Raipur/
Rewa). We did discover that a small group of six panchayats enjoyed on average
EAS funding 2.5 times higher than expected on the basis of their underlying
characteristics. In this case, though, it seemed that geography was to blame
rather than concentrated political power. Four of the six most privileged
panchayats are situated close to the block office: Gajraj, Ghughri (of course),
Salwah and Naharbeli. Meanwhile, a number of the least privileged panchayats
� for example, Devhara, Duladar, Neijhar, Chalni and Baniya � are situated far
away from the block office in the eastern and southern extremes of the block.
Ghughri, like other tribal blocks in MP, has hilly terrain and low population
densities. Buses do not connect to all its areas. Even the research panchayat,
Ramhepur, is off a bus route despite being only 15 kilometres from the block
office. Unlike JRY funds, which reached every panchayat’s account, EAS funds
came via the district and block (janpad) and sarpanchs were required to be in
continuous touch with the block office about their proposals. Understandably,
sarpanchs of distant panchayats were disadvantaged in this process (there was,
however, no evidence of a similar ‘geography’ effect in Rewa/Raipur).
Does this mean that an entrenched system of cuts and commissions was
absent from the EAS fund distribution process in Ghugri? The answer is more
yes than no. Confirmed stories of corruption were difficult to obtain. People
here did not open up easily on such matters, unlike in Rewa. Nevertheless,
some surprising revelations were shared with us by the panchayat secretary of
Ramhepur. When we suggested that JRY funds in Rewa were commonly being
used as commissions to obtain EAS approvals, he said that no such practice
was prevalent in Ramhepur or in other tribal areas. After being pressed,
however, he said commissions were paid to high-ranking politicians, but with
funds borrowed from money-lenders. Another ex-panchayat secretary con-
firmed this account.12 Interestingly, an ex-sarpanch of Dongarmandla
panchayat told us that as a former policeman he could avoid paying
commissions which generally ran to 20�25 per cent of the project cost.13 A
highly knowledgeable school teacher suggested that ‘a channel of sarpanchs
exists in this region through which commissions are passed on to the top level
for getting projects’.14 Even the then district chairman, DT, conceded in a
interview that, since a sarpanch’s election cost between Rs 10,000 and 20,000,
Stuart Corbridge and Manoj Srivastava: The social order by fund flows 473
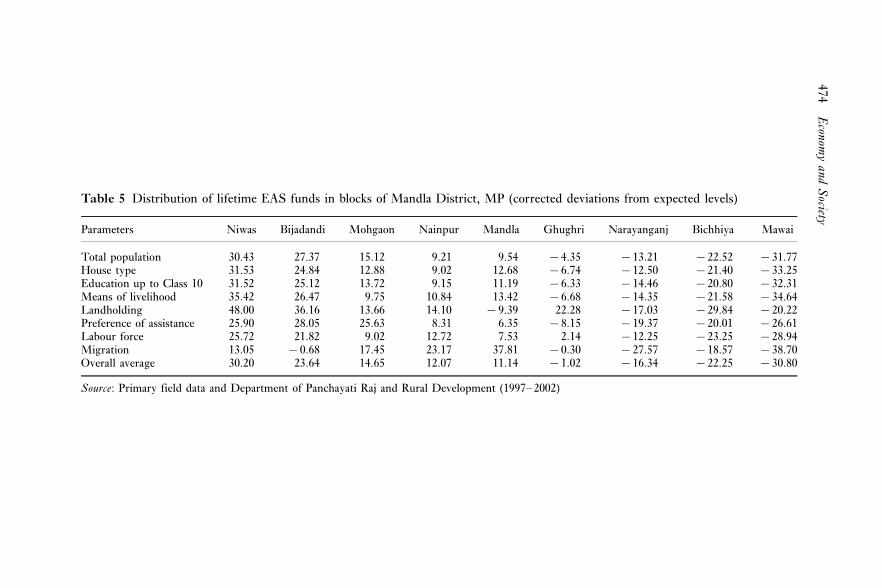
Table 5 Distribution of lifetime EAS funds in blocks of Mandla District, MP (corrected deviations from expected levels)
Parameters Niwas Bijadandi Mohgaon Nainpur Mandla Ghughri Narayanganj Bichhiya Mawai
Total population 30.43 27.37 15.12 9.21 9.54 �4.35 �13.21 �22.52 �31.77House type 31.53 24.84 12.88 9.02 12.68 �6.74 �12.50 �21.40 �33.25Education up to Class 10 31.52 25.12 13.72 9.15 11.19 �6.33 �14.46 �20.80 �32.31Means of livelihood 35.42 26.47 9.75 10.84 13.42 �6.68 �14.35 �21.58 �34.64Landholding 48.00 36.16 13.66 14.10 �9.39 22.28 �17.03 �29.84 �20.22Preference of assistance 25.90 28.05 25.63 8.31 6.35 �8.15 �19.37 �20.01 �26.61Labour force 25.72 21.82 9.02 12.72 7.53 2.14 �12.25 �23.25 �28.94Migration 13.05 �0.68 17.45 23.17 37.81 �0.30 �27.57 �18.57 �38.70Overall average 30.20 23.64 14.65 12.07 11.14 �1.02 �16.34 �22.25 �30.80
Source: Primary field data and Department of Panchayati Raj and Rural Development (1997�2002)
474
Econom
yand
Society
and that of a district member between Rs 50,000 and Rs 75,000 (1990s prices),
these would need to be ‘recouped’.15
The overall picture was one of gradually increasing cuts and commissions
within a framework where EAS funds were still broadly distributed according
to population shares. Additionally, if they wanted to, district magistrates and
the chief executive officers of district panchayats could intervene to oversee the
pattern of funds being shaped by the politicians and the PRI representatives.
This was enormously difficult in districts such as Rewa, where politicians were
aggressive in commanding development funds and avoiding bureaucratic
oversight.
Significantly, too, our findings in Mandla were replicated in large degree in
the adivasi-dominated Murhu Block of Ranchi District (erstwhile Bihar).
Forty-four per cent of its 138 villages received no EAS funds, (compared to 31
per cent of Ghugri panchayats), and 17 per cent of Murhu’s villages shared 63
per cent of total invested funds. However, the inter-panchayat distribution of
funds in Murhu shows that all 24 panchayats received EAS projects. Again,
this was testimony to the ability of the district-level officials to bargain with
tribal politicians who were less well organized � as well as more plural � than
their counterpart(s) in Bidupur.
Conclusion
The EAS worked in MP very much as it worked in Bihar (and Jharkhand):
badly from the point of view of informed public participation and variably
when it came to the geography of EAS spending. The intended beneficiaries of
EAS projects were poorly informed about the purposes of the EAS or indeed
about their entitlement to register for paid employment from the scheme. This
was true of all six research districts. Variations in scheme performance were
mainly to be found in the geographies of EAS funding allocations. In this
regard, the existence of functioning PRIs made very little difference to the way
that the EAS worked on the ground, which is a depressing conclusion for
proponents of a conventional good governance or decentralization agenda.
What mattered more was the presence of effective political competition at the
block and district levels. Where political power was more or less monopolized
by one key actor � as in our Rewa and Vaishali field sites � the distribution of
EAS funds was correspondingly funnelled to allies and clients of the regional
political boss. Capture of EAS funds by people who should not have been
scheme beneficiaries � well-connected contractors, some sarpanchs/mukhiyas,
government officials and key local politicians � was also more extensive
(and open) in these field sites than in our two adivasi-dominated field
locations (Mandla and Ranchi). Bureaucratic oversight mechanisms were
enabled in Mandla and Ranchi Districts in a way that they were not in Rewa
and Vaishali.
Stuart Corbridge and Manoj Srivastava: The social order by fund flows 475
The fact that EAS funds were controlled in some localities by a small
number of political actors does not mean that the EAS failed to work there in
all respects. Labourers suffer where false accounting and high leakage rates
leave little money for paid employment on government schemes. Even in Rewa
and Vaishali Districts, however, men and women were put to work on EAS
projects (whether or not they knew they were working on EAS projects, and
regardless of whether the labour was recruited locally), and durable roads and
buildings were constructed with EAS funds to general community acclaim. It
is possible, too, that schemes like EAS and NREGA contribute at the margin
to lower food prices where agrarian productivity is improved. Governance
regimes characterized by boss politics, clientelism and high rates of corruption �whether or not they sit within formally functioning PRIs � can still give rise to
infrastructural benefits. That, after all, is part of the purpose of clientelism as a
political system.
At the same time, the fact that the benefits of India’s largest anti-poverty
scheme were so poorly distributed both socially and geographically through the
1990s and early-2000s � we estimate that no more than 20 per cent of EAS
funds ended up with registered labourers in any of our field sites � suggests
that NREGA schemes will have to function in practice much as they are
expected to in the Act’s field manuals if they are genuinely to empower the
poor. NREGA makes many of the same assumptions as did the EAS. It
assumes that intended beneficiaries are well informed about the scheme, can
translate their information into practical actions and demands (with or without
the backing of law), and that the controllers of funds are either compelled to be
honest (payments into bank accounts) and/or can be held to account (social
audits). In some parts of India these assumptions might hold water. Early
studies of NREGA schemes in Karnataka in Kerala give grounds for optimism,
as of course does the nationwide campaign to raise awareness about NREGA
ahead of its implementation (Khera, 2011). There is a considerable body of
work in political science that supports the intuition that public service delivery
works most effectively where citizens receive information about benefits in
forms that are at once disaggregated and meaningful to them (Keefer &
Khemani, 2004, p. 941; see also Besley & Burgess, 2002, on the importance of
literacy and newspaper circulation).
In other parts of India, however, notably in Bihar and Jharkhand, but in our
view in parts of MP as well, information flows about public services remain
limited at best, while village meetings (gram sabhas) remain open to
manipulation by locally powerful actors. The famous social audit of NREGA
spending carried out by activists of the Mazdur Kisan Shakti Sanghatan
(MKSS) in Bhilwara, Rajasthan (Subrahmaniam, 2009c) shows what can be
done when enthusiasm and expertise are committed to the task, but it would be
straining credibility to think that the Bhilwara audit is anything but
exceptional. Just because fund flows can be better tracked now than 10 years
ago, does not mean that they will be tracked openly, effectively and with
empowering consequences. Careful empirical studies of NREGA schemes over
476 Economy and Society
a period of several years will help determine whether (and by what degree) this
is indeed the case. We need more information on fund flows, on days worked
and by whom, on payments made and declared, and so on. On the plus side,
the slow rebuilding of government capacity in Bihar under Nitish Kumar and
the gradual erosion of the power bases of some regional political bosses in MP
provide at least some further grounds for believing that NREGA schemes will
deliver greater funds directly to the poor � and perhaps most of all to poor
women � than was ever the case with the EAS.
Acknowledgements
We are pleased to acknowledge funding from the United Kingdom’s Economic
and Social Research Council (grant number R000237761) and Department for
International Development (grant number CNTR 00 1553), while noting that
we alone are responsible for the findings reported here. Fieldwork in Madhya
Pradesh was supported by the Jamsetji Tata Trust, for which we are also
grateful. We are grateful, too, to Alpa Shah and three external referees for
comments on a first draft of this paper.
Notes
1 Strictly, the Mahatma Gandhi National Rural Employment Guarantee Act,commonly pronounced in India as Manrega.2 We take this observation directly from one of the referees for this paper, to whom weremain grateful. We should add that civil society actions are empowered by thegovernment’s maintenance of an elaborate NREGA website, which indexes animportant link between NREGA and the Right to Information Act and movement inIndia.3 In effect, the legislation enabled a third tier of government in India, below thefederal (centre) and state levels. Regular elections populate local government at grampanchayat, block and district levels. At least one third of seats are reserved for women inthese panchayati Raj institutions (PRIs), the proportion varying by state.4 Bihar’s solution was ingenious: a government circular notified all panchayat sewaks,the lowest level government staff posted in a block office assigned to a panchayat, toperform certain government duties as if they were mukhiyas (equivalent to sarpanchs inMP). Similarly, block development officers (BDOs) were notified to act as pramukhs(chairs of the block or janpad panchayats). By this means the government of Biharmaintained the conceit that, despite having no PRI elections, it still had ‘functionalequivalents’ of mukhiyas and pramukhs and was qualified to receive central funds (seeDepartment of Rural Development, Government of Bihar, 1993 and 1995).5 Interview with Mr Rajnish, BDO Bidupur, 24 April 1999.6 This commitment was watered down in practice after 2000.7 At the time, $1 � Rs 35, roughly.8 Detailed test results available from the authors on request.9 Names of respondents other than senior political or bureaucratic figures have beenanonymized throughout.10 Interview, LP, ex-sarpanch (1995�2000), Silpari, Rewa, 11 October 2009.
Stuart Corbridge and Manoj Srivastava: The social order by fund flows 477
11 Based on interviews with SP, BJP leader, Delhi, Rewa, 4 October 2009; ShP, BJPleader, Kanti, Rewa, 5 October 2009; RSS, ex-janpad (block) member (2000�5), Delhi,Rewa, 6 October 2009; and RSK, ex-panch (Ward-14, 2000�5), Delhi, Rewa, 7 October2009.12 Interview with BM, ex-panchayat secretary, Ramhepur, Mandla, 3 October 2009.13 Interview with PD, ex-sarpanch (1994�9), Dongarmandla, Mandla, 13 October2009.14 Interview, NP, teacher, Dongarmandla, Mandla, 14 October 2009.15 The district chairmen and vice-chairmen of block panchayats, and the districtpanchayat, all adivasis, were found to have employed non-tribal staff from the districtoffices as their personal assistants. Non-tribal staff were preferred because of their‘experience and expertise’ in helping their bosses make money in ways that could noteasily be discovered in files and papers
References
Banerjee, K. & Saha, P. (2010). TheNREGA, the Maoists and thedevelopmental woes of the Indian state.Economic and Political Weekly, 45(28), 42�7.Beaman, L., Chattopadhyay, L.,Duflo, E., Pande, R. & Topolova, P.(2009). Powerful women: does exposurereduce bias? Quarterly Journal ofEconomics, 124(4), 1497�550.Besley, T. & Burgess, R. (2002). Thepolitical economy of governmentresponsiveness: Theory and evidencefrom India. Quarterly Journal ofEconomics, 117(4), 1415�51.Besley, T., Pande, R., Rahman, L. &Rao, V. (2004). The politics of publicgoods provision: Evidence from Indianlocal governments. Journal of the EuropeanEconomics Association Papers andProceedings, 2(2�3), 416�26.CAG (Comptroller and AuditorGeneral of India) (2000). Uniongovernment (civil) performance appraisals(3 of 2000). New Delhi: Government ofIndia.Chatterjee, P. (2008). Democracy andeconomic transformation in India.Economic and Political Weekly, 43(16),53�62.Corbridge, S., Srivastava, M., Veron,R. & Williams, G. (2003).Brainstorming, modified logframes andthe conversion of research hypotheses intofield questions: Reflections from easternIndia. Singapore Journal of TropicalGeography, 24(2), 65�80.
Corbridge, S., Williams, G.,Srivastava, M. & Veron, R. (2005).Seeing the state: Governance andgovernmentality in India. Cambridge:Cambridge University Press.Corbridge, S., Harriss, J. & Jeffrey, C.(2013). India today: Economy, politics, andsociety. Cambridge: Polity Press;New Delhi: Oxford University Press.Department of Panchayati Raj and
Rural Development, Government ofMadhya Pradesh (1996). A compendiumof important government orders andguidelines: Part-II. Bhopal: Governmentof Madhya Pradesh, in Hindi.Department of Panchayati Raj andRural Development, Government ofMadhya Pradesh (1997). A compendiumof government orders and circulars ondevolution of power to the newly constitutedthree tier panchayati raj system. Bhopal:Government of Madhya Pradesh,in Hindi.Department of Panchayati Raj and
Rural Development, Government ofMadhya Pradesh (1997�2002). Annualreports 1996�97, 1997�98, 1998�99,1999�2000, 2000�01, 2001�02. Bhopal:Government of Madhya Pradesh.Department of Rural Development,Government of Bihar (1993).Government instructions issued on EAS videLetter no. 8247 RD dt. 29. 9. 1993 byMr. H. C. Sirohi, IAS, Special Secretary,RD, GoB Patna: Government of Bihar.
478 Economy and Society
Department of Rural Development,Government of Bihar (1995).Government instructions issued on EAS videLetter no. 3248 RD dt.17.6.95 by Mr. NKAgrawal, IAS, Secretary, RD, GoB. Patna:Government of Bihar.Dreze, J. (2010). Employment guaranteeand the right to work. In N. G. Jayal &P. B. Mehta (Eds.), The Oxford companionto politics in India (pp. 510�18). Delhi:Oxford University Press.Harriss-White, B. (2003). India working.Cambridge: Cambridge University Press.Joshi, A. (2010). Do rights work? Law,activism, and the Employment GuaranteeScheme. World Development, 38(4),620�30.Keefer, P. & Khemani, S. (2004). Whydo the poor receive poor services?Economic and Political Weekly, 39(9),935�43.Keefer, P. & Khemani, S. (2005).Democracy, public expenditures and thepoor. World Bank Research Observer, 20(1),1�27.Khera, R. (Ed.) (2011). The battle foremployment guarantee. New Delhi: OxfordUniversity Press.Li, T. M. (2009). To make live or let die?Rural dispossession and the protection ofsurplus populations. Antipode, 41(1),66�93.
Lipton, M. (1996). Successes in anti-poverty. Geneva: International LabourOffice, Development and TechnicalCooperation Department.Melo, M.A., Ng’ethe, N. & Manor, J.(2012). Against the odds: Politicians,institutions and the struggle against poverty.London: Hurst.Migdal, J. (2001). State in society:Studying how states and societies transformand constitute one another. Cambridge:Cambridge University Press.Roy, A. & Dey, N. (2009). NREGA:Breaking new ground. The Hindu, 21June.Shah, A. (2010). In the shadows of thestate: Indigenous politics, environmentalismand insurgency in Jharkhand, India.Durham, NC: Duke University Press.Subrahmaniam, V. (2009a). Violenceand threats bring a government to itsknees. The Hindu, 16 December.Subrahmaniam, V. (2009b).The systemstrikes back. The Hindu, 17 December.Subrahmaniam, V. (2009c). NREGAaudit: Bhilwara leads the way. The Hindu,17 October.Topolova, P. (2008). India: Is the risingtide lifting all boats? IMF Working Paper,08/54.
Stuart Corbridge is Professor of International Development at the London
School of Economics and Political Science. His latest book, with John Harriss
and Craig Jeffrey, is India today: Economy, politics and society (2013, Cambridge:
Polity Press; New Delhi: Oxford University Press).
Manoj Srivastava is Chief Secretary, Government of Bihar, where he serves as
Commissioner, Departmental Enquiry. He is the co-author, with Stuart
Corbridge, Glyn Williams and Rene Veron, of Seeing the state: Governance
and governmentality in India (2005, Cambridge: Cambridge University Press).
Stuart Corbridge and Manoj Srivastava: The social order by fund flows 479