Embed Size (px)
Citation preview

1
Mapping the Interface Between the Intermediate Sulphur Water
Regime and Deep Brine in the Paleozoic Bedrock of Southwestern
Ontario
Oil, Gas and Salt Resources Library, Open File Data Release 2018-2
Terry R. Carter*, Liz Sutherland**
*Consulting Geologist, London, ON
**Oil, Gas and Salt Resources Library, London, ON
2018
Introduction and Purpose
Groundwater contained in Paleozoic bedrock formations and the overlying unconsolidated sediments
(“drift”) in southern Ontario exhibits increasing salinity with depth (Carter et al, 2014). There is a down-
dip transition from fresh water at or near the surface in the drift and shallow bedrock, to brackish to saline
sulphur water at intermediate depths, to dense brines in the deepest bedrock (Carter et al, 2015a, 2015b,
Carter et al, 2014, Sharpe et al, 2014) (Fig.1). The base of the fresh water regime, i.e. the depth at which
the water is no longer potable, has been previously mapped by Carter and Clark (2018) in southwestern
Ontario. This study attempts to map regional variations in the depth of the interface between the sulphur
water regime and the deep brine regime.
Figure 1: Conceptual model showing hydrochemical subsurface groundwater regimes in southern
Ontario: shallow fresh water regime, intermediate brackish to saline sulphur water regime, and deep brine
regime. Also shown is the Lockport Aquifer. Modified from Carter et al (2014).

2
The study area comprises that portion of the province of Ontario, underlain by Paleozoic sedimentary
rocks, occurring south and west of the Niagara Escarpment (Fig.2). The study provides, in map form and
at regional scale, an approximation of the subsurface interface between the brackish to saline sulphur
water at intermediate depths and the brine that occurs in the deepest Paleozoic rocks of southwestern
Ontario. The results can be used as a constraint in numeric modeling of the flow of groundwater in the
subsurface bedrock formations of southwestern Ontario.
In this report, description of water salinity uses the terminology of Carpenter (1978) and Freeze and
Cherry (1979) as adopted by Hiscock and Bense (2014):
Water type mg/l TDS
Fresh 0-1,000
Brackish 1,000-10,000
Saline 10,000-100,000
Brine > 100,000
Geological and Hydrogeological Setting
Southern Ontario is underlain by marine sedimentary rocks of the Appalachian Basin and Michigan Basin
(Fig.2). These Paleozoic sedimentary strata unconformably overlie crystalline metamorphic and igneous
rocks of the Canadian Shield, and are covered by a thin veneer of unconsolidated Quaternary and Recent
sediments in most of the area. Paleozoic bedrock strata consist of an interlayered succession of
sandstones, carbonates, evaporites, mudstones, and siltstones (Fig.3). The bedrock formations dip
shallowly to the southwest at 3 to 6 m/km along the crest of the Algonquin Arch, and at 3.5 to 12 m/km
down the flanks of the arch westward into the Michigan Basin and southward into the Appalachian Basin
(Armstrong and Carter, 2010).
The unconsolidated sediments are variably porous and permeable and water-saturated and are utilized as a
source of potable water by most of the water wells drilled in southwestern Ontario (Sharpe et al, 2014).
Aquifers in these sediments are complex and discontinuous. The contact with the underlying bedrock is a
low-relief angular unconformity resulting from subaerial exposure and erosion of the slightly inclined
Paleozoic strata over an extended period of geologic time. The interface between the fresh water-
dominated overburden and the relatively less permeable and less porous sedimentary bedrock forms a
regional water-bearing interval. This “contact aquifer”is the most widespread potable water aquifer in
southern Ontario (Husain, Cherry and Frape 2004; Brunton 2009a, 2009b; Carter, 2012).
Extensive karstic dissolution of the shallow bedrock has occurred in areas of thin overburden where
carbonate rocks form the uppermost bedrock layer (Brunton, Priebe and Yeung 2016; Brunton and Dodge
2008; Golder Associates and Ontario Geological Survey, 2008) resulting in greatly enhanced porosity and
permeability. These karstic strata form a system of potable water that extends below the drift/bedrock
contact. Fresh water occurs up to 130 metres below the top of the bedrock within areas of inferred karst
(Carter and Clark, 2018) as determined from GIS queries and quality assurance/quality control (QA/QC)
editing of water well records maintained by the Ministry of Environment, Conservation and Parks
(MECP) (Fig.4). The potable water regime in the shallow bedrock is the subject of ongoing investigations
by the Ontario Geological Survey (OGS) as part of its groundwater mapping program (Brunton, 2009a,
2009b; Brunton, Priebe and Yeung 2016; Priebe and Brunton, 2016; Priebe et al, 2017).
Paleokarst occurs at subsurface unconformities in the Paleozoic sedimentary strata where carbonate rock
has been exposed to prolonged periods of weathering in the geologic past (Fig.3). The porous and

3
permeable rock associated with these paleokarst horizons form the principal regional aquifers in the
subsurface bedrock formations. Each of these aquifers are recharged by fresh meteoric water at their
outcrop and subcrop edges. This water then flows down-dip and is interpreted to have previously flushed
out or diluted the original pore water at shallow to intermediate depths. The depth of penetration depends
on the permeability of the formation, past and present hydraulic gradients, and the counteracting
buoyancy effects caused by elevated salinity of the intermediate and deep groundwaters. Each
subcropping aquifer exhibits a downdip transition from fresh water at shallow depths, to brackish to
saline sulphur water at intermediate depths, to highly saline deep brines (Carter et al, 2015a). Sulphur
water is also locally reported by water well drillers within the drift (Singer et al, 2003). Cambrian
formations do not subcrop in southwestern Ontario and only contain brine.
The term "sulphur water” is used by drillers of water wells and petroleum wells to describe any water
containing dissolved H2S. The H2S imparts a distinctive “rotten egg” smell to the water that is readily
identifiable with little or no training and can be detected by humans at very low concentrations. In this
report sulphur water is used in a slightly more restricted sense to refer to brackish to saline water
containing dissolved H2S at intermediate depths and does not include brines associated with deep sour gas
reservoirs in southwestern Ontario. The sulphur water in the intermediate regime also contains elevated
concentrations of dissolved sulphate. Sulphur isotopic signatures indicate that this sulphate is derived
from dissolution of marine sulphates (Skuce, 2014), principally anhydrite, which is abundant in many of
the Devonian and Silurian strata of southwestern Ontario, in particular in the evaporitic Lucas Formation
and the Salina Group.
In areas of thicker overburden in southwestern Ontario, where karst is not well-developed (Golder
Associates and OGS, 2008), and in areas underlain by shaly bedrock formations, wells that penetrate the
bedrock more than a few metres encounter groundwater that contains dissolved H2S and is increasingly
saline. Conceptual modelling based on petroleum well data and geochemical and isotopic analyses has
documented an intermediate to deep system of thick regional aquitards and thin confined aquifers
containing brackish to highly saline water within the bedrock (Nuclear Waste Management Organization
2011; Hobbs et al. 2011; Carter et al. 2016; Carter 2012; Carter and Fortner 2012; Carter et al. 2014;
Sharpe et al. 2014; Skuce 2015; Skuce et al. 2015; Skuce, Potter and Longstaffe 2015). Brackish to saline
water containing variable amounts of dissolved H2S generally occurs at intermediate depths, overlapping
with a deep brine regime that contains brine with no dissolved H2S. Depth of this transition is the subject
of this study.
In deep continental bedrock aquifer systems similar to southern Ontario it is a common phenomenon that
the concentration of dissolved salts increases with depth, with dense brines occupying the deep bedrock.
There is likely little or no movement in these deep brine systems, even on a geologic time scale (Hiscock
and Bense, 2014).

4
Figure 2. Bedrock geology of southern Ontario, from Somers and Fortner (2017).

5
Figure 3. Lithostratigraphy of southern Ontario, from Carter et al (2018), showing regional
unconformities representing past periods of exposure, erosion, and/or karstification. Karst intervals in the
carbonate strata greatly enhance porosity and permeability and are the main geological control on regional
aquifers in the bedrock strata of southwestern Ontario.

6
Figure 4. Base of fresh water, metres below top of bedrock, based on water well data maintained
by the MOECC (Carter and Clark, 2018). Areas in blue identify the extent of the contact aquifer.
Areas in green, yellow and red indicate deep occurrences of fresh water in areas of inferred karst.
The large red feature between Goderich and London corresponds to the breathing well aquifer
identified by Freckelton (2013).
Open File List
1. Sulphur Water and Brine Report.pdf: This document contains a brief explanation of the data,
the maps, mapping and quality control methods, and a discussion of the results.
2. Figures: A folder with 8 maps in .jpg format, showing the occurrence of sulphur water, saline
water, and brine in the subsurface Paleozoic bedrock of southern Ontario, corresponding to
figures 6 to 13 in the report.
7
3. GIS Maps: A folder with data inputs used to generate the Nearest Neighbor surfaces and help
simplify usage. The folder contains shapefiles (.shp) and raster (.grd or .tif) files. Files were
created in and compatible with ArcMap 10.1. Also included are the water data points in Excel
(.xlsx) format. This folder is only accessible by members of the Oil, Gas and Salt Resources
Library.
Sources of Information
Petroleum Well Records
The Ministry of Natural Resources and Forestry (MNRF) regulates the drilling, operation and eventual
decommissioning of petroleum wells in the province of Ontario under the authority of the Oil, Gas and
Salt Resources Act and its regulations and standards. MNRF collects and manages data from petroleum
wells, including production of oil, natural gas and formation water. Source records for petroleum wells
drilled in Ontario are maintained at the Petroleum Operations Section of the MNRF in London, Ontario,
with public access via the Oil, Gas and Salt Resources Library (Library). Source records for this
information are paper reports stored in conventional hard-copy well files. There is a separate well file for
each unique petroleum well.
The earliest petroleum well records on file with the Ministry of Natural Resources and Forestry date to
1860, but systematic publication of well data by the Ontario government only began in 1915 when the
Ontario Bureau of Mines included a summary of well drilling activity in its annual report (Beards, 1967).
Petroleum Well Database
Digital petroleum well records are maintained on the Ontario Petroleum Data System (OPDS). OPDS is
an Oracle relational database with a custom Powerbuilder interface designed and maintained by the
Petroleum Operations Section of the MNRF. Data management and quality assurance is a shared
responsibility of MNRF and the Library. Public access to petroleum well data is managed by the Library.
OPDS contains information for all wells drilled under the authority of the Oil, Gas and Salt Resources
Act and Ontario Regulation 245/97. Within the act, a well is legally defined as “a hole in the ground,
whether completely drilled or in the process of being drilled, for the purpose of,
(a) the production of oil, gas or formation water, including the production of coal bed methane but
excluding the production of fresh water,
(b) the injection, storage and withdrawal of oil, gas, other hydrocarbons or other approved substances in
an underground geological formation,
(b.1) a compressed air energy storage project that is prescribed, or any part or portion of such a project as
may be prescribed,
(c) the disposal of oil field fluid in an underground geological formation,
(d) solution mining, or
(e) geological evaluation or testing rocks of Cambrian or more recent age
OPDS records provide geological, drilling and engineering information on approximately 27,000
petroleum and related wells drilled in Ontario since 1858. Stored data includes well location, status,
depths, geological formation tops, well construction, oil/gas/water intervals, logged and cored intervals,
and storage location of drill cuttings from bedrock formations penetrated by the well. Water interval data
includes depth, static level, water type and host geological formation. Every single paper record in the
MNRF petroleum well files is associated with a digital well record in OPDS. However, it is important to
note that petroleum well records contain very little information about unconsolidated sediments that
overlie the bedrock.
8
Basic data for petroleum wells in southern Ontario is available for public viewing at
www.ogsrlibrary.com. Oil, gas and water interval data and formation top depths are value-added data
available only to registered Library members or by purchase of select datasets. Water Interval Records
OPDS contains over 35,000 records of water-bearing intervals encountered during the drilling of
petroleum wells in Ontario (Carter et al, 2015a). Most of these records are obtained from wells drilled by
the cable tool method.
In the cable tool drilling method, the borehole is created by percussion without the use of hydraulic
pressure. Any water encountered while drilling will immediately enter the well bore. The depth interval at
which this occurs is recorded by the driller. It is usually only possible to accurately record the top of the
interval, as water will continue to enter the well bore until the interval is sealed by a casing. The drilling
process is sufficiently slow that the resulting water column stabilizes, and the driller can record the depth
to the top of the column of water as the static level. Almost all of the water interval data in OPDS was
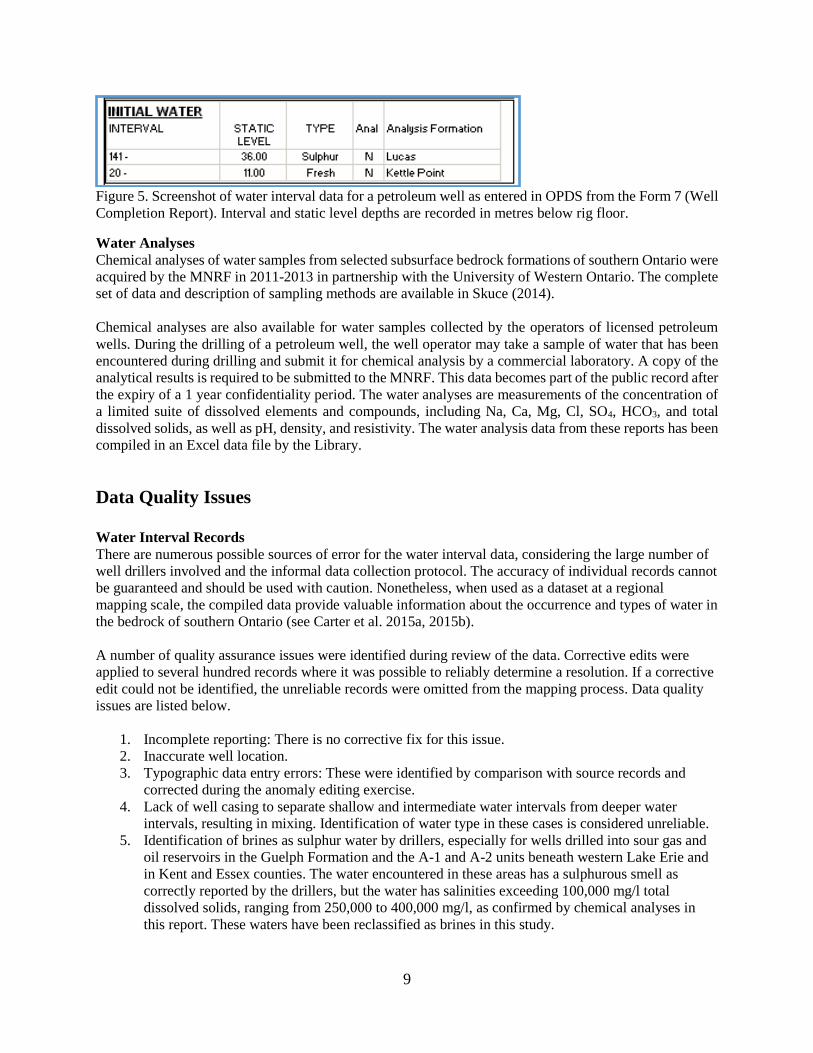
acquired in this way. The static level and water type for the water intervals is required to be reported by
the operator to MNRF (Fig.5). The observed results are summarized on the drilling and completion
reports in the well files and transcribed to OPDS.
Wells drilled with rotary drilling rigs use drilling muds under hydraulic pressure to prevent the
uncontrolled entry of any formation fluids into the well bore, and consequently do not usually provide any
information on water-bearing intervals. Examples of exceptions are detection of a sulphur smell from the
drilling mud, recorded at a specific drilling depth, or record of the depth of a lost circulation zone.
Drillers record a description of the water type from each of the water-bearing intervals they encounter
using terminology similar to that used by water well drillers. Water type descriptions provide a subjective
judgement of water quality and provide field evidence of microbial activity where identification of
sulphur water implies the presence of sulphate-reducing bacteria. Sulphur water is water containing
dissolved H2S and is readily identified by drillers by its distinctive “rotten egg” smell. Water types
recordable in OPDS are:
BLK – Black
BRA – Brackish
FRE – Fresh
LOS – Loss of circulation
MIN – Mineral
SAL – Salt (saline water and/or brine)
SUL – Sulphur (dissolved H2S, identified by rotten egg smell)
The geological formation within which the water occurs has been interpreted by MNRF or Library staff
by comparison of the water interval depths to the formation top depths recorded for the wells. The
terminology used to identify formations in the database is consistent with Armstrong and Carter (2010)
(Fig.3). The coding of the geological formation in the data record makes it possible to map aquifers and
aquitards in the Paleozoic bedrock as the occurrence of water, by type, in each geological formation
(Sharpe et al, 2014, Carter et al, 2014a, Carter et al, 2015a). It is also possible to construct static level
maps for these aquifers (Carter et al, 2015b).
9
Figure 5. Screenshot of water interval data for a petroleum well as entered in OPDS from the Form 7 (Well
Completion Report). Interval and static level depths are recorded in metres below rig floor.
Water Analyses
Chemical analyses of water samples from selected subsurface bedrock formations of southern Ontario were
acquired by the MNRF in 2011-2013 in partnership with the University of Western Ontario. The complete
set of data and description of sampling methods are available in Skuce (2014).
Chemical analyses are also available for water samples collected by the operators of licensed petroleum
wells. During the drilling of a petroleum well, the well operator may take a sample of water that has been
encountered during drilling and submit it for chemical analysis by a commercial laboratory. A copy of the
analytical results is required to be submitted to the MNRF. This data becomes part of the public record after
the expiry of a 1 year confidentiality period. The water analyses are measurements of the concentration of
a limited suite of dissolved elements and compounds, including Na, Ca, Mg, Cl, SO4, HCO3, and total
dissolved solids, as well as pH, density, and resistivity. The water analysis data from these reports has been
compiled in an Excel data file by the Library.
Data Quality Issues
Water Interval Records
There are numerous possible sources of error for the water interval data, considering the large number of
well drillers involved and the informal data collection protocol. The accuracy of individual records cannot
be guaranteed and should be used with caution. Nonetheless, when used as a dataset at a regional
mapping scale, the compiled data provide valuable information about the occurrence and types of water in
the bedrock of southern Ontario (see Carter et al. 2015a, 2015b).
A number of quality assurance issues were identified during review of the data. Corrective edits were
applied to several hundred records where it was possible to reliably determine a resolution. If a corrective
edit could not be identified, the unreliable records were omitted from the mapping process. Data quality
issues are listed below.
1. Incomplete reporting: There is no corrective fix for this issue.
2. Inaccurate well location.
3. Typographic data entry errors: These were identified by comparison with source records and
corrected during the anomaly editing exercise.
4. Lack of well casing to separate shallow and intermediate water intervals from deeper water
intervals, resulting in mixing. Identification of water type in these cases is considered unreliable.
5. Identification of brines as sulphur water by drillers, especially for wells drilled into sour gas and
oil reservoirs in the Guelph Formation and the A-1 and A-2 units beneath western Lake Erie and
in Kent and Essex counties. The water encountered in these areas has a sulphurous smell as
correctly reported by the drillers, but the water has salinities exceeding 100,000 mg/l total
dissolved solids, ranging from 250,000 to 400,000 mg/l, as confirmed by chemical analyses in
this report. These waters have been reclassified as brines in this study.
10
6. Lack of data for the base of water intervals. This creates uncertainty in the precision of mapping
of the base of the sulphur water regime.
7. Water containing dissolved salt, i.e. water with a salty taste, and which has no sulphur odour, is
identified by both water well and petroleum well drillers as “salt water”. The salinity is unknown,
and consequently cannot be accurately classified as brackish, saline or brine. This is the largest
source of error in accurate identification of deep brines vs brackish to saline “sulphur water” of
the intermediate regime and makes accurate mapping of the interface between the deep brine and
the intermediate groundwater regime problematic.
An iterative process of quality assurance edits was performed. After completion of each round of edits,
preliminary versions of the maps were interpolated. All “anomalies” represented by single wells on these
maps were reviewed and corrective edits applied. The maps were then regenerated for a further round of
anomaly checks and corrective edits.
Water Analyses
Sampling methods and data quality issues for the MNRF analytical data is described in Skuce (2014).
Water analyses reported by the operators of petroleum wells have a range of data quality concerns. Water
samples were collected by a wide variety of well operators and were obtained from a variety of sources or
collectors, including drill stem test chamber, wellhead valve, flow line, swab, bailer, production tank, and
separator, each of which may create issues with data quality. Samples collected during drilling operations
may be susceptible to contamination by drilling fluids. Dilution of the very saline deep brines typical of
southern Ontario is a possibility. The laboratory analyses were completed by a limited number of different
commercial laboratories between 1948 and 2001 with one sample collected and analysed in 1907. These
issues create uncertainty about the consistency and precision of individual results. Nonetheless, taken as a
group of data, the water analyses provide quantitative values for water salinity which are inherently more
precise than the qualitative judgements of well drillers for the water interval data, and provide valuable
insights into regional variations in salinity in bedrock groundwaters.
Mapping Methods
Creating geologically meaningful maps from the OPDS data is dependent on the design of GIS data filters
and selection methods to derive a subset of wells with the required attributes, and quality assurance
editing of this new dataset. For this mapping exercise, the data filtering procedure was designed to select
the deepest reported occurrences of sulphur water, and the shallowest reported occurrences of salt water at
each well location. If the resulting maps were reliable, the interface between the two maps would
approximate the base of the saline to brackish sulphur water regime and the top of the brine regime.
An interim map was prepared for each data set after the initial data filtering exercises. Anomalous data
were identified by visually reviewing the maps and editing or deleting individual records contributing to
contouring anomalies. This process was repeated four times before a geologically acceptable result was
obtained.
Three data interpolation algorithms are supplied with the Spatial Analyst extension of ArcMap 10.1;
inverse distance weighted, kriging and natural neighbours. After trial and error, it was determined that the
natural neighbours algorithm produced the most geologically meaningful results and was therefore used
to create interpolated surface and contour maps of the edited data.

11
Mapping Results Total Dissolved Solids – Lockport Group + Salina A-1 and A-2 Units
The Lockport Group, as redefined by Brunton and Brintnell (2011) (Guelph, Eramosa, Goat Island, and
Gasport formations), form a regional aquifer extending beneath all of southern Ontario (Fig.1). These
formations form a northwest-southeast subcrop-outcrop belt in southwestern Ontario and dip shallowly
southwest into the Chatham Sag (Fig.2). In the deepest part of the Chatham Sag the top of the Lockport
Group is over 750 metres below the surface and is overlain by thick beds of Salina Group halite (Fig.3).
There are a large number of oil and natural gas reservoirs with associated water in the Guelph Formation
and the immediately overlying Salina A-1 and A-2 units. For the purposes of this study, analyses of water
from all these formations has been compiled and grouped to map regional variations in total dissolved
solids.
The water analysis data was queried to select samples from only these formations. After QA/QC filtering,
analytical results were available for 139 samples. Of these, 2 are classified as fresh water, 21 as brackish
to saline water, and 116 as brine, as per Hiscock and Bense (2014). Eighty percent of the brine samples
have values ranging from 230,00 to 410,000 mg/l with a median value of 314,000 mg/l total dissolved
solids. The overwhelmingly large proportion of brine vs fresh water samples is a direct result of the
preferential sampling of deep formation water from oil and gas reservoirs.
The data was plotted and contoured to show the regional variation in total dissolved solids (Fig. 6).
Salinity increases downdip from approximately 200 mg/l total dissolved solids in the outcrop belt to a
maximum reported value of over 600,000 mg/l in the deep subsurface. The interface between brackish
and saline water of the intermediate sulphur water regime and deep brine occurs approximately 35 to 65
km downdip from the subcrop exposure of these formations. This correlates to a depth of approximately
250 to 300 metres below the top of bedrock.
Base of Sulphur Water
Depth values from the water interval data set, where water type was recorded as sulphur water by the
driller, were used to generate a map showing the deepest recorded intervals of sulphur water. Nearly 9000
data points were utilized (Fig. 7). Two maps have been created: the base of sulphur water measured in
metres below the top of bedrock and the base of sulphur water measured in metres subsea, but only the
first is shown here (Fig.8). No water analysis data was incorporated. It should be noted that there is an
inherent inaccuracy in these maps as only the top of the water interval is recorded in the data set. But as
the bedrock aquifers are at most a few metres or tens of metres thick, the maps provide a reasonable
approximation of the base of the sulphur water regime in the bedrock of southern Ontario.
Comparison to the base of fresh water mapping of Carter and Clark (2018) identified isolated areas where
the interpolated sulphur water raster surface extended above the fresh water raster surface, which is
inconsistent with the observed regional hydrochemical zonation. Within these areas a raster calculation
was used from the Spatial Analyst extension of ArcGIS 10.1 to reassign the base-of-sulphur-water pixels
to equal the value from the base-of-fresh-water raster.
QA/QC review of this qualitative data included a comparison to the water analysis data for samples from
the Lockport Group + Salina A-1 Unit + Salina A-2 Unit (see Fig.6). This comparison identified a large
number of wells where the driller identification of sulphur water, based on a rotten egg odour of the
water, coincided with areas where the analytical data documents the presence of dense brines. In west-
central Lake Erie, between Norfolk County and Essex County, the analytical data indicates the presence
of dense brines with total dissolved solids content ranging from 250,000 to over 400,000 mg/l (Fig.6).
Within this area all data points identified as sulphur water by the driller were reclassified as brine. Outside

12
this area, at scattered locations, there are a number of wells with sulphur water reported in these
formations which cannot be verified, but this data has been retained in the data set.
Figure 6. Raster surface and contour map of total dissolved solids in the Lockport Group + Salina A-1
Unit and Salina A-2 Unit in the subsurface of southern Ontario downdip from the subcrop belt of these
formations. Subcrop-outcrop belt of Lockport Group shown in green. Circles show location of data
points.
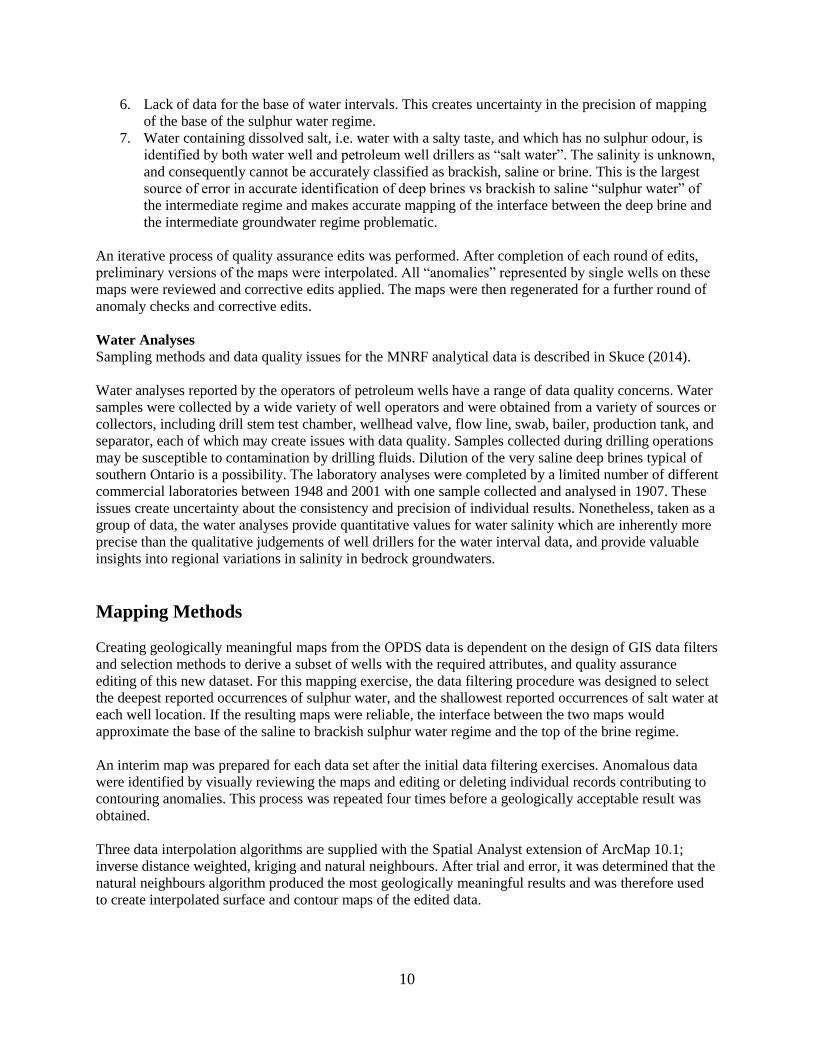
The map shows regional occurrence of sulphur water at depths ranging from the top of bedrock to
approximately 200 metres below the top of bedrock (Fig.8). This water is largely confined to the Dundee,
Lucas, Amherstburg and Onondaga formations, and to a lesser extent in the Bois Blanc and other
formations stratigraphically above the Salina Group (Fig.9). Sulphur water is also widely reported in the
overlying unconsolidated sediments within the water well records maintained by MECP (Singer et al,
2003). Within this regional distribution, there are a number of widely scattered, isolated, anomalously
deeper occurrences of sulphur water within the Lockport Group, principally with the Guelph Formation.

13
Figure 7. Map showing location of approximately 9000 petroleum wells for which sulphur water depth
data was utilized in this study.
There are two distinctive areas of deeper occurrence of sulphur water. In Huron and southern Bruce
counties is a distinctive NNW-SSE trending zone confined to the A-1 Carbonate Unit, at depths of 300 to
350 metres below the bedrock surface (Fig.10). This “Huron-Bruce Anomaly” occurs 25 to 50 km
southwest and downdip from the A-1 Carbonate subcrop belt. The second is a large zone beneath Lake
Erie where sulphur water occurs at depths from 200 to 285 metres below the top of bedrock. This water is
largely confined to the Bass Islands/Bertie Formation (Fig.11).
There are a number of wells reported to have encountered sulphur water at depths exceeding 300 metres
below the bedrock surface at scattered locations in Welland, Lincoln, Haldimand, Norfolk, Wentworth,
Oxford, Essex, and western Elgin counties, and eastern Lake Erie. These wells plot within a transition
zone between the deep brine and the shallow fresh water regime, in water with a salinity of less than
200,000 mg/l (Fig.12).
14
Figure 8. Deepest occurrence of sulphur water recorded in petroleum well records, measured in metres
below top of bedrock. The map indicates widespread occurrence of sulphur water at shallow to
intermediate depths in bedrock formations stratigraphically above the top of the Salina Group.

15
Figure 9. Subcrop belt and sulphur water in the Dundee, Lucas, Amherstburg, and Onondaga formations.
Figure 10. Subcrop belt and sulphur water in the Lockport Group and Salina A-1 Unit.

16
Figure 11. Subcrop belt and sulphur water in the Bass Islands/Bertie formations.
Figure 12. Wells at which sulphur water is reported to occur in the Lockport Group + Salina A-1
Unit and Salina A-2 Unit, shown with blue circles, vs. map of total dissolved solids in the same
formations.

17
Top of “Salt Water”
The OPDS water interval records include a subjective water type identified as “salt water”. This water
type includes all water containing dissolved salt, regardless of concentration, and which does not have an
odour of dissolved H2S. It includes both saline water and brine, and consequently cannot be used to
interpret or map the depth transition from brackish to saline water of the intermediate regime to the dense
brine of the deep regime.
Brine can be reliably identified in chemical analyses. The database of industry water analyses was filtered
to select analyses where the total dissolved solids exceeds 100,000 mg/l. This discounted nearly half of
the available data. Other quality constraints resulting in exclusion were: no recorded depth, and duplicate
analyses of the same water sample. Out of the 1024 records in the water analysis database, only 312
analyses were suitable for mapping after QA/QC filtering.
The geographic distribution of brine analyses from the above filtering exercise has been compared to a
raster plot of water interval records where the driller recorded a “salt water” interval. At individual wells
with more than one recorded salt water interval, only the shallowest depth value was utilized for mapping.
In addition, records for formations of Ordovician, Cambrian, or Precambrian age were excluded as these
formations always contain brine west of the Niagara Escarpment. In this way only the shallowest
occurrences of brine were included in the resulting rasterized data set.
The raster map shows a widespread occurrence of salt water at depths ranging from only a few metres
below the top of bedrock, to very deep, 820 metres below the top of bedrock. In contrast the analytical
data shows that most brine occurs at depths greater than 200 metres below the top of bedrock, with the
shallowest brine recorded at 40 metres below the top of bedrock. Only 14 of 312 available records show
brine at depths shallower than 200 metres below the bedrock top. These shallow brine occurrences are
scattered and isolated.
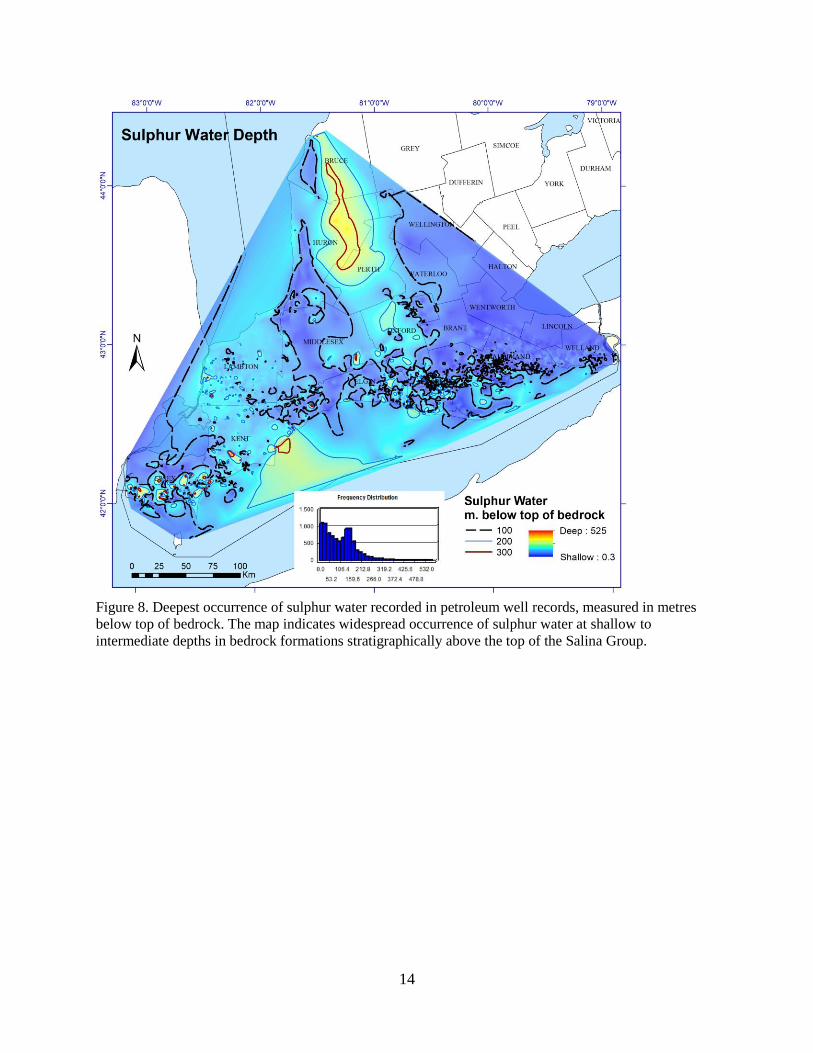
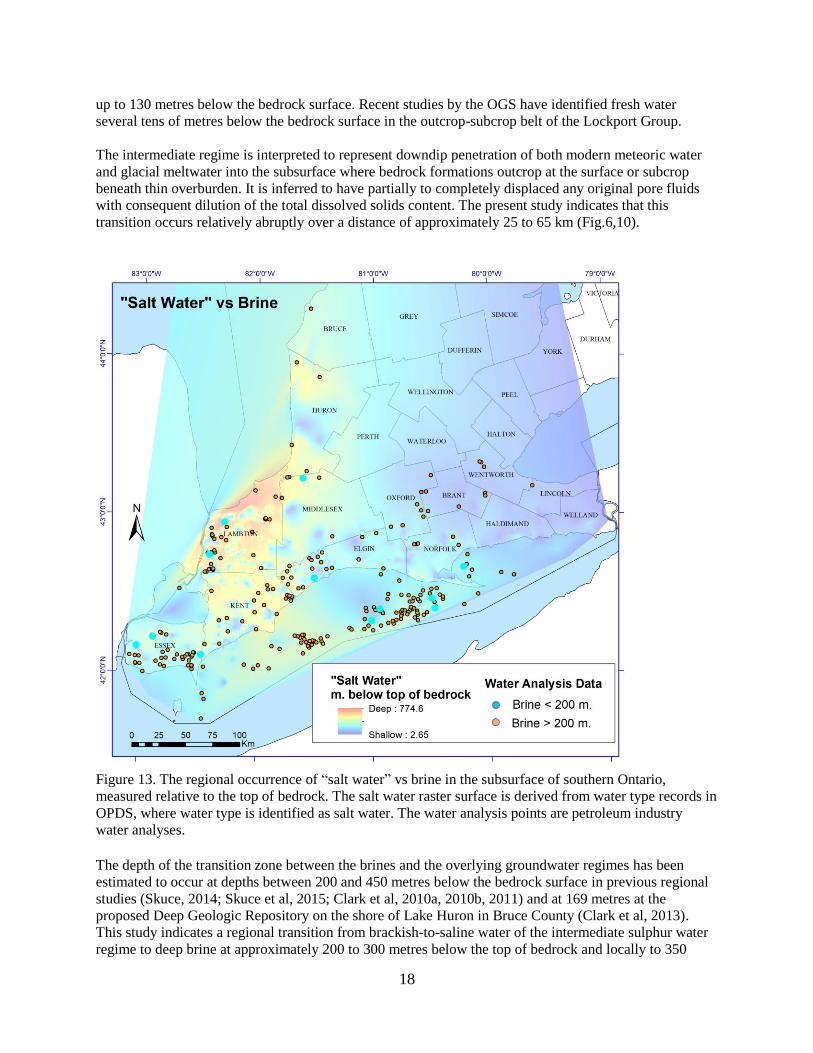
The areas of shallow “salt water” in Figure 13 coincide with the occurrence of brackish to saline water
lacking dissolved H2S, within the intermediate groundwater regime (Fig.9,10, 11), and does not reliably
indicate the presence of brine. The raster map is not considered to be useful in mapping the depth
transition from the intermediate sulphur water regime to the deep brine regime and is presented here for
information purposes only.
Discussion and Interpretation
Isotopic fingerprinting (δ18O and δ2H) of subsurface groundwater in bedrock formations of southwestern
Ontario indicates that shallow fresh water has a modern meteoric signature (Skuce, 2014; Skuce et al,
2014). Available samples from the intermediate sulphur water regime have cold-climate isotopic ratios of
oxygen and hydrogen indicating the water likely originated as glacial meltwater. The deep brine is
interpreted to be modified remnants of highly evaporated seawater (Dollar et al., 1991; Hobbs et al., 2011,
Skuce, 2014; Skuce et al, 2015) of Silurian age (Clark et al, 2013) and is inferred to have formed under
evaporitic conditions prevailing during deposition of the Salina Group and possibly also the Lucas
Formation.
There is a down-dip transition from shallow fresh water, to brackish-to-saline sulphur water at
intermediate depths, to highly saline brine in the deep groundwater regime (Hobbs et al, 2011; Carter et
al, 2014) (Fig.1). Fresh water is largely confined above the bedrock surface in most of southwestern
Ontario, with local exceptions where inferred karst and paleokarst have enabled penetration of fresh water
18
up to 130 metres below the bedrock surface. Recent studies by the OGS have identified fresh water
several tens of metres below the bedrock surface in the outcrop-subcrop belt of the Lockport Group.
The intermediate regime is interpreted to represent downdip penetration of both modern meteoric water
and glacial meltwater into the subsurface where bedrock formations outcrop at the surface or subcrop
beneath thin overburden. It is inferred to have partially to completely displaced any original pore fluids
with consequent dilution of the total dissolved solids content. The present study indicates that this
transition occurs relatively abruptly over a distance of approximately 25 to 65 km (Fig.6,10).
Figure 13. The regional occurrence of “salt water” vs brine in the subsurface of southern Ontario,
measured relative to the top of bedrock. The salt water raster surface is derived from water type records in
OPDS, where water type is identified as salt water. The water analysis points are petroleum industry
water analyses.
The depth of the transition zone between the brines and the overlying groundwater regimes has been
estimated to occur at depths between 200 and 450 metres below the bedrock surface in previous regional
studies (Skuce, 2014; Skuce et al, 2015; Clark et al, 2010a, 2010b, 2011) and at 169 metres at the
proposed Deep Geologic Repository on the shore of Lake Huron in Bruce County (Clark et al, 2013).
This study indicates a regional transition from brackish-to-saline water of the intermediate sulphur water
regime to deep brine at approximately 200 to 300 metres below the top of bedrock and locally to 350

19
metres (Fig.8), providing better resolution on the earlier regional work. Modern and ancient meteoric
water of the shallow to intermediate regimes is generally stratigraphically confined above the Salina
Group. The principal exception is downdip penetration in subcropping/outcropping porous and permeable
karstic strata of the Lockport Group, and more specifically the Guelph Formation.
The aquifers of these hydrochemical systems are stratigraphically isolated from each other in the
subsurface by low-permeability conditions in the evaporites of the Salina Group, Silurian shales of the
Rochester and Cabot Head formations, Ordovician shales of the Queenston, Blue Mountain and Georgian
Bay formations. Additional constraints on water movement are: the low topographic gradients in the
region; the density contrast between the brine and the shallow to intermediate waters; and a general lack
of discharge pathways for the brine (Hobbs et al., 2011; Sharpe et al., 2014; Clark et al, 2013)).
The salt water data in the water type records of the Ontario petroleum well database cannot be used as
reliable indicators of the presence of highly saline brine, and thus do not provide an accurate record of the
top of the deep brine regime. They do indicate the widespread occurrence of brackish to saline water at
relatively shallow depths in much of southwestern Ontario.
Acknowledgements
This research would not have been possible without the collection and management of petroleum well
records and the related petroleum well database (OPDS) established by the MNRF and the extensive
QA/QC enhancements completed by MNRF and the Oil, Gas and Salt Resources Library. Many past and
present staff members of the MNRF and the Oil, Gas and Salt Resources Library have contributed to this
effort. In addition, the cooperation of the Ontario petroleum industry in this data sharing process has been
fundamental to its success.
This work is a contribution to the GSC–OGS southern Ontario project on groundwater 2014–2019 and
was funded by the Geological Survey of Canada.
This report has been reviewed by Lee Fortner of MNRF and Frank Brunton of the Ontario Geological
Survey. Many of their comments and suggestions have been incorporated in the report and are gratefully
acknowledged.
References
Armstrong, D.K., and Carter, T.R. 2010. The subsurface Paleozoic stratigraphy of southern Ontario.
Ontario Geological Survey, Special Volume 7, 301 p.
Armstrong, D.K. and Dodge, J.E.P. 2007. Paleozoic geology of southern Ontario; Ontario Geological
Survey, Miscellaneous Release—Data 219.
Beards, R.J. 1967. Guide to the subsurface Palaeozoic stratigraphy of southern Ontario; Ontario
Department of Energy Resources Management, Paper 67-2, 19p.
Brunton, F.R. 2009a. Karst mapping and groundwater of southern Ontario; in Groundwater and Geology
– Foundation for Watershed Planning, Latornell Conference, pre-meeting core workshop, November 17,
2009, p.1-15.

20
——— 2009b. Update of revisions to the Early Silurian stratigraphy of the Niagara Escarpment:
Integration of sequence stratigraphy, sedimentology and hydrogeology to delineate hydrogeologic units;
in Summary of Field Work and Other Activities 2009, Ontario Geological Survey, Open File Report
6240, p.25-1 to 25-20.
Brunton, F.R. and Brintnell, C. 2011. Final update of Early Silurian stratigraphy of the Niagara
Escarpment and correlation with subsurface units across southwestern Ontario and the Great Lakes Basin;
in Summary of Field Work and Other Activities 2011, Ontario Geological Survey, Open File Report
6270, p.30-1 to 30-11.
Brunton, F.R., Brintnell, C., Jin, J. and Bancroft, A.M. 2012. Stratigraphic architecture of the Lockport
Group in Ontario and Michigan – A new interpretation of Early Silurian “basin geometries” and “Guelph
Pinnacle Reefs”; in 51st Annual Conference – Ontario – New York, Oil & Gas Conference, Oct. 23-25,
2012, Niagara Falls, Ontario, p.1-37.
Brunton, F.R. and Dodge, J.E.P. 2008. Karst of southern Ontario and Manitoulin Island; Ontario
Geological Survey, Groundwater Resources Study 5.
Brunton, F.R., Priebe, E.H. and Yeung, K.H. 2016. Relating sequence stratigraphic and karstic controls of
regional groundwater flow zones and hydrochemistry within the Early Silurian Lockport Group of the
Niagara Escarpment, southern Ontario; in Regional-scale Groundwater Geoscience in Southern Ontario:
An Ontario Geological Survey and Geological Survey of Canada groundwater geoscience open house,
Geological Survey of Canada, Open File 8022, p.4. doi:10.4095/297722.
Carpenter, A.B. 1978. Origin and chemical evolution of brines in sedimentary basins. In Thirteenth
annual forum on the geology of industrial minerals, eds. K.A. Johnson and J.A. Russell, Oklahoma
Geological Survey, Circular 79, p.60-77.
Carter, T.R., 2012. All is well – Regional groundwater systems in southern Ontario, in Ontario Oil & Gas
2012, Ontario Petroleum Institute, p.44-48.
Carter, T.R., and Clark, J., 2018. Base of fresh water, bedrock karst, and the contact aquifer in southern
Ontario, as interpreted from water well records; Oil, Gas and Salt Resources Library, unpublished report.
Carter, T.R., Fortner, L., Skuce, M.E., and Longstaffe, F.J., 2014. Aquifer systems in southern Ontario:
hydrogeological considerations for well drilling and plugging, Canadian Society of Petroleum Geologists,
Geoconvention 2014, abstract, accessed at:
http://www.geoconvention.org/archives/2014abstracts/298_GC2014_Aquifer_Systems_in_Southern_Ont
ario.pdf
Carter, T.R., Wang, D., Castillo, A.C., and Fortner, L., 2015a. Water Type Maps of Deep Groundwater
from Petroleum Well Records, Southern Ontario; Oil, Gas and Salt Resources Library, Open File Data
Release 2015-1.
Carter, T.R., Wang, D., Castillo, A.C., and Fortner, L., 2015b. Static level maps of deep groundwater
from petroleum well records, Southern Ontario; Oil, Gas and Salt Resources Library, Open File Data
Release 2015-2.

21
Clark, I.D., Al, T., Jensen, M., Kennell, L., Mazurek, M., Mohapatra, R., and Raven, K.G., 2013.
Paleozoic-aged brine and authigenic helium preserved in an Ordovician shale aquiclude. Geology, vol.41,
no.9, p.951-954.
Clark, I., Mohapatra, R., Mohammadzadeh, H., Kotzer, T., 2010a. Porewater and Gas Analyses in DGR-1
and DGR-2 Core. Technical Report TR-07-21, Intera Engineering Ltd., Ottawa.
Clark, I., Liu, I., Mohammadzadeh, H., Mohapatra, R., Zhang, P., Wilk, M., 2010b. Porewater and Gas
Analyses in DGR-3 and DGR-4 Core. Technical Report TR-08-19, Intera Engineering Ltd., Ottawa.
Clark, I., Scharf, V., Zuliani, J., Herod, M., 2011. Porewater and Gas Analyses in DGR-3 and DGR-4
Core. Technical Report TR-09-04, Intera Engineering Ltd., Ottawa.
Freckelton, Candace N., 2013. A Physical and Geochemical Characterization of Southwestern Ontario's
Breathing Well Region, University of Western Ontario, Electronic Thesis and Dissertation Repository.
1105, https://ir.lib.uwo.ca/etd/1105Freckelton, 242 p.
Freeze, R.A., and Cherry, J.A., 1979. Groundwater. Prentice-Hall Inc, Englewood Cliffs, New Jersey,
USA, 603 pp.
Golder Associates Ltd, and Ontario Geological Survey, 2008. 3-D field investigation of Paleozoic
bedrock and boreholes in thin-drift limestone-dolostone plains of southern Ontario; Ontario Geological
Survey, Supplementary Report to Groundwater Resources Study 5, 53 p.
Hiscock, K.M., and Bense, V.F., 2014. Hydrogeology: Principles and practice, Wiley Blackwell, Oxford,
U.K., 518 p.
Hobbs, M.Y., Frape, S.K., Shouakar-Stash, O., and Kennell, L.R., 2011. Regional hydrogeochemistry-
southern Ontario. Nuclear Waste Management Organization, Report NWMO DGR-TR-2011-12, Toronto,
Canada, http://www.nwmo.ca/uploads/DGR%20PDF/Geo/Regional-Hydrogeochemistry---Southern-
Ontario.pdf, accessed on June 11, 2013.
Husain, M.M., Cherry, J.A. and Frape, S.K. 2004. The persistence of a large stagnation zone in a
developed regional aquifer, southwestern Ontario; Canadian Geotechnical Journal, v.41, p.943-958.
Johnson, M.D., Armstrong, D.K., Sanford, B.V., Telford, P.G., and Rutka, M.A., 1992. Paleozoic and
Mesozoic geology of Ontario; in Geology of Ontario, Ontario Geological Survey Special Volume 4, Part
2, p.907-1010.
Nuclear Waste Management Organization, 2011b. Geosynthesis; Nuclear Waste Management Report
NWMO DGR-TR-2011-11, Toronto, Canada, Accessed June 11, 2013 at:
http://www.nwmo.ca/uploads/DGR%20PDF/Geo/Geosynthesis.pdf
Priebe, E.H. and Brunton, F.R. 2016. Regional-scale groundwater mapping in the early Silurian
carbonates of the Niagara Escarpment: Final update; in Summary of Field Work and Other Activities,
2016, Ontario Geological Survey, Open File Report 6323, p.29-1 to 29-10.
Priebe, E.H., Neville, C.J., and Brunton, F.R., 2017. Discrete, high-quality hydraulic conductivity
estimates for the Early Silurian carbonates of the Guelph region; Ontario Geological Survey,
Groundwater Resources Study 16, 45 p.

22
Sharpe, D.R., Piggott, A., Carter, T.R., Gerber, R.E., MacRitchie, S.M., de Loe, R., Strynatka, S. and
Zwiers, G. 2014. Southern Ontario hydrogeological region, p.444-499, in Rivera, A. (editor), Canada’s
Groundwater Resources, Fitzhenry and Whiteside, Canada, 803 p.
Singer, S.N., Cheng, C.K., and Scafe, M.G., 2003. The hydrogeology of southern Ontario; Ontario
Ministry of Environment, Environmental Monitoring and Reporting Branch, 395 p.
Skuce, M., 2014. Isotopic fingerprinting of shallow and deep groundwaters in southwestern Ontario and
its applications to abandoned well remediation. University of Western Ontario, MSc thesis, Electronic
thesis and dissertation repository, Paper 1926, 267 pp.,
http://ir.lib.uwo.ca/do/search/?q=skuce&start=0&context=686929
Skuce, M., Longstaffe, F.J., and Potter, J., 2015. The isotopic characterization of water in Paleozoic
bedrock formations of southwestern Ontario; Oil, Gas and Salt Resources Library, Open File Data
Release 2015-3.
Skuce, M., Longstaffe, F.J., Carter, T.R., and Potter, J., 2015. Isotopic fingerprinting of groundwaters in
southwestern Ontario: application to abandoned well remediation; Applied Geochemistry 58, p.1-13.
Somers, M., and Fortner, L. Paleozoic bedrock geology of southern Ontario; Oil, Gas and Salt Resources
Library, Open File Data Release 2017-2.
Suggested Citation
Parts of this publication may be quoted and individual .jpg maps may be reproduced in reports if credit is
given. It is recommended that reference to this report be made in the following form:
Carter, T.R., and Sutherland, L., 2018. Mapping the interface between the intermediate sulphur water
regime and deep brine in the Paleozoic bedrock of southwestern Ontario; Oil, Gas and Salt Resources
Library, Open File Data Release 2018-2.