Embed Size (px)
Citation preview

REPORT
MAPPING THE DONOR LANDSCAPE IN GLOBAL HEALTH: HIV/AIDS
June 2013

PREPARED BY
Jen Kates
Josh Michaud
Adam Wexler
Allison Valentine
MAPPING THE DONOR LANDSCAPE IN GLOBAL HEALTH: HIV/AIDS
Mapping the Donor Landscape in Global Health: HIV/AIDS 1
OVERVIEW OF SERIESWhich donors are working in which countries and on what issues? How can country recipients of aid best identify those donors? Are donor governments themselves adequately aware of one another’s presence and efforts on identical issues? These questions reflect key challenges facing donors of international assistance, country recipients of assistance, civil society, and other stakeholders working in the development field, and highlight issues that can make it difficult to effectively negotiate, coordinate, and deliver programs. In the health sector such issues are particularly relevant given the proliferation in the number of donors providing health aid to low- and middle-income countries, and the amount of that aid during the last decade.1,2 Such issues carry a new significance in the current era of economic austerity, one that has led donors and recipients to seek more streamlined approaches to health assistance that achieve “value for money.”3
To provide some perspective on the geographic presence of global health donors and to help stakeholders begin to answer some of the above questions, the Kaiser Family Foundation is undertaking a series of analyses to describe the global health “donor landscape.” Using three years of data from the Organisation for Economic Co-operation and Development (OECD), we map the geographic landscape of global health donor assistance, looking both at donor presence and magnitude of donor assistance by issue area, region, and country. The effort is intended to shed new light on donor presence within and across recipient countries, and to produce a set of figures and tools that stakeholders can use in both donor and recipient countries.
From at least the early 2000s, there have been organized efforts to push for greater transparency and better coordination between donors, and between donors and recipients. These calls contributed to a series of international declarations on aid effectiveness such as the 2002 Monterrey Consensus on Financing for Development and the 2005 Paris Declaration on Aid Effectiveness, in which donors and recipient nations agreed to adhere to a code of good practice and a set of principles that would guide and improve donor assistance.4,5 In part, the principles were designed to help alleviate some of the administrative burdens on countries from having multiple donors, and to increase the impact derived from donor funding.6,7 They have also, more recently, focused on the importance of donor transparency for increasing “country ownership” by recipients of aid; that is, a country-led response to designing and implementing development programs.4,8,9,10
In global health, uncoordinated donor activities can reduce efficiency and result in missed opportunities to leverage partnerships, streamline processes, and share experiences.11,12,13 While there have been several health-focused efforts aiming to improve donor coordination and donor transparency these challenges continue today and have gained new significance given the current economic environment.14,15,16,17 Indeed, with signs that donor assistance is flattening, there has been an even higher premium placed on improving coordination and leveraging existing funding and programs.
This, the first report in this series of analyses, focuses on international assistance for HIV. Future analyses are planned for geographic donor landscapes in the areas of tuberculosis, malaria, and family planning and reproductive health assistance.

Mapping the Donor Landscape in Global Health: HIV/AIDS 2
HIV/AIDS Donor Landscape: Key FindingsThe donor landscape for HIV/AIDS is varied and complex, with multiple donors providing assistance to many different regions and countries, and an average of 10 donors providing aid for HIV per recipient country. Despite the high number of donors in this space, however, the actual amount of funding provided for HIV/AIDS is concentrated among a small number of donors, with just two – the United States and the Global Fund to Fight AIDS, Tuberculosis and Malaria (Global Fund) – accounting for 80% of funding. Looking at donors across the most recent three-year period with available data (2009-2011), we found:
» 37 different donors (including 26 bilateral donor governments and 11 multilateral organizations) reported providing HIV/AIDS assistance in at least one year examined. 30 donors reported giving assistance in all three years.
» Donors provided assistance to a total of 143 recipient countries, spanning nine regions, over the three-year period; 123 countries received assistance in all three years. On average, each of the 37 donors provided assistance to 6 different regions and 40 different countries over the period. The geographic diversity of assistance differed slightly by channel of assistance, with bilateral donors concentrating their assistance in a smaller number of countries (an average of 34 recipients over the three years) compared to multilateral donors (an average of 52 recipients over the three years).
» The five donors with the greatest presence, as measured by number of recipient countries, were: UNAIDS (119), UNICEF (114), Canada (108), the Global Fund (108), and Sweden (96). However, when measured by magnitude of assistance provided (as a share of annual average funding between 2009 and 2011), the five donors with the highest amount of assistance were: U.S. (61%), Global Fund (19%), U.K. (4%), UNAIDS (3%), and the World Bank (2%).
» The U.S. is by far the largest donor, providing almost two-thirds of all HIV/AIDS international assistance (61%); the next largest donor, the Global Fund, provided one fifth of all assistance. Together they account for an average of 80% of global HIV/AIDS assistance, and comprise more than 60% of the funding received in every region except Oceania (where Australia was the top donor) over the three year study period.
» Sub-Saharan Africa had the greatest number of donors of any region; 34 of the 37 donors provided HIV/AIDS assistance to the region over the period. The region with the next highest number of donors was South & Central Asia, with 29.
» In addition to having the greatest number of donors, sub-Saharan Africa also received the greatest share of assistance of any region (57%). The next highest regional amounts went to South & Central Asia (6%) and Far East Asia (5%). Donors provided approximately 25% of HIV assistance without specifying any region or country.
Table 1. Key FindingsDonorsTotal Number of Donors 37
Bilateral Donors 26 Multilateral Donors 11
Average Recipients per Donor 40 Average Recipients per Bilateral 34 Average Recipients per Multilateral 52
U.S. & Global Fund % of Total Funding 80%RecipientsTotal Number of Recipients 143Average Donors per Recipient 10Recipients with 10 or More Donors 70Recipients with 20 or More Donors 14

Mapping the Donor Landscape in Global Health: HIV/AIDS 3
Recipient countries typically received assistance from many different donors. Looking at recipients of HIV/AIDS assistance over the period 2009-2011, we found:
» The average number of donors present in each recipient country (i.e. with reported assistance in at least one of the years studied) was 10 [range: 1 donor to 27 donors]. 14 recipient countries had 20 or more donors over the study period, and there were 70 countries with 10 or more donors (see Figure 1). The countries with 20 or more donors present were: Ethiopia (27), Kenya (26), Malawi (25), Mozambique (25), Tanzania (25), Zimbabwe (25), Rwanda (23), South Africa (23), Uganda (23), Vietnam (23), Zambia (23), India (22), Burkina Faso (21), and Mali (21).
» When measured by magnitude of assistance received (the average share of total HIV/AIDS assistance received over the study period), the top 15 recipient countries, 12 of which are in Africa, accounted for 52% of total assistance: South Africa (8%), Kenya (6%), Nigeria (5%), Ethiopia (5%), Tanzania (4%), India (4%), Uganda (4%), Zambia (3%), Mozambique (3%), Rwanda (2%), Malawi (2%), Botswana (2%), Haiti (2%), Namibia (1%), and Vietnam (1%).
» Countries in the sub-Saharan African region had the highest concentration of donors (15 donors per country), and this region was home to the six countries with the greatest number of donors: Ethiopia (27), Kenya (26), Malawi, Mozambique, Tanzania and Zimbabwe (all with 25 donors). The regions with the next highest average concentrations of donors were Far East Asia (13 donors) and South & Central Asia (11 donors).
» The predominant donor presence by region varied. For example, the U.S. provided the largest share of assistance in sub-Saharan Africa (63%) and North & Central America (56%). By contrast, the Global Fund provided the largest share of assistance in Europe (75%), the Middle East (65%), North Africa (60%), South America (48%), South & Central Asia (48%), and Far East Asia (40%). Oceania received most of its funds (74%) from Australia.
The large number of donors and the geographic breadth of their assistance suggest that ensuring adequate communication with and coordination among multiple donors may be important in reducing administrative and opportunity costs faced by recipient countries, achieving additional efficiencies, and helping to foster country ownership by partner countries. At the same time, the concentration of donor funding for HIV among a very small number of donors – particularly, the United States and the Global Fund – suggests potential vulnerability should the scope and/or magnitude of their funding commitments change in the future.16
As donors and recipient countries look forward to the future, and seek ambitious goals for their HIV/AIDS programs such as working toward an “AIDS-Free Generation,”18 it will be more important than ever to ensure there is adequate and fruitful coordination between donors and recipients in order to achieve the greatest return possible on the global investments being made in the HIV/AIDS response.

Mapping the Donor Landscape in Global Health: HIV/AIDS 4
Figure 1: Number of HIV Donors in Each Recipient Country, 2009-2011
1-5 donors (38 countries) 6-10 donors (41 countries) 11-15 donors (31 countries) 16-20 donors (19 countries)
NA
> 20 donors (14 countries)
Figure 1: Number of HIV Donors in Each Recipient Country, 2009-2011

Mapping the Donor Landscape in Global Health: HIV/AIDS 5
Introduction The previous decade saw growing attention to and increasing amounts of donor funding being directed towards HIV/AIDS, which now attracts the greatest share of official development assistance (ODA) of any global health program area. According to analyses by the Kaiser Family Foundation and UNAIDS, funding for international HIV/AIDS assistance provided by donor governments increased more than six-fold between 2002 and 2008. These increases were in part driven by the establishment of important new efforts, most notably, the creation of the U.S. President’s Emergency Plan for AIDS Relief (PEPFAR) program and the Global Fund. Yet, at the same time, donor funding for HIV/AIDS has begun to level with the onset of the global financial crisis and has generally remained at 2008 levels through the present.19
As donor assistance for HIV/AIDS increased over the last decade, concerns grew about issues of coordination, duplication of effort, and burdensome requirements on recipient countries.1,20,21 These concerns are even more important than ever, as donors and recipients seek to streamline approaches to health assistance and achieve greater “value for money” 3 as well as foster greater transparency to support country ownership by partner countries. Despite the creation of important initiatives to improve coordination and alignment of donor efforts in HIV/AIDS, specifically, and health more generally – including the UNAIDS “Three Ones” framework and the International Health Partnership (IHP+) – similar concerns about coordination and alignment remain today.14,15,17 For example, the Institute of Medicine’s recent evaluation of PEPFAR reports that officials from countries receiving HIV/AIDS assistance often had difficulty tracking the funding and the services supported by the various donor agencies present in their countries.16
This report maps the geographic donor landscape of HIV/AIDS assistance, based on analysis of the most recent available data, looking both at donor presence and magnitude of donor assistance. It is intended to serve as an easy-to-use information source and tool for policymakers and other stakeholders in both donor and recipient countries.
MethodsThis analysis uses data from the Organisation for Economic Co-operation and Development (OECD) Creditor Reporting System (CRS) database, the main source for comparable data across all major donors of international assistance. The data represents development assistance disbursements as reported to the OECD by donors for 2009, 2010, and 2011. Three consecutive years of data were used in order to smooth out potential reporting inconsistencies and to address the fact that, while a donor may report assistance in one year but not the subsequent year, it does not necessarily mean that the donor no longer has a presence in that recipient country (e.g. programs funded by a disbursement in one year may still be active several years after the disbursement is reported.) Data were extracted on May 31, 2013.
To measure the landscape of donor presence, we used two principal measures:
» Presence: To measure the extent of donor geographic presence we calculated the cumulative number of donors, by identifying how many donors reported assistance in at least one of the three years studied. We also calculated the cumulative number of recipients by identifying the number of countries to which assistance was directed in at least one of the three years studied. We used cumulative presence rather than presence in any single year to smooth out reporting inconsistencies and to garner a more comprehensive view of donor provision of international assistance.

Mapping the Donor Landscape in Global Health: HIV/AIDS 6
» Magnitude: To measure the magnitude of donor assistance, we calculated an average annual disbursement for each donor over the three years studied (i.e. total disbursements over the period, divided by three). Using a three-year average reduces the influence of possible one-time fluctuations in funding and reporting. Data used to calculate average disbursements over the three year period are in real dollars in order to take into account inflation and exchange rate fluctuations.
The appendix tables at the end of the report provide summaries of both measures. “Heat maps” are used to present a visual representation of the scale of funding, in addition to donor presence.
Data represent “official development assistance” (ODA) as reported by donors to the OECD. The OECD defines ODA as assistance provided to low- and middle-income countries, as determined by per capita Gross National Income (GNI), excluding any assistance to countries that are members of the Group of Eight (G8) or the European Union (EU), including those with a firm date for EU admission. Assistance includes direct financial support as well as the provision of goods and services (e.g. technical assistance, in-kind contributions, etc.) and may be reported as ODA to the OECD if it is concessional in nature (includes a grant element).
Donors report both commitment and disbursement ODA data to the OECD. Disbursements reflect the actual transfer of funds or purchase of goods or services for a recipient country whereas a commitment represents a budgetary decision that funding will be provided regardless of the time at which the disbursement occurs. For the purposes of this analysis, disbursement rather than commitment data were used reflecting the actual available resources for HIV/AIDS in a recipient country in a given year.
The CRS database includes data on ODA from 28 bilateral donor governments, including the 26 members of the OECD Development Assistance Committee (DAC) and 2 non-DAC members (Kuwait and the United Arab Emirates), as well as 30 multilateral organizations.* Data for the European Commission (EC) represent funds from the European Union’s budget, as distinct from funding from its member state budgets (which are attributed to individual member assistance). The CRS database includes EC funding as part of the multilateral sector; for the purposes of this paper, the EC is considered a donor government rather than a multilateral organization.
Data in the CRS database include donor government bilateral disbursements only and do not include disbursements to multilateral organizations; disbursements by multilateral institutions are attributed to those institutions, not the originating donor government (where donor governments do specify such contributions for health and account for them as part of their bilateral budgets, they are included in their bilateral assistance totals). As such, HIV/AIDS funding levels presented in this analysis may not match those reported by donor governments who include multilateral contributions in their totals.†
* DAC members: Australia, Austria, Belgium, Canada, Czech Republic, Denmark, European Union (EU), Finland, France, Germany, Greece, Iceland, Ireland, Italy, Japan, Korea, Luxembourg, Netherlands, New Zealand, Norway, Portugal, Spain, Sweden, Switzerland, United Kingdom, and United States.
Multilateral donors reporting to the DAC: African Development Bank (AfDB), African Development Fund (AfDF), Arab Fund for Economic and Social Development (AFESD), Asian Development Bank (AsDB), ASDB Special Funds, Arab Bank for Economic Development in Africa (BADEA), European Bank for Reconstruction and Development (EBRD), Global Alliance for Vaccines and Immunisation (GAVI), Global Environment Facility (GEF), Global Fund, International Bank for Reconstruction and Development (IBRD), International Development Association (IDA), Inter-American Development Bank (IDB), IDB Sp. Fund, International Fund for Agricultural Development (IFAD), International Monetary Fund (IMF), Isl. Development Bank, Nordic Development Bank, OPEC Fund for International Development (OFID), OSCE, UNAIDS, UNDP, UNECE, UNFPA, UNHCR, UNICEF, UNPBF, UNRWA, WFP, and WHO.
† Since this analysis relies solely on OECD data, the total HIV/AIDS funding levels presented will not match those in the annual Kaiser Family Foundation-UNAIDS analysis of donor funding for HIV/AIDS. OECD data does not include all forms of international assistance (e.g. funding to countries such as Russia and the Baltic States that are no longer included in the CRS database) and may not include certain funding streams provided by donors, such as HIV components of mixed grants to non-governmental organizations, which collects funding data directly from donor governments providing a more comprehensive total funding level for HIV/AIDS.

Mapping the Donor Landscape in Global Health: HIV/AIDS 7
This analysis combines data derived from two OECD CRS subsectors to capture “HIV/AIDS” assistance: (1) STD Control Including HIV/AIDS, a subsector of Population Policies/Programs and Reproductive Health; and (2) Social Mitigation of HIV/AIDS, a subsector of the Other Social Infrastructure and Services sector.
Table 2. OECD Creditor Reporting System (CRS) Database Sectors and Sub-Sectors Used In This ReportDAC CODE CRS CODE DESCRIPTION CLARIFICATIONS / ADDITIONAL NOTES ON COVERAGE
130 POPULATION POLICIES/PROGRAMMES AND REPRODUCTIVE HEALTH
13040 STD control including HIV/AIDS All activities related to sexually transmitted diseases and HIV/AIDS control e.g. information, education and communication; testing; prevention; treatment, care.
160 OTHER SOCIAL INFRASTRUCTURE AND SERVICES
16064 Social mitigation of HIV/AIDS Special programmes to address the consequences of HIV/AIDS, e.g. social, legal and economic assistance to people living with HIV/AIDS including food security and employment; support to vulnerable groups and children orphaned by HIV/AIDS; human rights of HIV/AIDS affected people.
The Africa, America, and Asia regions each have “regional funding” amounts reported in the DAC separate from the country-specific funding amounts; these regional funds are included in the totals where appropriate.
Mapping the Donor Landscape in Global Health: HIV/AIDS 8
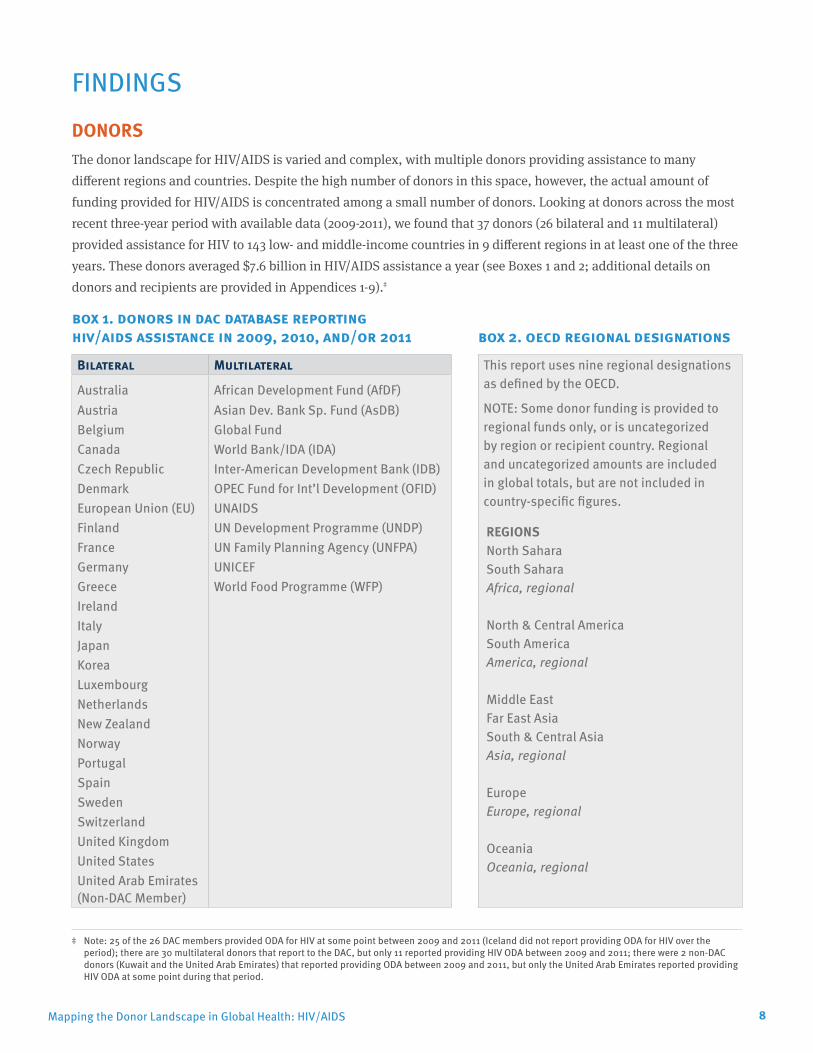
FINDINGSDONORSThe donor landscape for HIV/AIDS is varied and complex, with multiple donors providing assistance to many different regions and countries. Despite the high number of donors in this space, however, the actual amount of funding provided for HIV/AIDS is concentrated among a small number of donors. Looking at donors across the most recent three-year period with available data (2009-2011), we found that 37 donors (26 bilateral and 11 multilateral) provided assistance for HIV to 143 low- and middle-income countries in 9 different regions in at least one of the three years. These donors averaged $7.6 billion in HIV/AIDS assistance a year (see Boxes 1 and 2; additional details on donors and recipients are provided in Appendices 1-9).‡
box 1. donors in dac database reporting hiv/aids assistance in 2009, 2010, and/or 2011 box 2. oecd regional designationsBilateral Multilateral This report uses nine regional designations
as defined by the OECD.
NOTE: Some donor funding is provided to regional funds only, or is uncategorized by region or recipient country. Regional and uncategorized amounts are included in global totals, but are not included in country-specific figures.
REGIONS North Sahara South Sahara Africa, regional North & Central America South America America, regional Middle East Far East Asia South & Central Asia Asia, regional Europe Europe, regional Oceania Oceania, regional
Australia African Development Fund (AfDF)Austria Asian Dev. Bank Sp. Fund (AsDB)Belgium Global FundCanada World Bank/IDA (IDA)Czech Republic Inter-American Development Bank (IDB)Denmark OPEC Fund for Int’l Development (OFID)European Union (EU) UNAIDSFinland UN Development Programme (UNDP)France UN Family Planning Agency (UNFPA)Germany UNICEFGreece World Food Programme (WFP)IrelandItalyJapanKoreaLuxembourgNetherlandsNew ZealandNorwayPortugalSpainSwedenSwitzerlandUnited KingdomUnited StatesUnited Arab Emirates (Non-DAC Member)
‡ Note: 25 of the 26 DAC members provided ODA for HIV at some point between 2009 and 2011 (Iceland did not report providing ODA for HIV over the period); there are 30 multilateral donors that report to the DAC, but only 11 reported providing HIV ODA between 2009 and 2011; there were 2 non-DAC donors (Kuwait and the United Arab Emirates) that reported providing ODA between 2009 and 2011, but only the United Arab Emirates reported providing HIV ODA at some point during that period.

Mapping the Donor Landscape in Global Health: HIV/AIDS 9
Each donor provided assistance to an average of 40 recipient countries (i.e. number of recipients receiving assistance in at least one of the three years studied). Multilateral donors provided assistance to a higher average number of recipient countries (52) than bilateral donors (34).
The five donors with the greatest presence, as measured by number of recipient countries, were: UNAIDS (119), UNICEF (114), Canada (108), Global Fund (108), and Sweden (96). However, when measured by magnitude of assistance provided (as a share of annual average funding between 2009 and 2011), the five donors providing the greatest amount of assistance were: U.S. (61%), Global Fund (19%), U.K. (4%), UNAIDS (3%), and the World Bank (2%). The U.S. is by far the largest donor, providing almost two-thirds of all HIV/AIDS international assistance; the next largest donor, the Global Fund, provided one fifth of all assistance.
SPOTLIGHT ON THE U.S. AND GLOBAL FUND
The U.S. and the Global Fund were the largest donors by magnitude of assistance provided. Taken together, they provided approximately 80% of the average total of donor HIV/AIDS assistance from 2009-2011, with the U.S. contributing 61% and the Global Fund contributing 19%. The next highest average amount was provided by the U.K. (4%).
The U.S. and Global Fund were present in 114 of the 143 countries that received HIV/AIDS donor assistance (in at least one of the 3 years). Assistance from these two donors overlapped in 89 of the 114 countries. There were 29 recipient countries that did not receive assistance from either the U.S. or the Global Fund (see appendix tables for details).
The U.S. and the Global Fund accounted for more than 50% of funding in 102 recipient countries, more than 75% in 71 countries, and more than 95% of funding in 13 recipient countries. The countries with greater than 95% of HIV/AIDS assistance coming from U.S. and Global Fund were: Azerbaijan, Botswana, Dominican Republic, Gambia, Haiti, Jamaica, Jordan, Macedonia, Mexico, Mongolia, Paraguay, Serbia, and South Sudan.
The U.S. and Global Fund were also the dominant donors by region (see Table 3) providing more than 60% of HIV/AIDS assistance in every region except Oceania which received 74% of its funding from Australia.
Table 3. Snapshot of U.S. and Global Fund Assistance for HIV/AIDS, by Region, 2009-2011
Regions
United States Global FundTotal U.S. & Global Fund
Contribution# of
Recipients
% of Total Donor
Funding
# of Recipients
% of Total Donor
FundingEurope 5 8% 9 75% 84%Africa 46 63% 50 20% 83%
North Africa 3 3% 3 60% 63%Sub-Saharan 43 63% 47 20% 84%
America 19 49% 18 36% 84%North & Central America 11 56% 10 34% 90%South America 8 29% 8 48% 77%
Asia 24 21% 30 43% 64%Far East Asia 8 30% 10 40% 70%South & Central Asia 14 12% 16 48% 60%Middle East 2 2% 4 65% 66%
Oceania 1 4% 1 11% 15%Total 95 61% 108 19% 80%
Mapping the Donor Landscape in Global Health: HIV/AIDS 10
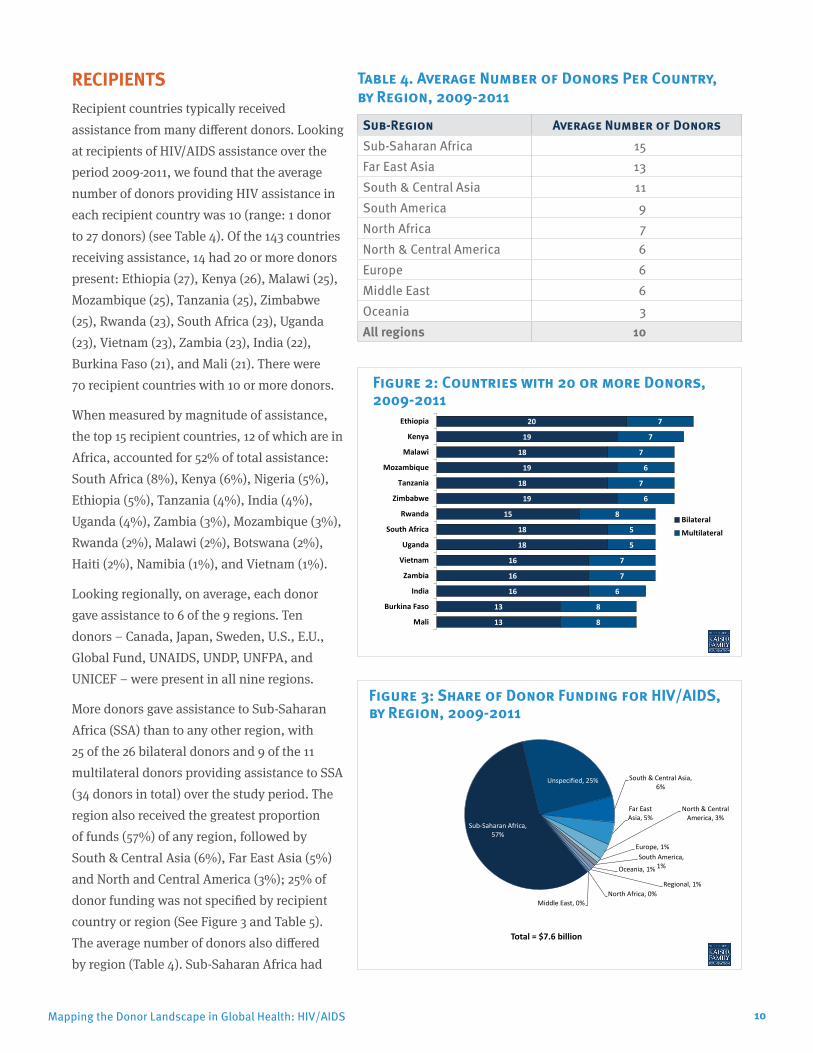
RECIPIENTSRecipient countries typically received assistance from many different donors. Looking at recipients of HIV/AIDS assistance over the period 2009-2011, we found that the average number of donors providing HIV assistance in each recipient country was 10 (range: 1 donor to 27 donors) (see Table 4). Of the 143 countries receiving assistance, 14 had 20 or more donors present: Ethiopia (27), Kenya (26), Malawi (25), Mozambique (25), Tanzania (25), Zimbabwe (25), Rwanda (23), South Africa (23), Uganda (23), Vietnam (23), Zambia (23), India (22), Burkina Faso (21), and Mali (21). There were 70 recipient countries with 10 or more donors.
When measured by magnitude of assistance, the top 15 recipient countries, 12 of which are in Africa, accounted for 52% of total assistance: South Africa (8%), Kenya (6%), Nigeria (5%), Ethiopia (5%), Tanzania (4%), India (4%), Uganda (4%), Zambia (3%), Mozambique (3%), Rwanda (2%), Malawi (2%), Botswana (2%), Haiti (2%), Namibia (1%), and Vietnam (1%).
Looking regionally, on average, each donor gave assistance to 6 of the 9 regions. Ten donors – Canada, Japan, Sweden, U.S., E.U., Global Fund, UNAIDS, UNDP, UNFPA, and UNICEF – were present in all nine regions.
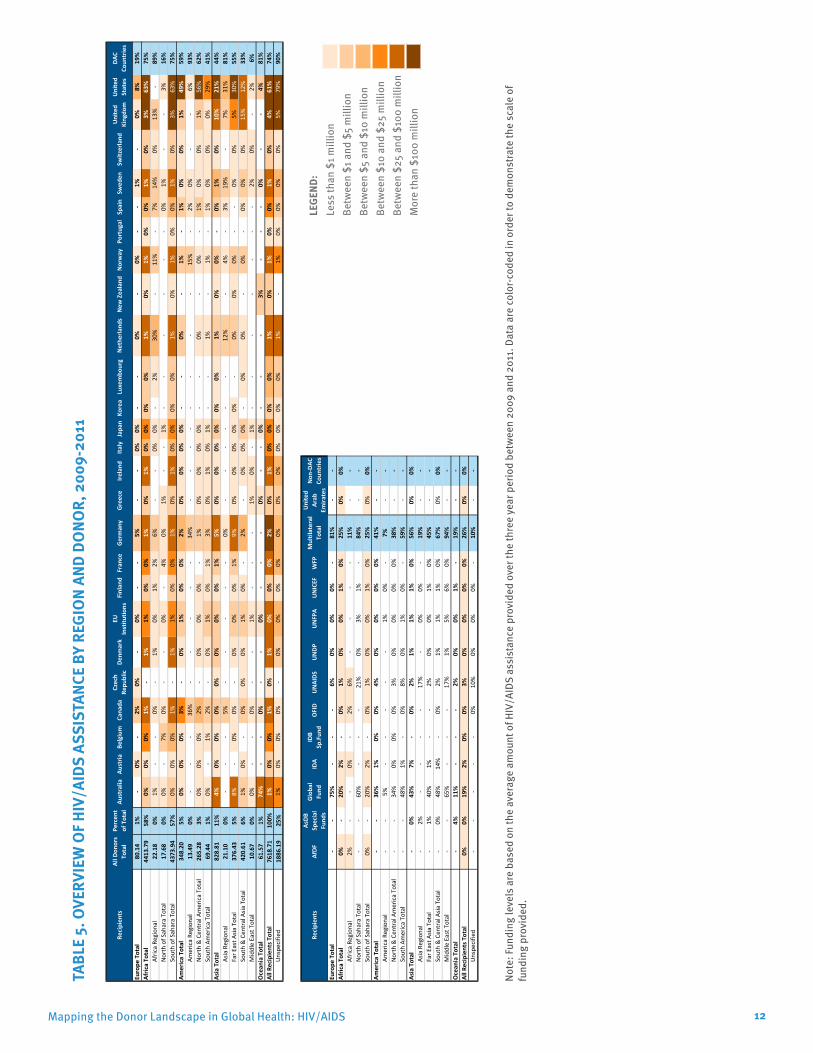
More donors gave assistance to Sub-Saharan Africa (SSA) than to any other region, with 25 of the 26 bilateral donors and 9 of the 11 multilateral donors providing assistance to SSA (34 donors in total) over the study period. The region also received the greatest proportion of funds (57%) of any region, followed by South & Central Asia (6%), Far East Asia (5%) and North and Central America (3%); 25% of donor funding was not specified by recipient country or region (See Figure 3 and Table 5). The average number of donors also differed by region (Table 4). Sub-Saharan Africa had
Table 4. Average Number of Donors Per Country, by Region, 2009-2011Sub-Region Average Number of Donors Sub-Saharan Africa 15Far East Asia 13South & Central Asia 11South America 9North Africa 7 North & Central America 6Europe 6Middle East 6Oceania 3All regions 10
13
13
16
16
16
18
18
15
19
18
19
18
19
20
8
8
6
7
7
5
5
8
6
7
6
7
7
7
Mali
Burkina Faso
India
Zambia
Vietnam
Uganda
South Africa
Rwanda
Zimbabwe
Tanzania
Mozambique
Malawi
Kenya
Ethiopia
BilateralMultilateral
Figure 2: Countries with 20 or more Donors, 2009-2011 Figure 2: Countries with 20 or more Donors, 2009-2011
Sub-Saharan Africa, 57%
Unspecified, 25% South & Central Asia, 6%
Far East Asia, 5%
North & Central America, 3%
Europe, 1% South America,
1% Oceania, 1%
Regional, 1% North Africa, 0%
Middle East, 0%
Figure 3: Share of Donor Funding for HIV/AIDS, by Region, 2009-2011
Total = $7.6 billion
Figure 3: Share of Donor Funding for HIV/AIDS, by Region, 2009-2011

Mapping the Donor Landscape in Global Health: HIV/AIDS 11
the highest average number of donors (15 per country), followed by Far East Asia (13), South & Central Asia (11), and South America (9).
The mix of assistance received from bilateral vs. multilateral channels also differed by region (Figure 4). For example, countries in Oceania, sub-Saharan Africa, North and Central America, and Far East Asia received the majority of funding through bilateral programs, whereas the larger portion of funding to countries in the Middle East, North Africa, Europe, South & Central Asia, and South America regions was provided through multilateral channels. The predominant donor also differed by region. For example, U.S. assistance provided the largest share of assistance in sub-Saharan Africa (63%) and North & Central America (56%). By contrast, the Global Fund accounted for the largest share of funding to the European Region (75%), the Middle East (65%), North Africa (60%), South America (48%), South & Central Asia (48%), and Far East Asia (40%). Oceania received most of its funds (74%) from Australia. See Table 4 and Appendix Tables for further information.
The mix of assistance received from bilateral vs. multilateral channels also differed by region (Figure 4). For example, countries in Oceania, sub-Saharan Africa, North and Central America, and Far East Asia received the majority of funding through bilateral programs, whereas the larger portion of funding to countries in the Middle East, North Africa, Europe, South & Central Asia, and South America regions was provided through multilateral channels. The predominant donor also differed by region. For example, U.S. assistance provided the largest share of assistance in sub-Saharan Africa (63%) and North & Central America (56%). By contrast, the Global Fund accounted for the largest share of funding to the European Region (75%), the Middle East (65%), North Africa (60%), South America (48%), South & Central Asia (48%), and Far East Asia (40%). Oceania saw most of its funds (74%) come from Australia. See Table 3 and Appendix Tables for further information.
A full listing of funding amounts by country, and the percent of a country’s funds contributed by each donor, is presented in the appendix tables at the end of this report.
26
8
9
11
12
19
19
20
20
25
11
6
6
5
5
7
9
8
9
9
Total
Oceania
Middle East
North Africa
Europe
South America
North & Central America
Far East Asia
South & Central Asia
Sub-Saharan Africa
BilateralMultilateral
Figure 4: Total Number of Donors, by Region, 2009-2011 Figure 4: Total Number of Donors, by Region, 2009-2011
74%
6%
16%
19%
33%
41%
55%
62%
75%
81%
26%
94%
84%
81%
67%
59%
45%
38%
25%
19%
Total
Middle East
North Africa
Europe
South & Central Asia
South America
Far East Asia
North & Central America
Sub-Sahara Africa
Oceania
BilateralMultilateral
Figure 5: Bilateral & Multilateral Breakdown, by Region, 2009-2011 Figure 5: Bilateral & Multilateral Breakdown, by Region, 2009-2011
Mapping the Donor Landscape in Global Health: HIV/AIDS 12
TABL
E 5.
OVE
RVIE
W O
F HIV
/AID
S AS
SIST
ANCE
BY
REGI
ON A
ND D
ONOR
, 200
9-20
11
Note
: Fun
ding
leve
ls a
re b
ased
on
the
aver
age
amou
nt o
f HIV
/AID
S as
sist
ance
pro
vide
d ov
er th
e th
ree
year
per
iod
betw
een
2009
and
201
1. D
ata
are
colo
r-cod
ed in
ord
er to
dem
onst
rate
the
scal
e of
fu
ndin
g pr
ovid
ed.
Recipien
tsAll D
onors
Total
Percen
t of Total
Australia
Austria
Belgium
Cana
daCzech
Repu
blic
Den
mark
EU
Institu
tions
Finlan
dFran
ceGerman
yGreece
Ireland
Italy
Japa
nKo
rea
Luxembo
urg
Nethe
rland
sNew
Zealand
Norway
Portugal
Spain
Swed
enSw
itzerland
United
Kingdo
mUnited
States
DAC
Co
untries
Europe
Total
80.14
1%‐
0%‐
2%0%
‐0%
‐‐
5%‐
‐0%
0%‐
‐0%
‐0%
‐‐
1%‐
0%8%
19%
Afric
a To
tal
4413
.79
58%
0%0%
0%1%
‐1%
1%0%
0%1%
0%1%
0%0%
0%0%
1%0%
1%0%
0%1%
0%3%
63%
75%
Africa Re
gion
al22
.18
0%1%
‐‐
0%‐
1%0%
1%2%
6%‐
‐0%
0%‐
2%30
%‐
11%
‐7%
14%
0%13
%‐
89%
North of Sahara To
tal
17.68
0%0%
‐7%
0%‐
‐0%
‐4%
0%1%
‐‐
1%‐
‐‐
‐‐
‐0%
1%‐
‐3%
16%
South of Sahara To
tal
4373
.94
57%
0%0%
0%1%
‐1%
1%0%
0%1%
0%1%
0%0%
0%0%
1%0%
1%0%
0%1%
0%3%
63%
75%
America To
tal
348.20
5%0%
0%0%
3%‐
0%1%
0%0%
2%0%
0%0%
0%‐
‐0%
‐1%
‐1%
0%0%
1%49
%59
%Am
erica Re
gion
al13
.49
0%‐
‐‐
36%
‐‐
‐‐
‐34
%‐
‐‐
‐‐
‐‐
‐15
%‐
2%0%
‐‐
6%93
%North & Cen
tral America To
tal
265.28
3%0%
0%0%
2%‐
0%0%
0%‐
1%0%
0%0%
0%‐
‐0%
‐0%
‐1%
0%0%
1%56
%62
%South Am
erica To
tal
69.44
1%0%
‐1%
2%‐
0%1%
0%1%
3%0%
1%0%
1%‐
‐1%
‐1%
‐1%
0%0%
0%29
%41
%Asia Total
828.81
11%
4%0%
0%0%
0%0%
0%0%
1%5%
0%0%
0%0%
0%0%
1%0%
0%‐
0%1%
0%10
%21
%44
%Asia Regional
21.10
0%‐
‐‐
5%‐
‐‐
‐‐
0%‐
‐‐
‐‐
‐12
%‐
4%‐
3%19
%‐
7%31
%81
%Far E
ast A
sia Total
376.43
5%8%
‐0%
0%‐
0%0%
0%1%
9%0%
0%0%
0%0%
‐0%
0%0%
‐‐
0%0%
5%30
%55
%South & Cen
tral Asia
Total
420.61
6%1%
0%‐
0%0%
0%1%
0%‐
2%‐
0%0%
0%‐
0%0%
‐0%
‐0%
0%0%
15%
12%
33%
Middle East Total
10.67
0%0%
‐‐
0%‐
‐1%
‐‐
‐1%
0%‐
1%‐
‐‐
‐‐
‐‐
2%0%
‐2%
6%Ocean
ia Total
61.57
1%74
%‐
‐0%
‐‐
0%‐
‐‐
0%‐
‐0%
‐‐
‐3%
‐‐
‐0%
‐‐
4%81
%All R
ecipients T
otal
7618
.71
100%
1%0%
0%1%
0%1%
0%0%
0%2%
0%1%
0%0%
0%0%
1%0%
1%0%
0%1%
0%4%
61%
74%
Unspe
cifie
d18
86.19
25%
1%0%
0%0%
‐0%
0%0%
0%0%
0%0%
0%0%
0%0%
1%‐
1%0%
0%0%
0%5%
79%
90%
Recipien
tsAfDF
AsDB
Special
Fund
s
Globa
l Fund
IDA
IDB
Sp.Fun
dOFID
UNAIDS
UNDP
UNFPA
UNICEF
WFP
Multilateral
Total
United
Arab
Em
irates
Non
‐DAC
Co
untries
Europe
Total
‐‐
75%
‐‐
‐6%
0%0%
0%‐
81%
‐‐
Afric
a To
tal
0%‐
20%
2%‐
0%1%
0%0%
1%0%
25%
0%0%
Africa Re
gion
al2%
‐‐
0%‐
2%6%
‐‐
‐‐
11%
‐‐
North of Sahara To
tal
‐‐
60%
‐‐
‐21
%0%
3%1%
‐84
%‐
‐South of Sahara To
tal
0%‐
20%
2%‐
0%1%
0%0%
1%0%
25%
0%0%
America To
tal
‐‐
36%
1%0%
0%4%
0%0%
0%0%
41%
‐‐
America Re
gion
al‐
‐5%
‐‐
‐‐
‐1%
0%‐
7%‐
‐North & Cen
tral America To
tal
‐‐
34%
0%0%
0%3%
0%0%
0%0%
38%
‐‐
South Am
erica To
tal
‐‐
48%
1%‐
0%8%
0%1%
0%‐
59%
‐‐
Asia Total
‐0%
43%
7%‐
0%2%
1%1%
1%0%
56%
0%0%
Asia Regional
‐2%
‐‐
‐‐
17%
‐0%
0%‐
19%
‐‐
Far E
ast A
sia Total
‐1%
40%
1%‐
‐2%
0%0%
1%0%
45%
‐‐
South & Cen
tral Asia
Total
‐0%
48%
14%
‐0%
2%1%
1%1%
0%67
%0%
0%Middle East Total
‐‐
65%
‐‐
‐17
%1%
5%6%
0%94
%‐
‐Ocean
ia Total
‐4%
11%
‐‐
‐2%
0%0%
1%‐
19%
‐‐
All R
ecipients T
otal
0%0%
19%
2%0%
0%3%
0%0%
0%0%
26%
0%0%
Unspe
cifie
d‐
‐‐
‐‐
0%10
%0%
0%0%
‐10
%‐
‐
LEGE
ND:
Less
than
$1 m
illio
n
Betw
een
$1 a
nd $
5 m
illio
n
Betw
een
$5 a
nd $
10 m
illio
n
Betw
een
$10
and
$25
mill
ion
Be
twee
n $2
5 an
d $1
00 m
illio
n
Mor
e th
an $
100
mill
ion
Mapping the Donor Landscape in Global Health: HIV/AIDS 13
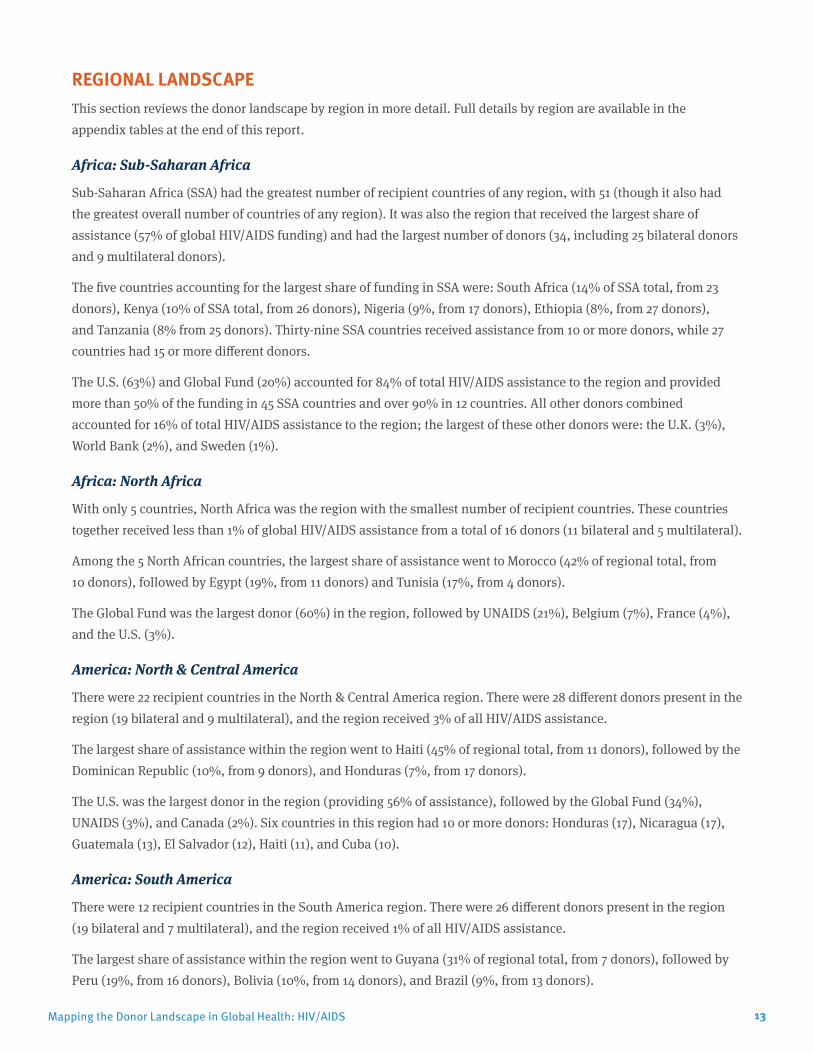
REGIONAL LANDSCAPEThis section reviews the donor landscape by region in more detail. Full details by region are available in the appendix tables at the end of this report.
Africa: Sub-Saharan Africa
Sub-Saharan Africa (SSA) had the greatest number of recipient countries of any region, with 51 (though it also had the greatest overall number of countries of any region). It was also the region that received the largest share of assistance (57% of global HIV/AIDS funding) and had the largest number of donors (34, including 25 bilateral donors and 9 multilateral donors).
The five countries accounting for the largest share of funding in SSA were: South Africa (14% of SSA total, from 23 donors), Kenya (10% of SSA total, from 26 donors), Nigeria (9%, from 17 donors), Ethiopia (8%, from 27 donors), and Tanzania (8% from 25 donors). Thirty-nine SSA countries received assistance from 10 or more donors, while 27 countries had 15 or more different donors.
The U.S. (63%) and Global Fund (20%) accounted for 84% of total HIV/AIDS assistance to the region and provided more than 50% of the funding in 45 SSA countries and over 90% in 12 countries. All other donors combined accounted for 16% of total HIV/AIDS assistance to the region; the largest of these other donors were: the U.K. (3%), World Bank (2%), and Sweden (1%).
Africa: North Africa
With only 5 countries, North Africa was the region with the smallest number of recipient countries. These countries together received less than 1% of global HIV/AIDS assistance from a total of 16 donors (11 bilateral and 5 multilateral).
Among the 5 North African countries, the largest share of assistance went to Morocco (42% of regional total, from 10 donors), followed by Egypt (19%, from 11 donors) and Tunisia (17%, from 4 donors).
The Global Fund was the largest donor (60%) in the region, followed by UNAIDS (21%), Belgium (7%), France (4%), and the U.S. (3%).
America: North & Central America
There were 22 recipient countries in the North & Central America region. There were 28 different donors present in the region (19 bilateral and 9 multilateral), and the region received 3% of all HIV/AIDS assistance.
The largest share of assistance within the region went to Haiti (45% of regional total, from 11 donors), followed by the Dominican Republic (10%, from 9 donors), and Honduras (7%, from 17 donors).
The U.S. was the largest donor in the region (providing 56% of assistance), followed by the Global Fund (34%), UNAIDS (3%), and Canada (2%). Six countries in this region had 10 or more donors: Honduras (17), Nicaragua (17), Guatemala (13), El Salvador (12), Haiti (11), and Cuba (10).
America: South America
There were 12 recipient countries in the South America region. There were 26 different donors present in the region (19 bilateral and 7 multilateral), and the region received 1% of all HIV/AIDS assistance.
The largest share of assistance within the region went to Guyana (31% of regional total, from 7 donors), followed by Peru (19%, from 16 donors), Bolivia (10%, from 14 donors), and Brazil (9%, from 13 donors).
Mapping the Donor Landscape in Global Health: HIV/AIDS 14
The Global Fund was the largest donor in the region (giving 48% of assistance), followed by the U.S. (29%), UNAIDS (8%), and Germany (3%). Five countries in this region had 10 or more donors: Peru (16), Bolivia (14), Brazil (13), Ecuador (13), and Colombia (12).
Asia: Far East Asia
There were 10 recipient countries in the Far East Asia region. Twenty-eight different donors were present in the region (20 bilateral and 8 multilateral), and the region received 5% of all HIV/AIDS assistance.
The largest share of assistance within the region went to Vietnam (28% of regional total, from 23 donors), followed by China (24%, from 17 donors), Cambodia (15%, from 17 donors), and Indonesia (15%, from 16 donors).
The Global Fund was the largest donor in the region (giving 40% of assistance), followed by the U.S. (30%), Germany (9%), and Australia (8%). Seven countries in this region had 10 or more donors: Vietnam (23), Cambodia (17), China (17), Indonesia (16), Thailand (15), Laos (11), and the Philippines (10).
Asia: Middle East
There were 7 recipient countries in the Middle East region, which received assistance from 15 different donors (9 bilateral and 6 multilateral). The region received less than 1% of all HIV/AIDS assistance.
The largest share of assistance within the region went to Iran (38% of regional total, from 7 donors), followed by Yemen (21%, from 9 donors), Jordan (13%, from 6 donors), and the West Bank & Gaza strip (11%, from 8 donors).
The Global Fund was the largest donor in the region (giving 65% of assistance), followed by UNAIDS (17%), UNICEF (6%), and UNFPA (5%). No countries had over 10 donors in this region (the largest number of donors was 9, in Yemen).
Asia: South & Central Asia
There were 17 recipient countries in the South & Central Asia region, which received assistance from 29 different donors (20 bilateral and 9 multilateral). The region received 6% of all HIV/AIDS assistance.
The largest share of assistance within the region went to India (68% of regional total, from 22 donors), followed by Myanmar (5%, from 15 donors), Nepal (5%, from 18 donors), and Bangladesh (4%, from 12 donors).
The Global Fund was the largest donor in the region (giving 48% of assistance), followed by the U.K. (15%), World Bank (14%), and the U.S. (12%). Eight countries in the region had 10 or more donors: India (22), Nepal (18), Myanmar (15), Pakistan (14), Bangladesh (12), Tajikistan (12), Afghanistan (11), and Georgia (11).
Europe
The 11 countries in the Europe region received just over 1% of global HIV/AIDS assistance from 17 donors (12 bilateral donors and 5 multilateral donors). Ukraine received the largest share of the assistance given to the region (59% of total, from 14 donors), followed by Moldova (9%, from 10 donors), Belarus (7%, 6 donors), and Bosnia-Herzegovina (6%, 7 donors).
The Global Fund was the largest donor accounting for 75% of HIV/AIDS assistance to the region; the Global Fund provided more than 70% of funding in 9 of 11 recipient countries. The U.S. was the second largest donor (8%), followed by UNAIDS (6%), and Germany (5%). Two countries in the region had 10 or more donors: the Ukraine (14) and Moldova (10).

Mapping the Donor Landscape in Global Health: HIV/AIDS 15
Oceania
The 8 countries comprising the Oceania region received 1% of the global HIV/AIDS assistance from a total of 14 donors (8 bilateral donors and 6 multilateral donors).
Papua New Guinea accounted for the largest share of assistance to the region (77%, from 11 donors). It is worth noting that regional, rather than country specific funding, accounted for the second largest share of assistance to the region (20%).
Australia was the largest donor to Oceania, providing 74% of the region’s HIV/AIDS assistance and the largest share of assistance in 4 out of the 8 countries.
ConclusionsThe donor landscape for HIV/AIDS is varied and complex, and reflects a dramatic scale up of the number of donors and assistance provided over the last decade. Between 2009 and 2011, 37 donors (26 bilateral and 11 multilateral) provided HIV/AIDS assistance to 143 different countries across nine regions. Donors spread their assistance broadly, giving to an average of 6 different regions and 40 different countries. The large number of donors and the geographic breadth of their assistance suggest that ensuring adequate communication with and coordination among multiple donors may be important in reducing administrative and opportunity costs faced by recipient countries and achieving greater efficiencies with HIV assistance.
The most prominent donors were the U.S. and the Global Fund, which were present in a combined total of 114 of the 143 countries and together accounted for 80% of the average yearly assistance over this period (including more than 60% of assistance in every region except Oceania). The predominance of HIV assistance coming from these two sources points to potential vulnerabilities should the scope and/or magnitude of their funding commitments change in the future, a point also raised by the recent Institute of Medicine evaluation of PEPFAR.16
Each recipient country received aid from an average of 10 different donors over this period, though the number varied significantly across countries (see map in Figure 1). Fourteen recipient countries had 20 or more donors providing HIV/AIDS assistance. These data suggest that ensuring recipient countries themselves have access to information about donors working in their countries on HIV is an important ingredient to achieving greater efficiencies and promoting country ownership.
As donors and recipient countries look forward to the future and seek ambitious goals for their HIV programs, such as working toward an “AIDS-Free Generation,”18 it will be more important than ever to ensure there is adequate and fruitful coordination between donors and recipients in order to achieve the greatest return possible on the global investments being made in the HIV response.
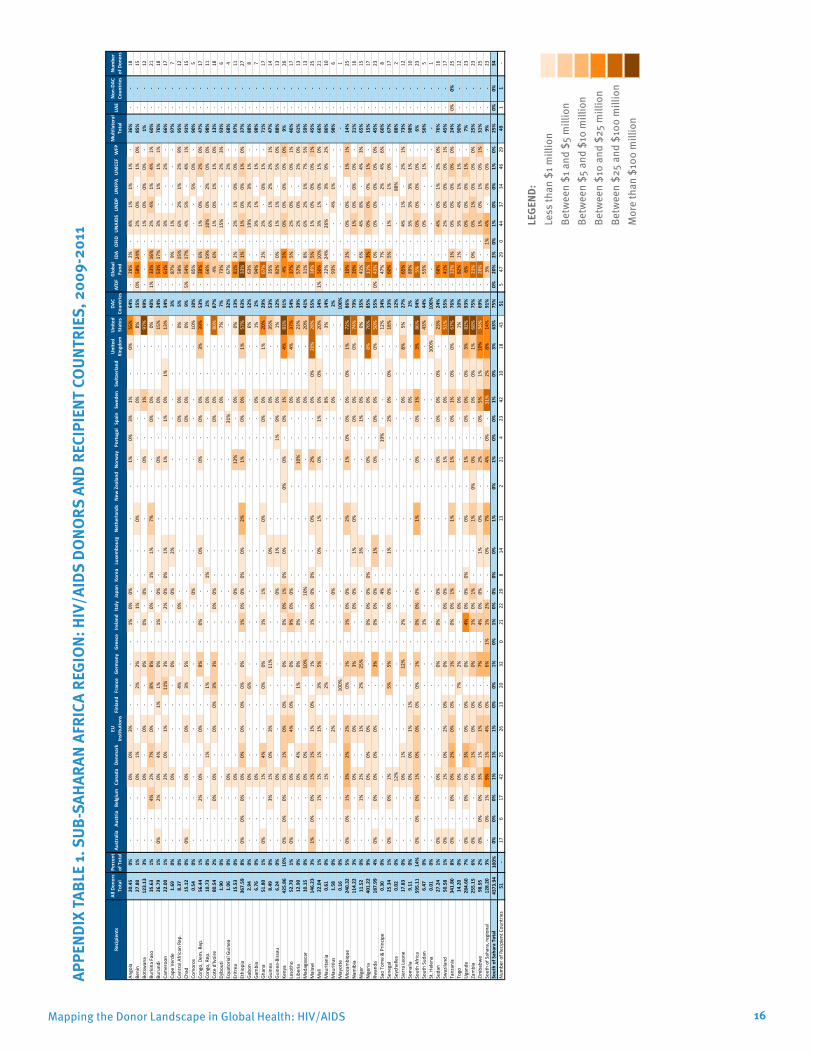
Mapping the Donor Landscape in Global Health: HIV/AIDS 16
APPE
NDIX
TABL
E 1.
SUB
-SAH
ARAN
AFR
ICA
REGI
ON: H
IV/A
IDS
DONO
RS A
ND R
ECIP
IENT
COU
NTRI
ES, 2
009-
2011
Recipien
tsAll D
onors
Total
Percen
t of Total
Australia
Austria
Belgium
Cana
daDen
mark
EU
Institu
tions
Finlan
dFran
ceGerman
yGreece
Ireland
Italy
Japa
nKo
rea
Luxembo
urg
Nethe
rland
sNew
Zealand
Norway
Portugal
Spain
Swed
enSw
itzerland
United
Kingdo
mUnited
States
DAC
Co
untriesAfDFGloba
l Fund
IDA
OFID
UNAIDS
UNDP
UNFPA
UNICEF
WFP
Multilateral
Total
UAE
Non
‐DAC
Co
untries
Num
ber
of Don
ors
Angola
20.45
0%‐
‐‐
0%0%
3%‐
‐‐
‐1%
0%0%
‐‐
‐‐
1%0%
3%1%
‐0%
55%
64%
‐28
%2%
‐4%
1%1%
1%‐
36%
‐‐
18Be
nin
27.80
1%‐
‐‐
0%1%
‐‐
2%2%
‐‐
1%‐
‐‐
0%‐
‐‐
‐0%
‐‐
8%15
%0%
58%
24%
‐2%
0%‐
1%0%
85%
‐‐
15Bo
tswana
123.13
3%‐
‐‐
0%‐
0%‐
‐0%
‐0%
‐0%
‐‐
‐‐
0%‐
‐1%
‐‐
97%
99%
‐‐
‐‐
1%0%
0%0%
‐1%
‐‐
12Bu
rkina Faso
35.63
1%‐
‐4%
2%7%
0%‐
8%8%
‐‐
0%‐
1%1%
7%‐
‐‐
0%0%
‐‐
0%40
%1%
33%
16%
‐2%
4%1%
4%1%
60%
‐‐
21Bu
rund
i26
.79
1%0%
‐2%
0%4%
‐1%
1%0%
‐1%
‐0%
‐‐
‐‐
0%‐
‐0%
‐‐
15%
24%
‐53
%17
%‐
3%‐
1%1%
1%76
%‐
‐18
Cameroo
n22
.00
1%‐
‐‐
2%0%
1%‐
11%
3%‐
‐2%
0%0%
1%‐
‐1%
‐1%
0%1%
‐13
%34
%‐
61%
‐‐
3%‐
‐2%
‐66
%‐
‐17
Cape
Verde
1.69
0%‐
‐‐
0%‐
‐‐
‐0%
‐‐
‐0%
‐2%
‐‐
‐‐
‐‐
‐‐
‐3%
‐87
%9%
‐1%
‐‐
‐‐
97%
‐‐
7Ce
ntral A
frican
Rep
.8.37
0%‐
‐‐
‐‐
‐‐
4%‐
‐‐
0%‐
‐‐
‐‐
‐‐
0%0%
‐‐
0%5%
‐58
%15
%‐
6%2%
1%2%
9%95
%‐
‐12
Chad
15.12
0%0%
‐‐
0%‐
0%‐
3%5%
‐‐
‐‐
‐‐
‐‐
‐‐
0%0%
‐‐
0%9%
5%54
%17
%‐
4%5%
‐4%
1%91
%‐
‐15
Comoros
0.54
0%‐
‐‐
‐‐
‐‐
‐‐
‐‐
‐0%
‐‐
‐‐
‐‐
‐‐
‐‐
10%
10%
‐85
%‐
‐‐
‐5%
0%‐
90%
‐‐
5Co
ngo, Dem
. Rep
.56
.44
1%‐
‐2%
0%‐
0%‐
‐8%
‐0%
‐‐
‐0%
‐‐
0%‐
0%0%
‐3%
39%
53%
‐38
%6%
‐1%
0%‐
2%0%
47%
‐‐
17Co
ngo, Rep
.10
.73
0%‐
‐‐
‐1%
‐‐
1%‐
‐‐
‐‐
1%‐
‐‐
‐‐
‐0%
‐‐
‐2%
‐66
%19
%‐
10%
0%2%
0%0%
98%
‐‐
11Co
te d'Ivoire
80.54
2%‐
‐0%
0%‐
0%0%
3%3%
‐‐
0%0%
‐‐
‐‐
‐‐
0%0%
‐‐
80%
87%
‐4%
6%‐
1%0%
1%1%
0%13
%‐
‐18
Djibou
ti1.90
0%‐
‐‐
‐‐
‐‐
‐‐
‐‐
‐‐
‐‐
‐‐
‐‐
‐0%
‐‐
7%7%
‐73
%‐
‐15
%‐
‐2%
3%93
%‐
‐6
Equatoria
l Guine
a1.06
0%‐
‐‐
0%‐
‐‐
‐‐
‐‐
‐‐
‐‐
‐‐
‐‐
31%
‐‐
‐‐
32%
‐67
%‐
‐‐
‐‐
2%‐
68%
‐‐
4Eritrea
15.53
0%‐
‐‐
0%‐
‐‐
‐‐
‐‐
‐0%
‐‐
‐‐
12%
‐‐
0%‐
‐0%
13%
‐81
%2%
‐2%
1%0%
0%‐
87%
‐‐
11Ethiop
ia36
7.59
8%0%
0%0%
0%0%
0%0%
0%0%
‐1%
0%0%
0%0%
2%‐
1%‐
0%0%
‐1%
57%
63%
‐33
%1%
‐1%
0%0%
1%0%
37%
‐‐
27Gabon
2.94
0%‐
‐‐
0%‐
‐‐
6%‐
‐‐
‐‐
‐‐
‐‐
‐‐
‐‐
‐‐
6%12
%‐
63%
‐‐
19%
2%3%
1%‐
88%
‐‐
8Gam
bia
6.76
0%‐
‐‐
0%‐
‐‐
‐‐
‐‐
‐‐
‐‐
‐‐
‐‐
‐0%
‐‐
1%2%
‐94
%‐
‐3%
1%‐
1%‐
98%
‐‐
7Ghana
51.80
1%0%
‐‐
1%4%
‐‐
0%0%
‐1%
‐1%
‐‐
0%‐
‐‐
0%0%
‐1%
20%
29%
‐67
%2%
‐2%
‐0%
1%‐
71%
‐‐
17Guine
a8.49
0%‐
‐3%
1%0%
3%‐
‐11
%‐
‐‐
‐‐
0%‐
‐‐
‐‐
0%‐
‐35
%53
%‐
35%
‐‐
6%1%
2%2%
1%47
%‐
‐14
Guine
a‐Bissau
6.24
0%‐
‐‐
0%‐
‐‐
‐‐
‐‐
‐0%
‐1%
‐‐
‐1%
9%0%
‐‐
1%12
%‐
82%
0%‐
1%1%
‐5%
0%88
%‐
‐13
Kenya
425.86
10%
0%0%
0%0%
1%0%
0%‐
0%‐
0%0%
1%0%
0%‐
0%0%
‐0%
1%‐
4%83
%91
%‐
4%5%
‐0%
0%0%
0%0%
9%‐
‐26
Lesotho
52.70
1%0%
‐‐
0%‐
4%0%
‐0%
‐9%
0%0%
‐‐
‐‐
‐‐
‐0%
‐4%
37%
54%
‐37
%5%
‐2%
0%‐
0%1%
46%
‐‐
17Libe
ria12
.90
0%‐
‐‐
0%4%
‐‐
1%0%
‐0%
‐‐
‐‐
‐‐
10%
‐‐
0%‐
‐23
%39
%‐
57%
‐‐
2%0%
‐2%
0%61
%‐
‐13
Madagascar
10.15
0%‐
‐‐
0%0%
‐‐
‐10
%‐
‐‐
10%
‐‐
‐‐
‐‐
‐0%
‐‐
20%
41%
‐31
%8%
‐6%
2%1%
7%5%
59%
‐‐
13Malaw
i14
6.23
3%1%
0%0%
1%1%
1%0%
‐1%
‐1%
0%0%
0%‐
0%‐
2%‐
‐0%
0%20
%28
%55
%‐
38%
5%‐
1%0%
0%0%
1%45
%‐
‐25
Mali
22.04
1%‐
‐1%
1%1%
1%‐
3%5%
‐‐
‐‐
‐0%
1%‐
0%‐
1%0%
0%‐
20%
34%
1%50
%10
%‐
3%1%
0%1%
0%66
%‐
‐21
Mauritania
0.61
0%‐
‐‐
1%‐
‐‐
2%‐
‐‐
‐‐
‐‐
‐‐
‐‐
‐8%
‐‐
3%14
%‐
22%
24%
‐26
%‐
3%9%
2%86
%‐
‐10
Mauritius
1.58
0%‐
‐‐
‐‐
2%‐
‐‐
‐‐
‐0%
‐‐
‐‐
‐‐
‐0%
‐‐
‐2%
‐93
%‐
‐‐
4%1%
‐‐
98%
‐‐
6Mayotte
0.16
0%‐
‐‐
‐‐
‐‐
100%
‐‐
‐‐
‐‐
‐‐
‐‐
‐‐
‐‐
‐‐
100%
‐‐
‐‐
‐‐
‐‐
‐‐
‐‐
1Mozam
biqu
e24
0.32
5%0%
0%1%
3%2%
2%‐
0%1%
‐1%
0%0%
‐‐
2%‐
1%0%
0%0%
0%1%
72%
86%
‐10
%2%
‐0%
0%‐
1%1%
14%
‐‐
25Nam
ibia
114.22
3%‐
‐‐
0%‐
0%‐
‐3%
‐‐
0%0%
‐1%
0%‐
‐‐
0%0%
‐0%
74%
79%
‐20
%‐
‐1%
0%0%
0%‐
21%
‐‐
16Niger
11.52
0%‐
‐1%
2%‐
1%‐
2%25
%‐
‐‐
‐‐
3%‐
‐‐
‐1%
0%‐
‐0%
35%
‐41
%6%
‐4%
8%‐
4%3%
65%
‐‐
15Nigeria
401.22
9%‐
‐‐
0%0%
0%‐
‐‐
‐0%
0%0%
0%‐
‐‐
0%‐
‐0%
‐8%
76%
85%
‐11
%3%
‐0%
0%0%
1%‐
15%
‐‐
17Rw
anda
187.99
4%0%
‐0%
0%0%
0%‐
‐3%
‐0%
0%0%
‐1%
‐‐
0%‐
0%0%
‐0%
50%
55%
0%43
%0%
‐0%
0%0%
0%0%
45%
‐‐
23Sao To
me & Prin
cipe
0.30
0%‐
‐‐
‐‐
‐‐
‐‐
‐‐
‐4%
‐‐
‐‐
‐19
%‐
‐‐
‐12
%34
%‐
47%
7%‐
‐‐
2%4%
6%66
%‐
‐8
Sene
gal
25.34
1%0%
‐0%
1%‐
‐‐
5%5%
‐‐
0%0%
‐1%
‐‐
‐‐
2%0%
0%‐
18%
33%
‐60
%5%
‐1%
‐1%
0%‐
67%
‐‐
17Seyche
lles
0.02
0%‐
‐‐
12%
‐‐
‐‐
‐‐
‐‐
‐‐
‐‐
‐‐
‐‐
‐‐
‐‐
12%
‐‐
‐‐
‐‐
88%
‐‐
88%
‐‐
2Sierra Leo
ne17
.83
0%‐
‐‐
0%1%
‐‐
‐12
%‐
2%‐
‐‐
‐‐
‐‐
‐‐
0%‐
8%5%
27%
‐65
%‐
‐4%
1%‐
2%1%
73%
‐‐
12Somalia
9.11
0%‐
‐‐
0%0%
1%1%
‐‐
‐‐
‐‐
‐‐
‐‐
‐‐
‐0%
‐‐
‐2%
‐89
%‐
‐3%
3%3%
1%‐
98%
‐‐
10South Africa
595.11
14%
0%0%
0%1%
0%0%
0%0%
1%‐
0%0%
0%‐
‐1%
‐0%
‐0%
1%‐
3%86
%94
%‐
5%‐
‐0%
0%0%
0%‐
6%‐
‐23
South Sudan
6.47
0%‐
‐‐
‐‐
‐‐
‐‐
‐1%
‐‐
‐‐
‐‐
‐‐
‐‐
‐‐
43%
44%
‐55
%‐
‐0%
‐‐
1%‐
56%
‐‐
5St. H
elen
a0.01
0%‐
‐‐
‐‐
‐‐
‐‐
‐‐
‐‐
‐‐
‐‐
‐‐
‐‐
‐10
0%‐
100%
‐‐
‐‐
‐‐
‐‐
‐‐
‐‐
1Sudan
27.24
1%0%
‐‐
0%‐
‐‐
‐0%
‐0%
‐0%
‐‐
‐‐
0%‐
0%0%
0%‐
23%
24%
‐68
%‐
‐4%
0%1%
2%0%
76%
‐‐
16Sw
aziland
50.58
1%0%
‐‐
1%0%
2%0%
‐0%
‐‐
0%0%
‐‐
‐‐
1%‐
‐0%
‐‐
51%
55%
‐41
%‐
‐2%
0%0%
0%1%
45%
‐‐
17Tanzania
341.80
8%0%
‐0%
0%2%
0%0%
‐1%
‐0%
0%1%
‐‐
1%‐
1%‐
0%1%
0%0%
67%
76%
‐22
%1%
‐0%
0%0%
0%0%
24%
0%0%
25To
go14
.20
0%‐
‐‐
0%‐
‐‐
7%2%
‐‐
0%‐
‐‐
‐‐
‐‐
‐0%
‐‐
1%10
%‐
82%
1%‐
3%4%
1%1%
‐90
%‐
‐12
Ugand
a28
4.60
7%0%
‐0%
0%3%
0%0%
‐0%
‐4%
0%0%
0%‐
0%‐
1%‐
0%0%
0%3%
82%
93%
‐6%
‐‐
0%0%
0%1%
‐7%
‐‐
23Zambia
255.15
6%0%
‐‐
0%1%
0%0%
‐0%
‐1%
0%1%
‐‐
1%0%
0%‐
‐0%
0%1%
68%
75%
‐23
%0%
‐0%
1%0%
0%0%
25%
‐‐
23Zimbabw
e98
.95
2%0%
0%0%
3%1%
1%0%
‐7%
‐4%
0%0%
‐1%
0%‐
2%‐
0%5%
1%10
%34
%69
%‐
28%
‐‐
1%0%
1%0%
1%31
%‐
‐25
South of Sahara, re
gion
al12
8.20
3%‐
0%1%
9%1%
4%0%
‐6%
1%1%
2%‐
‐0%
7%‐
4%0%
‐31
%2%
8%14
%91
%‐
3%‐
1%4%
‐0%
0%‐
9%‐
‐23
South of Sah
ara To
tal
4373
.94
100%
0%0%
0%1%
1%1%
0%0%
1%0%
1%0%
0%0%
0%1%
0%1%
0%0%
1%0%
3%63
%75
%0%
20%
2%0%
1%0%
0%1%
0%25
%0%
0%34
Num
ber o
f Recipient Cou
ntrie
s51
‐17
617
4225
2613
2032
021
2229
814
132
214
2342
1018
4351
547
290
4437
3446
2949
11
‐
LEGE
ND:
Less
than
$1 m
illio
n
Betw
een
$1 a
nd $
5 m
illio
n
Betw
een
$5 a
nd $
10 m
illio
n
Betw
een
$10
and
$25
mill
ion
Be
twee
n $2
5 an
d $1
00 m
illio
n
Mor
e th
an $
100
mill
ion

Mapping the Donor Landscape in Global Health: HIV/AIDS 17
APPE
NDIX
TABL
E 2.
NOR
TH A
FRIC
A (N
ORTH
SAH
ARA)
REG
ION:
HIV
/AID
S DO
NORS
AND
REC
IPIE
NT C
OUNT
RIES
, 200
9-20
11
Recipien
tsAll D
onors
Total
Percen
t of Total
Australia
Belgium
Cana
daEU
Institu
tions
Fran
ceGerman
yGreece
Japa
nSpain
Swed
enUnited
States
DAC
Co
untriesGloba
l Fund
UNAIDS
UNDP
UNFPA
UNICEF
Multilateral
Total
Num
ber
of Don
ors
Algeria
1.17
7%‐
80%
‐‐
‐‐
‐‐
‐0%
2%82
%‐
17%
1%‐
0%18
%6
Egypt
3.30
19%
0%‐
0%‐
10%
2%‐
2%‐
3%12
%30
%45
%14
%‐
7%4%
70%
11Libya
0.03
0%‐
‐‐
38%
‐‐
‐‐
‐‐
‐38
%‐
62%
‐‐
‐62
%2
Morocco
7.40
42%
‐3%
0%‐
4%‐
‐0%
0%0%
2%10
%84
%6%
‐‐
0%90
%10
Tunisia
3.02
17%
‐‐
1%‐
‐‐
‐‐
‐‐
‐1%
95%
4%‐
‐0%
99%
4North of Sahara, re
gion
al2.76
16%
‐‐
‐‐
‐‐
4%‐
‐0%
‐4%
‐87
%‐
9%‐
96%
4North of S
ahara To
tal
17.68
100%
0%7%
0%0%
4%0%
1%1%
0%1%
3%16
%60
%21
%0%
3%1%
84%
16Num
ber o
f Recipient Cou
ntrie
s5
‐1
23
12
10
21
33
53
51
14
5‐
LEGE
ND:
Less
than
$1 m
illio
n
Betw
een
$1 a
nd $
5 m
illio
n
Betw
een
$5 a
nd $
10 m
illio
n
Betw
een
$10
and
$25
mill
ion
Be
twee
n $2
5 an
d $1
00 m
illio
n
Mor
e th
an $
100
mill
ion

Mapping the Donor Landscape in Global Health: HIV/AIDS 18
APPE
NDIX
TABL
E 3.
NOR
TH &
CEN
TRAL
AM
ERIC
A RE
GION
: HIV
/AID
S DO
NORS
AND
REC
IPIE
NT C
OUNT
RIES
, 200
9-20
11
Recipien
tsAll D
onors
Total
Percen
t of Total
Australia
Austria
Belgium
Cana
daDen
mark
EU
Institu
tions
Finlan
dGerman
yGreece
Ireland
Italy
Japa
nNethe
rland
sNorway
Spain
Swed
enSw
itzerland
United
Kingdo
mUnited
States
DAC
Co
untriesGloba
l Fund
IDA
IDB
Sp.Fun
dOFID
UNAIDS
UNDP
UNFPA
UNICEF
WFP
Multilateral
Total
Num
ber
of Don
ors
Anguilla
0.02
0%‐
‐‐
100%
‐‐
‐‐
‐‐
‐‐
‐‐
‐‐
‐‐
‐10
0%‐
‐‐
‐‐
‐‐
‐‐
‐1
Antig
ua and
Barbu
da0.02
0%‐
‐‐
100%
‐‐
‐‐
‐‐
‐‐
‐‐
‐‐
‐‐
‐10
0%‐
‐‐
‐‐
‐‐
‐‐
‐1
Barbados
0.40
0%‐
‐‐
8%‐
‐‐
‐‐
‐‐
‐‐
‐‐
‐‐
‐10
%18
%‐
‐‐
‐82
%‐
‐‐
‐82
%3
Belize
0.93
0%‐
‐‐
3%‐
‐‐
‐‐
‐‐
2%‐
‐‐
‐‐
‐14
%18
%68
%‐
‐‐
3%‐
‐11
%‐
82%
6Co
sta Rica
0.17
0%‐
‐‐
5%‐
‐‐
15%
‐‐
‐‐
‐‐
‐4%
‐‐
‐23
%‐
‐‐
‐29
%3%
24%
20%
‐77
%7
Cuba
6.42
2%‐
‐0%
1%‐
1%‐
‐‐
‐1%
‐‐
‐0%
‐0%
‐‐
4%94
%‐
‐‐
1%‐
0%0%
‐96
%10
Dominica
0.03
0%‐
‐‐
100%
‐‐
‐‐
‐‐
‐‐
‐‐
‐‐
‐‐
‐10
0%‐
‐‐
‐‐
‐‐
‐‐
‐1
Dominican
Rep
ublic
25.45
10%
‐‐
‐0%
‐‐
‐‐
‐‐
‐‐
‐‐
2%0%
‐‐
38%
40%
58%
‐‐
‐2%
0%0%
0%‐
60%
9El Salvado
r7.30
3%‐
‐‐
1%‐
‐‐
0%‐
1%‐
0%‐
‐4%
0%‐
‐18
%25
%72
%‐
‐‐
3%0%
0%0%
‐75
%12
Grenada
0.07
0%‐
‐‐
36%
‐‐
‐‐
‐‐
‐‐
‐‐
‐‐
‐‐
‐36
%‐
64%
‐‐
‐‐
‐‐
‐64
%2
Guatemala
13.61
5%0%
‐‐
1%‐
‐0%
1%‐
0%‐
‐3%
1%4%
0%‐
‐19
%29
%65
%‐
‐‐
5%‐
‐0%
‐71
%13
Haiti
119.69
45%
0%‐
‐2%
‐‐
‐‐
‐0%
‐‐
‐0%
0%‐
‐‐
81%
83%
16%
‐‐
‐1%
‐0%
0%0%
17%
11Ho
nduras
18.01
7%0%
‐‐
11%
‐‐
0%‐
‐0%
0%0%
‐‐
1%1%
0%‐
29%
42%
50%
2%0%
‐4%
‐2%
0%0%
58%
17Jamaica
14.43
5%‐
‐‐
1%‐
0%‐
‐‐
‐‐
0%‐
‐‐
‐‐
‐23
%24
%73
%‐
‐‐
3%‐
‐0%
‐76
%7
Mexico
7.49
3%‐
‐‐
0%‐
0%‐
‐‐
‐‐
‐‐
‐‐
‐‐
‐37
%37
%60
%‐
‐‐
1%‐
1%‐
‐63
%6
Mon
tserrat
0.02
0%‐
‐‐
100%
‐‐
‐‐
‐‐
‐‐
‐‐
‐‐
‐‐
‐10
0%‐
‐‐
‐‐
‐‐
‐‐
‐1
Nicaragua
12.26
5%‐
5%0%
2%2%
4%‐
0%‐
0%‐
‐4%
3%3%
1%‐
1%17
%42
%57
%‐
‐‐
0%‐
0%1%
‐58
%17
Panama
0.58
0%‐
‐‐
1%‐
‐‐
‐‐
‐‐
‐‐
‐9%
1%‐
‐‐
11%
‐‐
‐‐
66%
‐11
%12
%‐
89%
6St. Kitts‐Nevis
0.03
0%‐
‐‐
100%
‐‐
‐‐
‐‐
‐‐
‐‐
‐‐
‐‐
‐10
0%‐
‐‐
‐‐
‐‐
‐‐
‐1
St. Lucia
0.03
0%‐
‐‐
100%
‐‐
‐‐
‐‐
‐‐
‐‐
‐‐
‐‐
‐10
0%‐
‐‐
‐‐
‐‐
‐‐
‐1
St.Vincent & Grenadine
s0.13
0%‐
‐‐
28%
‐‐
‐‐
‐‐
‐‐
‐‐
‐‐
‐‐
‐28
%‐
72%
‐‐
‐‐
‐‐
‐72
%2
Trinidad
and
Tob
ago
0.55
0%‐
‐‐
6%‐
38%
‐‐
‐‐
‐‐
‐‐
‐‐
‐‐
22%
65%
‐‐
‐‐
35%
0%‐
‐‐
35%
5West Ind
ies, re
gion
al22
.57
9%‐
‐‐
2%‐
‐‐
‐‐
‐‐
‐‐
‐‐
‐‐
10%
68%
80%
11%
1%‐
‐7%
‐‐
0%‐
20%
7North & Cen
tral America, re
gion
al15
.06
6%‐
‐‐
0%0%
‐‐
12%
0%‐
‐‐
‐‐
1%0%
‐1%
58%
73%
19%
3%0%
0%5%
‐0%
‐‐
27%
14North & Cen
tral America To
tal
265.28
100%
0%0%
0%2%
0%0%
0%1%
0%0%
0%0%
0%0%
1%0%
0%1%
56%
62%
34%
0%0%
0%3%
0%0%
0%0%
38%
28Num
ber o
f Recipient Cou
ntrie
s22
‐3
12
221
52
40
52
42
38
72
111
2210
31
014
49
112
16‐
LEGE
ND:
Less
than
$1 m
illio
n
Betw
een
$1 a
nd $
5 m
illio
n
Betw
een
$5 a
nd $
10 m
illio
n
Betw
een
$10
and
$25
mill
ion
Be
twee
n $2
5 an
d $1
00 m
illio
n
Mor
e th
an $
100
mill
ion
APPE
NDIX
TABL
E 4.
SOU
TH A
MER
ICA
REGI
ON: H
IV/A
IDS
DONO
RS A
ND R
ECIP
IENT
COU
NTRI
ES, 2
009-
2011
Recipien
tsAll D
onors
Total
Percen
t of Total
Australia
Belgium
Cana
daDen
mark
EU
Institu
tions
Finlan
dFran
ceGerman
yGreece
Ireland
Italy
Japa
nNethe
rland
sNorway
Spain
Swed
enSw
itzerland
United
Kingdo
mUnited
States
DAC
Co
untriesGloba
l Fund
IDA
OFID
UNAIDS
UNDP
UNFPA
UNICEF
Multilateral
Total
Num
ber
of Don
ors
Argentina
1.15
2%‐
‐1%
‐0%
‐‐
‐‐
‐‐
‐‐
‐0%
2%‐
0%3%
6%45
%‐
‐47
%‐
‐3%
94%
9Bo
livia
6.97
10%
0%0%
7%0%
‐‐
‐2%
‐‐
‐0%
5%2%
2%3%
‐‐
11%
33%
66%
‐‐
1%‐
0%‐
67%
14Brazil
6.11
9%‐
‐0%
‐2%
‐8%
27%
‐1%
‐8%
1%‐
‐1%
‐‐
41%
89%
‐‐
‐10
%0%
2%0%
11%
13Ch
ile0.34
0%‐
‐3%
‐‐
‐‐
‐‐
‐‐
‐‐
‐‐
2%‐
‐‐
5%‐
‐‐
95%
‐‐
‐95
%3
Colombia
4.28
6%0%
‐1%
‐‐
0%‐
1%‐
‐‐
‐‐
‐2%
0%1%
‐1%
8%83
%‐
‐6%
‐2%
1%92
%12
Ecuado
r5.12
7%0%
10%
0%‐
12%
‐‐
‐‐
‐‐
‐‐
6%6%
0%‐
‐0%
35%
62%
‐‐
3%0%
0%0%
65%
13Guyana
21.86
31%
‐‐
1%‐
0%‐
‐‐
‐‐
‐‐
‐‐
‐‐
‐‐
68%
70%
24%
3%‐
3%‐
‐0%
30%
7Paraguay
4.95
7%‐
‐0%
‐‐
‐‐
‐‐
‐‐
‐‐
‐‐
0%‐
‐‐
1%96
%‐
‐1%
‐1%
2%99
%6
Peru
13.13
19%
0%0%
1%‐
1%1%
‐0%
‐‐
1%0%
‐‐
1%0%
‐‐
14%
20%
74%
‐‐
5%0%
1%1%
80%
16Surin
ame
1.48
2%‐
‐2%
‐‐
‐‐
‐‐
‐‐
‐6%
‐‐
‐‐
‐3%
12%
88%
‐‐
‐‐
‐‐
88%
4Uruguay
0.17
0%‐
‐7%
‐26
%‐
‐‐
‐‐
‐‐
‐‐
‐1%
‐‐
‐34
%‐
‐‐
50%
‐16
%1%
66%
6Ve
nezuela
0.53
1%‐
‐3%
‐6%
‐‐
‐‐
‐‐
‐‐
‐0%
‐‐
‐‐
9%‐
‐‐
76%
‐14
%0%
91%
6South Am
erica, re
gion
al3.35
5%‐
1%7%
‐‐
0%‐
‐1%
12%
‐‐
‐‐
1%1%
‐‐
‐23
%10
%‐
1%63
%3%
‐‐
77%
11South Am
erica To
tal
69.44
100%
0%1%
2%0%
1%0%
1%3%
0%1%
0%1%
1%1%
1%0%
0%0%
29%
41%
48%
1%0%
8%0%
1%0%
59%
26Num
ber o
f Recipient Cou
ntrie
s12
‐4
312
17
21
40
11
33
26
91
18
128
10
113
89
12‐

Mapping the Donor Landscape in Global Health: HIV/AIDS 19
APPE
NDIX
TABL
E 5.
FAR
EAST
ASI
A, H
IV/A
IDS
DONO
RS A
ND R
ECIP
IENT
COU
NTRI
ES, 2
009-
2011
Recipien
tsAll D
onors
Total
Percen
t of Total
Australia
Belgium
Cana
daDen
mark
EU
Institu
tions
Finlan
dFran
ceGerman
yGreece
Ireland
Italy
Japa
nKo
rea
Nethe
rland
sNew
Zealand
Norway
Swed
enSw
itzerland
United
Kingdo
mUnited
States
DAC
Co
untries
AsDB Special
Fund
sGloba
l Fund
IDA
UNAIDS
UNDP
UNFPA
UNICEF
WFP
Multilateral
Total
Num
ber
of Don
ors
Cambo
dia
55.75
15%
3%0%
0%0%
1%‐
1%1%
‐0%
0%‐
‐‐
‐0%
0%‐
4%34
%46
%‐
51%
‐2%
‐‐
1%1%
54%
17Ch
ina
91.27
24%
8%‐
0%‐
0%0%
0%30
%‐
‐‐
0%‐
‐0%
1%0%
‐8%
12%
60%
‐37
%‐
2%0%
0%1%
‐40
%17
Indo
nesia
55.47
15%
26%
‐0%
‐1%
‐‐
3%‐
‐‐
0%‐
1%0%
‐0%
‐3%
12%
46%
‐51
%‐
2%0%
1%0%
0%54
%16
Laos
8.84
2%10
%‐
0%1%
‐‐
2%‐
‐‐
‐‐
‐‐
‐1%
0%‐
‐13
%27
%‐
68%
‐3%
0%‐
2%‐
73%
11Malaysia
0.48
0%‐
‐‐
‐‐
0%‐
‐‐
‐‐
‐‐
‐‐
‐1%
‐‐
‐1%
‐92
%‐
7%‐
‐0%
‐99
%5
Mon
golia
3.12
1%0%
‐0%
‐‐
‐‐
3%‐
‐‐
0%‐
‐‐
‐0%
‐0%
‐3%
‐96
%‐
1%‐
‐0%
‐97
%9
Philipp
ines
6.74
2%2%
‐0%
‐‐
‐‐
37%
‐‐
‐‐
‐‐
‐‐
1%‐
‐14
%54
%‐
35%
‐8%
0%0%
3%‐
46%
10Thailand
39.80
11%
0%‐
0%‐
0%‐
7%‐
‐‐
‐0%
‐‐
‐0%
0%0%
0%14
%22
%‐
75%
‐2%
0%0%
0%‐
78%
15Timor‐Leste
2.15
1%3%
‐0%
‐‐
‐‐
‐‐
3%‐
1%‐
‐‐
‐0%
‐‐
1%7%
‐92
%‐
1%0%
‐‐
‐93
%9
Vietnam
106.71
28%
2%0%
0%0%
0%‐
0%1%
‐0%
0%0%
0%1%
‐0%
0%‐
8%63
%77
%2%
16%
4%1%
0%0%
0%‐
23%
23Far E
ast A
sia, regional
6.11
2%44
%‐
0%‐
‐‐
‐‐
2%‐
‐‐
‐‐
‐‐
0%‐
‐20
%67
%‐
10%
‐23
%‐
‐‐
‐33
%7
Far E
ast A
sia To
tal
376.43
100%
8%0%
0%0%
0%0%
1%9%
0%0%
0%0%
0%0%
0%0%
0%0%
5%30
%55
%1%
40%
1%2%
0%0%
1%0%
45%
28Num
ber o
f Recipient Cou
ntrie
s10
‐9
29
35
25
60
32
61
22
510
16
810
110
110
75
92
10‐
LEGE
ND:
Less
than
$1 m
illio
n
Betw
een
$1 a
nd $
5 m
illio
n
Betw
een
$5 a
nd $
10 m
illio
n
Betw
een
$10
and
$25
mill
ion
Be
twee
n $2
5 an
d $1
00 m
illio
n
Mor
e th
an $
100
mill
ion
APPE
NDIX
TABL
E 6.
SOU
TH &
CEN
TRAL
ASI
A, H
IV/A
IDS
DONO
RS A
ND R
ECIP
IENT
COU
NTRI
ES, 2
009-
2011
Recipien
tsAll D
onors
Total
Percen
t of Total
Australia
Austria
Cana
daCzech
Repu
blic
Den
mark
EU
Institu
tions
Finlan
dGerman
yIre
land
Italy
Japa
nLuxembo
urg
Nethe
rland
sNorway
Spain
Swed
enSw
itzerland
United
Kingdo
mUnited
States
DAC
Co
untries
AsDB Special
Fund
sGloba
l Fund
IDA
OFID
UNAIDS
UNDP
UNFPA
UNICEF
WFP
Multilateral
Total
United Arab
Em
irates
Non
‐DAC
Co
untries
Num
ber
of Don
ors
Afghanistan
6.74
2%0%
‐0%
‐‐
‐‐
‐0%
‐‐
‐5%
‐‐
0%‐
‐25
%30
%‐
26%
38%
‐‐
0%‐
3%3%
70%
‐‐
11Armen
ia4.24
1%0%
‐‐
‐‐
‐‐
‐‐
‐‐
‐‐
‐‐
0%‐
‐‐
0%‐
89%
5%‐
7%0%
‐0%
‐10
0%‐
‐7
Azerbaijan
4.72
1%0%
‐‐
‐‐
‐‐
‐‐
‐‐
‐‐
1%‐
‐‐
‐1%
2%‐
95%
‐‐
3%‐
‐0%
‐98
%‐
‐6
Banglade
sh18
.03
4%1%
‐2%
‐0%
‐‐
8%‐
‐‐
‐0%
0%‐
3%1%
‐15
%31
%‐
67%
‐‐
3%‐
‐1%
‐69
%‐
‐12
Bhutan
0.85
0%10
%‐
‐‐
‐‐
‐‐
‐‐
1%‐
‐‐
‐‐
‐‐
‐11
%‐
67%
15%
‐3%
‐0%
4%‐
89%
‐‐
7Geo
rgia
8.03
2%‐
‐0%
‐‐
0%‐
‐‐
0%‐
‐‐
2%‐
1%‐
‐12
%17
%‐
82%
‐‐
1%0%
‐0%
0%83
%‐
‐11
India
285.60
68%
1%‐
0%‐
0%0%
0%0%
0%0%
0%0%
‐0%
0%0%
0%20
%10
%32
%‐
48%
17%
‐0%
1%0%
1%‐
68%
‐‐
22Kazakhstan
5.71
1%‐
‐‐
‐0%
3%‐
1%‐
‐‐
‐‐
‐‐
‐‐
‐10
%14
%‐
74%
‐‐
10%
0%0%
1%‐
86%
‐‐
9Kyrgyz Rep
ublic
6.88
2%‐
‐‐
‐‐
‐1%
22%
‐‐
‐‐
‐‐
‐0%
‐‐
7%30
%‐
64%
‐‐
1%4%
‐1%
‐70
%‐
‐8
Maldives
0.37
0%24
%‐
‐‐
‐‐
‐‐
‐‐
‐‐
‐‐
‐‐
‐‐
‐24
%‐
72%
‐‐
1%1%
‐2%
‐76
%‐
‐5
Myanm
ar20
.54
5%6%
‐‐
‐1%
5%‐
2%‐
0%5%
‐‐
0%‐
‐‐
10%
10%
41%
‐37
%‐
‐4%
2%11
%5%
0%59
%‐
‐15
Nep
al19
.52
5%2%
‐0%
‐3%
1%‐
0%‐
‐0%
0%‐
1%‐
0%‐
21%
31%
60%
‐19
%11
%‐
4%2%
1%2%
‐40
%0%
0%18
Pakistan
9.84
2%1%
‐7%
‐‐
4%0%
10%
‐‐
‐‐
‐‐
‐1%
0%2%
39%
64%
‐11
%10
%‐
9%‐
2%4%
‐36
%‐
‐14
Sri Lanka
2.01
0%7%
‐0%
‐‐
‐‐
‐‐
‐1%
‐‐
‐‐
2%‐
‐1%
11%
‐63
%‐
‐23
%‐
3%0%
‐89
%‐
‐9
Tajikistan
6.76
2%‐
‐‐
0%‐
1%‐
2%‐
‐‐
‐‐
‐‐
0%‐
‐10
%13
%0%
71%
‐‐
3%7%
0%1%
5%87
%‐
‐12
Turkmen
istan
0.35
0%‐
‐‐
‐‐
‐‐
‐‐
‐‐
‐‐
‐‐
‐‐
‐53
%53
%‐
‐‐
‐16
%6%
15%
11%
‐47
%‐
‐5
Uzbekistan
7.90
2%‐
0%‐
‐‐
‐0%
‐‐
‐0%
‐‐
‐‐
‐‐
‐8%
8%‐
65%
18%
‐5%
‐‐
3%‐
92%
‐‐
8Ce
ntral A
sia, regional
9.64
2%‐
‐0%
‐‐
‐‐
29%
‐‐
‐‐
4%‐
‐0%
‐‐
41%
74%
‐‐
22%
4%‐
‐‐
‐‐
26%
‐‐
7South Asia, regional
0.16
0%‐
‐‐
‐‐
‐‐
‐‐
‐‐
‐‐
‐‐
11%
48%
‐‐
59%
‐‐
‐‐
‐‐
‐41
%‐
41%
‐‐
3South & Cen
tral Asia
, regional
2.71
1%33
%‐
‐‐
4%‐
‐‐
‐‐
‐‐
‐‐
‐0%
‐‐
0%37
%‐
63%
‐‐
‐‐
‐‐
‐63
%‐
‐5
South & Cen
tral Asia To
tal
420.61
100%
1%0%
0%0%
0%1%
0%2%
0%0%
0%0%
0%0%
0%0%
0%15
%12
%33
%0%
48%
14%
0%2%
1%1%
1%0%
67%
0%0%
29Num
ber o
f Recipient Cou
ntrie
s17
‐11
17
15
74
82
36
22
61
103
414
171
167
016
119
174
171
1‐

Mapping the Donor Landscape in Global Health: HIV/AIDS 20
APPE
NDIX
TABL
E 7.
MID
DLE
EAST
REG
ION:
HIV
/AID
S DO
NORS
AND
REC
IPIE
NT C
OUNT
RIES
, 200
9-20
11
Recipien
tsAll D
onors
Total
Percen
t of Total
Australia
Cana
daEU
Institu
tions
Greece
Ireland
Japa
nSw
eden
Switzerland
United
States
DAC
Co
untriesGloba
l Fund
UNAIDS
UNDP
UNFPA
UNICEF
WFP
Multilateral
Total
Num
ber
of Don
ors
Iran
4.04
38%
‐‐
1%‐
‐1%
‐0%
‐2%
79%
8%‐
5%7%
‐98
%7
Iraq
0.04
0%‐
1%‐
‐‐
‐8%
‐‐
9%‐
77%
‐‐
13%
‐91
%4
Jordan
1.35
13%
‐0%
‐‐
‐‐
1%‐
11%
12%
86%
2%‐
‐0%
‐88
%6
Leba
non
0.23
2%0%
0%‐
‐‐
‐11
%‐
‐11
%‐
8%‐
77%
4%‐
89%
6Syria
0.23
2%‐
‐‐
‐‐
‐‐
‐‐
‐‐
‐22
%59
%19
%‐
100%
3West B
ank & Gaza Strip
1.13
11%
‐0%
‐‐
2%2%
10%
‐‐
15%
80%
‐3%
2%0%
‐85
%8
Yemen
2.21
21%
‐‐
4%‐
0%‐
1%‐
1%5%
73%
6%2%
‐14
%1%
95%
9Middle East, regiona
l1.45
14%
‐0%
‐4%
‐‐
4%‐
‐8%
‐92
%‐
‐‐
‐92
%4
Middle East Total
10.67
100%
0%0%
1%1%
0%1%
2%0%
2%6%
65%
17%
1%5%
6%0%
94%
15Num
ber o
f Recipient Cou
ntrie
s7
‐1
42
02
25
12
64
53
47
17
‐
LEGE
ND:
Less
than
$1 m
illio
n
Betw
een
$1 a
nd $
5 m
illio
n
Betw
een
$5 a
nd $
10 m
illio
n
Betw
een
$10
and
$25
mill
ion
Be
twee
n $2
5 an
d $1
00 m
illio
n
Mor
e th
an $
100
mill
ion
APPE
NDIX
TABL
E 8.
EUR
OPE
REGI
ON: H
IV/A
IDS
DONO
RS A
ND R
ECIP
IENT
COU
NTRI
ES, 2
009-
2011
Recipien
tsAll D
onors
Total
Percen
t of Total
Austria
Cana
daCzech Re
public
EU
Institu
tions
German
yIta
lyJapa
nNethe
rland
sNorway
Swed
enUnited
Kingdo
mUnited
States
DAC
Co
untries
Globa
l Fund
UNAIDS
UNDP
UNFPA
UNICEF
Multilateral
Total
Num
ber
of Don
ors
Albania
1.04
1%‐
‐‐
‐‐
‐‐
‐‐
11%
‐5%
15%
80%
3%‐
‐2%
85%
5Be
larus
5.28
7%‐
‐‐
‐‐
‐‐
‐‐
3%‐
0%3%
91%
4%0%
‐1%
97%
6Bo
snia‐Herzegovina
4.78
6%‐
1%‐
‐10
%2%
‐‐
‐3%
‐‐
15%
83%
1%‐
‐0%
85%
7Croatia
0.05
0%‐
‐‐
‐‐
‐‐
‐‐
‐‐
‐‐
‐10
0%‐
‐‐
100%
1Ko
sovo
1.10
1%‐
‐‐
‐‐
2%‐
‐‐
12%
‐‐
13%
81%
4%‐
‐1%
87%
5Maced
onia, FYR
2.24
3%‐
‐‐
‐‐
‐‐
‐‐
‐‐
‐‐
99%
1%‐
‐0%
100%
3Moldo
va6.84
9%‐
‐0%
‐1%
‐0%
‐‐
0%‐
1%3%
91%
5%1%
0%0%
97%
10Mon
tene
gro
1.04
1%‐
0%‐
‐‐
‐‐
‐‐
3%‐
‐3%
93%
3%‐
‐0%
97%
5Serbia
4.76
6%‐
1%‐
‐‐
‐‐
‐‐
0%‐
1%2%
97%
1%0%
‐0%
98%
7Turkey
0.08
0%‐
‐‐
‐‐
‐‐
‐‐
2%‐
‐2%
‐64
%‐
‐35
%98
%3
Ukraine
47.62
59%
0%0%
‐1%
7%0%
0%‐
0%0%
‐14
%23
%75
%2%
0%0%
0%77
%14
Europe
, regional (incl. Ex‐Yugo)
5.31
7%2%
31%
‐‐
6%‐
‐3%
‐0%
4%1%
47%
‐52
%‐
1%‐
53%
9Eu
rope
Total
80.14
100%
0%2%
0%0%
5%0%
0%0%
0%1%
0%8%
19%
75%
6%0%
0%0%
81%
17Num
ber o
f Recipient Cou
ntrie
s11
‐1
41
13
32
01
90
59
911
42
1011
‐

Mapping the Donor Landscape in Global Health: HIV/AIDS 21
APPE
NDIX
TABL
E 9.
OCE
ANIA
REG
ION:
HIV
/AID
S DO
NORS
AND
REC
IPIE
NT C
OUNT
RIES
, 200
9-20
11
Recipien
tsAll D
onors
Total
Percen
t of Total
Australia
Cana
daEU
Institu
tions
Greece
Japa
nNew
Zealand
Swed
enUnited States
DAC
Co
untries
AsDB Special
Fund
sGloba
l Fund
UNAIDS
UNDP
UNFPA
UNICEF
Multilateral
Total
Num
ber
of Don
ors
Cook
Island
s0.00
0%55
%45
%‐
‐‐
‐‐
‐10
0%‐
‐‐
‐‐
‐‐
2Fiji
0.65
1%1%
‐‐
‐‐
‐‐
‐1%
‐‐
99%
‐‐
‐99
%2
Microne
sia, Fed
. States
0.00
0%‐
100%
‐‐
‐‐
‐‐
100%
‐‐
‐‐
‐‐
‐1
Papu
a New
Guine
a47
.50
77%
81%
0%0%
‐‐
2%‐
5%88
%5%
4%2%
0%0%
0%12
%11
Samoa
0.03
0%‐
‐3%
‐‐
‐1%
‐4%
‐‐
96%
‐‐
‐96
%3
Solomon
Island
s0.11
0%99
%1%
‐‐
‐‐
‐‐
100%
‐‐
‐‐
‐‐
‐2
Tong
a0.00
0%‐
‐‐
‐10
0%‐
‐‐
100%
‐‐
‐‐
‐‐
‐1
Vanu
atu
1.22
2%10
0%0%
‐‐
‐‐
‐‐
100%
‐‐
‐‐
‐‐
‐2
Ocean
ia, regiona
l12
.07
20%
45%
‐0%
0%‐
10%
‐0%
56%
‐39
%‐
‐‐
5%44
%7
Ocean
ia Total
61.57
100%
74%
0%0%
0%0%
3%0%
4%81
%4%
11%
2%0%
0%1%
19%
14Num
ber o
f Recipient Cou
ntrie
s8
‐5
52
01
11
18
11
31
11
3‐
LEGE
ND:
Less
than
$1 m
illio
n
Betw
een
$1 a
nd $
5 m
illio
n
Betw
een
$5 a
nd $
10 m
illio
n
Betw
een
$10
and
$25
mill
ion
Be
twee
n $2
5 an
d $1
00 m
illio
n
Mor
e th
an $
100
mill
ion
Mapping the Donor Landscape in Global Health: HIV/AIDS 22
Endnotes
1 Bonnel R. The Financial Architecture of the Response to the HIV Epidemic: Challenges and Sustainability Issues. Chapter 7 in: The Changing HIV/AIDS Landscape, World Bank, pp 161-196, 2009. Available at: http://siteresources.worldbank.org/INTAFRREGTOPHIVAIDS/Resources/The_Changing_HIV-AIDS_Landscape.pdf.
2 For an analysis of OECD foreign aid fragmentation from 2005-2009 that includes HIV/AIDS and other aid sectors, see: Burcky U. Trends in In-country Aid Fragmentation and Donor Proliferation: An Analysis of Changes in Aid Allocation Patterns between 2005 and 2009. OECD, June 2011. Available at: http://www.oecd.org/dataoecd/52/9/47823094.pdf; see also: Lawson, ML. Foreign Aid: International Donor Coordination of Development Assistance. Congressional Research Service Report R41185, April 2010. Available at: http://fpc.state.gov/documents/organization/142758.pdf.
3 Center for Global Development. Value for Money in Health [website]. http://www.cgdev.org/page/value-money-agenda-global-health-funding-agencies.
4 United Nations. Monterrey Consensus of the International Conference on Financing for Development. March 2003. Available at: http://www.un.org/esa/ffd/monterrey/MonterreyConsensus.pdf.
5 Organisation for Economic Cooperation and Development. The Paris Declaration on Aid Effectiveness and the Accra Agenda. 2005. Available at: http://www.oecd.org/dataoecd/11/41/34428351.pdf.
6 Knack S, Rahman A. Donor Fragmentation and Bureaucratic Quality in Aid Recipients. World Bank Policy Research Working Paper 3186, 2004. Available at: http://www-wds.worldbank.org/external/default/WDSContentServer/IW3P/IB/2004/02/04/000012009_20040204091915/Rendered/PDF/WPS3186.pdf.
7 Acharya A, de Lima A, Moore M. Aid proliferation: how responsible are the donors? Institute for Development Studies Working Paper 214, 2004. Available at: http://www.ids.ac.uk/files/Wp214.pdf.
8 International Aid Transparency Initiative [website]. Available at: http://www.aidtransparency.net/ 9 U.S. Global Health Initiative. U.S. Government Interagency Paper on Country Ownership. July 2012. Available at:
http://www.ghi.gov/documents/organization/195554.pdf.10 ONE Campaign, From aid effectiveness to development effectiveness: Delivering results through transparency and accountability, November
2011. Available at: http://www.one.org/c/us/policybrief/4128/. 11 Wu Z, Wang Y, Mao Y, Sullivan SG, Juniper N, Bulterys M. The integration of multiple HIV/AIDS projects into a coordinated national
programme in China. Bulletin of the World Health Organization. 89:227-233, 2011. Available at: http://www.who.int/bulletin/volumes/89/3/10-082552/en/index.html.
12 Deutscher E, Fyson S. Improving the Effectiveness of Aid. IMF Finance and Development 45(3), September 2008. Available at: http://www.imf.org/external/pubs/ft/fandd/2008/09/deutscher.htm.
13 Dickinson C, Druce N. Perspectives Integrating Country Coordinating Mechanisms with Existing National Health and AIDS Structures: Emerging Issues and Future Directions. Global Health Governance IV(1), Fall 2010. Available at: http://www.ghgj.org/Dickinson%20and%20Druce_final.pdf.
14 International Health Partnership Plus [website]. Available at: http://www.internationalhealthpartnership.net/en/.15 UNAIDS. The “Three Ones” Key Principles. April 2004. Available at: http://data.unaids.org/una-docs/three-ones_keyprinciples_en.pdf. 16 Institute of Medicine. Evaluation of PEPFAR. February 2013. Available at: http://www.iom.edu/Reports/2013/Evaluation-of-PEPFAR.aspx.17 Baeza C. Harmonization and Alignment in Development Assistance – Now What? World Bank Investing in Health Blog, June 2012
http://blogs.worldbank.org/health/harmonization-and-alignment-in-development-assistance-for-health-now-what.18 U.S. Department of State. PEPFAR Blueprint: Creating an AIDS-free Generation. November 2012. Available at:
http://www.pepfar.gov/documents/organization/201386.pdf. 19 Kaiser Family Foundation and UNAIDS (2012). Financing the Response to AIDS in Low- and Middle-Income Countries: International
Assistance from the G8, European Commission and Other Donor Governments in 2011. Available at: http://www.kff.org/global-health-policy/report/financing-the-response-to-aids-in-low/.
20 Lawson, ML. Foreign Aid: International Donor Coordination of Development Assistance. Congressional Research Service Report R41185, April 2010. Available at: http://fpc.state.gov/documents/organization/142758.pdf.
21 See CSIS (2010). Report on the Commission on Smart Global Health Policy, Center for Strategic and International Studies, Washington, D.C., p. 38. http://csis.org/files/publication/100318_Fallon_SmartGlobalHealth.pdf.
the henry j. kaiser family foundation
Headquarters2400 Sand Hill RoadMenlo Park, CA 94025Phone 650-854-9400 Fax 650-854-4800
Washington Offices and Barbara Jordan Conference Center1330 G Street, NW Washington, DC 20005 Phone 202-347-5270 Fax 202-347-5274
www.kff.org
This publication (#8449) is available on the Kaiser Family Foundation’s website at www.kff.org.
The Kaiser Family Foundation, a leader in health policy analysis, health journalism and communication, is dedicated to filling the need for trusted, independent information on the major health issues facing our nation and its people. The Foundation is a non-profit private operating foundation, based in Menlo Park, California.