Embed Size (px)
Citation preview
Mapping the ArcticERMA Training
University of New HampshireApril 16-19, 2018
Erika KnightAudubon Alaska
image: M
ilo Burcham
Audubon Alaskais a science-based conservation organization thatworks to protect birds, other wildlife, and theirhabitats across the Great Land of Alaska. Weuse science to identify conservation priorities andsupport conservation actions and policies, with anemphasis on public lands and waters, and througheducation we seek to raise public awareness aboutthe natural ecosystems of Alaska.
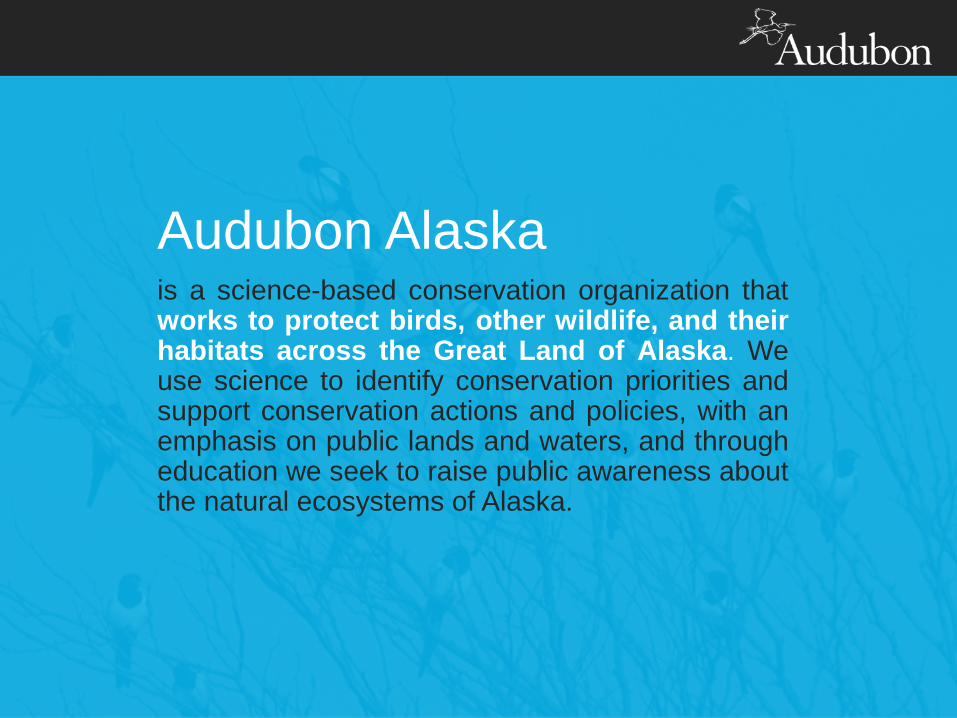
M. Smith, M. Goldman, E. Knight, J. Warrenchuk, M. Zaleski, B. Mecum, B. Sullender, D. Huffman, and N. Warnock
The Ecological Atlas of the Bering,
Chukchi, and Beaufort Seas
LONG LIST OF CONTRIBUTORS• Gordon and Betty Moore
Foundation (D. Kelso and M. Turnipseed)
• National Audubon Society (S. Senner)
• Kawerak (J. Raymond-Yakoubian, tribal representatives)
• AOOS (M. McCammon), Axiom Data Science (M. Herstand)
• Contractors (D. Huffman, E. Cline, B. Raymond-Yakoubian, S.R. Braund & Associates)
• Researchers, traditional knowledge-holders, reviewers
• Funding agencies
Collaborators

Why map the Arctic seas?Increasing interest in the Arctic, intensifying development pressures,
changing climate, and a need to make informed decisions

Make data useable and accessible to a wide range of users Develop a holistic
picture for species and ecosystems Inform planning and
decisions No recent equivalent
product available
Benefits of an Ecological Atlas
image: Moore and Stabeno 2015
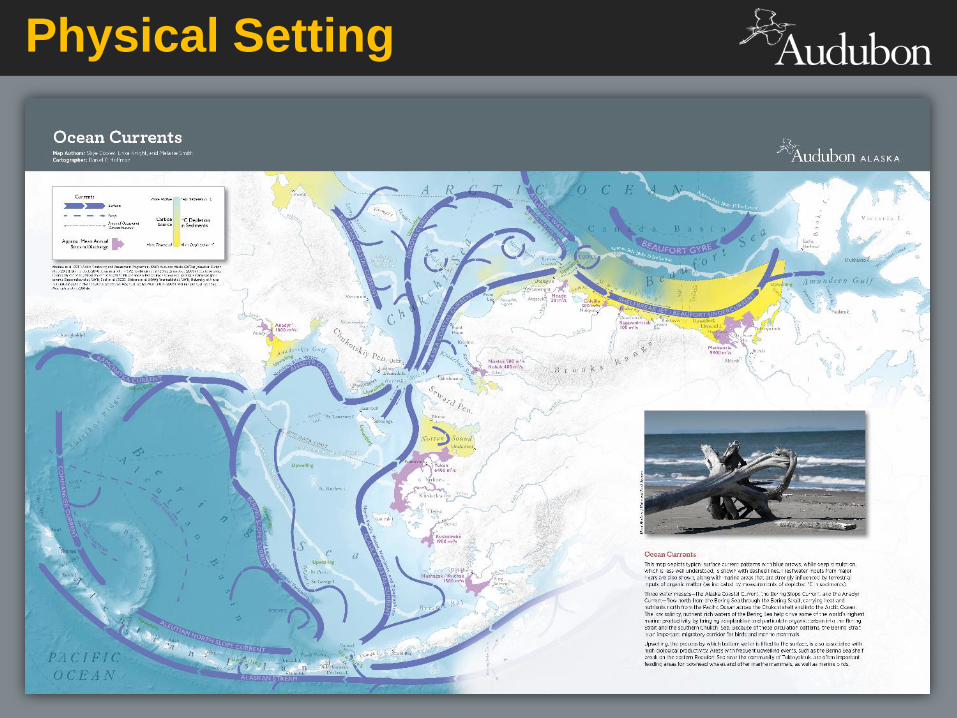
Physical Setting

Biological Setting

Fishes

Birds
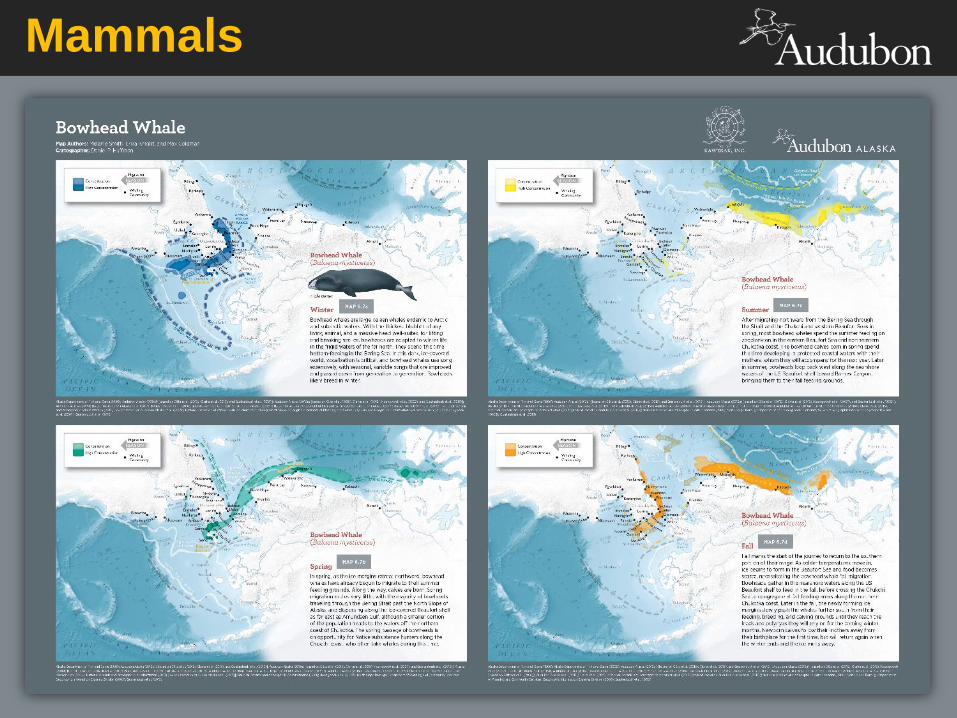
Mammals
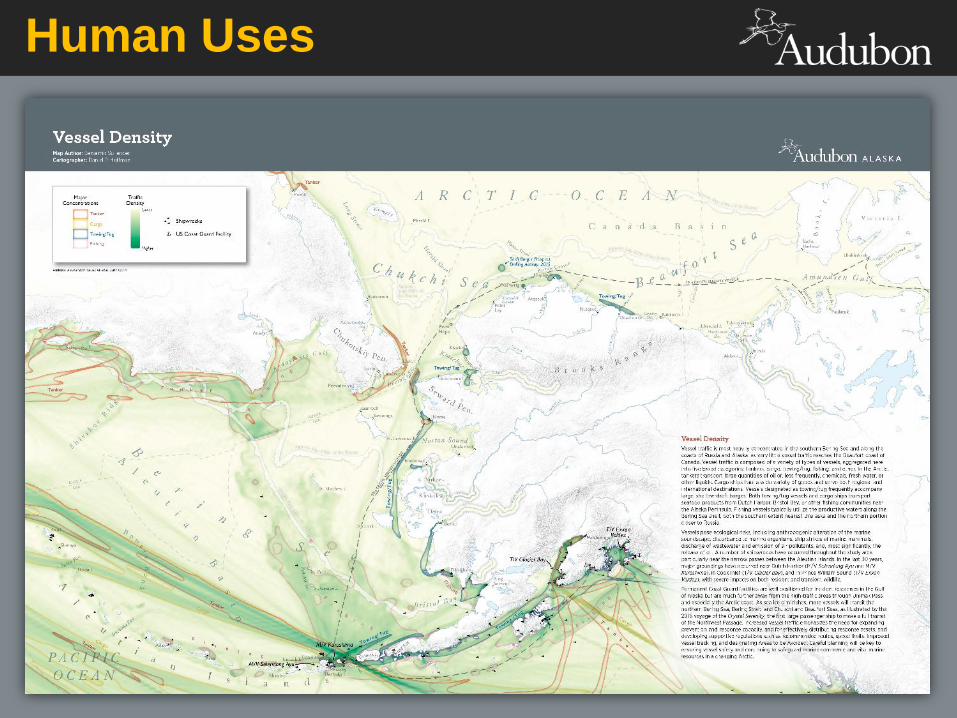
Human Uses
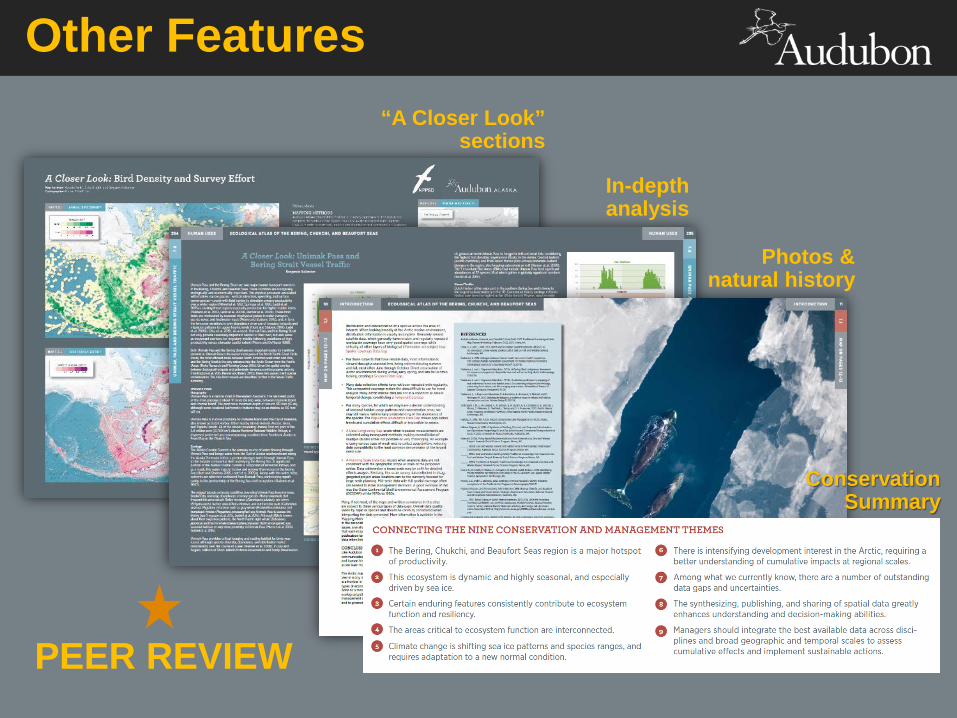
Other Features“A Closer Look”
sections
In-depth analysis
Photos & natural history
Conservation Summary
PEER REVIEW

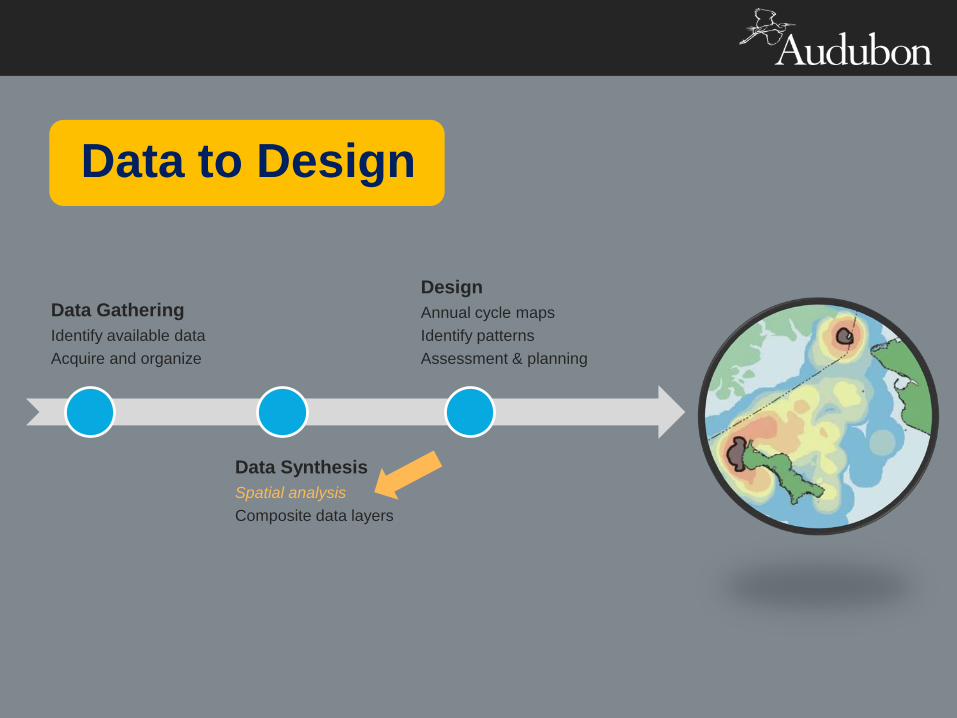
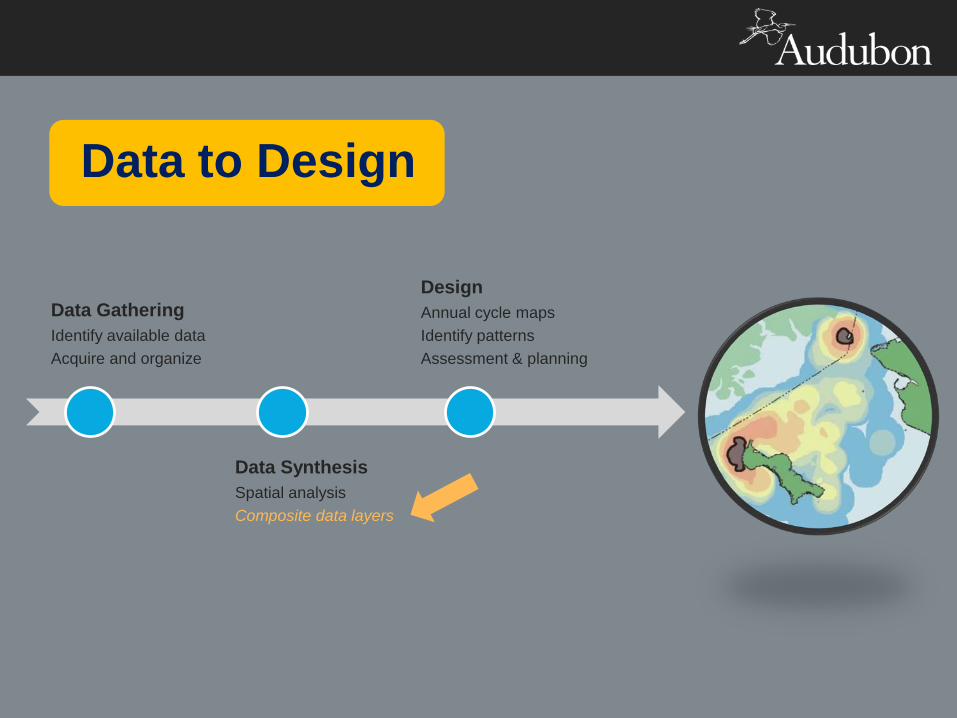
Data GatheringIdentify available dataAcquire and organize
Data SynthesisSpatial analysisComposite data layers
DesignAnnual cycle mapsIdentify patternsAssessment & planning
Data to Design

Data GatheringIdentify available dataAcquire and organize
Data SynthesisSpatial analysisComposite data layers
DesignAnnual cycle mapsIdentify patternsAssessment & planning
Data to Design
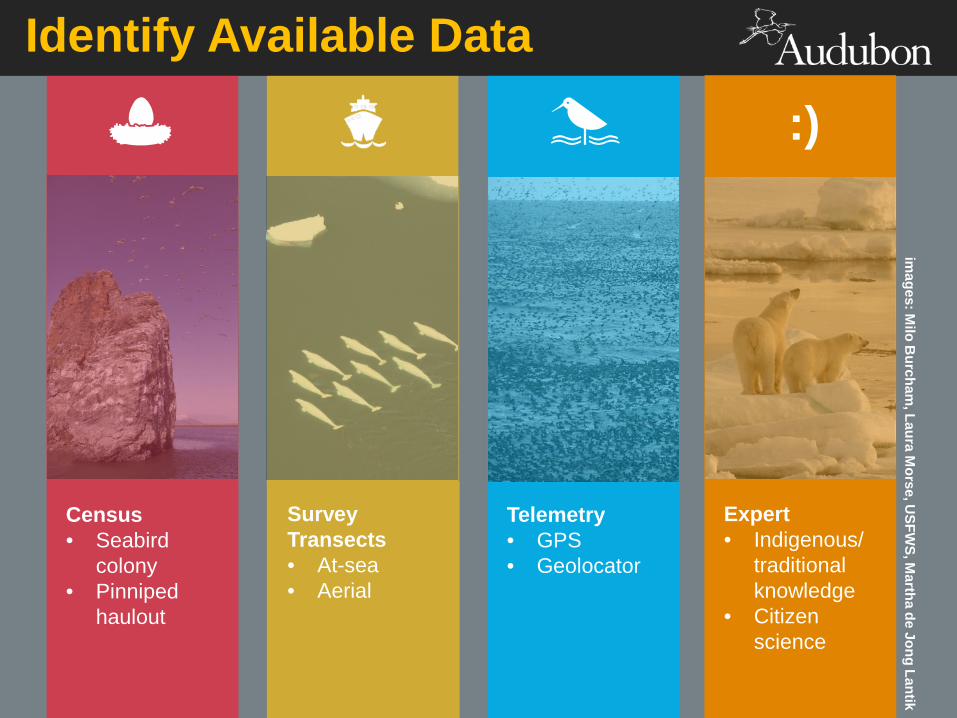
Census• Seabird
colony• Pinniped
haulout
Identify Available Dataim
ages: Milo B
urcham, Laura M
orse, USFW
S, Martha de Jong Lantik
Survey Transects• At-sea• Aerial
Expert• Indigenous/
traditional knowledge
• Citizen science
:)
Telemetry• GPS• Geolocator

Data GatheringIdentify available dataAcquire and organize
Data SynthesisSpatial analysisComposite data layers
DesignAnnual cycle mapsIdentify patternsAssessment & planning
Data to Design
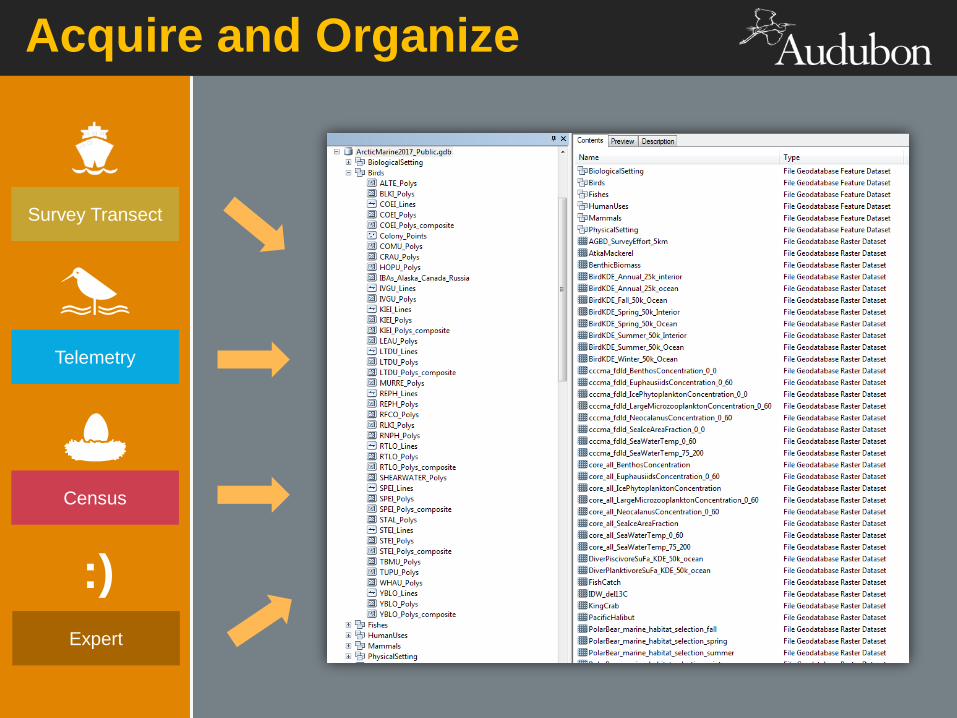
Survey Transect
Telemetry
Census
Acquire and Organize
:)Expert
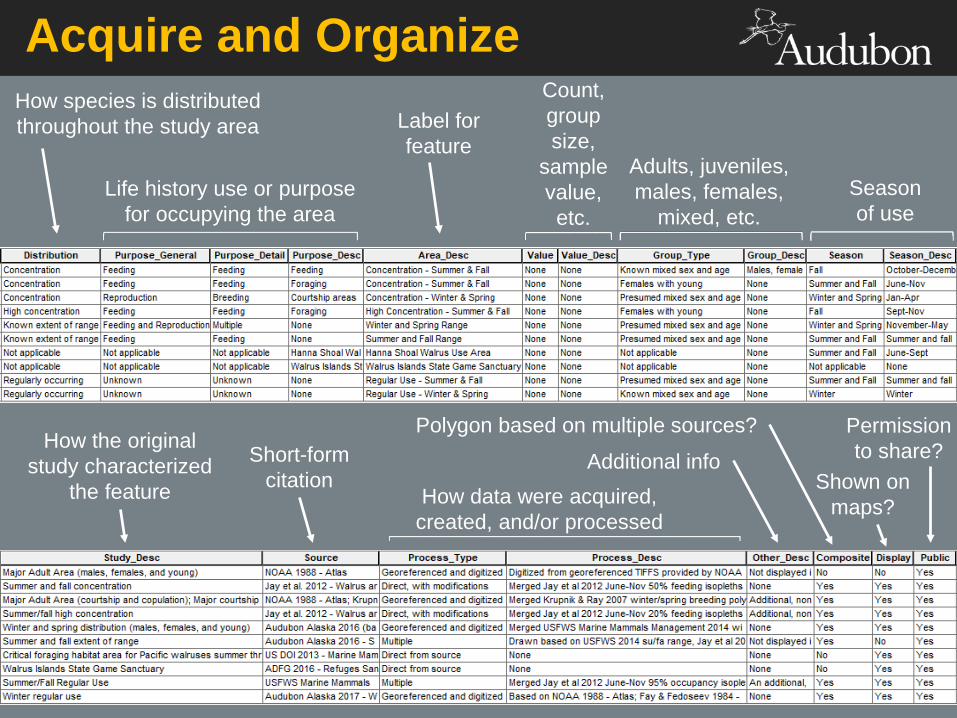
Acquire and OrganizeHow species is distributed throughout the study area
Life history use or purpose for occupying the area
Label for feature
Adults, juveniles, males, females,
mixed, etc.
Count, group size,
sample value, etc.
Season of use
How the original study characterized
the feature
Short-form citation
How data were acquired, created, and/or processed
Additional info
Polygon based on multiple sources?
Shown on maps?
Permission to share?
Data GatheringIdentify available dataAcquire and organize
Data SynthesisSpatial analysisComposite data layers
DesignAnnual cycle mapsIdentify patternsAssessment & planning
Data to Design

Spatial Analysis
Avian Survey Effort in the Beaufort Sea (May - Sept)King Eider in orange.
(Excludes telemetry data)
Image: Milo Burcham

Spatial Analysis
KING EIDER DISTRIBUTION10 x 10 km bins with KIEI present
Density: < <
Image: Milo Burcham
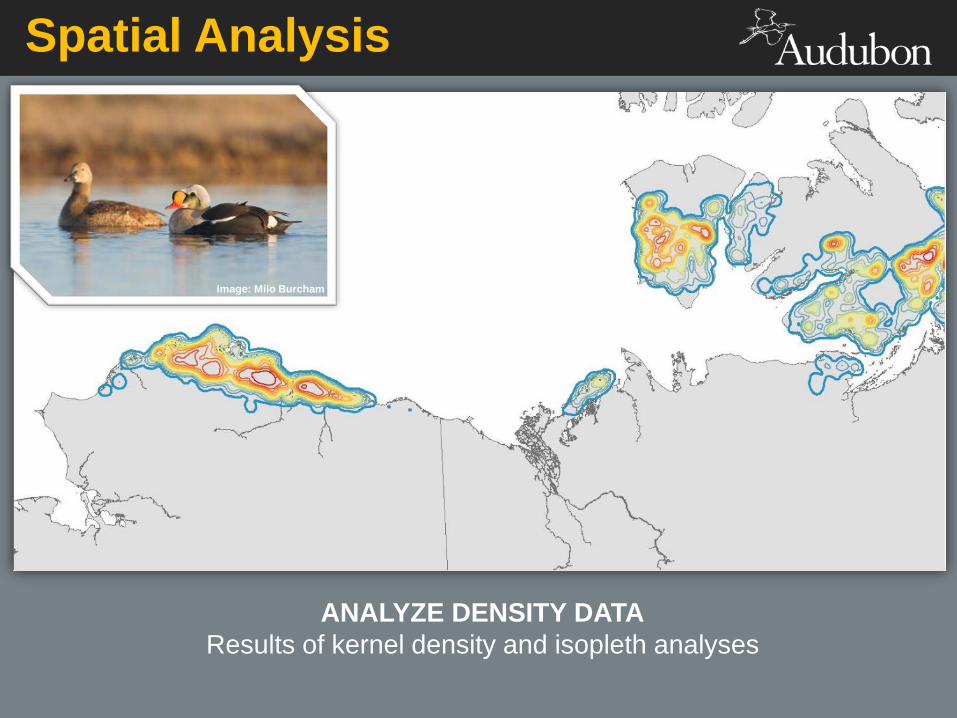
Spatial Analysis
ANALYZE DENSITY DATAResults of kernel density and isopleth analyses
Image: Milo Burcham
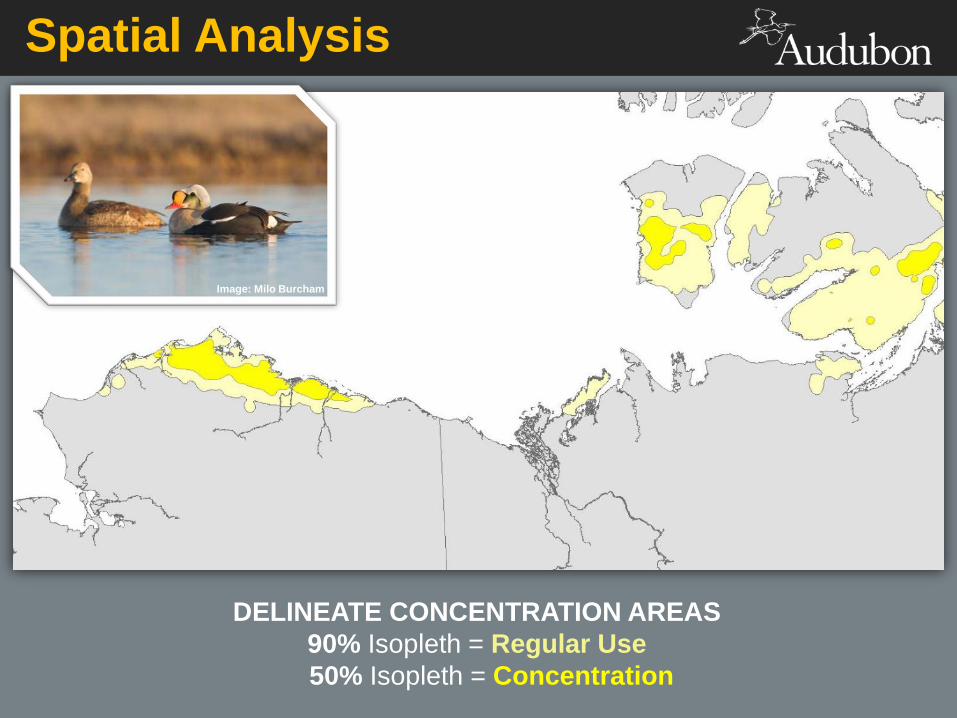
Spatial Analysis
DELINEATE CONCENTRATION AREAS90% Isopleth = Regular Use50% Isopleth = Concentration
Image: Milo Burcham
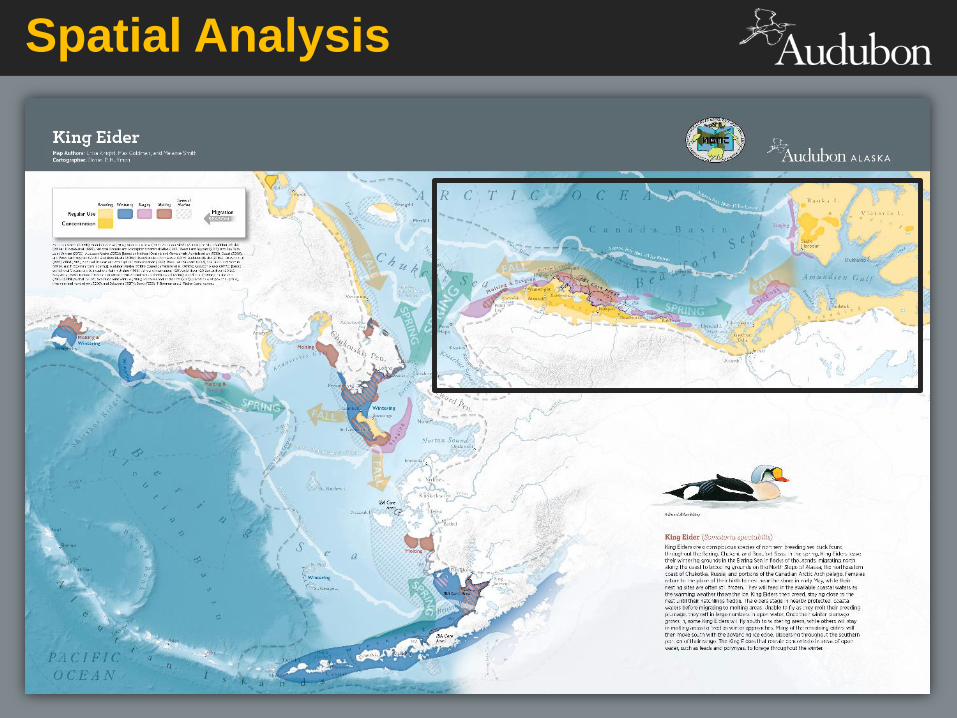
Spatial Analysis
Data GatheringIdentify available dataAcquire and organize
Data SynthesisSpatial analysisComposite data layers
DesignAnnual cycle mapsIdentify patternsAssessment & planning
Data to Design

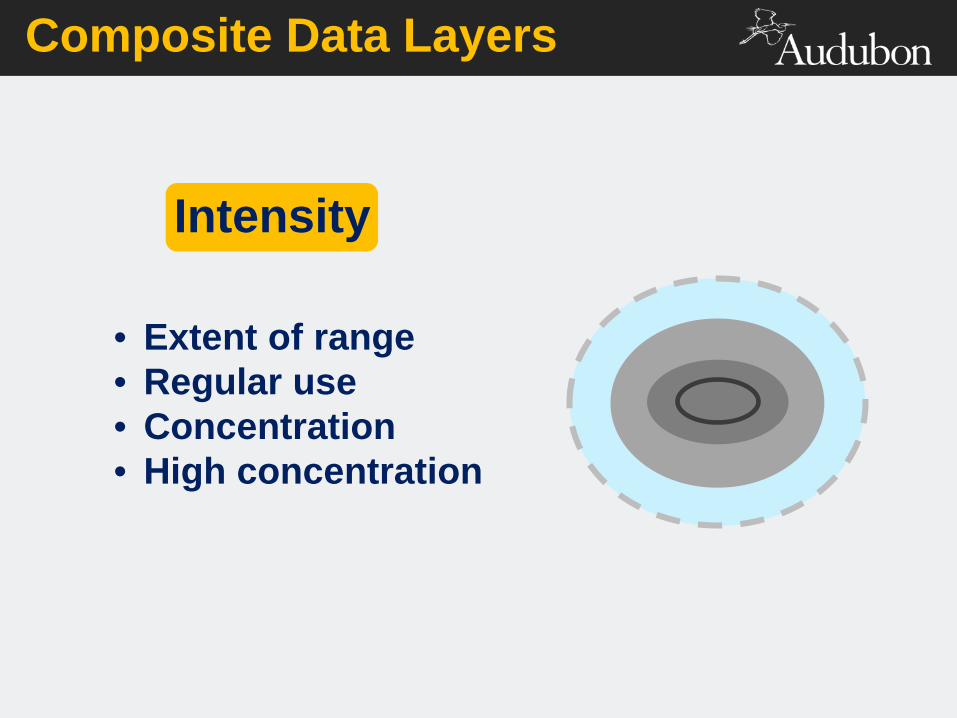
Composite Data Layers
Multiple Studies
1
24
Composite Data Layers
• Extent of range• Regular use• Concentration• High concentration
Intensity
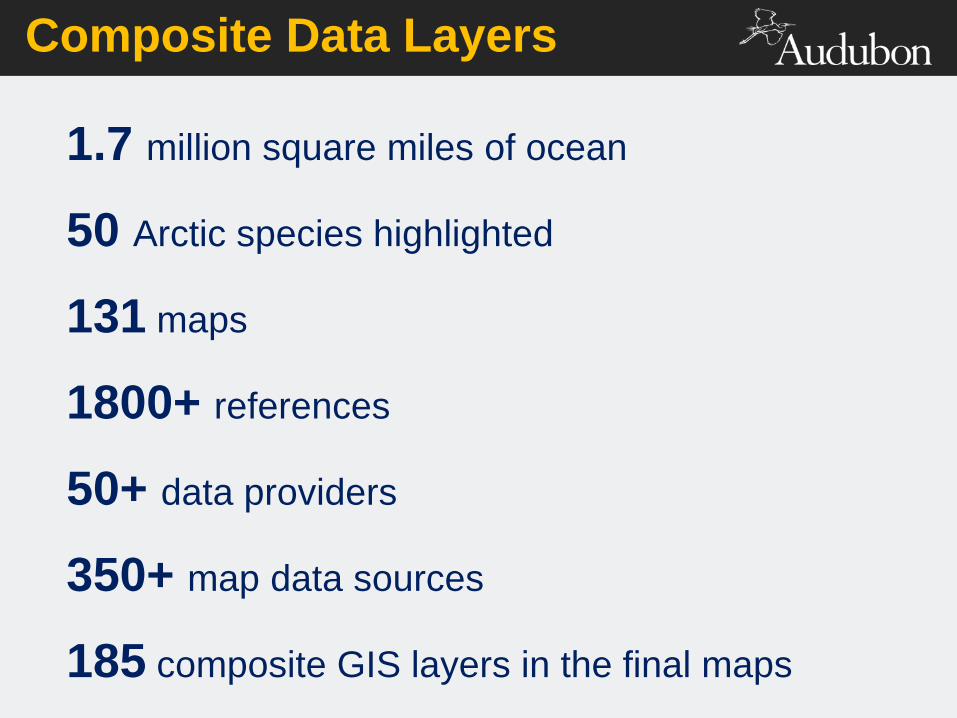
1.7 million square miles of ocean
50 Arctic species highlighted
131 maps
1800+ references
50+ data providers
350+ map data sources
185 composite GIS layers in the final maps
Composite Data Layers
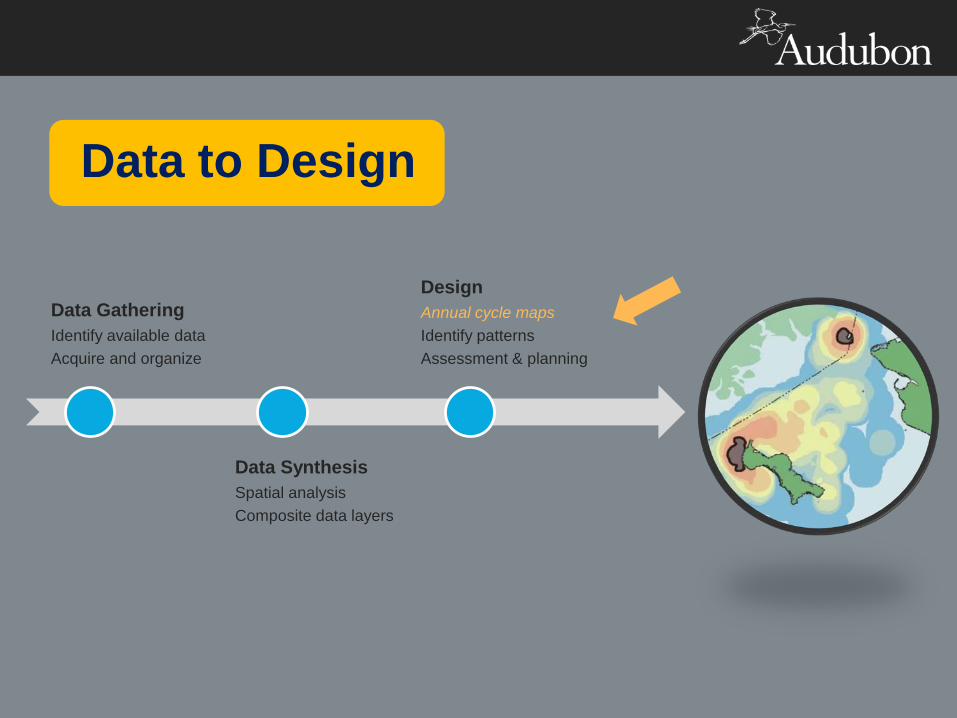
Data GatheringIdentify available dataAcquire and organize
Data SynthesisSpatial analysisComposite data layers
DesignAnnual cycle mapsIdentify patternsAssessment & planning
Data to Design
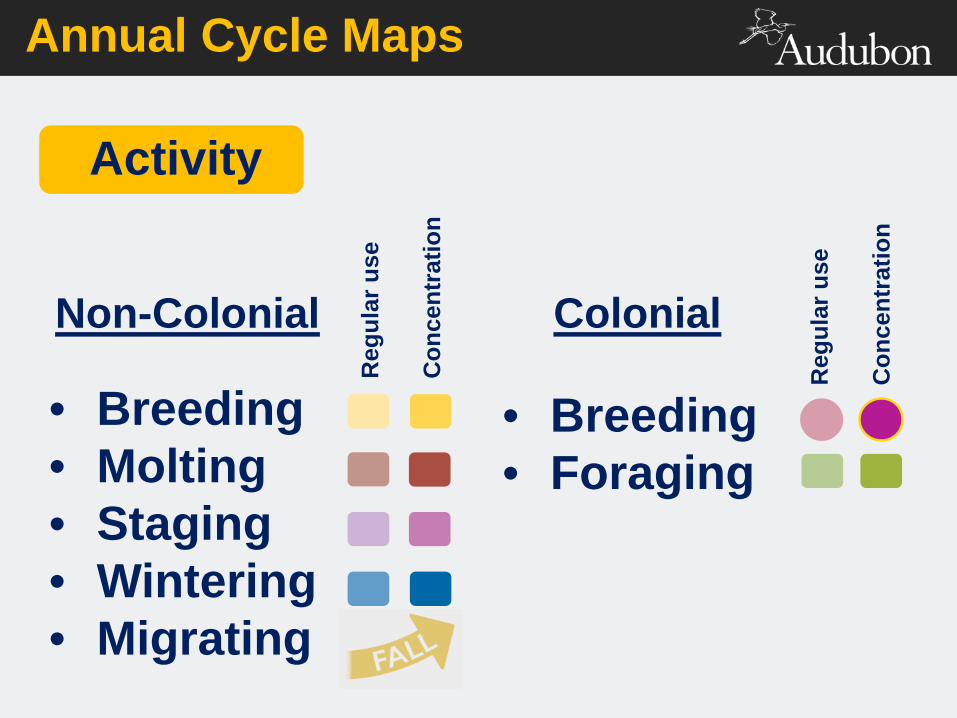
• Breeding• Molting• Staging• Wintering• Migrating
Annual Cycle Maps
Activity
Reg
ular
use
Con
cent
ratio
n• Breeding• Foraging
Colonial
Reg
ular
use
Con
cent
ratio
n
Non-Colonial

Annual Cycle MapsWalrus
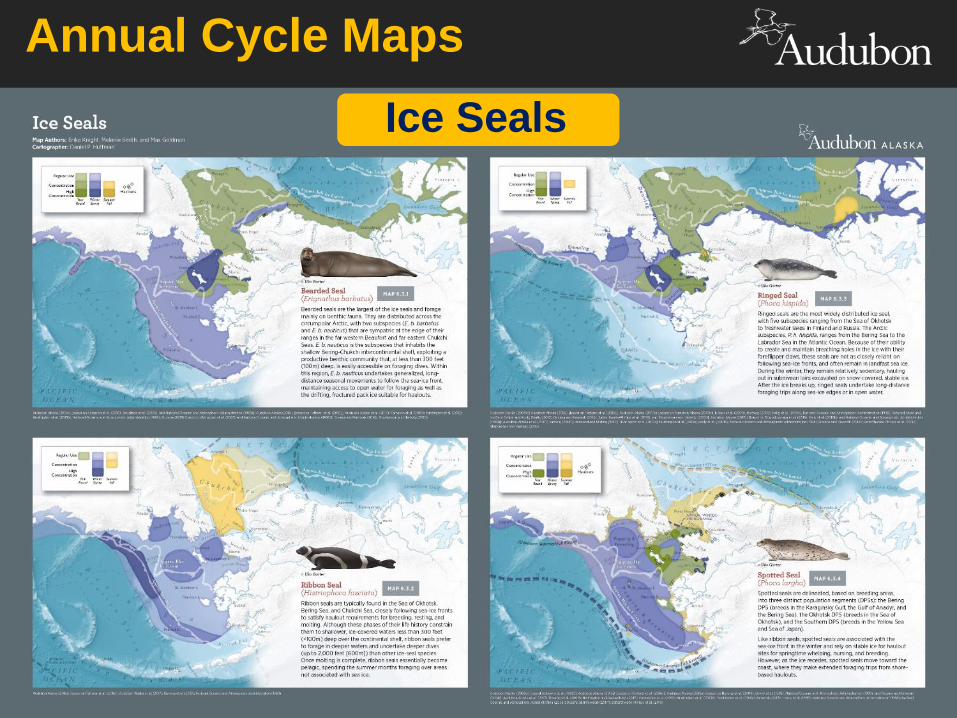
Annual Cycle MapsIce Seals
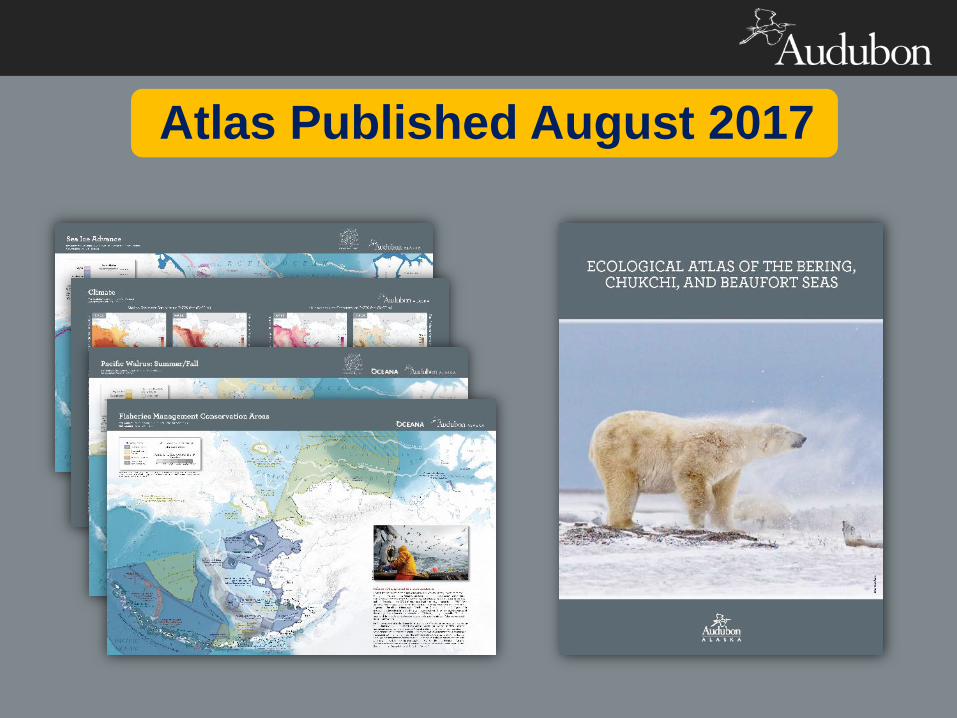
Atlas Published August 2017

Data available in AOOS Arctic Portal (in progress)http://www.aoos.org/aoos-data-resources/

Data GatheringIdentify available dataAcquire and organize
Data SynthesisSpatial analysisComposite data layers
DesignAnnual cycle mapsIdentify patternsAssessment & planning
Data to Design

Identify Patterns
Bird Concentration Areas

Polar Bear‡Walrus
Bearded SealRibbon Seal*Ringed SealSpotted Seal
Steller Sea Lion*Northern Fur Seal*
Beluga WhaleBowhead Whale
Gray WhaleHumpback Whale*
OsmeridsPacific Herring
Walleye Pollock*North Pacific Cods
Atka Mackeral*†Yellowfin Sole*Pacific Halibut*Pacific Salmon
Primary ProductivityZooplankton*
Benthic BiomassSnow Crab*King Crab*
Coral/Sponge Gardens*†
Bird DensityMarine Bird Colonies
Global IBAs
King EiderSpectacled EiderCommon EiderSteller’s Eider
Long-tailed DuckYellow-billed LoonRed-throated Loon
Red-faced Cormorant*Red-necked Phalarope
Red PhalaropeAleutian Tern*
Red-legged Kittiwake*Black-legged Kittiwake
Ivory GullMurres
Horned PuffinTufted Puffin*
Parakeet AukletCrested Auklet*
Whiskered Auklet*†Least Auklet*
Short-tailed Albatross*Shearwaters
Multi-Species Hotspots Ecosystem Ecological HotspotsInputs
MARINE MAMMAL HOTSPOTS
BIRD HOTSPOTS
FISH HOTSPOTS
LOWER TROPHIC HOTSPOTS
ECOSYSTEM HOTSPOTS
maximum
*
†
‡
Not included in Beaufort LME analysis
Not included in Chukchi LME analysis
Not included in East Bering / Aleutians LME analysis
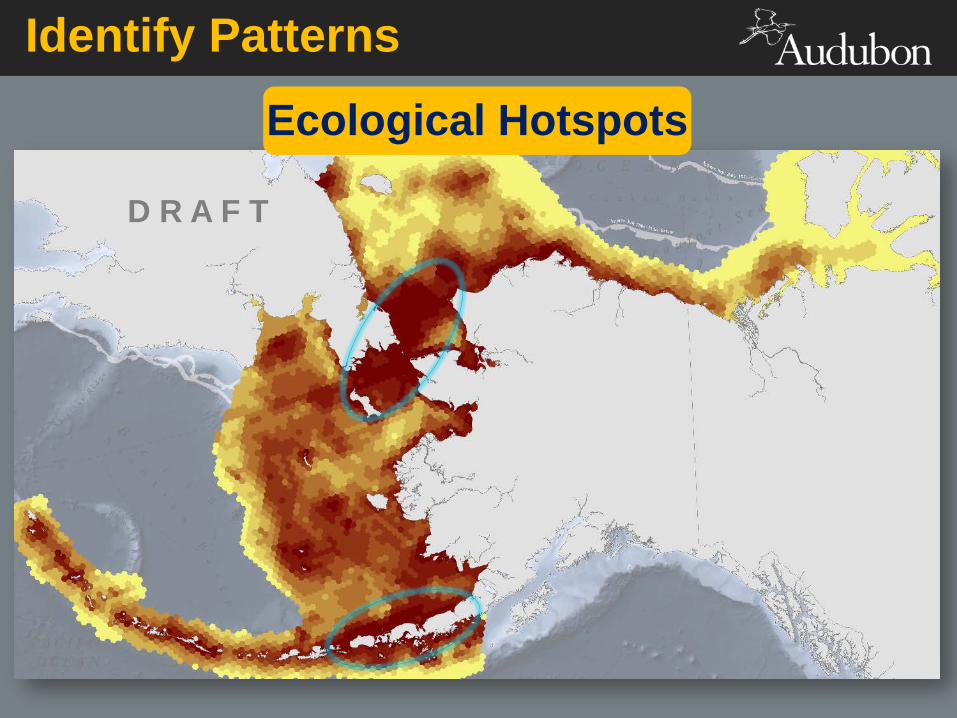
Identify PatternsEcological Hotspots
D R A F T
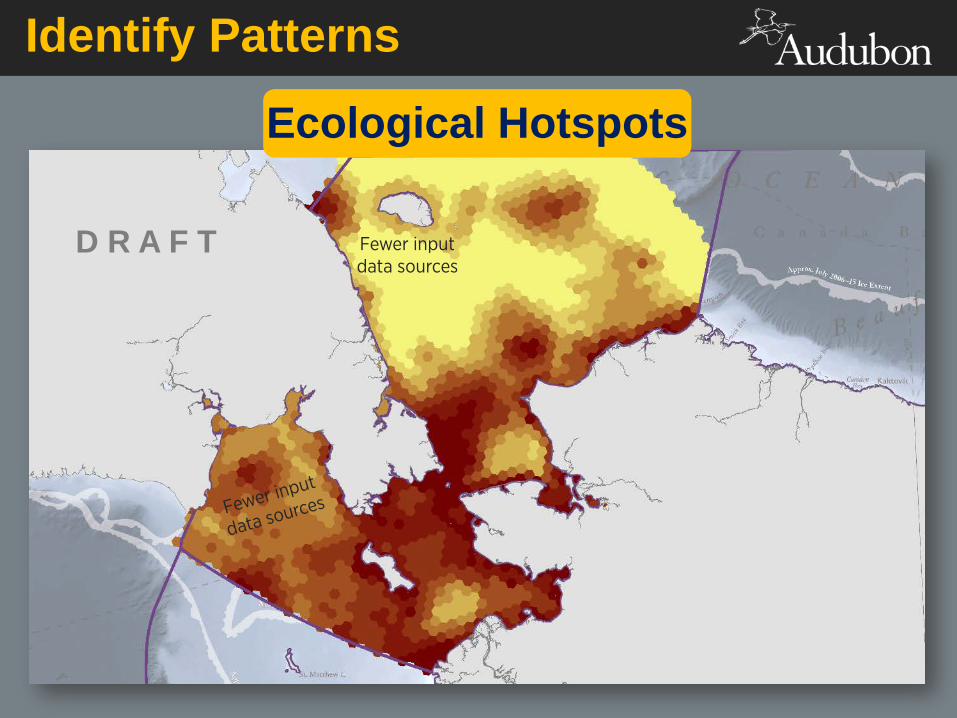
Identify Patterns
Ecological Hotspots
D R A F T Fewer input data sources
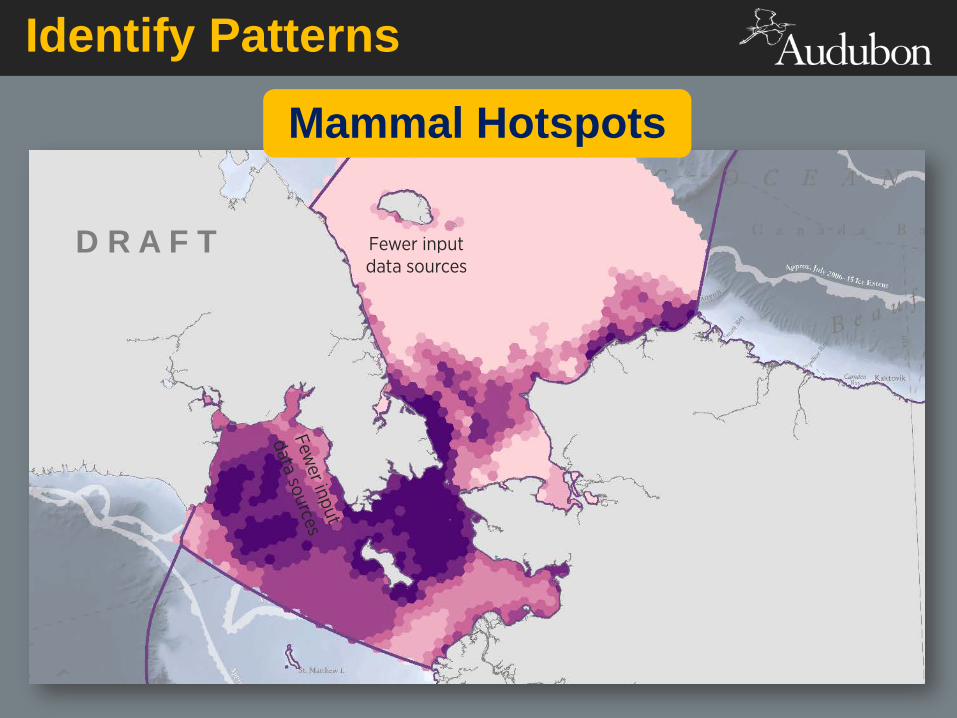
Identify Patterns
Mammal Hotspots
D R A F T Fewer input data sources
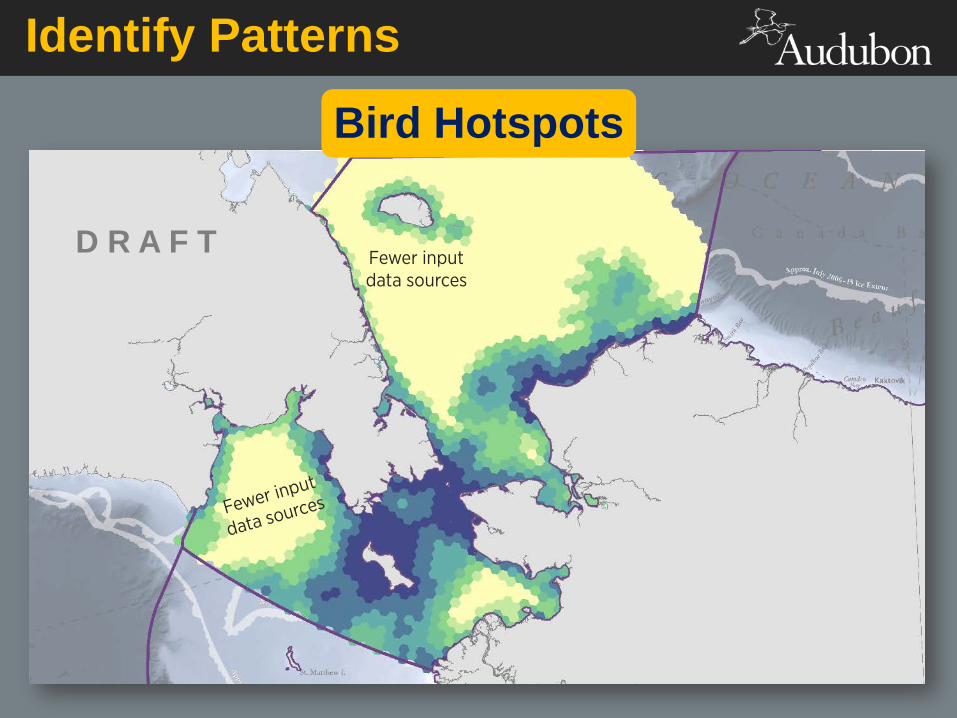
Identify Patterns
Bird Hotspots
D R A F TFewer input data sources
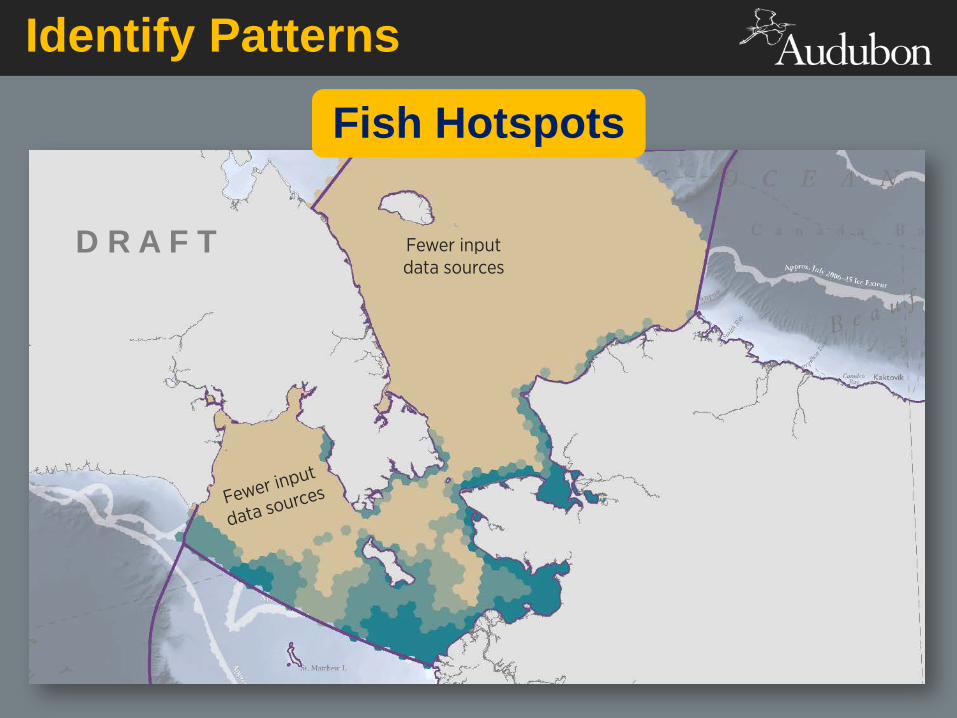
Identify Patterns
Fish Hotspots
D R A F T Fewer input data sources
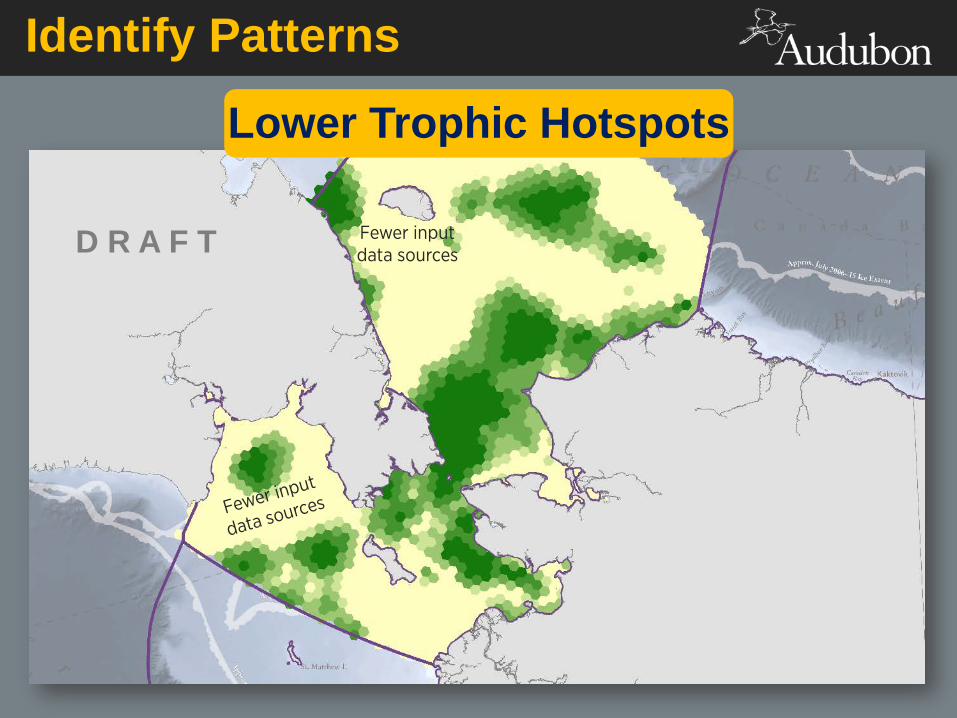
Identify Patterns
Lower Trophic Hotspots
D R A F T Fewer input data sources
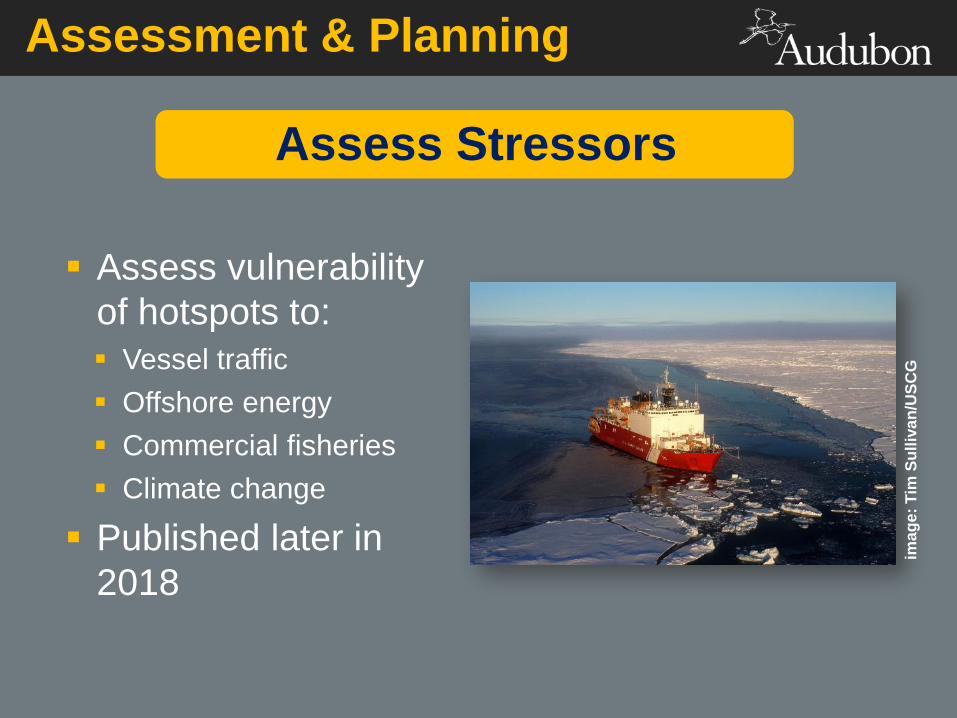
Assess vulnerability of hotspots to: Vessel traffic Offshore energy Commercial fisheries Climate change
Published later in 2018
Assess Stressors
Assessment & Planning
imag
e: T
im S
ulliv
an/U
SCG

Assess vulnerability of hotspots to: Vessel traffic Offshore energy Commercial fisheries Climate change
Published later in 2018
Assess Stressors
Assessment & Planning
imag
e: T
im S
ulliv
an/U
SCG
D R A F T
Vessel Traffic vs Mammal Hotspots
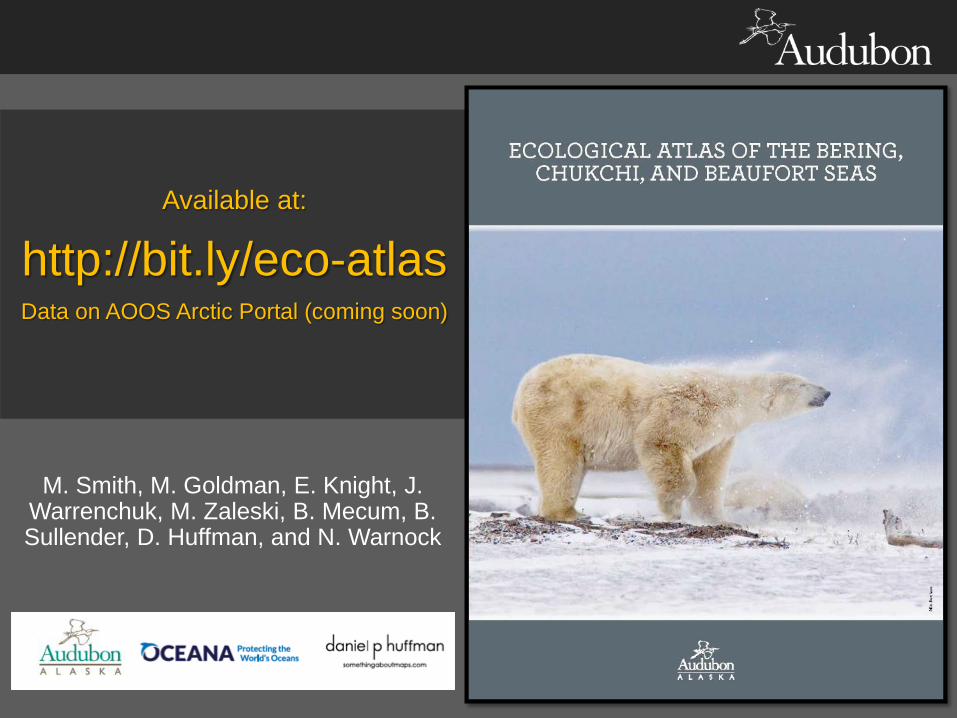
Available at:
http://bit.ly/eco-atlas Data on AOOS Arctic Portal (coming soon)
http://bit.ly/eco-atlas
M. Smith, M. Goldman, E. Knight, J. Warrenchuk, M. Zaleski, B. Mecum, B. Sullender, D. Huffman, and N. Warnock