Embed Size (px)
Citation preview
MAPPING TEXTURES ON 3D TERRAINS:
A HYBRID CELLULAR AUTOMATA APPROACH
A Thesis
by
SWAPNIL SINVHAL
Submitted to the Office of Graduate Studies of Texas A&M University
in partial fulfillment of the requirements for the degree of
MASTER OF SCIENCE
December 2005
Major Subject: Computer Science

MAPPING TEXTURES ON 3D TERRAINS:
A HYBRID CELLULAR AUTOMATA APPROACH
A Thesis
by
SWAPNIL SINVHAL
Submitted to the Office of Graduate Studies of Texas A&M University
in partial fulfillment of the requirements for the degree of
MASTER OF SCIENCE
Approved by:
Chair of Committee, John Keyser Committee Members, Ricardo Gutierrez-Osuna
Charles Culp Head of Department, Valerie E. Taylor
December 2005
Major Subject: Computer Science

iii
ABSTRACT
Mapping Textures on 3D Terrains:
A Hybrid Cellular Automata Approach. (December 2005)
Swapnil Sinvhal, B.Arch., Indian Institute of Technology, Roorkee, India
Chair of Advisory Committee: Dr. John Keyser
It is a time consuming task to generate textures for large 3D terrain surfaces in
computer games, flight simulations and computer animations. This work explores the
use of cellular automata in the automatic generation of textures for large surfaces. I
propose a method for generating textures for 3D terrains using various approaches – in
particular, a hybrid approach that integrates the concepts of cellular automata,
probabilistic distribution according to height and Wang tiles. I also look at other hybrid
combinations using cellular automata to generate textures for 3D terrains. Work for this
thesis includes development of a tool called “Texullar” that allows users to generate
textures for 3D terrain surfaces by configuring various input parameters and choosing
cellular automata rules.
I evaluate the effectiveness of the approach by conducting a user survey to
compare the results obtained by using different inputs and analyzing the results. The
findings show that incorporating concepts of cellular automata in texture generation for
terrains can lead to better results than random generation of textures. The analysis also
reveals that incorporating height information along with cellular automata yields better
results than using cellular automata alone. Results from the user survey indicate that a
iv
hybrid approach incorporating height information along with cellular automata and
Wang tiles is better than incorporating height information along with cellular automata
in the context of texture generation for 3D meshes.
The survey did not yield enough evidence to suggest whether the use of Wang
tiles in combination with cellular automata and probabilistic distribution according to
height results in a higher mean score than the use of only cellular automata and
probabilistic distribution. However, this outcome could have been influenced by the fact
that the survey respondents did not have information about the parameters used to
generate the final image - such as probabilistic distributions, the population
configurations and rules of the cellular automata.

v
ACKNOWLEDGEMENTS
I would like to take this opportunity to express my sincere gratitude to those who
helped, guided or supported me in this challenging research.
I am very grateful to Dr. John Keyser, the chairman of my thesis advisory
committee, for his guidance and support all the way. He has been an important role
model. He showed me, by example, how enriching the fusion of work and fun can be.
I am also very thankful to Dr. Osuna for his suggestions and feedback. I
acknowledge the role of Dr. Charles Culp for guiding me as a member of my thesis
committee and also for being a great mentor.
I would also like to acknowledge:
Dr. Nancy Amato, Professor and Graduate Advisor and Dr. Bart Childs,
Professor and former Graduate Advisor, Department of Computer Science for their
helpful advice throughout my graduate studies,
Dr. Valerie Taylor, Chair of the Department of Computer Science, Texas A&M
University for being very supportive,
Dr. Donald House, for sharing his knowledge and wisdom,
Dr. Akleman, for inspiring me to explore new ideas,
Dr. Lively, for his encouragement, guidance and mentorship,
Dr. Furuta, for encouragement and support,
Mr. Don Gilman, for being always supportive of my academic and research
pursuits and for helping me grow as a professional,

vi
My fellow researchers at the Geometry and graphics group, Zeki, Jacob Foshee,
Joacob Beaudoin, Koji, David, Triv, Aswin, Ryan, Woo-suck, Brent, Michael, Kevin,
Erin and Eric for their valuable suggestions and feedback,
Mike Ong, for making his work on genetic algorithms for texture mapping
publicly available,
Ms. Vickie Colson, and other staff of the IRB at Texas A&M University for
guiding me through the processes of research compliance,
The Thesis Office at Texas A&M University for their careful review of my thesis
document,
All the anonymous respondents of the evaluation survey for their time and
feedback,
My parents, Dr. Harsha Sinvhal and Dr. Amita Sinvhal for their guidance,
encouragement and support,
Yash, for always having confidence in me, and
Shreyas, for always being there and for making it all worthwhile.
vii
TABLE OF CONTENTS
Page
ABSTRACT ........................................................................................................... iii
ACKNOWLEDGEMENTS......................................................................................v
TABLE OF CONTENTS .......................................................................................vii
LIST OF FIGURES .................................................................................................ix
LIST OF TABLES...................................................................................................xi
I INTRODUCTION............................................................................................1
II BACKGROUND..............................................................................................4
II.a Cellular Automata ..........................................................................4 II.b Hybrid Approaches Using Cellular Automata .............................11 II.c Terrain Generation .......................................................................12 II.d Generating Textures for Large Surfaces ......................................12 II.e Texture Mapping Terrain .............................................................16 II.f Physically-Based Simulation........................................................17 II.g User Studies..................................................................................18
III THEORY........................................................................................................19
III.a Characteristics of Terrains Desirable for Texture Generation .....19 III.b Research Hypotheses....................................................................20 III.c Program Structure ........................................................................23 III.d Choosing Rules for Cellular Automata ........................................24 III.e Cellular Automata with Height Information ................................28 III.f Algorithms....................................................................................29 III.g A Conceptual View ......................................................................34 III.h Texture Tiles ................................................................................34 III.i Wang Tiles and Cellular Automata ..............................................36
IV IMPLEMENTATION ....................................................................................37
IV.a Implementation Details ................................................................37 IV.b The User Interface........................................................................39
V RESULTS.......................................................................................................41
Page
viii
V.a Results ..........................................................................................41
VI EVALUATION AND ANALYSIS ...............................................................50
VI.a User Survey ..................................................................................50 VI.b Participant Group .........................................................................50 VI.c The Questionnaire ........................................................................50 VI.d Analysis of Survey Results ..........................................................52
VII PROBLEMS AND LIMITATIONS ..............................................................59
VIII CONCLUSIONS............................................................................................61
VIII.a Conclusions ..................................................................................61 VIII.b Future Work .................................................................................62
REFERENCES .......................................................................................................63
APPENDIX A.........................................................................................................75
VITA.......................................................................................................................76
ix
LIST OF FIGURES
Page
Figure 1 Conus textile shell: Rule 30 cellular automaton .............................................6
Figure 2 Rule 30 Cellular automaton ............................................................................6
Figure 3 Cellular automata: Moore neighborhood ........................................................7
Figure 4 Cellular automata: von Neumann neighborhood ............................................8
Figure 5 Striped pattern using reaction-diffusion method...........................................10
Figure 6 Pseudo zebra - texture synthesis using reaction diffusion ............................11
Figure 7 Neyret-Cani's method applied to map textures on an arbitrary mesh ...........13
Figure 8 Neyret-Cani's method applied to map textures on a set of tori .....................13
Figure 9 A minimal set of 8 Wang tiles that can aperiodically tile an infinite plane ..............................................................................................................14
Figure 10 Comparing stochastic and random assembly of tiles ....................................15
Figure 11 Generating a 3D mesh from a height map ....................................................24
Figure 12 Cellular automata: The Coagulations rule ....................................................26
Figure 13 Cellular automata: The Amoeba rule ............................................................27
Figure 14 A snowy landscape........................................................................................28
Figure 15 San Francisco. Picture taken September 2005 ..............................................29
Figure 16 Conceptual diagram of the Texullar system: Stage 1....................................35
Figure 17 Conceptual diagram of the Texullar system: Stage 2....................................35
Figure 18 Texullar: (Menu) Picking a Rule...................................................................39
Figure 19 Texullar: (Menu) Choosing a type of method for texture generation ...........39
Figure 20 Texture tiles used for bluebonnets (Cellular automata state = 0) .................42
Figure 21 Texture tiles used for yellow flowers (Cellular automata state = 1) .............43

x
Figure 22 Evolution of cellular automata ......................................................................44
Figure 23 Texture generation using a random selection of texture tiles .......................45
Figure 24 Terrain texture generated using cellular automata and probabilistic distribution according to height. ...................................................................45
Figure 25 Texture generation using a probabilistic distribution according to height.............................................................................................................46
Figure 26 A set of 8 Wang tiles, corresponding to state = 1 .........................................47
Figure 27 A set of 8 Wang tiles, corresponding to state = 0 .........................................48
Figure 28 Texture mapping using cellular automata, Wang tiles and probabilistic height distribution. ........................................................................................49
Figure 29 Texture mapping using cellular automata, Wang tiles and probabilistic distribution of texture tiles according to height. ...........................................49
Figure 30 Comparing Random against CA + Random .................................................53
Figure 31 Comparing CA + Random against CA + height ...........................................54
Figure 32 Comparing CA + height against Height........................................................55
Figure 33 Comparing CA + height against CA + height + Wang tiles .........................56
Figure 34 Comparing Wang tiles against CA + height + Wang tiles............................57
Page

xi
LIST OF TABLES
Page
Table 1 Cellular automata rule: Conway’s Game of Life ................................................25
Table 2 Cellular automata rule: Coagulations..................................................................26
Table 3 Cellular automata rule: Amoeba .........................................................................27
Table 4 Parameters for images used in survey.................................................................52
This thesis follows the style and format of IEEE Transactions on Visualization and Computer Graphics.
I INTRODUCTION
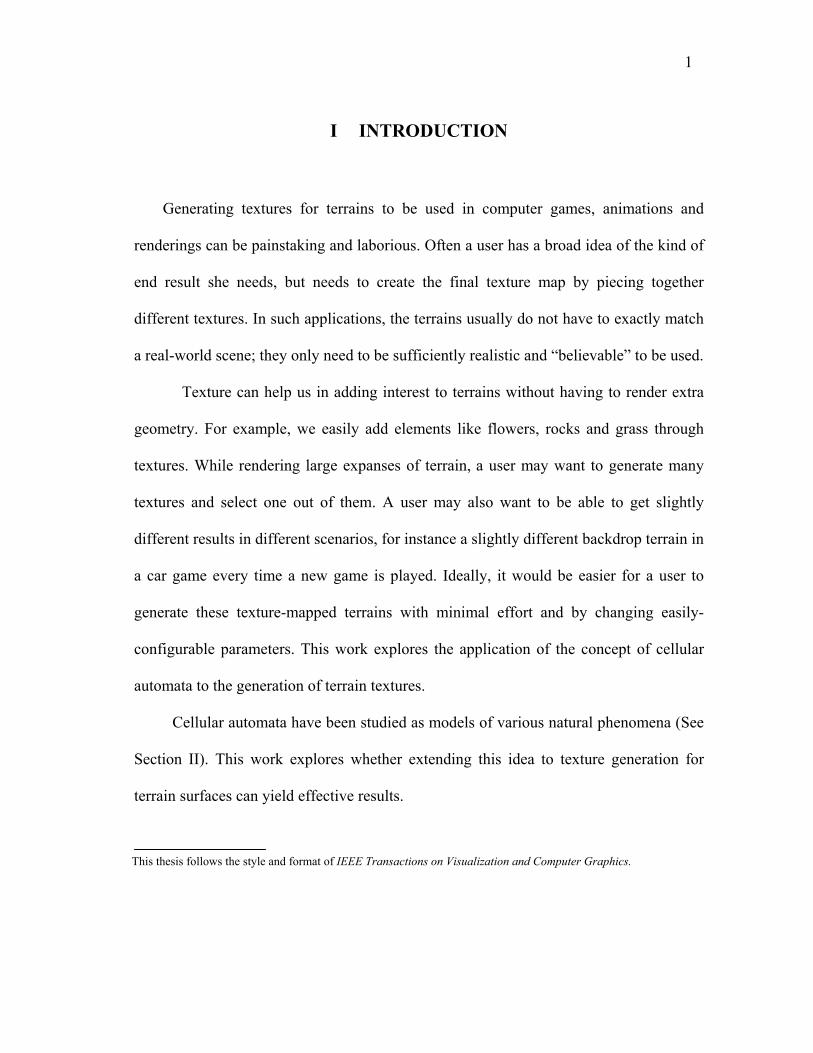
Generating textures for terrains to be used in computer games, animations and
renderings can be painstaking and laborious. Often a user has a broad idea of the kind of
end result she needs, but needs to create the final texture map by piecing together
different textures. In such applications, the terrains usually do not have to exactly match
a real-world scene; they only need to be sufficiently realistic and “believable” to be used.
Texture can help us in adding interest to terrains without having to render extra
geometry. For example, we easily add elements like flowers, rocks and grass through
textures. While rendering large expanses of terrain, a user may want to generate many
textures and select one out of them. A user may also want to be able to get slightly
different results in different scenarios, for instance a slightly different backdrop terrain in
a car game every time a new game is played. Ideally, it would be easier for a user to
generate these texture-mapped terrains with minimal effort and by changing easily-
configurable parameters. This work explores the application of the concept of cellular
automata to the generation of terrain textures.
Cellular automata have been studied as models of various natural phenomena (See
Section II). This work explores whether extending this idea to texture generation for
terrain surfaces can yield effective results.
1
2
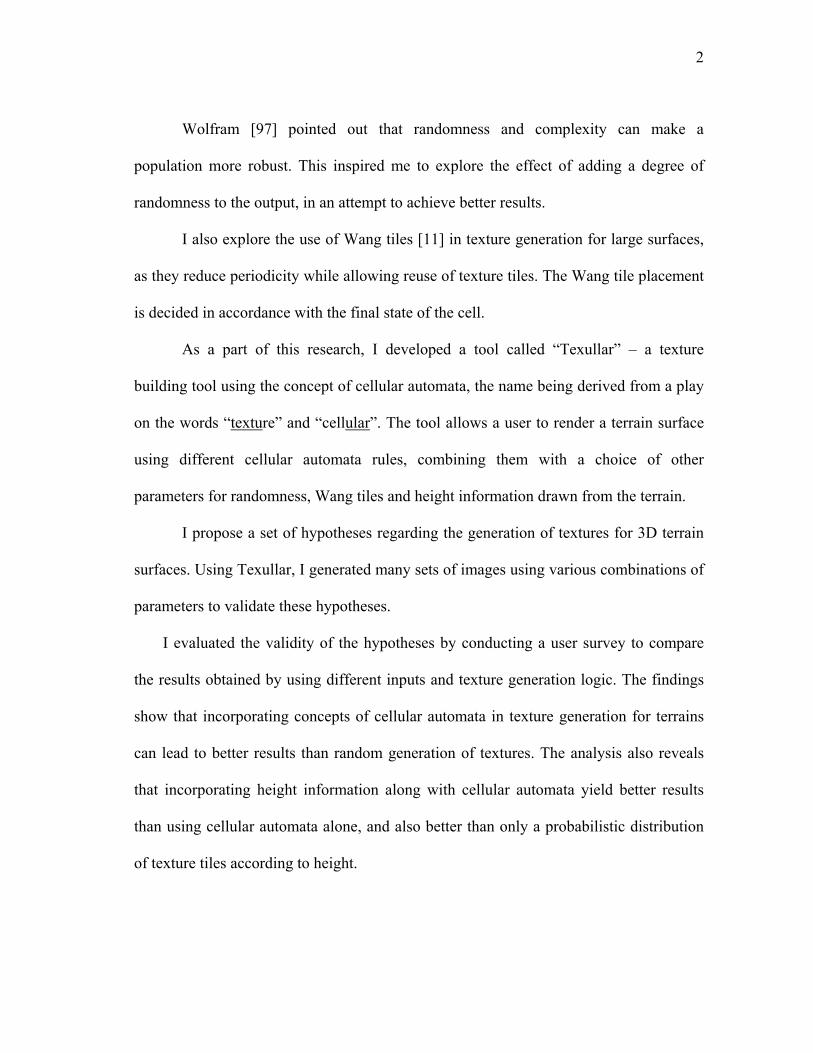
Wolfram [97] pointed out that randomness and complexity can make a
population more robust. This inspired me to explore the effect of adding a degree of
randomness to the output, in an attempt to achieve better results.
I also explore the use of Wang tiles [11] in texture generation for large surfaces,
as they reduce periodicity while allowing reuse of texture tiles. The Wang tile placement
is decided in accordance with the final state of the cell.
As a part of this research, I developed a tool called “Texullar” – a texture
building tool using the concept of cellular automata, the name being derived from a play
on the words “texture” and “cellular”. The tool allows a user to render a terrain surface
using different cellular automata rules, combining them with a choice of other
parameters for randomness, Wang tiles and height information drawn from the terrain.
I propose a set of hypotheses regarding the generation of textures for 3D terrain
surfaces. Using Texullar, I generated many sets of images using various combinations of
parameters to validate these hypotheses.
I evaluated the validity of the hypotheses by conducting a user survey to compare
the results obtained by using different inputs and texture generation logic. The findings
show that incorporating concepts of cellular automata in texture generation for terrains
can lead to better results than random generation of textures. The analysis also reveals
that incorporating height information along with cellular automata yield better results
than using cellular automata alone, and also better than only a probabilistic distribution
of texture tiles according to height.

3
Results from the user survey, however, did not yield enough evidence to indicate
whether a hybrid approach incorporating height information along with cellular
automata and Wang tiles is better than incorporating height information along with
cellular automata in the context of texture generation for 3D meshes.

4
II BACKGROUND
II.a Cellular Automata
II.a.1 Introduction
Mathworld [58] defines a cellular automaton as “a collection of ‘colored’ cells on
a grid of specified shape that evolves through a number of discrete time steps according
to a set of rules based on the states of neighboring cells”.
In general, this relationship can be expressed [101] as:
Si(t+1) = f(Si(t) + Sneigh(i)(t))
Where Si denotes the state of the ith cell
t denotes the number of generations that have evolved
Sneigh(i) denotes the set of neighbors (according to the chosen neighborhood)
of the ith cell
2D cellular automata are cells arranged on a 2D grid, and are affected by neighbors
in both the X and Y dimensions. I have used the rules of 2D cellular automata in this
work. Throughout this text, “cellular automata” refers to 2D cellular automata unless
explicitly mentioned otherwise.
Wolfram pointed out [96] that:
• Very simple rules often generate great complexity
• Simple ideas tend to be reused much more often than complicated ones
• The simpler the system, the more likely a version of it will recur in a wide
variety of more complicated contexts

5
These ideas about simplicity and its use have inspired me to explore the use of
simple cellular automata in texture synthesis. The idea of self-reproducing automata, as
explained by von Neumann [84] and [85], illustrates how simple rules can lead to great
complexity.
Different rules of cellular automata have different characteristics. The entropy of
some unpredictable patterns generated by cellular automata has been studied by
Crutchfield et al. [16] and Melanie et al. [60], [61]. A ‘chaotic’ system has been
described [99] as one in which “activity doesn't die down into a regular pattern, but yet it
also doesn't explode all over the place. We seem to be able to pick out individual 'things'
in the space. These things grow and shrink and interact in 'interesting' ways. These
worlds are the ones that get everyone all excited about CAs [cellular automata].” The
author also describes an 'exploding' universe as one in which “… no matter what we start
with (other than a few pathological cases), the patterns grow and expand until they fill
up the whole space”.
Using cellular automata, we can define an initial configuration of cells and evolve
them according to pre-defined rules with known characteristics.
The application of evolutionary strategies like genetic algorithms [34] and cellular
automata to solve complex problems has generated a lot of interest [36], [41], [69].
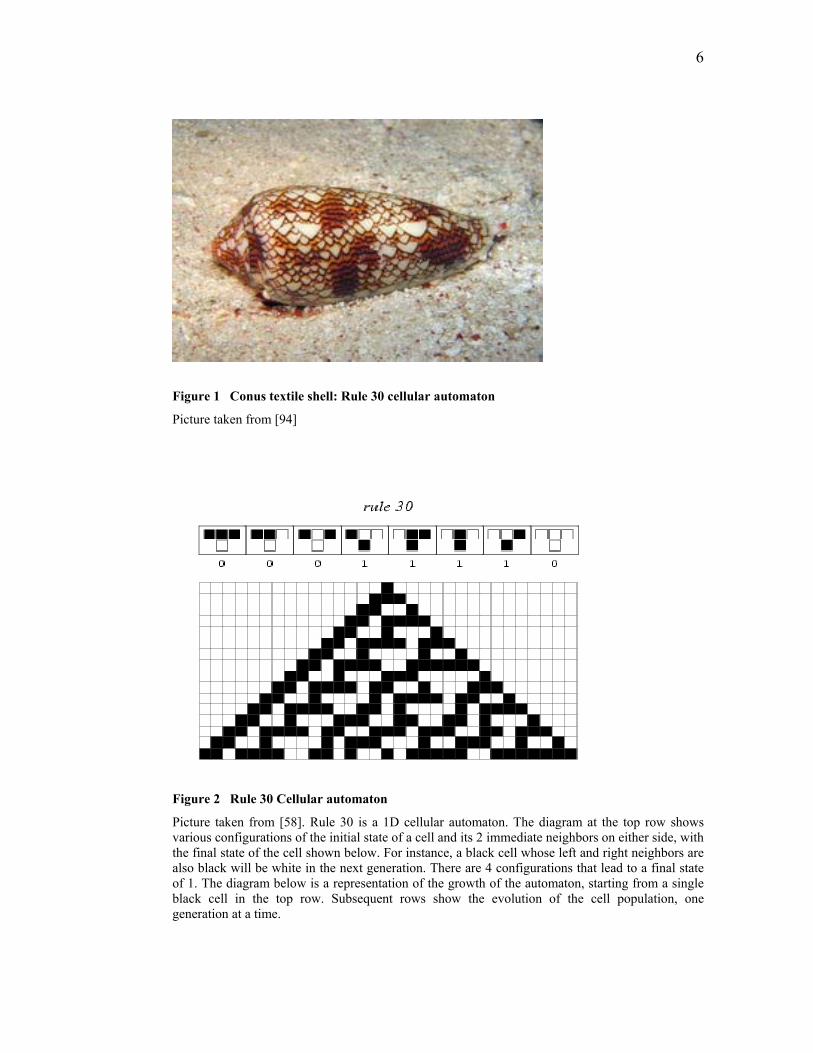
Figure 1 shows an example of a cellular automata rule found in real life. The
Conus textile shell follows Rule 30, which is illustrated and explained in Figure 2.
6
Figure 1 Conus textile shell: Rule 30 cellular automaton
Picture taken from [94]
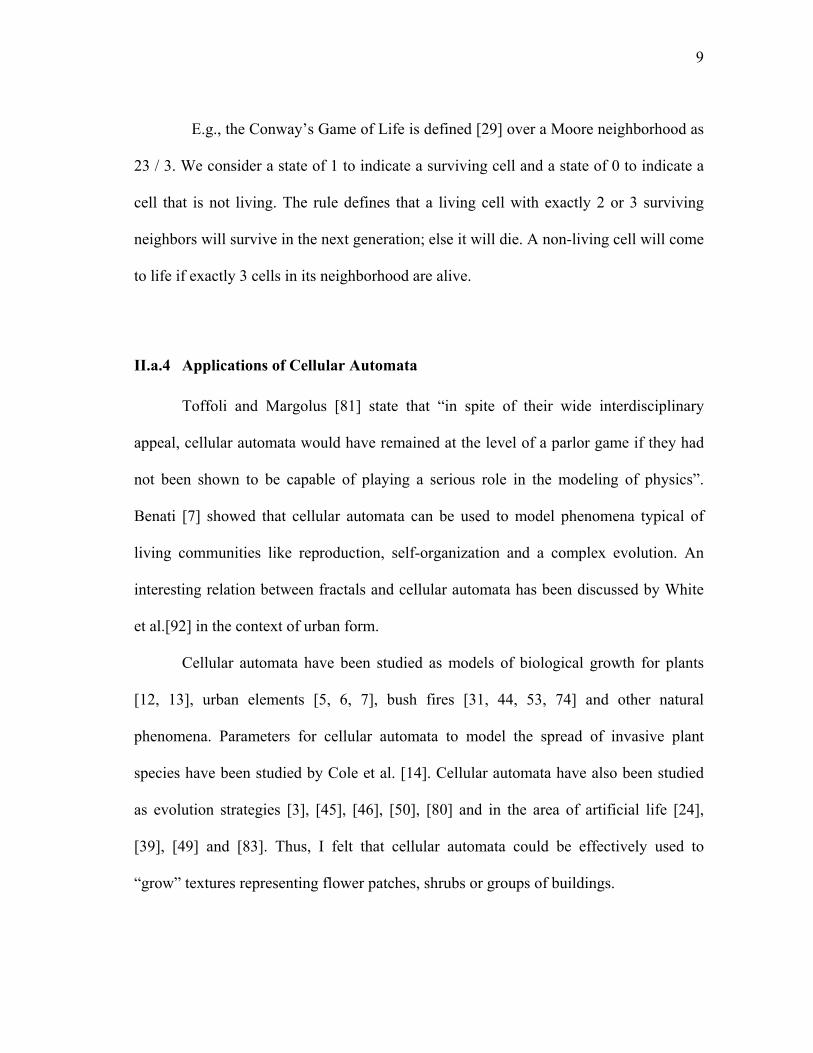
Figure 2 Rule 30 Cellular automaton
Picture taken from [58]. Rule 30 is a 1D cellular automaton. The diagram at the top row shows various configurations of the initial state of a cell and its 2 immediate neighbors on either side, with the final state of the cell shown below. For instance, a black cell whose left and right neighbors are also black will be white in the next generation. There are 4 configurations that lead to a final state of 1. The diagram below is a representation of the growth of the automaton, starting from a single black cell in the top row. Subsequent rows show the evolution of the cell population, one generation at a time.

7
II.a.2 Neighborhoods
Figure 3 Cellular automata: Moore neighborhood
Picture taken from [91].
A Moore neighborhood (Figure 3) is a square-shaped set of neighboring cells that
can affect the state of a cell in consideration. This set is defined [91] as:
N M (x0, y0) = {(x,y): | x-x0| ≤ r, |y – y0| ≤ r}
where N M denotes the set of cells in the Moore neighborhood
x0 denotes the x – coordinate of the current cell
y0 denotes the y – coordinate of the current cell
x denotes the x – coordinate of another cell
y denotes the y – coordinate of another cell
r denotes the range

8
Figure 4 Cellular automata: von Neumann neighborhood
Picture taken from [91].
Other kinds of neighborhoods like the von Neumann neighborhood, as illustrated
in Figure 4, have also been defined [96].
II.a.3 Lexicon for Cellular Automata
The “Life” family of rules [96] for 2D cellular automata uses 1 bit for state and is
defined in the "S/B" form, where:
S is the number of neighbors that should be alive for a cell to survive
B is the number of neighbors that should be alive for a cell to be born
9
E.g., the Conway’s Game of Life is defined [29] over a Moore neighborhood as
23 / 3. We consider a state of 1 to indicate a surviving cell and a state of 0 to indicate a
cell that is not living. The rule defines that a living cell with exactly 2 or 3 surviving
neighbors will survive in the next generation; else it will die. A non-living cell will come
to life if exactly 3 cells in its neighborhood are alive.
II.a.4 Applications of Cellular Automata
Toffoli and Margolus [81] state that “in spite of their wide interdisciplinary
appeal, cellular automata would have remained at the level of a parlor game if they had
not been shown to be capable of playing a serious role in the modeling of physics”.
Benati [7] showed that cellular automata can be used to model phenomena typical of
living communities like reproduction, self-organization and a complex evolution. An
interesting relation between fractals and cellular automata has been discussed by White
et al.[92] in the context of urban form.
Cellular automata have been studied as models of biological growth for plants
[12, 13], urban elements [5, 6, 7], bush fires [31, 44, 53, 74] and other natural
phenomena. Parameters for cellular automata to model the spread of invasive plant
species have been studied by Cole et al. [14]. Cellular automata have also been studied
as evolution strategies [3], [45], [46], [50], [80] and in the area of artificial life [24],
[39], [49] and [83]. Thus, I felt that cellular automata could be effectively used to
“grow” textures representing flower patches, shrubs or groups of buildings.

10
Other areas of research in which studies have been done regarding the concept of
cellular automata include physics [26], economics [15] and sociology [25].
II.a.5 Texture Synthesis Using Reaction-Diffusion
The process of reaction-diffusion, which is a biologically motivated method of texture
synthesis, models the diffusion of two or more chemicals at unequal rates over a surface
and their mutual reactions to form stable patterns such as spots and stripes. The
Rufenacht website [68] shows examples of applying cellular automata rules to generate
textures that look like animal skins. Reaction-diffusion methods for texture generation
also use the concept of cellular automata [75, 77 and 82]. Figures 5 and 6 illustrate some
examples of texture synthesis using reaction-diffusion.
Figure 5 Striped pattern using reaction-diffusion method
Picture taken from [75]

11
Figure 6 Pseudo zebra - texture synthesis using reaction diffusion
Picture taken from [82]
II.b Hybrid Approaches Using Cellular Automata
Sullivan et al. [74] use a hybrid model to compute the spread of bush fire using 2D
cellular automata with a semi-physical model of convection. Colasanti et al. [13]
propose a hybrid model of plant growth using cellular automata with the C-S-R-model.
Both of these studies found that a cellular automata process alone was not sufficient to
simulate the natural evolution of the phenomenon under consideration. Probabilistic
cellular automata have been studied by Takai et al. [76].
This suggests that augmenting the concepts of cellular with the application of
domain-specific information can lead to better results. Hence, the texture generation

12
algorithms used in this work incorporate terrain information (in this case, height) in the
generation of texture.
Gobron et al. [33] use a 3D surface cellular automata approach to represent a
model. This gives the advantage of direct texture simulation on the model.
II.c Terrain Generation
Fractals [57] have been used to generate terrains by many terrain generation
engines like fracPlanet [1] and FracHill [9]. Fractals lead to smooth height
transactions, and are also sometimes used to color the terrain as an alternative to
texturing.
A cellular automata approach to generating terrains is described by Wijaya et al.
[93]. Various volumetric approaches to terrain generation have also been explored
[95].
II.d Generating Textures for Large Surfaces
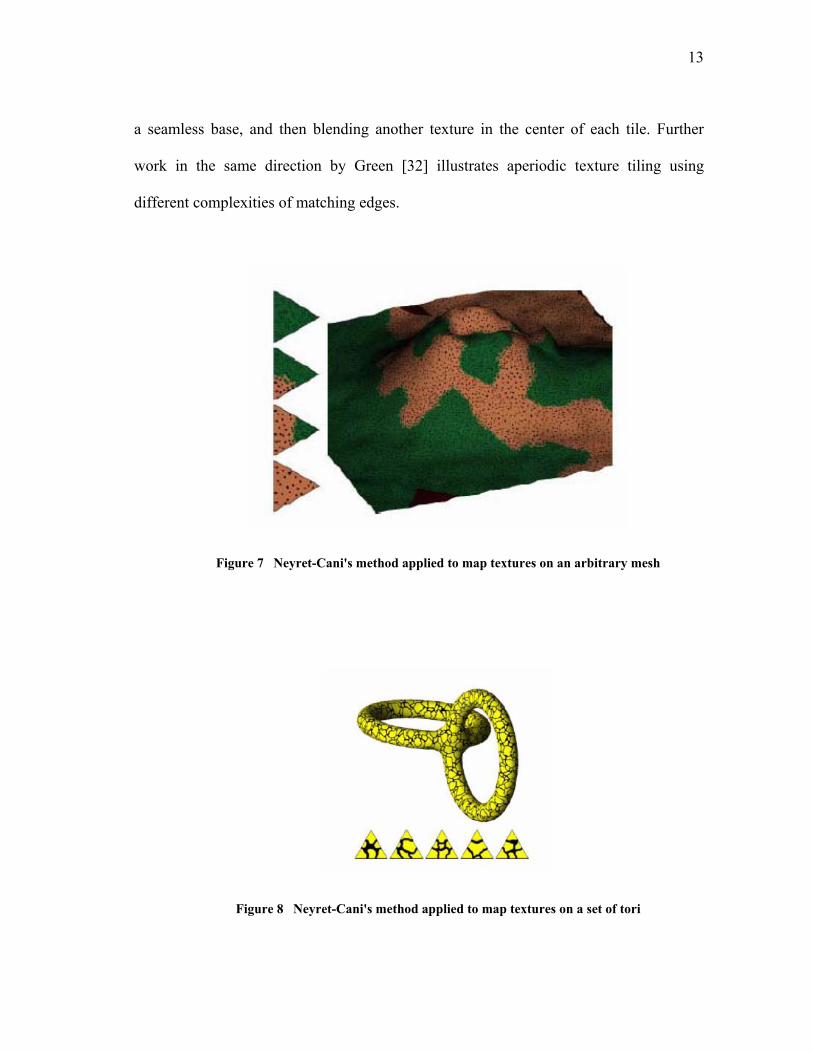
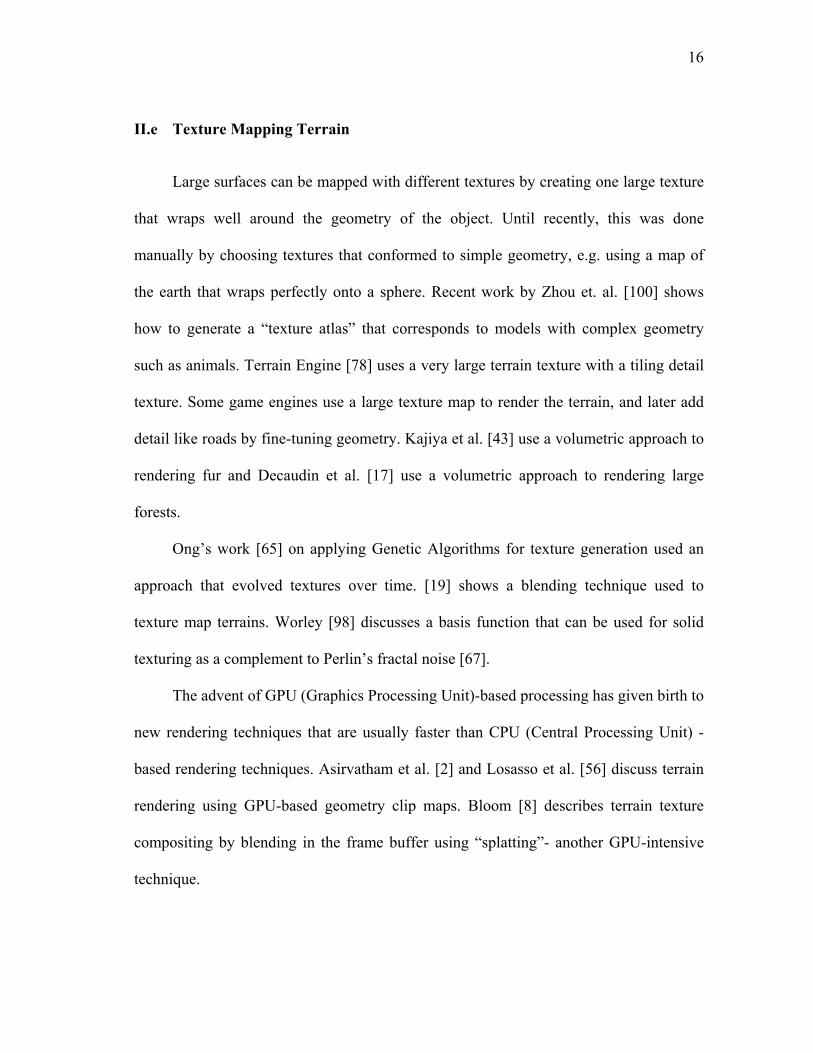
The Neyret-Cani approach [64] for aperiodic texture mapping of a 3D object uses
triangular textures as inputs and maps them onto a triangular mesh. The edges of the
triangular textures match up seamlessly with each other and tile up as a texture for a
large area. Figures 7 and 8, taken from [64], illustrate this method of texture mapping.
The Akleman-Kaur method [47] uses square texture tiles, applying background tiles for
13
a seamless base, and then blending another texture in the center of each tile. Further
work in the same direction by Green [32] illustrates aperiodic texture tiling using
different complexities of matching edges.
Figure 7 Neyret-Cani's method applied to map textures on an arbitrary mesh
Figure 8 Neyret-Cani's method applied to map textures on a set of tori

14
Recent work [51], [52], [59] on texture blending has made it easier to generate
textures that seamlessly blend into one another. This work could be extended to generate
texture tiles that “blend” well. This work simplifies the problem of matching up seams of
adjacent tiles by choosing input texture tiles that have been pre-generated and are
seamless. A technique called "TextureMontage", proposed by Zhou et al. [100] can be
used to seamlessly map a patchwork of texture images onto a 3D model.
Litwinowicz et al. [55] describe algorithms for the placement and distortion of
textures, using affine transformations of a texture and localized warps to align features in
the texture with features of the model. Sander et al. [71] propose a method for texture
mapping that minimizes texture stretch and texture deviation.
Texture mapping through Wang tiles [86], [87] uses “color-coded” texture tiles to
indicate textures that can be placed adjacent to each other seamlessly, and is an effective
way to tile a surface aperiodically. Cohen et al. [11] show how Wang tiles can be used to
generate a texture for a 3D surface which is not periodic. A minimal set of Wang tiles
required to aperiodically tile an infinite plane is illustrated in Figure 9 below.
Figure 9 A minimal set of 8 Wang tiles that can aperiodically tile an infinite plane

15
Efros et al. [23] explain a method for texture synthesis and transfer that works by
rendering an object with a texture taken from a different object, illustrating its use on 2D
surfaces. Various texture mapping methods have been discussed by Heckbert [38].
Figure 10 shows a comparison of a plane tiled according to the stochastic and
aperiodic considerations. The figure shows that using a purely stochastic tiling gives a
greater impression of aperiodicity as compared to a strictly aperiodic set assembled
using a minimum set of tiles that follow the Wang tile constraints.
Figure 10 Comparing stochastic and random assembly of tiles
(a) 32×32 tiles stochastically assembled (b) 32 × 32 strictly aperiodic set (taken from [37]) (c) 256 × 256 stochastic (d) 256 × 256 aperiodic. Picture taken from [11]
16
II.e Texture Mapping Terrain
Large surfaces can be mapped with different textures by creating one large texture
that wraps well around the geometry of the object. Until recently, this was done
manually by choosing textures that conformed to simple geometry, e.g. using a map of
the earth that wraps perfectly onto a sphere. Recent work by Zhou et. al. [100] shows
how to generate a “texture atlas” that corresponds to models with complex geometry
such as animals. Terrain Engine [78] uses a very large terrain texture with a tiling detail
texture. Some game engines use a large texture map to render the terrain, and later add
detail like roads by fine-tuning geometry. Kajiya et al. [43] use a volumetric approach to
rendering fur and Decaudin et al. [17] use a volumetric approach to rendering large
forests.
Ong’s work [65] on applying Genetic Algorithms for texture generation used an
approach that evolved textures over time. [19] shows a blending technique used to
texture map terrains. Worley [98] discusses a basis function that can be used for solid
texturing as a complement to Perlin’s fractal noise [67].
The advent of GPU (Graphics Processing Unit)-based processing has given birth to
new rendering techniques that are usually faster than CPU (Central Processing Unit) -
based rendering techniques. Asirvatham et al. [2] and Losasso et al. [56] discuss terrain
rendering using GPU-based geometry clip maps. Bloom [8] describes terrain texture
compositing by blending in the frame buffer using “splatting”- another GPU-intensive
technique.

17
Lindstrom et al. [54] describe how a view-dependent refinement can be combined
with view frustum culling and triangle stripping for effective visualization of terrains.
Pajarola [66] uses a restricted quadtree triangulation for high performance terrain
visualization. Other high performance techniques to render large meshes have been
described using multi-resolution point rendering [70] and view-dependent level-of-detail
[40].
II.f Physically-Based Simulation
Various physically based approaches to weathering of surfaces have been
explored, which also produce the effect of using more than one texture. Lichen growth
[18] using an Open Diffusion Limited Aggregation model on 3D surfaces adds geometry
to the existing surface. Another approach [20] uses thickness maps and rendering layers
to simulate weathering of metallic surfaces, particularly in relation to copper. Simulating
water flow as a particle system and incorporating information about chemical reactions
(like exposure to sunlight) [22] can be used to alter the appearance of the original
textures. In a related study [21], the authors use a volumetric data structure to simulate
weathering of stone incorporating effects like flow of moisture and mineral dissolution.
Jensen et al. [62] illustrate the rendering of wet materials by taking into account the
water on the surface and a concentration of water beneath the surface.
All these simulations achieve the result of adding interest to the surface texture.
Being physically-based simulations, these methods require some prior knowledge of
18
parameters like the geometry, surface conditions, the environment and the interplay of
these factors.
II.g User Studies
User studies related to effective visualization of computer-generated artifacts are
being done by many researchers [72], but are not yet a standard practice [48]. User
surveys in the area of visualization [88], [89], [90] have explored some of the issues
regarding how we perceive surfaces under environments with different parameters like
orientation and texture.
19
III THEORY
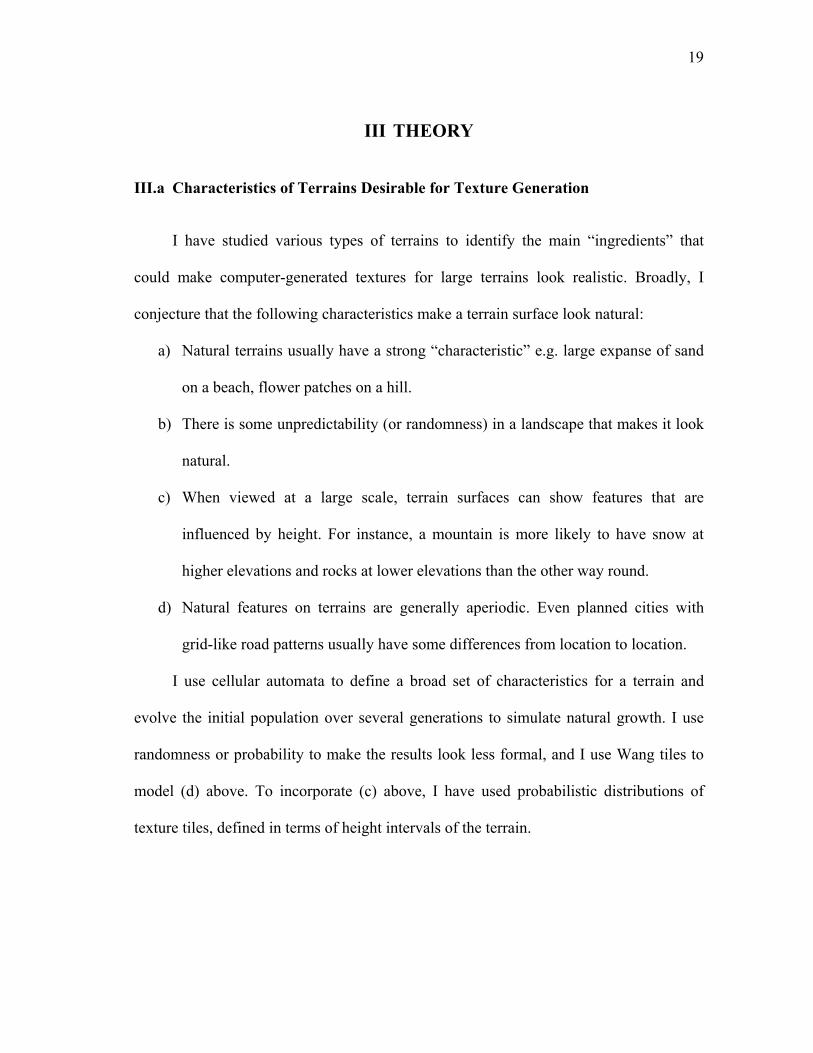
III.a Characteristics of Terrains Desirable for Texture Generation
I have studied various types of terrains to identify the main “ingredients” that
could make computer-generated textures for large terrains look realistic. Broadly, I
conjecture that the following characteristics make a terrain surface look natural:
a) Natural terrains usually have a strong “characteristic” e.g. large expanse of sand
on a beach, flower patches on a hill.
b) There is some unpredictability (or randomness) in a landscape that makes it look
natural.
c) When viewed at a large scale, terrain surfaces can show features that are
influenced by height. For instance, a mountain is more likely to have snow at
higher elevations and rocks at lower elevations than the other way round.
d) Natural features on terrains are generally aperiodic. Even planned cities with
grid-like road patterns usually have some differences from location to location.
I use cellular automata to define a broad set of characteristics for a terrain and
evolve the initial population over several generations to simulate natural growth. I use
randomness or probability to make the results look less formal, and I use Wang tiles to
model (d) above. To incorporate (c) above, I have used probabilistic distributions of
texture tiles, defined in terms of height intervals of the terrain.
20
Based on these ideas, I have formulated a set of hypotheses. These are detailed in
the following section.
III.b Research Hypotheses
I formulated four sets of hypotheses regarding placement of texture tiles on a 3D
terrain mesh. To compare images generated using different approaches, I proposed to
compare the mean of the scores assigned to them on a 10-point scale.
Throughout this document,
CA denotes cellular automata
H0 denotes the null hypothesis
Ha denotes the research hypothesis (also called the alternative hypothesis)
µR denotes the mean score for images generated using random placement
of texture tiles
µCA+R denotes the mean score for images generated using cellular automata
approach
µHt denotes the mean score for images generated with a probabilistic
distribution of texture tiles according to height of the terrain
µCA+Ht denotes the mean score for images generated using cellular
automata approach combined with a probabilistic distribution of texture tiles
according to height of the terrain

21
µCA+Ht+W denotes the mean score for images generated using a cellular
automata approach combined with a probabilistic distribution of texture tiles
according to height of the terrain and using the Wang method for placing texture
tiles
The research hypotheses are:
H1a: For the assignment of texture tiles on a 3D terrain mesh, a hybrid approach
combining cellular automata and random placement leads to a higher mean score than a
random placement alone.
H2a: For the assignment of texture tiles on a 3D terrain mesh, a hybrid approach
combining cellular automata and probabilistic distribution of texture tiles according to
height of the terrain leads to a higher mean score than a hybrid approach combining
cellular automata and random placement.
H3a: For the assignment of texture tiles on a 3D terrain mesh, a hybrid approach
combining cellular automata and probabilistic distribution of texture tiles according to
height of the terrain leads to a higher mean score than an approach using a probabilistic
distribution of texture tiles according to height of the terrain alone.
H4a: For the assignment of texture tiles on a 3D terrain mesh, a hybrid approach
combining cellular automata, probabilistic distribution of texture tiles according to
height of the terrain and Wang tiles leads to a higher mean score than a hybrid approach
combining only cellular automata and probabilistic distribution of texture tiles.
The formulation of the null and research hypotheses are:
H10: µCA+R ≤ µR

22
H1a: µCA+R > µR
H20: µCA+Ht ≤ µCA+R
H2a: µCA+Ht > µCA+R
H30: µCA+Ht ≤ µHt
H3a: µCA+Ht > µHt
H40: µCA+Ht+W ≤ µCA+Ht
H4a: µCA+Ht+W > µCA+Ht
As the nature of the response is highly subjective, an α value of 0.20 was chosen.
These hypotheses are broadly based on the major characteristics of terrains that I
have observed (Section III.A). The characteristic of the terrain can be defined using
cellular automata, and evolved using pre-defined rules – thus a “method” is followed to
generate a final result derived from initial conditions (Hypotheses I and III). Terrain –
specific information can be added by incorporating a probabilistic distribution of the
texture tiles based on the terrain height (Hypotheses II). I have used Wang tiles to
eliminate periodicity in the process of texture generation (Hypothesis IV).
23
III.c Program Structure
This work explores the mapping of more than one texture on to 3D surfaces to
achieve realistic and aesthetically pleasing results. The inputs to the program are:
1. A gray scale image defining the geometry (a height map)
2. A set of rules for the evolution of cellular automata
3. Images to be used as “texture tiles” (e.g. snow, grass, flower patches)
4. User-defined parameters. These include:
• Initial cell population
• Number of generations (evolution cycles)
5. Optional parameters, depending on choice of algorithm used to generate
textures. These include:
• A probabilistic distribution of texture tiles according to height of the
terrain
• Wang tile information
The program uses a two-dimensional cellular automata approach to generate a
texture placement map. The images used as texture tiles match up seamlessly with each
other and are always used in the same orientation (North always remains North).
Seamless texture tiles are used so that the joints between texture tiles are not visible
along the edges. In case Wang tiles are used, the edges of the tiles follow the rules of
Wang tiles.
Terrain geometry can be easily defined in terms of height maps, which are 2D
gray scale images. In a height map, a lighter color usually indicates a higher elevation. A
24
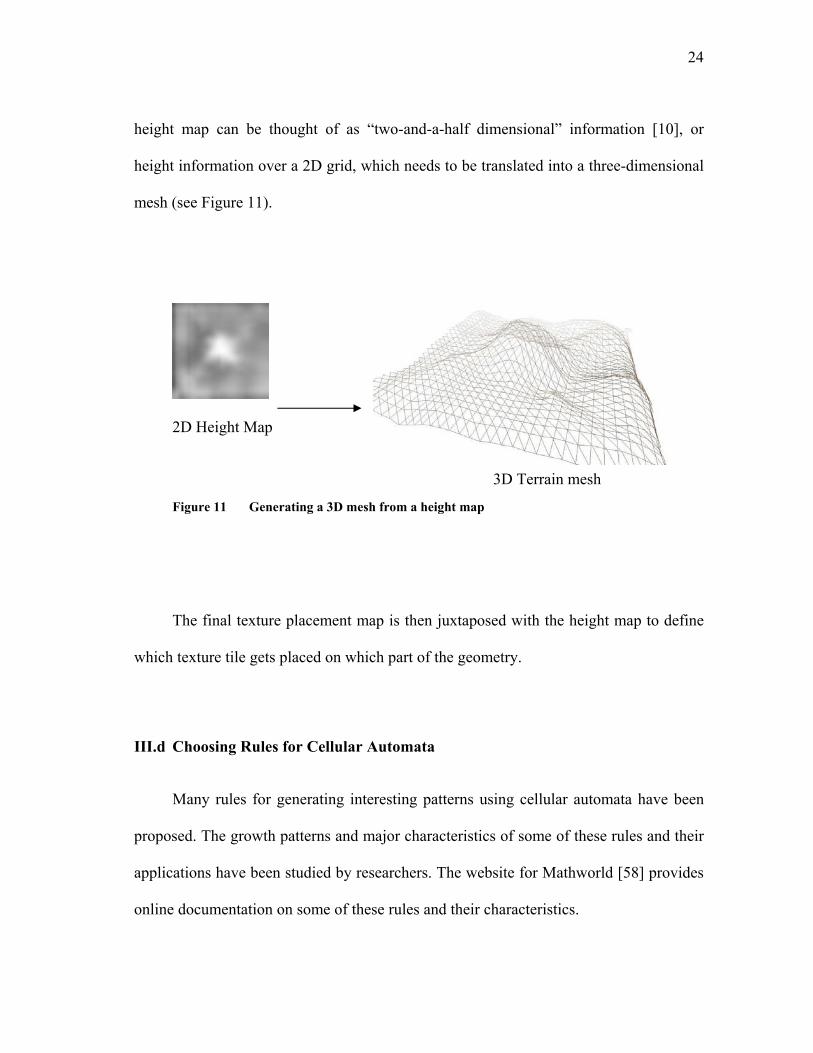
height map can be thought of as “two-and-a-half dimensional” information [10], or
height information over a 2D grid, which needs to be translated into a three-dimensional
mesh (see Figure 11).
2D Height Map
Figure 11 Generating a 3D mesh from a height map
The final texture placement map is then juxtaposed with the height map to define
which texture tile gets placed on which part of the geometry.
III.d Choosing Rules for Cellular Automata
Many rules for generating interesting patterns using cellular automata have been
proposed. The growth patterns and major characteristics of some of these rules and their
applications have been studied by researchers. The website for Mathworld [58] provides
online documentation on some of these rules and their characteristics.
3D Terrain mesh

25
For this research, I chose cellular automata rules with characteristics that are more
likely to be found in nature. So, I favored rules that evolved an initial population to a
chaotic or exploding population as opposed to those that led to stable growth.
For simplicity, I used rules with 2 states in this work. The rules that I chose have
been taken from [96] and are reproduced below in Tables 1, 2 and 3: [for lexicon rules,
see Section II.A.2]:
Table 1 Cellular automata rule: Conway’s Game of Life
Rule : 23/3 Character : Chaotic Neighborhood : Moore neighborhood Author : John Conway Description : This rule was proposed by John Conway [29], [30]. Even
though the rule looks simple, it generates interesting results. Informally, it has been defined in terms of a cell surviving if it is surrounded by 2 or 3 surviving neighbors; and a cell becomes alive if it has exactly 3 neighbors that are alive. I chose this rule because it is one of the most popular rules of cellular automata. It was even mentioned in the popular Time magazine [79].
26
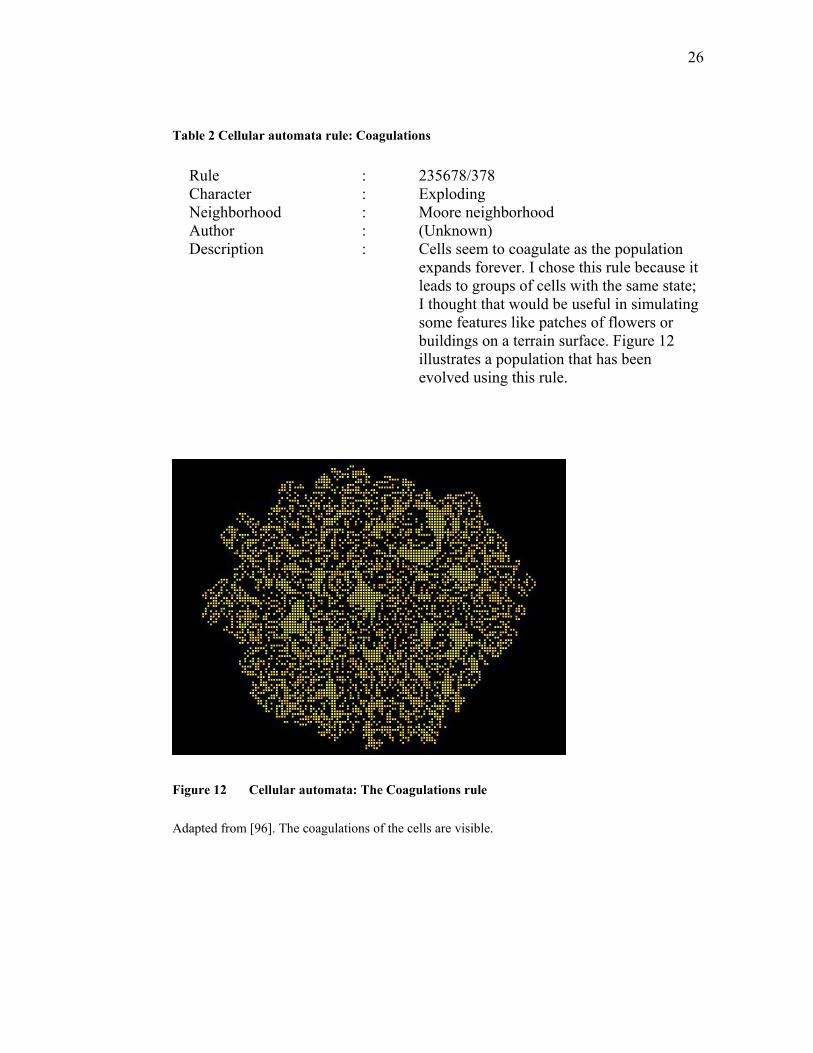
Table 2 Cellular automata rule: Coagulations
Rule : 235678/378 Character : Exploding Neighborhood : Moore neighborhood Author : (Unknown) Description : Cells seem to coagulate as the population
expands forever. I chose this rule because it leads to groups of cells with the same state; I thought that would be useful in simulating some features like patches of flowers or buildings on a terrain surface. Figure 12 illustrates a population that has been evolved using this rule.
Figure 12 Cellular automata: The Coagulations rule
Adapted from [96]. The coagulations of the cells are visible.

27
Table 3 Cellular automata rule: Amoeba
Rule : 1358/357 Character : Chaotic Neighborhood : Moore neighborhood Author : (Unknown) Description : The population oscillates wildly. I chose this rule because
the growth pattern looked natural (see Figure 13).
Figure 13 Cellular automata: The Amoeba rule
Adapted from [96].

28
III.e Cellular Automata with Height Information
I noticed that, in some cases, elevation has an effect on the natural features (like
vegetation) on a terrain surface. I define a “family” of textures with similar
characteristics that map to each state of the cellular automata. Section III.F contains
details on the algorithms used to incorporate height information in the placement of
texture tiles on the terrain mesh. Figures 14 and 15 below shows examples of real
landscapes, where the terrain features (that can be represented by textures in a computer-
generated rendering) vary with height.
Figure 14 A snowy landscape
Picture taken from: [28]. The "texture" varies according to the height – there are more trees on the lower elevations. There is more snow on the higher elevations. The peaks have snow exclusively.

29
Figure 15 San Francisco. Picture taken September 2005
Trees and shrubs appear on lower elevations. The higher areas are devoid of vegetation.
III.f Algorithms
III.f.1 Algorithm for Texture Mapping with Cellular Automata and Random
Selection
Input: A height map to define the terrain
A set of rules for evolution of cellular automata
The number of generations of evolution
A set of texture tiles for each possible state of the cellular automata
Output: A texture-mapped 3D mesh
Algorithm:
1. Applying the chosen cellular automata rules to the initial population, evolve it
over the specified number of generations to compute the final population.
30
2. Construct a 3D terrain mesh by interpreting the height map.
3. Map the final cell population one-to-one with the quadrilaterals that define the
3D terrain mesh.
4. For each cell,
According to the final state of the cell, randomly choose one texture tile that
corresponds to the set of texture tiles for that state.
5. Apply the chosen texture tiles on the terrain mesh.
III.f.2 Algorithm for Texture Mapping with Cellular Automata and Probabilistic
Distribution According to Height
Input: A height map to define the terrain
A set of rules for evolution of cellular automata
The number of generations of evolution
A set of texture tiles for each possible state of the cellular automata
A probabilistic distribution of texture tiles for each state, according to the terrain
height
Output: A texture-mapped 3D mesh
Algorithm:
1. Applying the chosen cellular automata rules to the initial population, evolve it
over the specified number of generations to compute the final population.
2. Construct a 3D terrain mesh by interpreting the height map.
31
3. Map the final cell population one-to-one with the quadrilaterals that define the
3D terrain mesh.
4. For each cell,
a. Consider the set of texture tiles that map to the final state of the cell.
b. Find the height of the cell on the terrain and consider the subset of texture
tiles that map to the given rules of probabilistic distribution of texture
tiles according to the height of the terrain mesh.
c. Choose a texture tile from this subset.
5. Apply the chosen texture tiles on the terrain mesh.
III.f.3 Algorithm for Texture Mapping with Probabilistic Distribution According
to Height
Input: A height map to define the terrain
A probabilistic distribution of texture tiles for each state, according to the terrain
height
A set of texture tiles for each interval defined in the probabilistic distribution
Output: A texture-mapped 3D mesh
Algorithm:
1. Construct a 3D terrain mesh by interpreting the height map.
2. Choose a texture tile according to the given rules of probabilistic distribution of
texture tiles according to the height on the terrain mesh.
3. Apply the chosen texture tiles on the terrain mesh.

32
III.f.4 Algorithm for Texture Mapping with Cellular Automata, Using
Probabilistic Distribution According to Height and Wang Tiles
Input: A height map to define the terrain
A set of rules for evolution of cellular automata
The number of generations of evolution
A set of texture tiles for each possible state of the cellular automata and the
color codes of their edges (according to the Wang tile description)
A probabilistic distribution of texture tiles for each state, according to the
terrain height
Output: A texture-mapped 3D mesh
Algorithm:
1. Applying the chosen cellular automata rules to the initial population, evolve it
over the specified number of generations to compute the final population.
2. Construct a 3D terrain mesh by interpreting the height map.
3. Map the final cell population one-to-one with the quadrilaterals that define the
3D terrain mesh.
4. Start from the North West corner of the mesh. According to the probabilistic
height distribution, choose any texture tile from the set of tiles that corresponds
to the final state of the cell.
5. Continue to the next cell to the immediate East of the current cell, until the end of
the row. For each cell,
a. Consider the set of Wang tiles that map to the final state of the cell.

33
b. Find the sub set of texture tiles (for the same state) such that the West
edge matches the East edge of the tile placed to the West.
c. Apply the given rules of probabilistic distribution of texture tiles
according to the position of the cell on the terrain mesh. Choose a texture
tile that corresponds to the set of texture tiles for that state from within
the subset chosen in the step above. (Thus, the chosen tile satisfies both
the probabilistic height distribution and the Wang tile constraints.)
6. Go to the next row. Continue on from West to East. For each cell,
a. Consider the set of Wang tiles that map to the final state of the cell.
b. Find the sub set of texture tiles (for the same state) such that the North
edge matches the South Edge of the tile immediately to the North, and the
West edge matches the East edge of the tile placed to the West.
c. Apply the given rules of probabilistic distribution of texture tiles
according to the position of the cell on the terrain mesh. Choose a texture
tile that corresponds to the set of texture tiles for that state from within
the subset chosen in the step above. (Thus, the chosen tile satisfies both
the probabilistic height distribution and the Wang tile constraints.)
7. Repeat Step 6 until the texture tiles for all cells are chosen.
8. Apply the chosen texture tiles on the terrain mesh.
34
III.g A Conceptual View
Figure 16 below illustrates the steps followed in the initial stage of Texullar. The
initial population is evolved according to the set of rules chosen by the user. A 3D mesh
is generated by interpreting the height map. Figure 17 shows how the output from Stage
1 is used as input to Stage 2 of Texullar and combined with other parameters to yield the
final result. Details of the algorithms used to generate the final textures are described in
Section III.F.
III.h Texture Tiles
Cohen et. al. [11] use a set of 18 tiles to map a large texture area; they note that
even though only 8 tiles are theoretically enough to aperiodically tile a surface, it helps
to use more tiles to achieve better results. While using cellular automata with 2 states, I
use 8 tiles for each state – leading to a total of 16 tiles.

35
Figure 16 Conceptual diagram of the Texullar system: Stage 1
Figure 17 Conceptual diagram of the Texullar system: Stage 2
36
III.i Wang Tiles and Cellular Automata
After evolving a population using cellular automata, I generated textures for
terrains using a set of 8 Wang tiles for each state. Thus, I used a total of 16 texture tiles.
The tiles were designed in a way such that the Wang tiles for each given North
configuration of one state would blend in seamlessly with the South-East configuration
of its own state as well as other states of the cellular automata. No rotations were
allowed for the Wang tiles.
37
IV IMPLEMENTATION
IV.a Implementation Details
I have developed a program called Texullar in C++ using the OpenGL libraries
and Windows API. I used Visual Studio .NET 2003 as the Integrated Development
Environment. I used Adobe Photoshop and MS Paint to generate the images used as
texture tiles.
At the end of stage 1, the program outputs a file that contains details of the state of
the cell population used to generate the final texture. The user can manipulate this file to
“tweak” the final result. However, it is the responsibility of the user to ensure that the
changes made are valid, i.e., the states used conform to the valid set of states for the rule
used.
The state of a cell depends on the state of its neighbors in the previous generation.
Since the neighbors are not completely defined for edge cells, the program “wraps
around” the neighbors for cells on the boundary of the terrain map. For example, the
neighbors of the top left cell in the terrain map that used a Moore neighborhood of 8
cells would include cells from the bottom left corner, the top right corner and the bottom
right corner. While this approach may lead to slightly inaccurate results, particularly in
the case where elevation information is also incorporated in the placement of texture
tiles, it provides a simplification in the implementation.
38
The program uses MIP maps [27] to apply the appropriate level of detail while
rendering the view. MIP stands for "multum in parvo” - Latin for “many in a small
place”. MIP mapping is a texture mapping technique that uses multiple texture maps
(MIP maps), where each MIP map is half the size of the one at the previous level. This
provides several texture maps for various levels of depth. For my thesis, I have
generated the MIP maps using OpenGL libraries.
The user can define an initial population using a configuration file. The number of
states that can be defined depends on the rule being used. For example, a 1-bit cellular
automata rule like Conway’s Game of Life is defined using 0 and 1.
When the 2D height map defining the terrain is read by the program, one polygon
is created in the 3D mesh for each pixel in the height map. The program allows the
subdivision of polygons using bilinear interpolation to achieve a higher density 3D
mesh. If the resolution of the 3D mesh is the same as the texture placement, there is a
one-to-one mapping between the polygons on the geometry mesh and the texture
placement mesh. However, each polygon can be subdivided into smaller polygons to
map more textures onto the same surface. For instance, the program reads in a height
map of 32 x 32 pixels – by default, this maps one-to-one with a cell population of 32 x
32 cells. If the size of the cell population is 64 x 64, each quadrilateral on the 32 x 32
terrain mesh is subdivided into a 2x2 grid using bilinear interpolation to obtain 64 x 64
quadrilaterals.

39
IV.b The User Interface
The user interface allows users to generate textures over terrain surfaces defined
by a gray scale terrain map. The user can alter any of the input parameters. Figure 18
shows how a user can pick a cellular automata rule and the number of generations for the
evolution of the initial cell population. Figure 19 illustrates the various options that can
be used to generate textures through Texullar.
Figure 18 Texullar: (Menu) Picking a Rule
Figure 19 Texullar: (Menu) Choosing a type of method for texture generation

40
Using the mouse, a user can zoom in and out to view the results – clicking in the
“up” direction zooms in and clicking in the “down” direction zooms out. The view can
be rotated by clicking the left mouse button in the desired direction (left or right) of
rotation.
The initial configuration of the cell population can be defined through a text file
(ca_initpop.txt). This file contains the initial state of each cell, corresponding to the set
of states applicable to the chosen rule.

41
V RESULTS
V.a Results
I have generated textures for different terrains to study the effect of varying
different parameters on the output. All the results presented in this section were
generated using a height map of 32 x 32 pixels which was subdivided to generate a set of
64 x 64 quadrilaterals, each cell mapping one-to-one with a quadrilateral.
Figures 20 and 21 illustrate the set of texture tiles used to generate the terrain
textures for Figures 23 – 25. While defining probabilistic distributions for the texture
tiles according to height, the texture tiles were sub-classified according to the density of
flowers on the tiles. The cellular automata rules of Amoeba were applied to an initial
population and evolved over 10 generations for these images. These three figures have
been shown with the terrain mesh in the same orientation to illustrate how the choice of
inputs influences the final results.

42
Figure 20 Texture tiles used for bluebonnets (Cellular automata state = 0)

43
Figure 21 Texture tiles used for yellow flowers (Cellular automata state = 1)
44
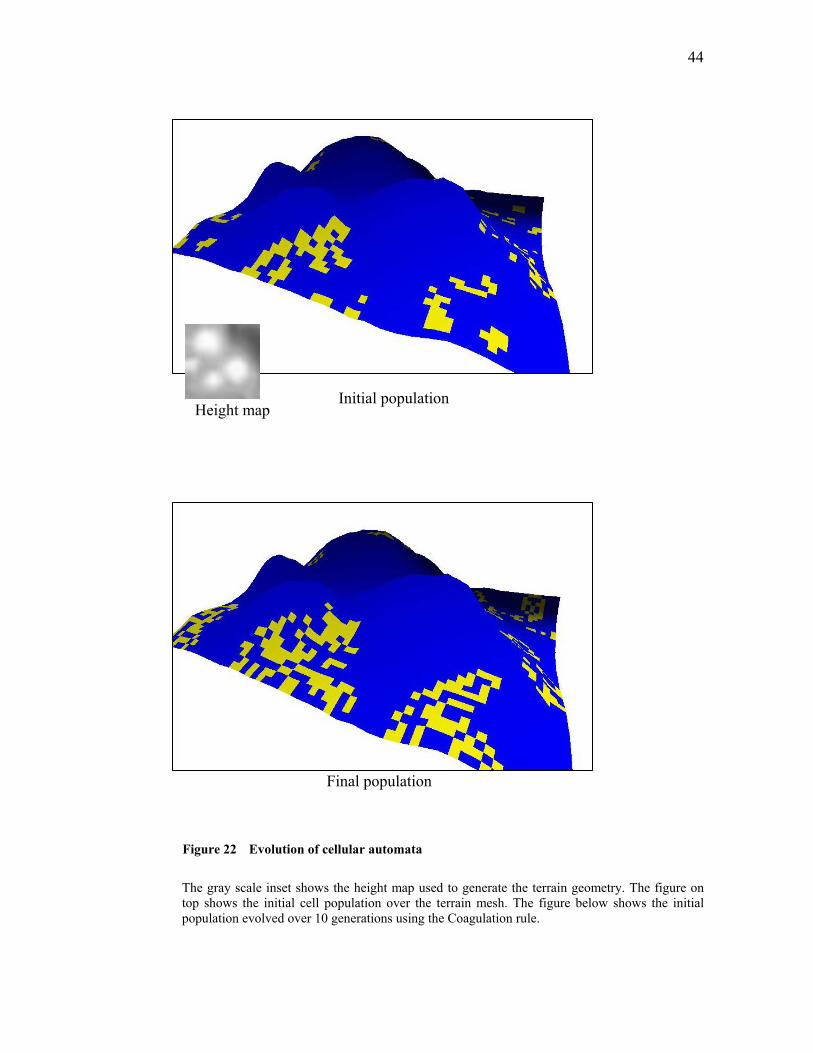
Figure 22 Evolution of cellular automata
The gray scale inset shows the height map used to generate the terrain geometry. The figure on top shows the initial cell population over the terrain mesh. The figure below shows the initial population evolved over 10 generations using the Coagulation rule.
Height map Initial population
Final population

45
Figure 23 Texture generation using a random selection of texture tiles
The inset shows the final population (blue indicates the cells with state =0, yellow indicates the cells with state = 1). This is the same final population and terrain mesh as shown in Figure 22.
Figure 24 Terrain texture generated using cellular automata and probabilistic distribution according to height.
The texture was generated using the same final population as in Figures 22 and 23. The probabilistic distribution scheme favors bluebonnets at higher elevations and yellow flowers at lower elevations

46
Figure 25 Texture generation using a probabilistic distribution according to height
The probabilistic distribution scheme favors bluebonnets at lower elevations and yellow flowers at higher elevations. This image uses the same terrain mesh as in Figure 22.
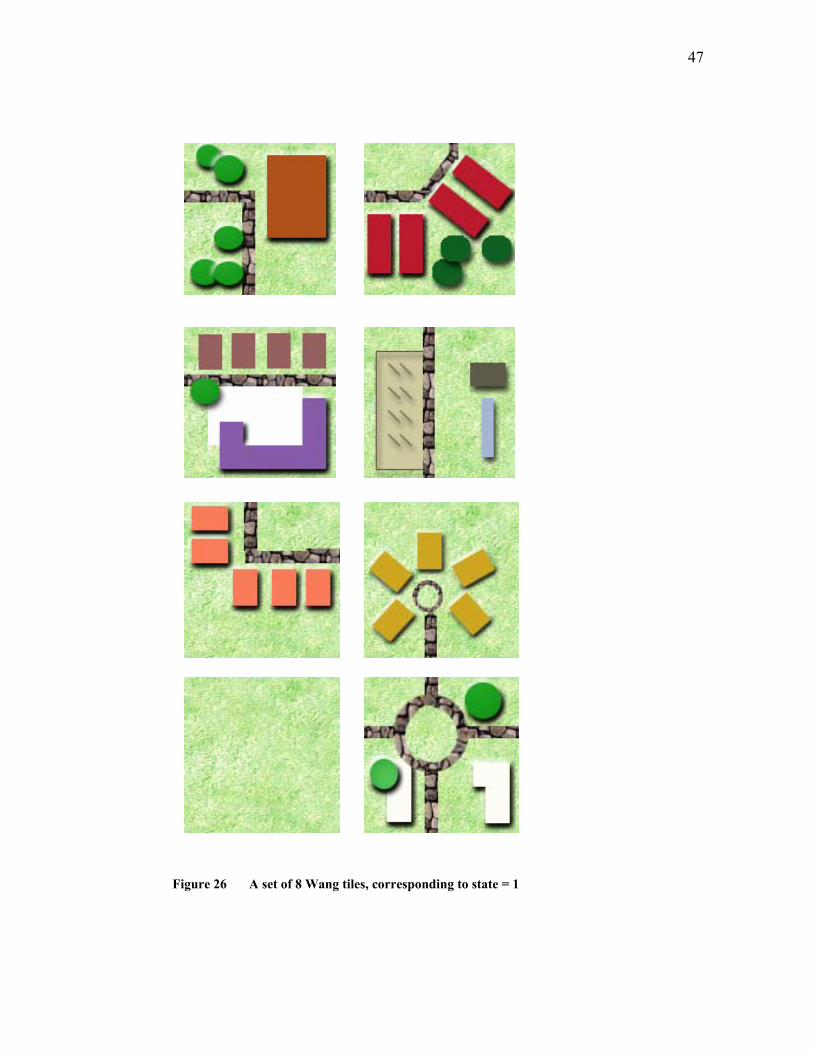
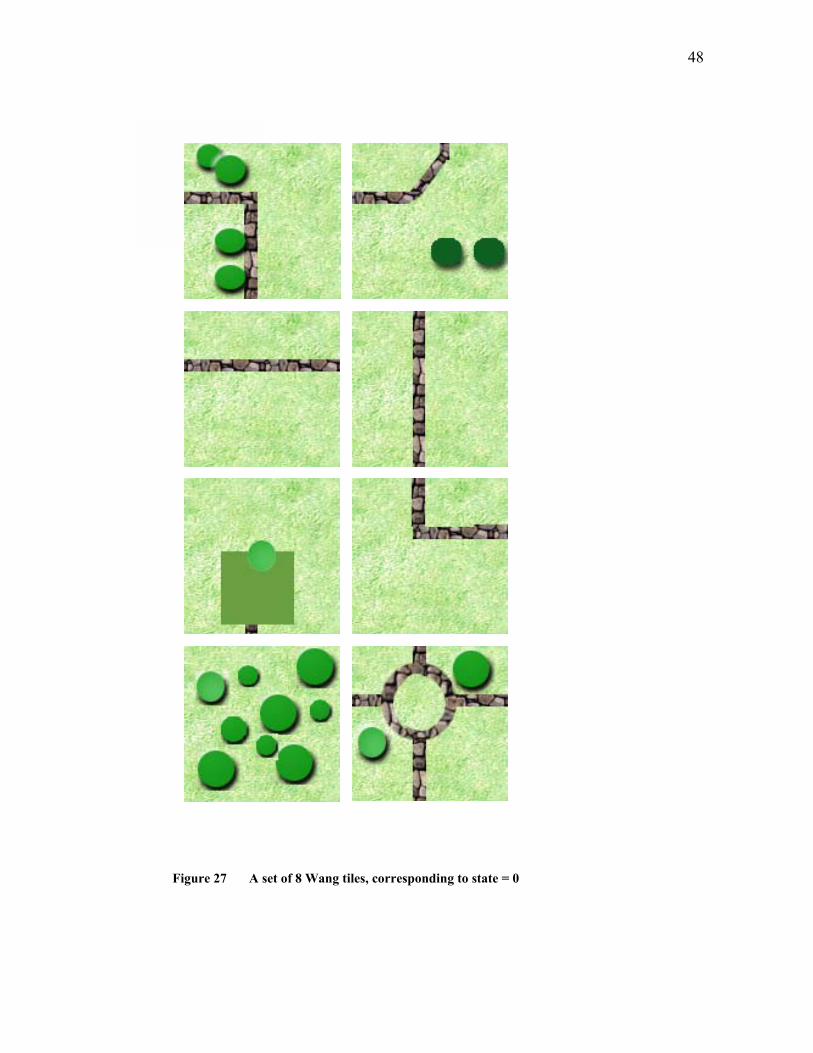
Figures 26 and 27 show the Wang tiles used as texture tiles. The tiles for the state
1 have show buildings (with the exception of one). The tiles for the state 0 have no
buildings; they only have roads and trees. Figures 28 and 29 were generated by texture
mapping through a hybrid approach involving cellular automata, Wang tiles and
probabilistic distribution.
47
Figure 26 A set of 8 Wang tiles, corresponding to state = 1
48
Figure 27 A set of 8 Wang tiles, corresponding to state = 0

49
Figure 28 Texture mapping using cellular automata, Wang tiles and probabilistic height distribution. Purple buildings are preferred for lower elevations while red buildings are preferred for higher elevations. Due to the use of Wang tiles, the roads meet up to form a connected network, even though individual tiles contain small segments of the road.
Figure 29 Texture mapping using cellular automata, Wang tiles and probabilistic distribution of texture tiles according to height.
The higher elevations strictly favored the use of texture tiles with no buildings at all. Thus, cells at the higher elevations with state = 1 also use the texture tile with no buildings
50
VI EVALUATION AND ANALYSIS
VI.a User Survey
To evaluate the effectiveness of the method used for generating textures and to test
the hypotheses discussed in Section III.B, a user survey was conducted. The survey was
conducted according to the specifications laid down by the Institutional Review Board at
Texas A&M University. As the survey was deemed to pose minimal risk to participants,
an exemption from full review was granted.
VI.b Participant Group
The survey was publicized through notices and the respondents were selected on a
first-come-first-served basis. Participation in the survey was voluntary, and the
respondents were offered neither incentives nor compensation for participation. No
personal information about the users was collected. All participants were required to be
above 18 years of age. A total of 17 people participated in the survey.
VI.c The Questionnaire
Survey participants were shown sets of images, and asked to evaluate the visual
quality of the images through a questionnaire. All questions had four options, each of
which was to be assigned a score on a scale of 1 to 10, depending on how "realistic and
51
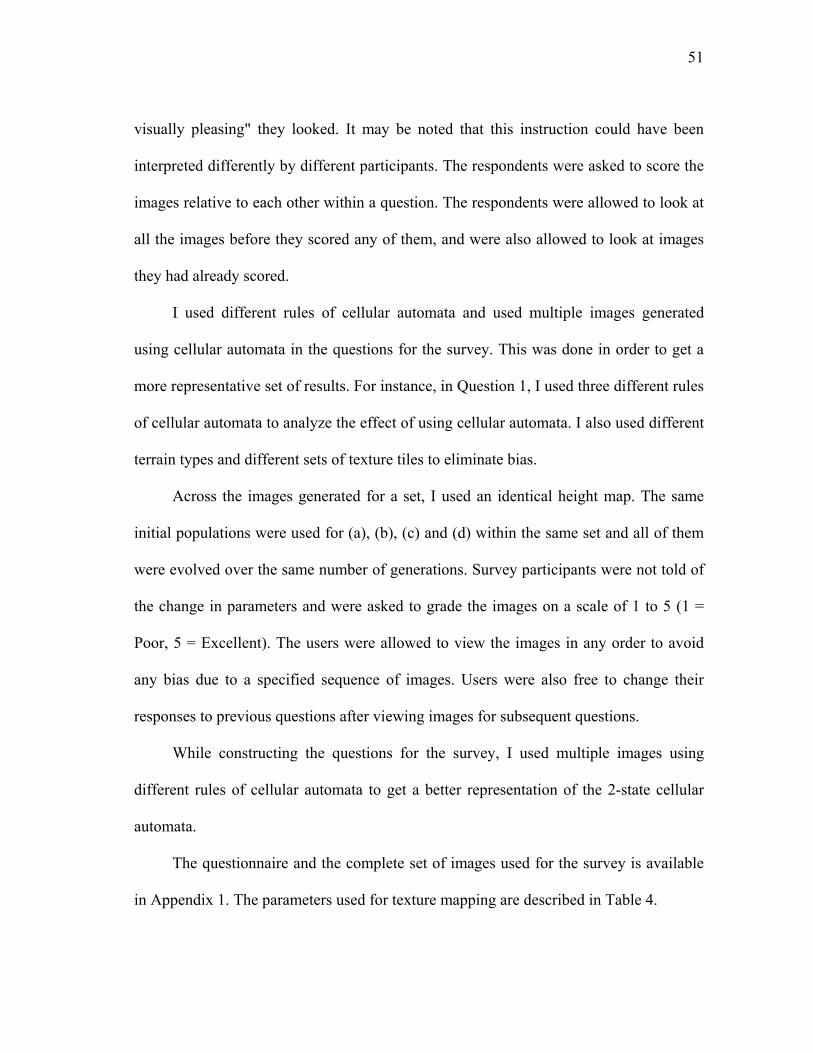
visually pleasing" they looked. It may be noted that this instruction could have been
interpreted differently by different participants. The respondents were asked to score the
images relative to each other within a question. The respondents were allowed to look at
all the images before they scored any of them, and were also allowed to look at images
they had already scored.
I used different rules of cellular automata and used multiple images generated
using cellular automata in the questions for the survey. This was done in order to get a
more representative set of results. For instance, in Question 1, I used three different rules
of cellular automata to analyze the effect of using cellular automata. I also used different
terrain types and different sets of texture tiles to eliminate bias.
Across the images generated for a set, I used an identical height map. The same
initial populations were used for (a), (b), (c) and (d) within the same set and all of them
were evolved over the same number of generations. Survey participants were not told of
the change in parameters and were asked to grade the images on a scale of 1 to 5 (1 =
Poor, 5 = Excellent). The users were allowed to view the images in any order to avoid
any bias due to a specified sequence of images. Users were also free to change their
responses to previous questions after viewing images for subsequent questions.
While constructing the questions for the survey, I used multiple images using
different rules of cellular automata to get a better representation of the 2-state cellular
automata.
The questionnaire and the complete set of images used for the survey is available
in Appendix 1. The parameters used for texture mapping are described in Table 4.

52
Table 4 Parameters for images used in survey
Ques Choices
(a) (b) (c) (d)
Terrain 1 Random CA (Conway’s Game of Life) + Random
CA (Amoeba) + Random
CA (Coagulation) + Random
Q 1
Terrain 2 Random CA (Conway’s Game of Life) + Random
CA (Amoeba) + Random
CA (Coagulation) + Random
Terrain 1 CA (Conway’s Game of Life) + Random
CA (Amoeba) + Random
CA (Conway’s Game of Life) + Heightprob
CA (Amoeba) + Heightprob
Q 2
Terrain 2 CA (Conway’s Game of Life) + Random
CA (Amoeba) + Random
CA (Conway’s Game of Life) + Heightprob
CA (Amoeba) + Heightprob
Terrain 1 Heightprob CA (Conway’s Game of Life) + Heightprob
CA (Amoeba) + Heightprob
CA (Coagulation) + Heightprob
Q 3
Terrain 2 Heightprob CA (Conway’s Game of Life) + Heightprob
CA (Amoeba) + Heightprob
CA (Coagulation) + Heightprob
Q 4 CA (Conway’s Game of Life) + Heightprob
CA (Coagulation) + Heightprob
CA (Conway’s Game of Life) + Wang tiles + Heightprob
CA (Coagulation) + Wang tiles + Heightprob
Q 5 Wang tiles CA (Conway’s Game of Life) + Wang tiles + Heightprob
CA (Coagulation) + Wang tiles + Heightprob
Wang tiles
Abbreviations used in Table 4: CA: Using cellular automata rules; the name of the rule used is indicated in parentheses. Heightprob: Applying height information to define a probabilistic distribution of texture tiles Random: Random placement of textures Wang tiles: Texture placement defined by Wang tiles
VI.d Analysis of Survey Results
The scores given to the images were analyzed at the end of the survey. One of the
participants volunteered the information of being color blind. Scores from this
participant showed very little variation, all scores being within a range of 2 to 4. I
interpreted this as an indication of the fact that the participant was not able to distinguish

53
enough detail to judge the images appropriately. Hence, I did not consider scores from
this participant while compiling the results; the analysis was done on the basis of
responses from the remaining 16 respondents.
0
1
2
3
4
5
6
7
8
9
10
Min Max Average
Scor
e
Random
Cellular automata with randomness
Figure 30 Comparing Random against CA + Random
Figure 30 above shows that the minimum, maximum and average scores given by
respondents to images with random placement of textures is lower than those for cellular
automata with randomness. An analysis of the scores given to images using only random

54
placement against those using cellular automata rules and randomness showed a p-value
of 0.15. Since p < α, I reject the null hypothesis (H10) in this case. Thus, there is
sufficient evidence to support the research hypothesis (H1a) and conclude that, for the
assignment of texture tiles on a 3D terrain mesh, a hybrid approach combining cellular
automata and random placement leads to a higher mean score than a random placement
alone.
0
1
2
3
4
5
6
7
8
9
10
Min Max Average
Scor
e
Cellular automata with randomness
Cellular automata with probabilistic height distribution
Figure 31 Comparing CA + Random against CA + height
Figure 31 shows that the minimum, maximum and average scores given by
respondents to images with random placement of textures is lower than those for a
hybrid approach using cellular automata with a probabilistic distribution of texture tiles

55
according to height. Further analysis shows a p-value of 0.14. Since p < α, there is
enough evidence to reject the null hypothesis (H20) in this case. Thus, there is sufficient
evidence to support the research hypothesis (H2a) and conclude that, for the assignment
of texture tiles on a 3D terrain mesh, a hybrid approach combining cellular automata and
probabilistic distribution of texture tiles according to height of the terrain leads to a
higher mean score than a hybrid approach combining cellular automata and random
placement.
0
1
2
3
4
5
6
7
8
9
10
Min Max Average
Scor
e
Probabilistic distribution according to heightCellular automata with probabilistic height distribution
Figure 32 Comparing CA + height against Height
Figure 32 above shows that the minimum, maximum and average scores given by
respondents to images generated using a probabilistic distribution of texture tiles
56
according to height is lower than those generated using a hybrid approach integrating
cellular automata with a probabilistic distribution of texture tiles according to height. An
analysis of the scores given to images using only random placement against those using
cellular automata rules and randomness showed a p-value of 0.17. Since p < α, the null
hypothesis (H30) can be rejected in this case. Thus, there is sufficient evidence to
support the research hypothesis (H3a) and conclude that, for the assignment of texture
tiles on a 3D terrain mesh, a hybrid approach combining cellular automata and
probabilistic distribution of texture tiles according to height of the terrain leads to a
higher mean score than an approach using a probabilistic distribution of texture tiles
according to height of the terrain alone.
0
1
2
3
4
5
6
7
8
9
10
Min Max Average
Scor
e
Cellular automata with probabilistic height distributionCellular automata with probabilistic height distribution and Wang tiles
Figure 33 Comparing CA + height against CA + height + Wang tiles
57
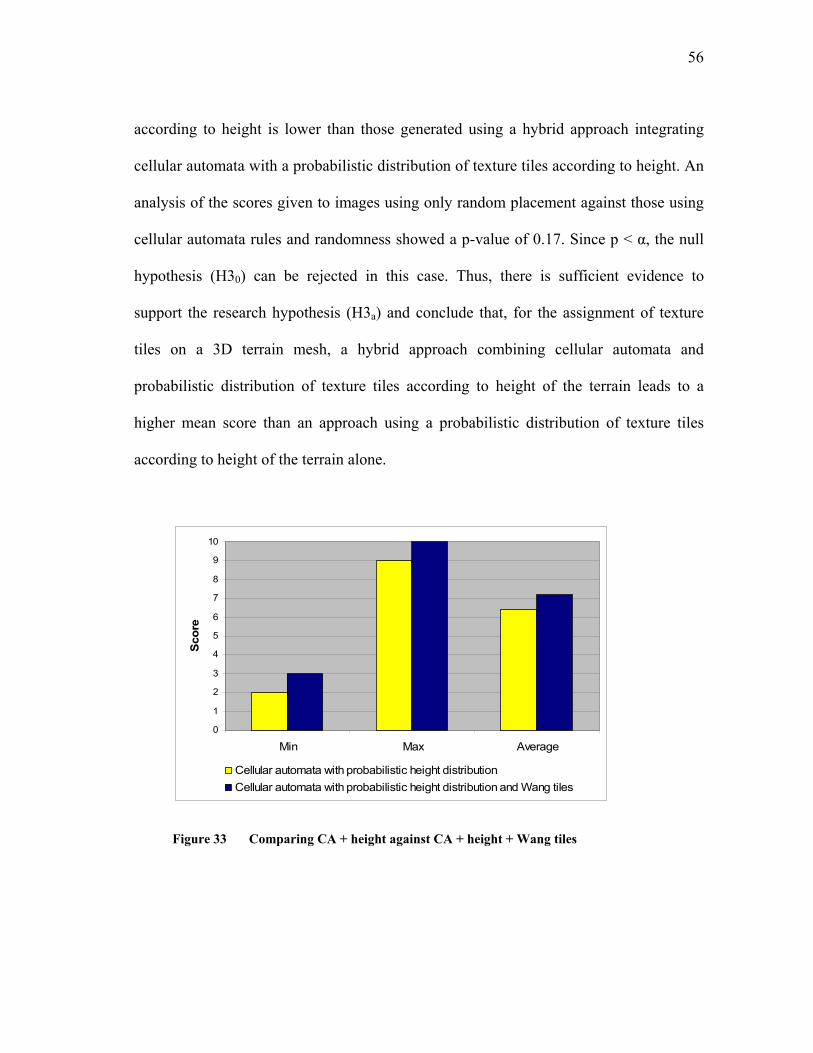
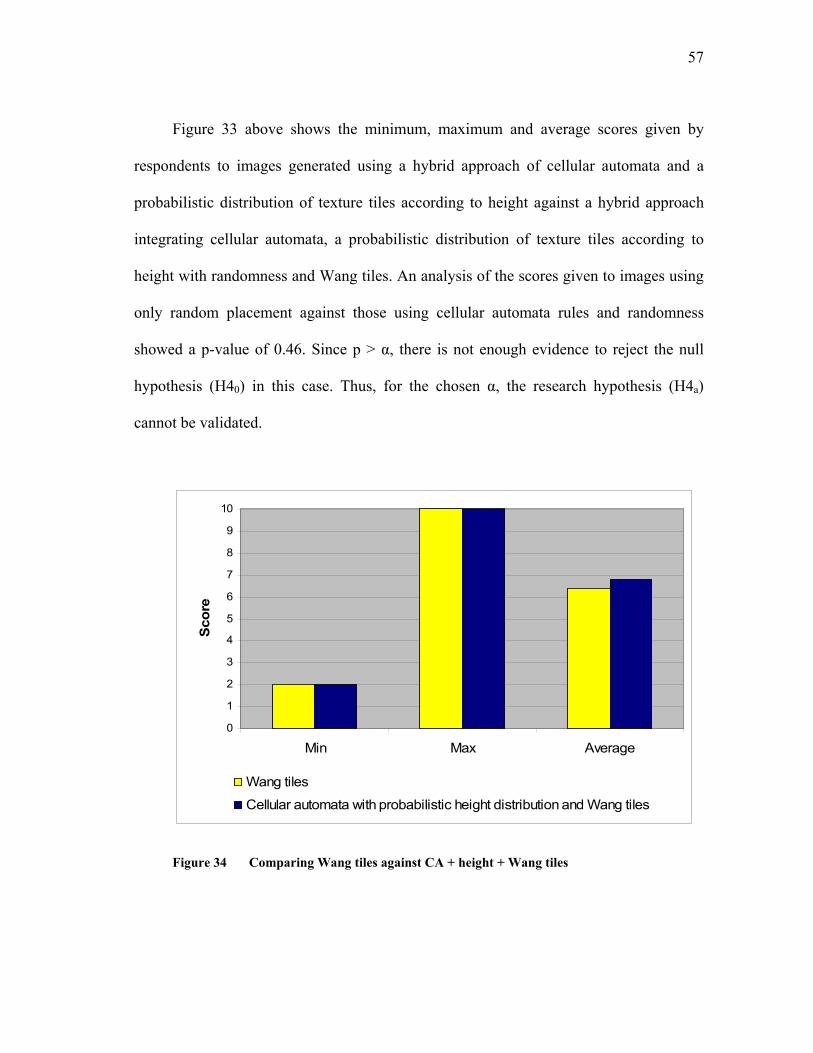
Figure 33 above shows the minimum, maximum and average scores given by
respondents to images generated using a hybrid approach of cellular automata and a
probabilistic distribution of texture tiles according to height against a hybrid approach
integrating cellular automata, a probabilistic distribution of texture tiles according to
height with randomness and Wang tiles. An analysis of the scores given to images using
only random placement against those using cellular automata rules and randomness
showed a p-value of 0.46. Since p > α, there is not enough evidence to reject the null
hypothesis (H40) in this case. Thus, for the chosen α, the research hypothesis (H4a)
cannot be validated.
0
1
2
3
4
5
6
7
8
9
10
Min Max Average
Scor
e
Wang tiles
Cellular automata with probabilistic height distribution and Wang tiles
Figure 34 Comparing Wang tiles against CA + height + Wang tiles
58
The results of Figure 34 are interesting, as they show a very insignificant increase
in the mean score of images using Wang tiles when cellular automata and probabilistic
distribution of texture tiles using height information is added to the algorithm for texture
generation. However, this may have been the case because the respondents did not know
the desired distribution patterns of textures used to generate the images. The use of
Wang tiles eliminated periodicity and the respondents of the survey may not have been
able to detect the subtle changes brought into effect by the use of cellular automata and
the probabilistic distribution of texture tiles.
59
VII PROBLEMS AND LIMITATIONS
I note that the effectiveness of the final results is likely to depend on the actual
texture tiles used as inputs. The results can also be influenced by the choice of rules for
the cellular automata used.
This work explores only those terrains that can be represented by height maps –
thus eliminating terrain features such as cliffs and caves. The probabilistic distributions
according to height for such terrain types would also be different. For instance, the
texture tiles used for an elevation interval may be different in case of a cave and an
undulating hill slope.
Since the quality of images is a very subjective domain, it is difficult to score
images by giving the quality a numerical value. In some of the survey questions, the
images used for the options (a, b, c and d) were similar with minor variations. If a survey
respondent were to re-score the images, it would be likely that the scores might be
different. The fact that all participants responded to the invitation notice for the survey
indicates that they have an interest in the area of computer graphics – this may have
influenced their scoring pattern because they might have already had extensive exposure
to computer-generated images.
Some questions in the survey had more than one image per option. This was done
with the intention of having a greater representative set of images generated using the
given parameters. However, in a few cases, the quality of images within an option was
different. Some respondents remarked that this made it difficult to evaluate the results.

60
In the images used for the survey questions, I noticed that even a minor change in
the orientation or lighting for one of the options affected the response of some users. For
instance, one respondent gave a lower score to one of the options in Question 4 because
it was darker than the others. The use of particular textures may also have influenced the
responses of participants; similar problems have been noted by Bair et al. [4] and House
et al. [42].
The survey images illustrated only a small subset of all the possible options to
generate textures using the given set of parameters. Many different possibilities still exist
that have not been explored. For instance, instead of using a uniform random
distribution, other options like Perlin noise could be investigated. Various options for the
probabilistic distribution of texture tiles according to height can also be explored.
Results can also be generated using cellular automata algorithms with different rules,
number of states, characteristics and growth rates. Different terrain types and texture
patterns can also be studied.
61
VIII CONCLUSIONS
VIII.a Conclusions
An analysis of the survey results (Section VI.D) shows that using cellular automata
concepts can, in some cases, potentially yield better results than random placement of
texture tiles alone as well as probabilistic distribution of texture tiles based on height
information alone.
I noticed that using Wang tiles with cellular automata and probabilistic distribution
of texture tiles based on height information reduced periodicity of texture tiles while
following a theme defined by the final cell population. However, this did not necessarily
translate into higher mean scores as compared to images generated using only Wang
tiles. This hypothesis could be re-evaluated by conducting another survey in which
respondents can be asked to generate a terrain texture using Wang tiles by evolving an
initial population by choosing parameters for evolution. Respondents may be able to
achieve more customized results using this approach – more so by also defining their
own probabilistic distributions according to height – than by the use of Wang tiles alone.
Images generated in this fashion might lead to a higher mean score than images
generated using Wang tile information alone.
Some advantages of using the approaches described in this work for texture
mapping include the fact that it allows the user to define an initial configuration and
evolve it according to the growth patterns desired. It also gives the user options to
customize various parameters to change the final outcome. Most importantly, using

62
cellular automata can save a lot of user input from hand painting textures over large
surfaces. Since cellular automata can be evolved using parallel computation techniques,
they can be processed in short intervals of time and can yield quick results.
VIII.b Future Work
The use of texture tiles with rotations can give greater aperiodicity in texture
generation, while using fewer texture tiles. This can lead to a potential saving of memory
– a critical resource in interactive computer graphics applications.
The application of 3D cellular automata can also lead to interesting results and can
be a future direction of research. The effects of adding Perlin noise [67] and randomness
in the evolution of the cellular automata can also be investigated.
Another idea is to pre-define some terrain features (like lakes or major roads) and
the placement of texture tiles that map to them. Then, we can evolve only the cells that
map to the rest of the terrain mesh. This, however, would need special consideration for
the rules to be applied when there is a break in continuity in the cell population due to
the pre-defined features.
63
REFERENCES
1. Fracplanet, http://www.bottlenose.demon.co.uk/share/fracplanet, accessed on
October 7, 2005.
2. A. Asirvatham and H. Hoppe, “Terrain Rendering Using GPU-based Geometry
Clipmaps,” GPU Gems 2, M. Pharr and R. Fernando, eds., Boston, MA:
Addison-Wesley, pp. 27-45, 2005.
3. T. Bäck, F. Hoffmeister, H. Schwefel, “A Survey of Evolution Strategies,” in L.
B. Belew, R. K. Booker, eds., Proc. Int’l Conf. Genetic Algorithms, pp. 2-9,
1991.
4. A. Bair, D. House and C. Ware, “Perceptually Optimizing Textures for Layered
Surfaces,” Applied Perception in Graphics and Visualization, pp. 67-74, 2005.
5. M. Batty and Y. Xie, “From Cells to Cities,” Environment and Planning B, 21,
s31-s48. 1994.
6. M. Batty and Y. Xie, “Possible Urban Automata,” Environment and Planning B,
24(2), pp. 175-192, 1997.
7. S. Benati, 1997, “A Cellular Automaton for the Simulation of Competitive
Location,” Environment and Planning B, 24(2), pp. 175-192.
8. C. Bloom, “Terrain Texture Compositing by Blending in the Frame-Buffer,”
http://www.cbloom.com/3d/techdocs/splatting.txt, accessed on October 1, 2005.
64
9. P. Bourke, "Fractal Landscapes,” 1991,
http://astronomy.swin.edu.au/~pbourke/modelling/frachill/, accessed on October
5, 2005.
10. A. Carosio, “Three-Dimensional Synthetic Landscapes: Data Acquisition,
Modelling and Visualisation,” D. Fritsh and D. Hobbie eds., Photogrammetric
Week ‘95, pp. 293-302, 1995.
11. M. F. Cohen, J. Shade, S. Hiller and O. Deussen, “Wang tiles for Image and
Texture Generation,” Proc. ACM SIGGRAPH, vol. 22, no. 3, pp. 287-294, 2003.
12. R. L. Colasanti and R. Hunt, “Resource Dynamics and Plant Growth: A Self-
Assembling Model for Individuals, Populations and Communities,” Functional
Ecology 11, pp. 133-145, 1995.
13. R. L. Colasanti, R. Hunt and A.P. Askew, “A Self-Assembling Model of
Resource Dynamics and Plant Growth Incorporating Plant Functional Types,”
Functional Ecology 15, pp. 676-687, 2001.
14. V. Cole and J. Albrecht, “Modelling the Spread of Invasive Species — Parameter
Estimation Using Cellular Automata In GIS,” 1999.
http://www.geo.hunter.cuny.edu/people/fac/albrecht/DMGIS99.pdf, accessed on
October 1, 2005.
15. R. Conte and R. Hegselmann, “The Dynamics of Sharing,” SimSoc '97, 1997.
16. J.P. Crutchfield and J.E. Hanson, “Turbulent Pattern Bases for Cellular
Automata,” Physica D 69, pp. 279-301, 1993.

65
17. P. Decaudin and F. Neyret, “Rendering Forest Scenes in Real-Time, Rendering
Techniques,” Proc. Eurographics Symp. Rendering, pp. 93-102, 2004.
18. B. Desbenoit., E. Galin, and S. Akkouche, “Simulating and Modeling Lichen
Growth,” Computer Graphics Forum, vol. 23, no. 3, pp. 341-350, 2004.
19. J. Dexter, “Texturing Heightmaps,”
http://www.gamedev.net/reference/articles/article2246.asp, accessed on October
1, 2005.
20. J. Dorsey and P. Hanrahan, “Modeling and Rendering of Metallic Patinas,” Proc.
ACM SIGGRAPH, pp. 387-396, 1996.
21. J. Dorsey, A. Edelman, H. Jensen, J. Legakis, and H. Pedersen, “Modeling and
Rendering of Weathered Stone,” Proc. ACM SIGGRAPH, pp. 225-234, 1999.
22. J. Dorsey, H. K. Pedersen, and P. Hanrahan, “Flow and Changes in Appearance,”
Proc. ACM SIGGRAPH, 1996.
23. A. A., Efros, and W. T. Freeman, “Image Quilting for Texture Synthesis and
Transfer,” Proc. ACM SIGGRAPH, pp. 341-346, 2001.
24. C. Emmeche, “The Garden in the Machine: The Emerging Science of Artificial
Life,” Princeton University Press, translated from the Danish by S. Sampson,
1994.
25. G. Engelen, R. White, I. Uljee, and P. Drazan, “Using Cellular Automata for
Integrated Modelling of Socio-Environmental Systems,” Environmental
Modelling and Assessment, vol. 34, pp. 203-214, 1995.

66
26. E. Fredkin and T. Toffoli, “Conservative logic,” Int’l J. Theoretical Physics, vol.
21, no. 3/4, pp. 219-253, 1982.
27. J. Foley, and A. van Dam, “Computer Graphics: Principles and Practice,”
Addison-Wesley, 1990.
28. Fotograferen.net: Wallpapers: Snow, http://www.fotograferen.net/, accessed on
October 1, 2005.
29. M. Gardner, “Mathematical Games: The Fantastic Combinations of John
Conway's New Solitaire Game ‘Life’,” Scientific American, pp. 120-123, Oct.
1970.
30. M. Gardner, “Mathematical Games: On Cellular Automata, Self-Reproduction,
the Garden of Eden, and the Game ‘Life’,” Scientific American, pp. 112-117,
1971.
31. G. Guariso and Baracani, “A Simulation Software of Forest Fires Based on Two-
Level Cellular Automata,” Proc. Int’l Conf. on Forest Fire Research 2002 and
Wildland Fire Safety Summit, pp. 100-101, 2002.
32. L.A. Green, M. Saslow, J. Keyser, and E. Akleman, “Tiled Texture Synthesis,”
Thesis Report, Texas A&M University, 2004.
33. S. Gobron and N. Chiba, 3D Surface Cellular Automata and Its Applications, J.
Visualization and Computer Animation, pp. 143–158, 1999.
34. D. Goldberg, “Genetic Algorithms,” Boston, MA: Addison Wesley, 1988.

67
35. G. Gabriele, V. Interrante, and G. Sapiro, “Texture Synthesis for 3D Shape
Representation,” IEEE Trans. on Visualization and Computer Graphics, vol.9
no. 4, pp. 512-524, 2003.
36. L. Gray, "A Mathematician Looks at Wolfram's New Kind of Science." Not.
Amer. Math. Soc. 50, pp. 200-211, 2003.
37. B. Grunbaum B., and G.C. Shephard, Tilings and Patterns, New York: W. H.
Freeman and Co., 1987.
38. P.S. Heckbert, “Survey of Texture Mapping,” IEEE Computer Graphics and
Applications, vol. 6, no. 11, pp. 215-223, 1986.
39. J.H. Holland, Adaptation in Natural and Artificial Systems: An Introductory
Analysis with Applications to Biology, Control, and Artificial Intelligence, 2nd
ed., Cambridge, MA: MIT Press, 1992.
40. H. Hoppe, “Smooth View-Dependent Level-Of-Detail Control and Its
Application to Terrain Rendering,” Proc. IEEE Conf. on Visualization, pp. 35-
42, 1998.
41. W. Hordijk, J.P. Crutchfield, and M. Melanie, “Mechanisms of Emergent
Computation in Cellular Automata”, Lecture Notes in Computer Science, vol.
1498, pp. 613-622, 1998.
42. D. House, A. Bair, and C. Ware, “On the Optimization of Visualizations of
Complex Phenomena,” Proc. IEEE Visualization, 2005.
43. J. T. Kajiya, and T. L. Kay, “Rendering Fur with Three Dimensional Textures,”
Computer Graphics, vol. 23, no. 3, pp. 271-280, July 1989.

68
44. I. Karafyllidis, and A. Thanailakis, “A Model Predicting Forest Fire Spread
Using Cellular Automata,” Ecological Modelling 99, pp. 87-97, 1997.
45. S. Kauffman, At Home in the Universe: The Search for Laws of Self-
Organization and Complexity, New York: Oxford University Press, 1995.
46. S. Kauffman, The Origins of Order, New York: Oxford University Press, 1993.
47. A. Kaur, J. Chen, D. House, and E. Akleman, “Texture Mapping Using Tiled
Textures,” M.S. Thesis, Texas A&M University, College Station, TX, 2004.
48. R. Kosara, C.G. Healey, V. Interrante, D.H. Laidlaw, and C. Ware, “Thoughts on
User Studies: Why, How and When,” Proc. IEEE Computer Graphics and
Applications, vol. 23, no. 4, pp.20-25, 2003.
49. C. Langton, “Studying Artificial Life with Cellular Automata,” Physica D, vol.
22, 1986, pp. 120-149, 1982.
50. C. Langton, “Self-Reproduction in Cellular Automata,” Physica D, vol.10, pp.
135-144, 1984.
51. S. Lefebvre, and H. Hoppe, “Parallel Controllable Texture Synthesis,” Proc.
ACM SIGGRAPH, vol 24, no. 3, pp. 777-786, 2005.
52. S. Lefebvre, and F. Neyret, “Pattern Based Procedural Textures,” Proc. ACM
Symp. Interactive 3D Graphics, pp. 203-212, 2003.
53. X. Li, and W. Magill, “Modelling Fire Spread Under Environmental Influence
Using A Cellular Automaton Approach,” Complexity International 8, pp. 1-14,
2000.
69
54. P. Lindstrom, and V. Pascucci, “Visualization of Large Terrains Made Easy,”
Proc. IEEE Visualization, pp. 363–370, 2001.
55. P. Litwinowicz, and G. Miller, “Efficient Techniques for Interactive Texture
Placement,” Int'l Conf. Computer Graphics and Interactive Techniques, pp. 119-
122, 1994.
56. F. Losasso and H. Hoppe, “Geometry Clipmaps: Terrain Rendering Using Nested
Rectangular Grids,” ACM Trans. Graph., vol. 23, no. 3, pp. 769-776, 2004.
57. B. Mandelbrot, The Fractal Geometry of Nature, San Francisco, CA: W. H.
Freeman, 1982.
58. Mathworld, http://mathworld.wolfram.com, accessed on Oct 01, 2005.
59. W. Matusik, M. Zwicker and F. Durand, “Texture Design Using a Simplicial
Complex of Morphable Textures,” Proc. ACM SIGGRAPH, vol. 24, no. 3, pp.
787 - 794 , 2005.
60. M. Melanie, J. P. Crutchfield, and R. Das, “Evolving Cellular Automata with
Genetic Algorithms: A Review of Recent Work,” Proc. First Int’l Conf.
Evolutionary Computation and Its Applications, 1996.
61. M. Melanie, P. T. Hraber, and J. P. Crutchfield, “Revisiting the Edge of Chaos:
Evolving Cellular Automata to Perform Computations,” Complex Systems 7, pp.
89-130, 1993.
62. H. W. Jensen, J. Legakis, J. Dorsey, “Rendering of Wet Materials,” Proc. 10th
Eurographics Workshop on Rendering, pp. 273-282, 1999.
70
63. F.K. Musgrave, C.E. Kolb, R.S. Mace, "The Synthesis and Rendering of Eroded
Fractal Terrains,” Proc. Int’l Conf. Computer Graphics and Interactive
Techniques, pp. 41 – 50, 1989.
64. F. Neyret, M. Cani, “Pattern-Based Texturing Revisited,” Proc. 26th Annual
Conf. Computer Graphics and Interactive Techniques, pp. 235-242, 1999.
65. T. J. Ong, “Using Genetic Algorithms to ‘Auto-Generate Textures’ for
Predetermined Environment,” Project Report, Texas A&M University, 2003.
66. R. B. Pajarola, “Large Scale Terrain Visualization Using The Restricted
Quadtree Triangulation,” IEEE Visualization, pp. 19–26, 1998.
67. K. Perlin, “An Image Synthesizer,” Proc. ACM SIGGRAPH, pp. 287 – 296,
1985.
68. www.rufenacht.com/CA/AnimalSim.html, “And What If Animal Skins Were
Cellular Automata?” (as viewed on Aug 26, 2005)
69. Rucker Rudy, "Symbiotic Programming: Cross-Breeding Cellular Automaton
Rules on the CAM-6,” J. Complex Systems, vol. 3, pp. 79–90, 1989.
70. S. Rusinkiewicz and M. Levoy, “Qsplat: A Multiresolution Point Rendering
System for Large Meshes,” Proc. ACM SIGGRAPH, pp. 343 – 352, 2000.
71. P. Sander, J. Snyder, S. Gortler, H. Hoppe, “Texture Mapping Progressive
Meshes,” Proc. ACM SIGGRAPH, pp. 409-416, 2001.
72. B. Shneiderman, and C. Plaisant, Designing the User Interface: Strategies for
Effective Human-Computer Interaction, 4th ed., Boston, MA: Addison Wesley,
2004.

71
73. J. Sharman, “How to Render Landscapes,”
http://www.gamedev.net/reference/articles/article678.asp, accessed on October 1,
2005.
74. A. L. Sullivan and I.K. Knight, “A Hybrid Cellular Automata/Semi-Physical
Model of Fire Growth,” Proc. Conf. Complex Systems, pp 64-73, 2004.
75. Y. Suzuki, T. Takayama, I.N. Motoike, and T. Asai, “Striped and Spotted Pattern
Generation on Reaction-diffusion Cellular Automata – Theory and LSI
Implementation,” Int’l J.Unconventional Computing, 2006, in press.
76. Y. Takai, T.Saito, Y.Tomikawa, and N.K.Takai, “A Particle Cluster Deformation
Model by the Probabilistic Cellular Automata,” IEICE Trans. Inf. and Sys.,
vol.J83-A, 2000.
77. Y. Takai, N.K. Takai, and K.J. Nakamori, “Exploration of the Reaction-
Diffusion Textures,” Proc. Int’l Conf. on Modelling and Simulation, 1998.
78. Terrain Engine, http://ohad.visual-i.com/exper/exper.htm, accessed on October 1,
2005.
79. "The Game of Life,” Time, January 21, 1974.
80. T. Toffoli, “Nothing Makes Sense In Computing Except In The Light Of
Evolution,” Int’l. J. Unconventional Computing 1, pp. 1-29, 2005.
81. T. Toffoli, and N. Margolus, Cellular Automata Machines, Cambridge, MA:
MIT Press, 1987.
82. G. Turk, “Generating Textures on Arbitrary Surfaces Using Reaction-Diffusion,”
Proc. ACM SIGGRAPH, pp. 289-298, 1991.
72
83. L. Vepstas, Notes on Artificial Life & Cellular Automata, accessed on October 1,
2005, http://linas.org/plants/observe.html, 1996.
84. J. von Neumann, “The General and Logical Theory of Automata,” Collected
Works, vol. 5, New York: Macmillan, pp. 288-328, 1963.
85. J. von Neumann, The Theory of Self-reproducing Automata, Urbana: Univ. of
Illinois Press, 1966.
86. H. Wang, “Games, Logic, and Computers,” Scientific American (November), pp.
98–106, 1965.
87. H. Wang, “Proving Theorems by Pattern Recognition II,” Bell Systems,
Technical Journal 40, pp. 1–42, 1961.
88. C. Ware, and G. Sweet, “View Direction, Surface Orientation and Texture
Orientation for Perception of Surface Shape,” Proc. Graphics Interface, pp. 97-
106, 2004.
89. C. Ware, E. Neufeld, and L. Bartram, “Visualizing Causal Relations,” Proc.
IEEE Information Visualization, Late Breaking Hot Topics, pp. 39-42, 1999
90. C. Ware, and W. Knight, “Using Visual Texture for Information Display,” ACM
Trans. on Graphics, vol. 14, no. 1, pp. 3-20, 1995.
91. E. W. Weisstein, “Moore Neighborhood,” From MathWorld--A Wolfram Web
Resource. http://mathworld.wolfram.com/MooreNeighborhood.html. Last
accessed on October 1, 2005
73
92. R. White and G. Engelen, “Cellular Automata and Fractal Urban Form: A
Cellular Modelling Approach to the Evolution of Urban Land-Use Patterns,”
Environment and Planning A, vol. 25, no. 8, pp. 1175-1199, 1993.
93. M. Wijaya, and D. Callele, “Semi-Random Terrain Generation,” Poster Abstract,
Graphics Interface, 2005.
94. Wikipedia, “A New Kind of Science,”
http://en.wikipedia.org/wiki/A_New_Kind_of_Science [Last accessed on
October 1, 2005].
95. J.R. Wright and J.C.L. Hsieh, “A Voxel-Based, Forward Projection Algorithm
for Rendering Surface and Volumetric Data,” Proc. 3rd Conf. Visualization, pp.
340–348, 1992.
96. M. Wojtowicz, Cellular Automata Gallery - part II,
http://psoup.math.wisc.edu/mcell/ca_gallery2.html [Last accessed: October 5,
2005]
97. S. Wolfram, A New Kind of Science, Champaign, IL: Wolfram Media, 2002.
98. S. Worley, “A Cellular Texture Basis Function,” Proc. Conf. Computer Graphics
and Interactive Techniques, pp.291-294, 1996.
99. http://www.carleton.ca/ics/courses/cgsc5001/lecture2.html, CGSC 5001 Lecture
2, Cellular Automata [Last accessed on October 10, 2005]
100. K. Zhou, X. Wang, Y. Tong, M. Desbrun, B. Guo, H. Shum, “TextureMontage:
Seamless Texturing of Arbitrary Surfaces From Multiple Images,” Proc. ACM
SIGGRAPH, pp. 1148-1155, 2005.

74
101. K. Zuse, Rechnender Raum, Braunschweig: Friedrich Vieweg & Sohn Verlag,
1969 [English translation: Calculating Space, MIT Technical Translation AZT-
70-164-GEMIT, MIT (Proj. MAC), Cambridge, MA 02139, Feb. 1970.].
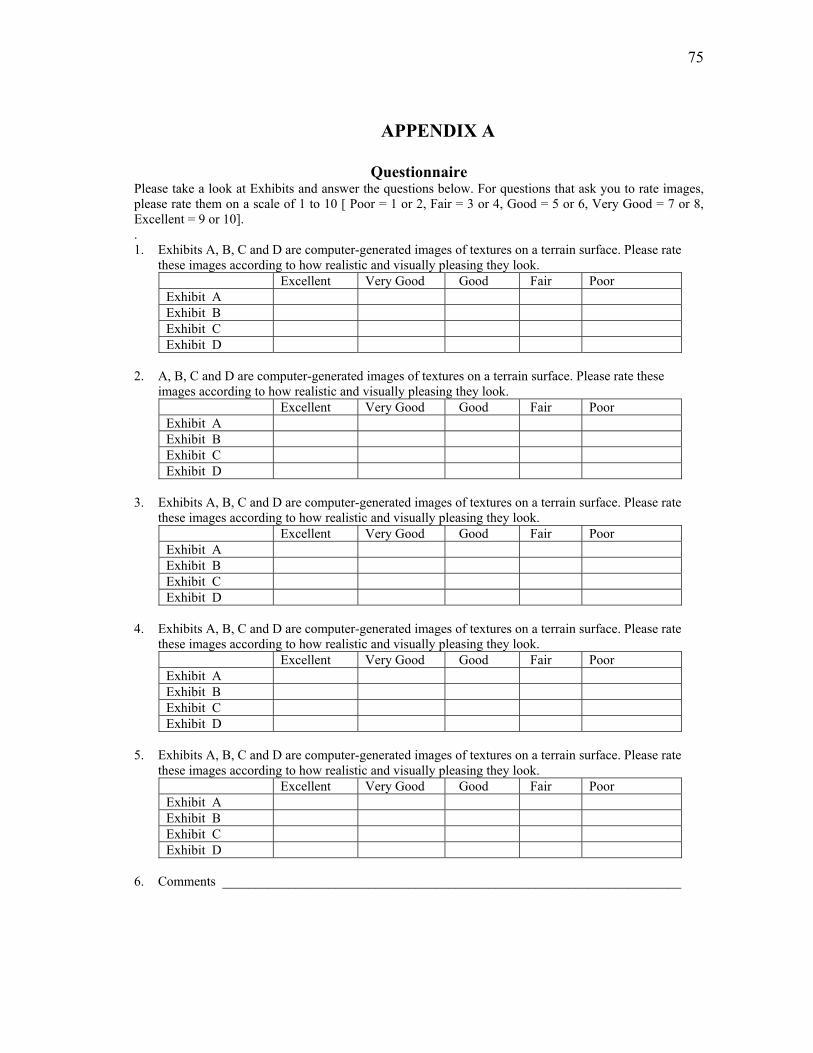
75
APPENDIX A
Questionnaire Please take a look at Exhibits and answer the questions below. For questions that ask you to rate images, please rate them on a scale of 1 to 10 [ Poor = 1 or 2, Fair = 3 or 4, Good = 5 or 6, Very Good = 7 or 8, Excellent = 9 or 10]. . 1. Exhibits A, B, C and D are computer-generated images of textures on a terrain surface. Please rate
these images according to how realistic and visually pleasing they look. Excellent Very Good Good Fair Poor Exhibit A Exhibit B Exhibit C Exhibit D
2. A, B, C and D are computer-generated images of textures on a terrain surface. Please rate these
images according to how realistic and visually pleasing they look. Excellent Very Good Good Fair Poor Exhibit A Exhibit B Exhibit C Exhibit D
3. Exhibits A, B, C and D are computer-generated images of textures on a terrain surface. Please rate
these images according to how realistic and visually pleasing they look. Excellent Very Good Good Fair Poor Exhibit A Exhibit B Exhibit C Exhibit D
4. Exhibits A, B, C and D are computer-generated images of textures on a terrain surface. Please rate
these images according to how realistic and visually pleasing they look. Excellent Very Good Good Fair Poor Exhibit A Exhibit B Exhibit C Exhibit D
5. Exhibits A, B, C and D are computer-generated images of textures on a terrain surface. Please rate
these images according to how realistic and visually pleasing they look. Excellent Very Good Good Fair Poor Exhibit A Exhibit B Exhibit C Exhibit D
6. Comments _____________________________________________________________________
76
VITA
Name : Swapnil Sinvhal
Email: [email protected]
Address: c/o Dr. H. Sinvhal
Department of Earth Sciences
Indian Institute of Technology, Roorkee
Roorkee, India 247 667
Education: 2005, M.S. Computer Science, Texas A&M University
1999, B. Arch., Indian Institute of Technology, Roorkee
Experience: 2004 -2005, Graduate Assistant (Research), Texas A&M University
1999-2003, Software Engineer, Perot Systems