Embed Size (px)
Citation preview
Available online at www.sciencedirect.com
www.elsevier.com/locate/actamat
Acta Materialia 56 (2008) 4715–4723
Mapping single-crystal dendritic microstructure and defectsin nickel-base superalloys with synchrotron radiation
Naji S. Husseini a,*, Divine P. Kumah a, Jian Z. Yi b, Christopher J. Torbet b, Dohn A. Arms c,Eric M. Dufresne c, Tresa M. Pollock b, J. Wayne Jones b, Roy Clarke a
a Applied Physics Program, University of Michigan, Ann Arbor, MI 48109, USAb Department of Materials Science and Engineering, University of Michigan, Ann Arbor, MI 48109, USA
c Advanced Photon Source, Argonne National Laboratory, Argonne, IL 60439, USA
Received 15 January 2008; received in revised form 3 April 2008; accepted 20 May 2008Available online 9 July 2008
Abstract
Solidification of single-crystal nickel-base superalloys introduces large-scale segregation of constituent elements and defects such asdislocations and mosaicity. By exploiting the energy tunability and interference capabilities of high-brilliance X-ray radiation, key struc-tural features of the dendritic single crystals were mapped over large areas. Interference and diffraction of synchrotron X-rays revealedsignificant misorientations between individual dendrites in the as-solidified state. For the first time this mosaic structure was quantifiedfor an array of dendrites and correlated with the density of ‘‘grown-in” dislocations whose density ranged from 107 to 108 cm�2. Absorp-tion contrast permitted simultaneous mapping of the distribution of refractory metal additives (e.g. rhenium and tungsten), which seg-regated preferentially to the dendrite cores with a linear composition gradient toward the interdendritic regions. The results demonstratethat synchrotron X-ray imaging is promising for in situ studies of single-crystal structure and defects in nickel-base superalloys.� 2008 Acta Materialia Inc. Published by Elsevier Ltd. All rights reserved.
Keywords: Superalloy; X-ray radiography; Microstructure; Dislocations; Lattice defects
1. Introduction
Operating conditions in air- and land-based turbineengines impose extremely demanding conditions on theengineering materials in critical components such as bladesand vanes. These parts, which are typically composed ofsingle-crystal nickel-base superalloys, operate under highstresses and near their melting point. Ni-base superalloysare typically composed of 50–60% Ni with small amountsof carbide-forming elements and other refractory metals[1]. These superalloys exhibit exceptional mechanicalstrength, toughness, and resistance to corrosion and oxida-tion at high temperatures, making them ideally suited forcritical applications in severe environments.
1359-6454/$34.00 � 2008 Acta Materialia Inc. Published by Elsevier Ltd. All
doi:10.1016/j.actamat.2008.05.041
* Corresponding author. Tel.: +1 734 764 7446; fax: +1 734 764 2193.E-mail address: [email protected] (N.S. Husseini).
A key factor in the extreme durability of Ni-base super-alloys is the presence of a high volume fraction (>50%) of acuboidal, intermetallic c0 phase (i.e., Ni3Al), which is highlyresistant to creep and fatigue crack propagation [1–3]. Thesubmicron-scale c0 phase is coherent with the c-Ni matrix(Fig. 1a). At a much larger length scale, the microstructureis characterized by h0 01i-oriented dendrites that grow par-allel to the solidification direction [4,5] with core spacingson the order of 200–600 lm (Fig. 1b).
High-temperature mechanical properties are furtherenhanced by moderate concentrations (5–15%) of refrac-tory metals (e.g., Mo, Re, Ta, W), but these additionscan create problems during materials processing [6,7].The thermodynamically driven segregation of the heavyelements can cause convective instabilities and subsequentbreakdown of the single-crystal solidification front [5,7–10]. The residual segregation is difficult to eliminate withannealing and may degrade mechanical properties; thus,
rights reserved.
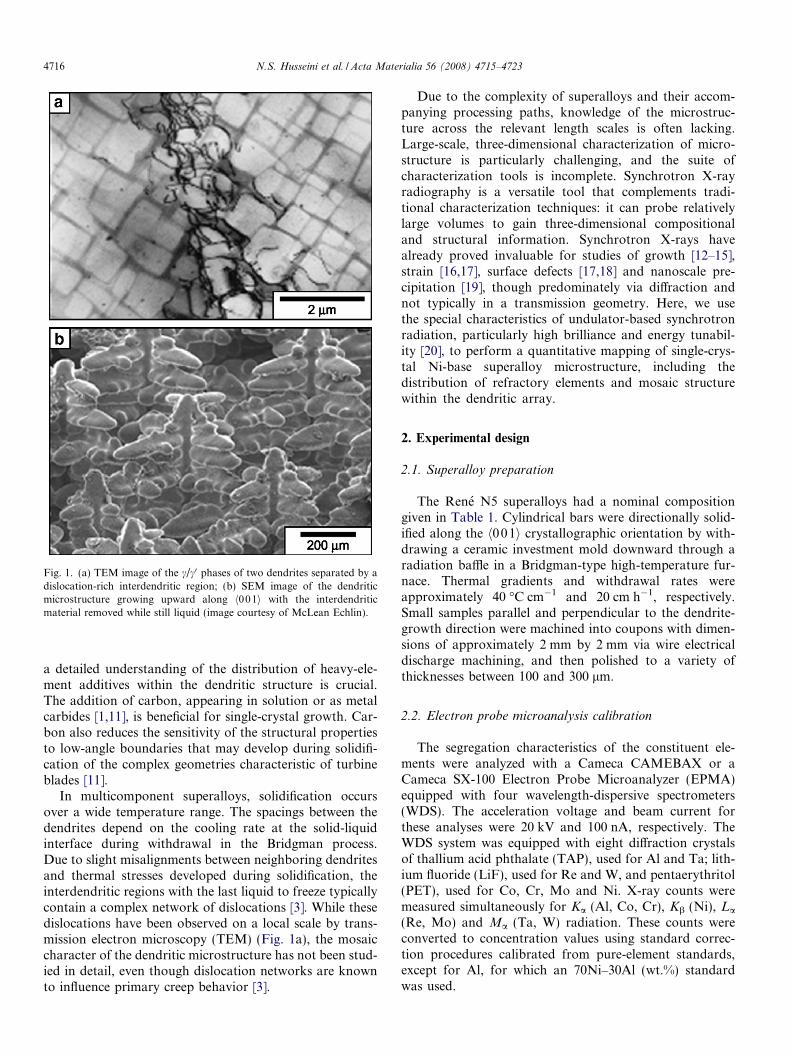
Fig. 1. (a) TEM image of the c/c0 phases of two dendrites separated by adislocation-rich interdendritic region; (b) SEM image of the dendriticmicrostructure growing upward along h001i with the interdendriticmaterial removed while still liquid (image courtesy of McLean Echlin).
4716 N.S. Husseini et al. / Acta Materialia 56 (2008) 4715–4723
a detailed understanding of the distribution of heavy-ele-ment additives within the dendritic structure is crucial.The addition of carbon, appearing in solution or as metalcarbides [1,11], is beneficial for single-crystal growth. Car-bon also reduces the sensitivity of the structural propertiesto low-angle boundaries that may develop during solidifi-cation of the complex geometries characteristic of turbineblades [11].
In multicomponent superalloys, solidification occursover a wide temperature range. The spacings between thedendrites depend on the cooling rate at the solid-liquidinterface during withdrawal in the Bridgman process.Due to slight misalignments between neighboring dendritesand thermal stresses developed during solidification, theinterdendritic regions with the last liquid to freeze typicallycontain a complex network of dislocations [3]. While thesedislocations have been observed on a local scale by trans-mission electron microscopy (TEM) (Fig. 1a), the mosaiccharacter of the dendritic microstructure has not been stud-ied in detail, even though dislocation networks are knownto influence primary creep behavior [3].
Due to the complexity of superalloys and their accom-panying processing paths, knowledge of the microstruc-ture across the relevant length scales is often lacking.Large-scale, three-dimensional characterization of micro-structure is particularly challenging, and the suite ofcharacterization tools is incomplete. Synchrotron X-rayradiography is a versatile tool that complements tradi-tional characterization techniques: it can probe relativelylarge volumes to gain three-dimensional compositionaland structural information. Synchrotron X-rays havealready proved invaluable for studies of growth [12–15],strain [16,17], surface defects [17,18] and nanoscale pre-cipitation [19], though predominately via diffraction andnot typically in a transmission geometry. Here, we usethe special characteristics of undulator-based synchrotronradiation, particularly high brilliance and energy tunabil-ity [20], to perform a quantitative mapping of single-crys-tal Ni-base superalloy microstructure, including thedistribution of refractory elements and mosaic structurewithin the dendritic array.
2. Experimental design
2.1. Superalloy preparation
The Rene N5 superalloys had a nominal compositiongiven in Table 1. Cylindrical bars were directionally solid-ified along the h001i crystallographic orientation by with-drawing a ceramic investment mold downward through aradiation baffle in a Bridgman-type high-temperature fur-nace. Thermal gradients and withdrawal rates wereapproximately 40 �C cm�1 and 20 cm h�1, respectively.Small samples parallel and perpendicular to the dendrite-growth direction were machined into coupons with dimen-sions of approximately 2 mm by 2 mm via wire electricaldischarge machining, and then polished to a variety ofthicknesses between 100 and 300 lm.
2.2. Electron probe microanalysis calibration
The segregation characteristics of the constituent ele-ments were analyzed with a Cameca CAMEBAX or aCameca SX-100 Electron Probe Microanalyzer (EPMA)equipped with four wavelength-dispersive spectrometers(WDS). The acceleration voltage and beam current forthese analyses were 20 kV and 100 nA, respectively. TheWDS system was equipped with eight diffraction crystalsof thallium acid phthalate (TAP), used for Al and Ta; lith-ium fluoride (LiF), used for Re and W, and pentaerythritol(PET), used for Co, Cr, Mo and Ni. X-ray counts weremeasured simultaneously for Ka (Al, Co, Cr), Kb (Ni), La
(Re, Mo) and Ma (Ta, W) radiation. These counts wereconverted to concentration values using standard correc-tion procedures calibrated from pure-element standards,except for Al, for which an 70Ni–30Al (wt.%) standardwas used.
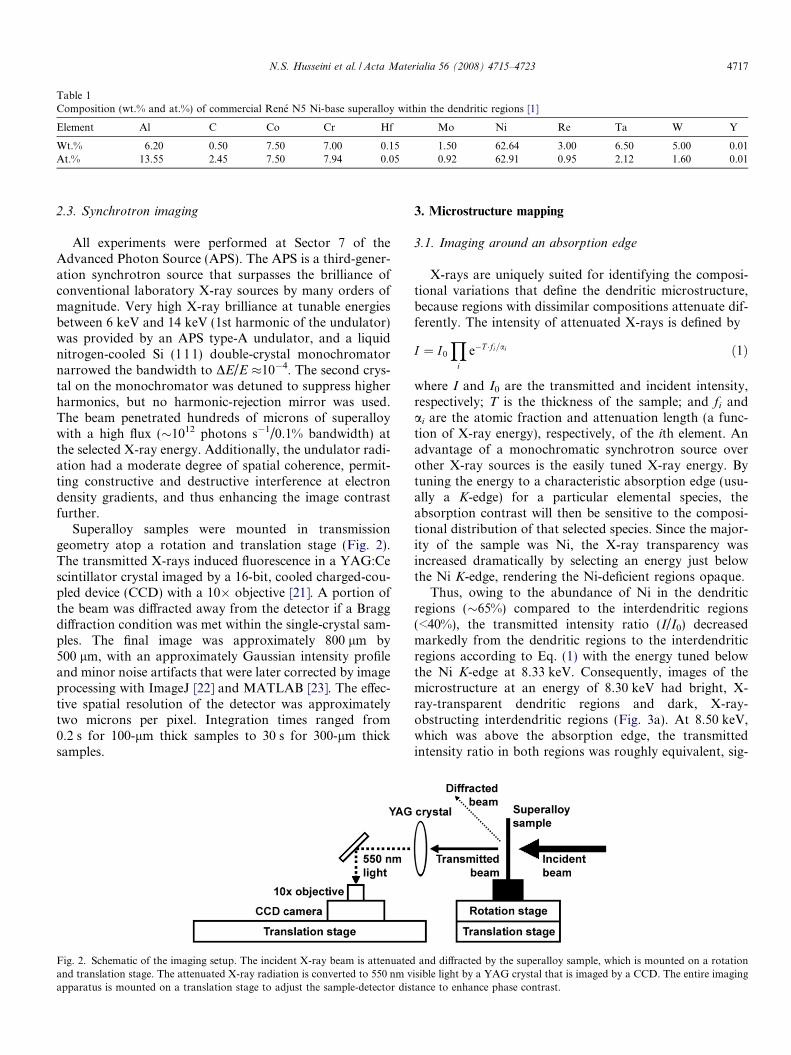
Table 1Composition (wt.% and at.%) of commercial Rene N5 Ni-base superalloy within the dendritic regions [1]
Element Al C Co Cr Hf Mo Ni Re Ta W Y
Wt.% 6.20 0.50 7.50 7.00 0.15 1.50 62.64 3.00 6.50 5.00 0.01At.% 13.55 2.45 7.50 7.94 0.05 0.92 62.91 0.95 2.12 1.60 0.01
N.S. Husseini et al. / Acta Materialia 56 (2008) 4715–4723 4717
2.3. Synchrotron imaging
All experiments were performed at Sector 7 of theAdvanced Photon Source (APS). The APS is a third-gener-ation synchrotron source that surpasses the brilliance ofconventional laboratory X-ray sources by many orders ofmagnitude. Very high X-ray brilliance at tunable energiesbetween 6 keV and 14 keV (1st harmonic of the undulator)was provided by an APS type-A undulator, and a liquidnitrogen-cooled Si (111) double-crystal monochromatornarrowed the bandwidth to DE/E �10�4. The second crys-tal on the monochromator was detuned to suppress higherharmonics, but no harmonic-rejection mirror was used.The beam penetrated hundreds of microns of superalloywith a high flux (�1012 photons s�1/0.1% bandwidth) atthe selected X-ray energy. Additionally, the undulator radi-ation had a moderate degree of spatial coherence, permit-ting constructive and destructive interference at electrondensity gradients, and thus enhancing the image contrastfurther.
Superalloy samples were mounted in transmissiongeometry atop a rotation and translation stage (Fig. 2).The transmitted X-rays induced fluorescence in a YAG:Cescintillator crystal imaged by a 16-bit, cooled charged-cou-pled device (CCD) with a 10� objective [21]. A portion ofthe beam was diffracted away from the detector if a Braggdiffraction condition was met within the single-crystal sam-ples. The final image was approximately 800 lm by500 lm, with an approximately Gaussian intensity profileand minor noise artifacts that were later corrected by imageprocessing with ImageJ [22] and MATLAB [23]. The effec-tive spatial resolution of the detector was approximatelytwo microns per pixel. Integration times ranged from0.2 s for 100-lm thick samples to 30 s for 300-lm thicksamples.
Fig. 2. Schematic of the imaging setup. The incident X-ray beam is attenuatedand translation stage. The attenuated X-ray radiation is converted to 550 nm vapparatus is mounted on a translation stage to adjust the sample-detector dis
3. Microstructure mapping
3.1. Imaging around an absorption edge
X-rays are uniquely suited for identifying the composi-tional variations that define the dendritic microstructure,because regions with dissimilar compositions attenuate dif-ferently. The intensity of attenuated X-rays is defined by
I ¼ I0
Yi
e�T �fi=ai ð1Þ
where I and I0 are the transmitted and incident intensity,respectively; T is the thickness of the sample; and fi andai are the atomic fraction and attenuation length (a func-tion of X-ray energy), respectively, of the ith element. Anadvantage of a monochromatic synchrotron source overother X-ray sources is the easily tuned X-ray energy. Bytuning the energy to a characteristic absorption edge (usu-ally a K-edge) for a particular elemental species, theabsorption contrast will then be sensitive to the composi-tional distribution of that selected species. Since the major-ity of the sample was Ni, the X-ray transparency wasincreased dramatically by selecting an energy just belowthe Ni K-edge, rendering the Ni-deficient regions opaque.
Thus, owing to the abundance of Ni in the dendriticregions (�65%) compared to the interdendritic regions(<40%), the transmitted intensity ratio (I/I0) decreasedmarkedly from the dendritic regions to the interdendriticregions according to Eq. (1) with the energy tuned belowthe Ni K-edge at 8.33 keV. Consequently, images of themicrostructure at an energy of 8.30 keV had bright, X-ray-transparent dendritic regions and dark, X-ray-obstructing interdendritic regions (Fig. 3a). At 8.50 keV,which was above the absorption edge, the transmittedintensity ratio in both regions was roughly equivalent, sig-
and diffracted by the superalloy sample, which is mounted on a rotationisible light by a YAG crystal that is imaged by a CCD. The entire imagingtance to enhance phase contrast.
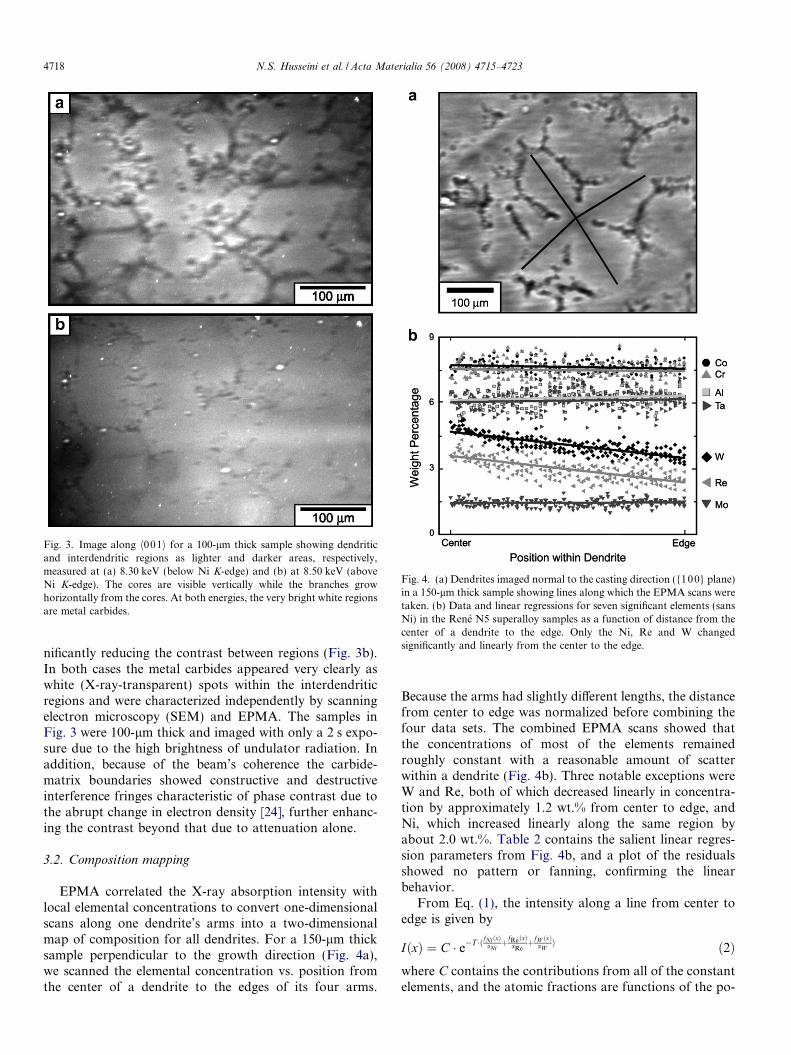
Fig. 3. Image along h001i for a 100-lm thick sample showing dendriticand interdendritic regions as lighter and darker areas, respectively,measured at (a) 8.30 keV (below Ni K-edge) and (b) at 8.50 keV (aboveNi K-edge). The cores are visible vertically while the branches growhorizontally from the cores. At both energies, the very bright white regionsare metal carbides.
Fig. 4. (a) Dendrites imaged normal to the casting direction ({100} plane)in a 150-lm thick sample showing lines along which the EPMA scans weretaken. (b) Data and linear regressions for seven significant elements (sansNi) in the Rene N5 superalloy samples as a function of distance from thecenter of a dendrite to the edge. Only the Ni, Re and W changedsignificantly and linearly from the center to the edge.
4718 N.S. Husseini et al. / Acta Materialia 56 (2008) 4715–4723
nificantly reducing the contrast between regions (Fig. 3b).In both cases the metal carbides appeared very clearly aswhite (X-ray-transparent) spots within the interdendriticregions and were characterized independently by scanningelectron microscopy (SEM) and EPMA. The samples inFig. 3 were 100-lm thick and imaged with only a 2 s expo-sure due to the high brightness of undulator radiation. Inaddition, because of the beam’s coherence the carbide-matrix boundaries showed constructive and destructiveinterference fringes characteristic of phase contrast due tothe abrupt change in electron density [24], further enhanc-ing the contrast beyond that due to attenuation alone.
3.2. Composition mapping
EPMA correlated the X-ray absorption intensity withlocal elemental concentrations to convert one-dimensionalscans along one dendrite’s arms into a two-dimensionalmap of composition for all dendrites. For a 150-lm thicksample perpendicular to the growth direction (Fig. 4a),we scanned the elemental concentration vs. position fromthe center of a dendrite to the edges of its four arms.
Because the arms had slightly different lengths, the distancefrom center to edge was normalized before combining thefour data sets. The combined EPMA scans showed thatthe concentrations of most of the elements remainedroughly constant with a reasonable amount of scatterwithin a dendrite (Fig. 4b). Three notable exceptions wereW and Re, both of which decreased linearly in concentra-tion by approximately 1.2 wt.% from center to edge, andNi, which increased linearly along the same region byabout 2.0 wt.%. Table 2 contains the salient linear regres-sion parameters from Fig. 4b, and a plot of the residualsshowed no pattern or fanning, confirming the linearbehavior.
From Eq. (1), the intensity along a line from center toedge is given by
IðxÞ ¼ C � e�T �ðfNiðxÞaNiþfReðxÞ
aReþfW ðxÞ
aWÞ ð2Þ
where C contains the contributions from all of the constantelements, and the atomic fractions are functions of the po-
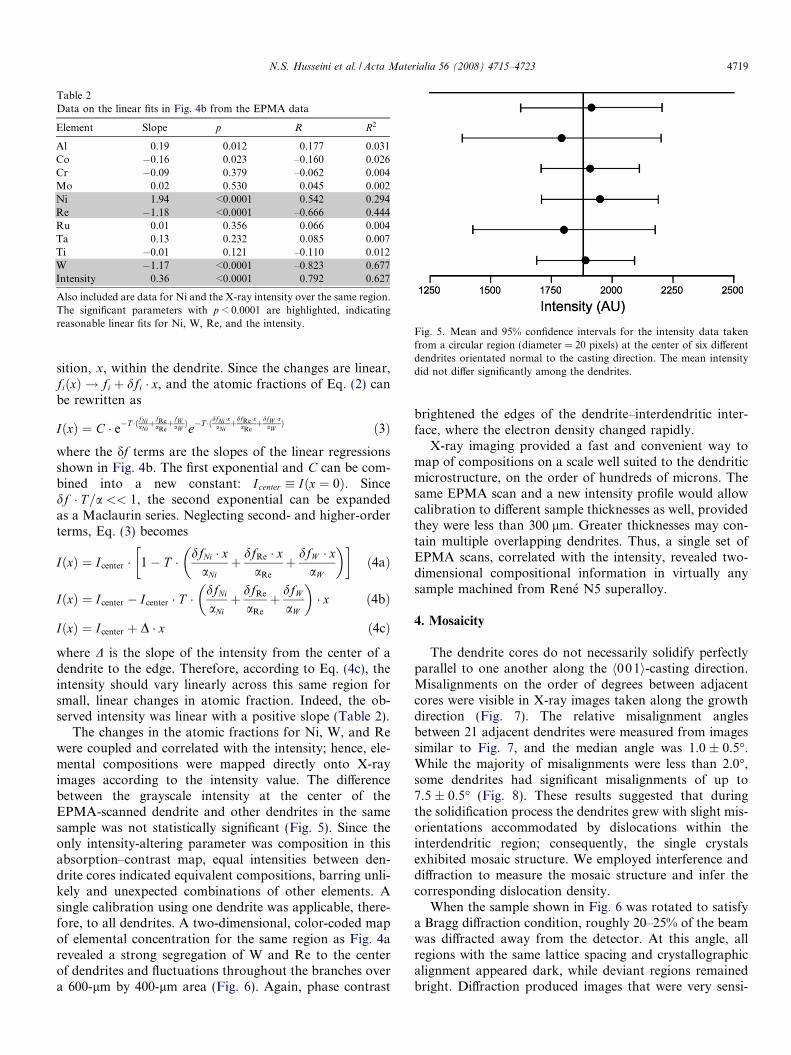
Fig. 5. Mean and 95% confidence intervals for the intensity data takenfrom a circular region (diameter = 20 pixels) at the center of six differentdendrites orientated normal to the casting direction. The mean intensitydid not differ significantly among the dendrites.
Table 2Data on the linear fits in Fig. 4b from the EPMA data
Also included are data for Ni and the X-ray intensity over the same region.The significant parameters with p < 0.0001 are highlighted, indicatingreasonable linear fits for Ni, W, Re, and the intensity.
N.S. Husseini et al. / Acta Materialia 56 (2008) 4715–4723 4719
sition, x, within the dendrite. Since the changes are linear,fiðxÞ ! fi þ dfi � x, and the atomic fractions of Eq. (2) canbe rewritten as
IðxÞ ¼ C � e�T �ðfNiaNiþfRe
aReþfW
aWÞe�T �ðdfNi �x
aNiþdfRe �x
aReþdfW �x
aWÞ ð3Þ
where the df terms are the slopes of the linear regressionsshown in Fig. 4b. The first exponential and C can be com-bined into a new constant: Icenter � Iðx ¼ 0Þ. Sincedf � T =a << 1, the second exponential can be expandedas a Maclaurin series. Neglecting second- and higher-orderterms, Eq. (3) becomes
IðxÞ ¼ Icenter � 1� T � dfNi � xaNi
þ dfRe � xaRe
þ dfW � xaW
� �� �ð4aÞ
IðxÞ ¼ Icenter � Icenter � T �dfNi
aNiþ dfRe
aRe
þ dfW
aW
� �� x ð4bÞ
IðxÞ ¼ Icenter þ D � x ð4cÞ
where D is the slope of the intensity from the center of adendrite to the edge. Therefore, according to Eq. (4c), theintensity should vary linearly across this same region forsmall, linear changes in atomic fraction. Indeed, the ob-served intensity was linear with a positive slope (Table 2).
The changes in the atomic fractions for Ni, W, and Rewere coupled and correlated with the intensity; hence, ele-mental compositions were mapped directly onto X-rayimages according to the intensity value. The differencebetween the grayscale intensity at the center of theEPMA-scanned dendrite and other dendrites in the samesample was not statistically significant (Fig. 5). Since theonly intensity-altering parameter was composition in thisabsorption–contrast map, equal intensities between den-drite cores indicated equivalent compositions, barring unli-kely and unexpected combinations of other elements. Asingle calibration using one dendrite was applicable, there-fore, to all dendrites. A two-dimensional, color-coded mapof elemental concentration for the same region as Fig. 4arevealed a strong segregation of W and Re to the centerof dendrites and fluctuations throughout the branches overa 600-lm by 400-lm area (Fig. 6). Again, phase contrast
brightened the edges of the dendrite–interdendritic inter-face, where the electron density changed rapidly.
X-ray imaging provided a fast and convenient way tomap of compositions on a scale well suited to the dendriticmicrostructure, on the order of hundreds of microns. Thesame EPMA scan and a new intensity profile would allowcalibration to different sample thicknesses as well, providedthey were less than 300 lm. Greater thicknesses may con-tain multiple overlapping dendrites. Thus, a single set ofEPMA scans, correlated with the intensity, revealed two-dimensional compositional information in virtually anysample machined from Rene N5 superalloy.
4. Mosaicity
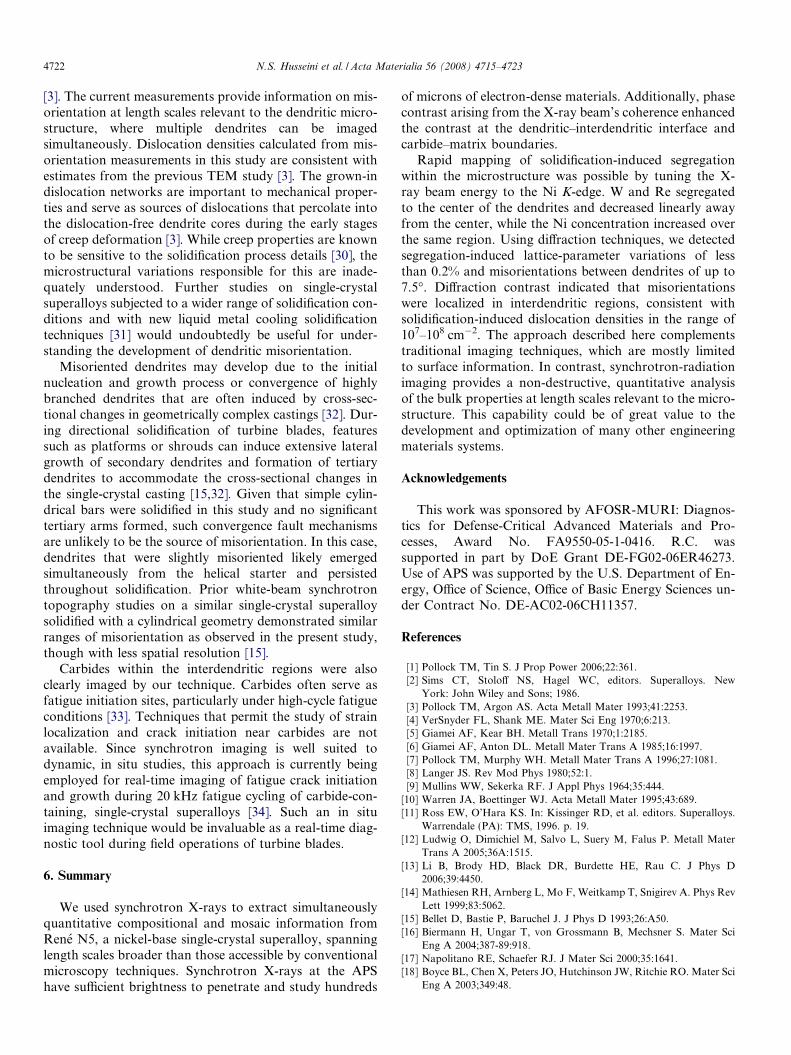
The dendrite cores do not necessarily solidify perfectlyparallel to one another along the h001i-casting direction.Misalignments on the order of degrees between adjacentcores were visible in X-ray images taken along the growthdirection (Fig. 7). The relative misalignment anglesbetween 21 adjacent dendrites were measured from imagessimilar to Fig. 7, and the median angle was 1.0 ± 0.5�.While the majority of misalignments were less than 2.0�,some dendrites had significant misalignments of up to7.5 ± 0.5� (Fig. 8). These results suggested that duringthe solidification process the dendrites grew with slight mis-orientations accommodated by dislocations within theinterdendritic region; consequently, the single crystalsexhibited mosaic structure. We employed interference anddiffraction to measure the mosaic structure and infer thecorresponding dislocation density.
When the sample shown in Fig. 6 was rotated to satisfya Bragg diffraction condition, roughly 20–25% of the beamwas diffracted away from the detector. At this angle, allregions with the same lattice spacing and crystallographicalignment appeared dark, while deviant regions remainedbright. Diffraction produced images that were very sensi-
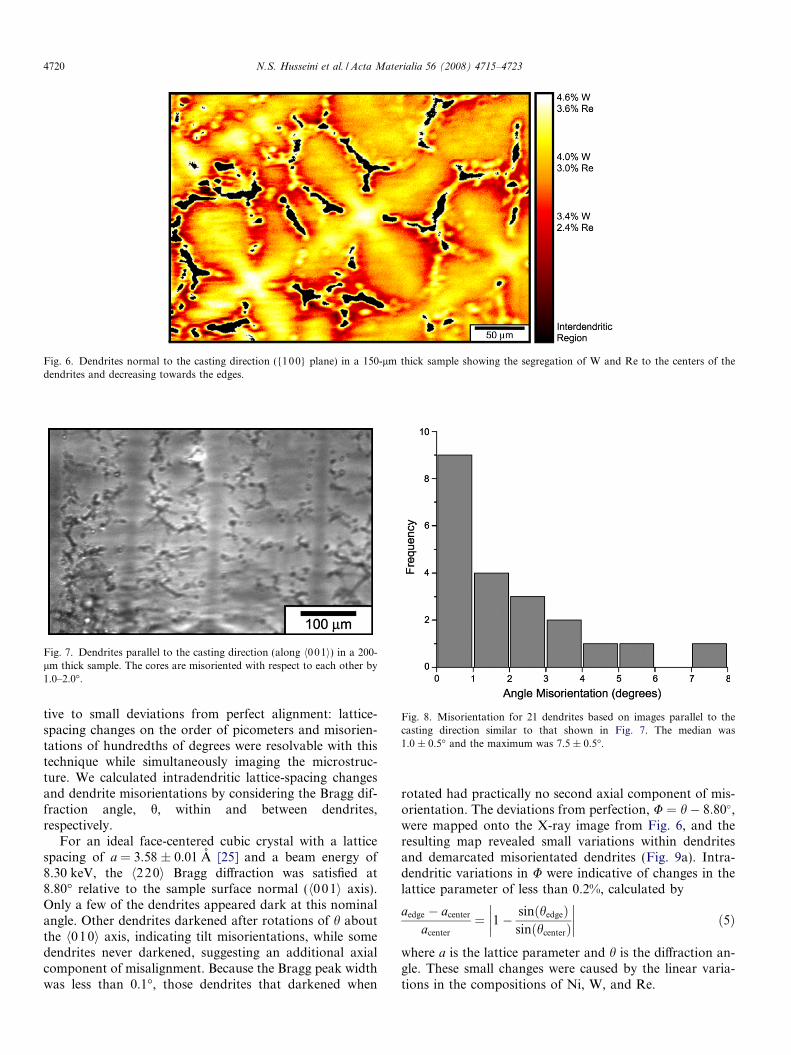
Fig. 6. Dendrites normal to the casting direction ({100} plane) in a 150-lm thick sample showing the segregation of W and Re to the centers of thedendrites and decreasing towards the edges.
Fig. 7. Dendrites parallel to the casting direction (along h001i) in a 200-lm thick sample. The cores are misoriented with respect to each other by1.0–2.0�.
Fig. 8. Misorientation for 21 dendrites based on images parallel to thecasting direction similar to that shown in Fig. 7. The median was1.0 ± 0.5� and the maximum was 7.5 ± 0.5�.
4720 N.S. Husseini et al. / Acta Materialia 56 (2008) 4715–4723
tive to small deviations from perfect alignment: lattice-spacing changes on the order of picometers and misorien-tations of hundredths of degrees were resolvable with thistechnique while simultaneously imaging the microstruc-ture. We calculated intradendritic lattice-spacing changesand dendrite misorientations by considering the Bragg dif-fraction angle, h, within and between dendrites,respectively.
For an ideal face-centered cubic crystal with a latticespacing of a = 3.58 ± 0.01 A [25] and a beam energy of8.30 keV, the h220i Bragg diffraction was satisfied at8.80� relative to the sample surface normal (h001i axis).Only a few of the dendrites appeared dark at this nominalangle. Other dendrites darkened after rotations of h aboutthe h010i axis, indicating tilt misorientations, while somedendrites never darkened, suggesting an additional axialcomponent of misalignment. Because the Bragg peak widthwas less than 0.1�, those dendrites that darkened when
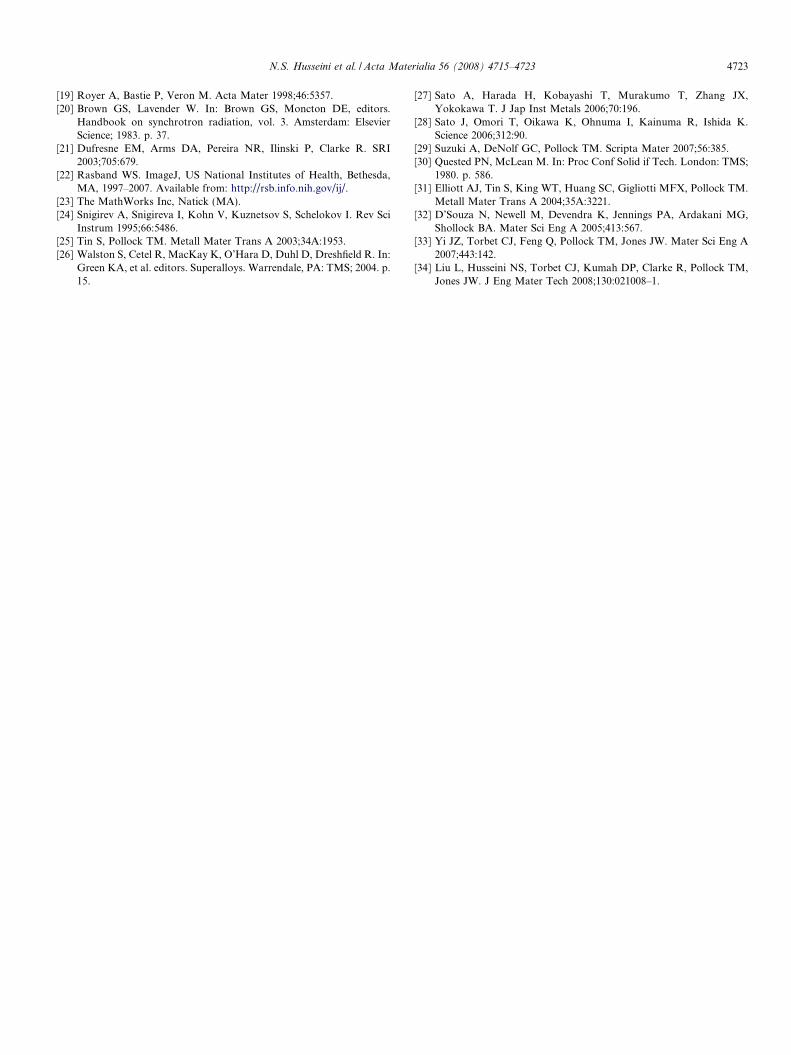
rotated had practically no second axial component of mis-orientation. The deviations from perfection, U ¼ h� 8:80�,were mapped onto the X-ray image from Fig. 6, and theresulting map revealed small variations within dendritesand demarcated misorientated dendrites (Fig. 9a). Intra-dendritic variations in U were indicative of changes in thelattice parameter of less than 0.2%, calculated by
aedge � acenter
acenter
¼ 1� sinðhedgeÞsinðhcenterÞ
�������� ð5Þ
where a is the lattice parameter and h is the diffraction an-gle. These small changes were caused by the linear varia-tions in the compositions of Ni, W, and Re.
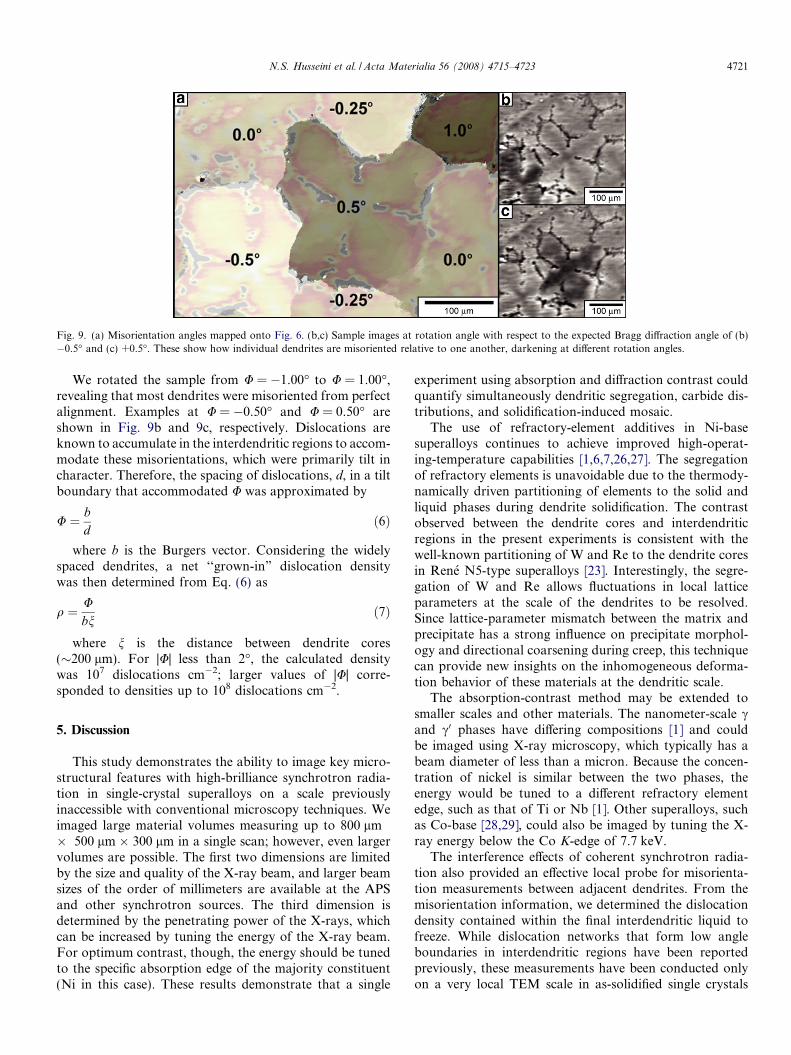
Fig. 9. (a) Misorientation angles mapped onto Fig. 6. (b,c) Sample images at rotation angle with respect to the expected Bragg diffraction angle of (b)�0.5� and (c) +0.5�. These show how individual dendrites are misoriented relative to one another, darkening at different rotation angles.
N.S. Husseini et al. / Acta Materialia 56 (2008) 4715–4723 4721
We rotated the sample from U = �1.00� to U = 1.00�,revealing that most dendrites were misoriented from perfectalignment. Examples at U = �0.50� and U = 0.50� areshown in Fig. 9b and 9c, respectively. Dislocations areknown to accumulate in the interdendritic regions to accom-modate these misorientations, which were primarily tilt incharacter. Therefore, the spacing of dislocations, d, in a tiltboundary that accommodated U was approximated by
U ¼ bd
ð6Þ
where b is the Burgers vector. Considering the widelyspaced dendrites, a net ‘‘grown-in” dislocation densitywas then determined from Eq. (6) as
q ¼ Ubn
ð7Þ
where n is the distance between dendrite cores(�200 lm). For |U| less than 2�, the calculated densitywas 107 dislocations cm�2; larger values of |U| corre-sponded to densities up to 108 dislocations cm�2.
5. Discussion
This study demonstrates the ability to image key micro-structural features with high-brilliance synchrotron radia-tion in single-crystal superalloys on a scale previouslyinaccessible with conventional microscopy techniques. Weimaged large material volumes measuring up to 800 lm� 500 lm � 300 lm in a single scan; however, even largervolumes are possible. The first two dimensions are limitedby the size and quality of the X-ray beam, and larger beamsizes of the order of millimeters are available at the APSand other synchrotron sources. The third dimension isdetermined by the penetrating power of the X-rays, whichcan be increased by tuning the energy of the X-ray beam.For optimum contrast, though, the energy should be tunedto the specific absorption edge of the majority constituent(Ni in this case). These results demonstrate that a single
experiment using absorption and diffraction contrast couldquantify simultaneously dendritic segregation, carbide dis-tributions, and solidification-induced mosaic.
The use of refractory-element additives in Ni-basesuperalloys continues to achieve improved high-operat-ing-temperature capabilities [1,6,7,26,27]. The segregationof refractory elements is unavoidable due to the thermody-namically driven partitioning of elements to the solid andliquid phases during dendrite solidification. The contrastobserved between the dendrite cores and interdendriticregions in the present experiments is consistent with thewell-known partitioning of W and Re to the dendrite coresin Rene N5-type superalloys [23]. Interestingly, the segre-gation of W and Re allows fluctuations in local latticeparameters at the scale of the dendrites to be resolved.Since lattice-parameter mismatch between the matrix andprecipitate has a strong influence on precipitate morphol-ogy and directional coarsening during creep, this techniquecan provide new insights on the inhomogeneous deforma-tion behavior of these materials at the dendritic scale.
The absorption-contrast method may be extended tosmaller scales and other materials. The nanometer-scale cand c0 phases have differing compositions [1] and couldbe imaged using X-ray microscopy, which typically has abeam diameter of less than a micron. Because the concen-tration of nickel is similar between the two phases, theenergy would be tuned to a different refractory elementedge, such as that of Ti or Nb [1]. Other superalloys, suchas Co-base [28,29], could also be imaged by tuning the X-ray energy below the Co K-edge of 7.7 keV.
The interference effects of coherent synchrotron radia-tion also provided an effective local probe for misorienta-tion measurements between adjacent dendrites. From themisorientation information, we determined the dislocationdensity contained within the final interdendritic liquid tofreeze. While dislocation networks that form low angleboundaries in interdendritic regions have been reportedpreviously, these measurements have been conducted onlyon a very local TEM scale in as-solidified single crystals
4722 N.S. Husseini et al. / Acta Materialia 56 (2008) 4715–4723
[3]. The current measurements provide information on mis-orientation at length scales relevant to the dendritic micro-structure, where multiple dendrites can be imagedsimultaneously. Dislocation densities calculated from mis-orientation measurements in this study are consistent withestimates from the previous TEM study [3]. The grown-indislocation networks are important to mechanical proper-ties and serve as sources of dislocations that percolate intothe dislocation-free dendrite cores during the early stagesof creep deformation [3]. While creep properties are knownto be sensitive to the solidification process details [30], themicrostructural variations responsible for this are inade-quately understood. Further studies on single-crystalsuperalloys subjected to a wider range of solidification con-ditions and with new liquid metal cooling solidificationtechniques [31] would undoubtedly be useful for under-standing the development of dendritic misorientation.
Misoriented dendrites may develop due to the initialnucleation and growth process or convergence of highlybranched dendrites that are often induced by cross-sec-tional changes in geometrically complex castings [32]. Dur-ing directional solidification of turbine blades, featuressuch as platforms or shrouds can induce extensive lateralgrowth of secondary dendrites and formation of tertiarydendrites to accommodate the cross-sectional changes inthe single-crystal casting [15,32]. Given that simple cylin-drical bars were solidified in this study and no significanttertiary arms formed, such convergence fault mechanismsare unlikely to be the source of misorientation. In this case,dendrites that were slightly misoriented likely emergedsimultaneously from the helical starter and persistedthroughout solidification. Prior white-beam synchrotrontopography studies on a similar single-crystal superalloysolidified with a cylindrical geometry demonstrated similarranges of misorientation as observed in the present study,though with less spatial resolution [15].
Carbides within the interdendritic regions were alsoclearly imaged by our technique. Carbides often serve asfatigue initiation sites, particularly under high-cycle fatigueconditions [33]. Techniques that permit the study of strainlocalization and crack initiation near carbides are notavailable. Since synchrotron imaging is well suited todynamic, in situ studies, this approach is currently beingemployed for real-time imaging of fatigue crack initiationand growth during 20 kHz fatigue cycling of carbide-con-taining, single-crystal superalloys [34]. Such an in situimaging technique would be invaluable as a real-time diag-nostic tool during field operations of turbine blades.
6. Summary
We used synchrotron X-rays to extract simultaneouslyquantitative compositional and mosaic information fromRene N5, a nickel-base single-crystal superalloy, spanninglength scales broader than those accessible by conventionalmicroscopy techniques. Synchrotron X-rays at the APShave sufficient brightness to penetrate and study hundreds
of microns of electron-dense materials. Additionally, phasecontrast arising from the X-ray beam’s coherence enhancedthe contrast at the dendritic–interdendritic interface andcarbide–matrix boundaries.
Rapid mapping of solidification-induced segregationwithin the microstructure was possible by tuning the X-ray beam energy to the Ni K-edge. W and Re segregatedto the center of the dendrites and decreased linearly awayfrom the center, while the Ni concentration increased overthe same region. Using diffraction techniques, we detectedsegregation-induced lattice-parameter variations of lessthan 0.2% and misorientations between dendrites of up to7.5�. Diffraction contrast indicated that misorientationswere localized in interdendritic regions, consistent withsolidification-induced dislocation densities in the range of107–108 cm�2. The approach described here complementstraditional imaging techniques, which are mostly limitedto surface information. In contrast, synchrotron-radiationimaging provides a non-destructive, quantitative analysisof the bulk properties at length scales relevant to the micro-structure. This capability could be of great value to thedevelopment and optimization of many other engineeringmaterials systems.
Acknowledgements
This work was sponsored by AFOSR-MURI: Diagnos-tics for Defense-Critical Advanced Materials and Pro-cesses, Award No. FA9550-05-1-0416. R.C. wassupported in part by DoE Grant DE-FG02-06ER46273.Use of APS was supported by the U.S. Department of En-ergy, Office of Science, Office of Basic Energy Sciences un-der Contract No. DE-AC02-06CH11357.
References
[1] Pollock TM, Tin S. J Prop Power 2006;22:361.[2] Sims CT, Stoloff NS, Hagel WC, editors. Superalloys. New
York: John Wiley and Sons; 1986.[3] Pollock TM, Argon AS. Acta Metall Mater 1993;41:2253.[4] VerSnyder FL, Shank ME. Mater Sci Eng 1970;6:213.[5] Giamei AF, Kear BH. Metall Trans 1970;1:2185.[6] Giamei AF, Anton DL. Metall Mater Trans A 1985;16:1997.[7] Pollock TM, Murphy WH. Metall Mater Trans A 1996;27:1081.[8] Langer JS. Rev Mod Phys 1980;52:1.[9] Mullins WW, Sekerka RF. J Appl Phys 1964;35:444.
[10] Warren JA, Boettinger WJ. Acta Metall Mater 1995;43:689.[11] Ross EW, O’Hara KS. In: Kissinger RD, et al. editors. Superalloys.
Warrendale (PA): TMS, 1996. p. 19.[12] Ludwig O, Dimichiel M, Salvo L, Suery M, Falus P. Metall Mater
Trans A 2005;36A:1515.[13] Li B, Brody HD, Black DR, Burdette HE, Rau C. J Phys D
2006;39:4450.[14] Mathiesen RH, Arnberg L, Mo F, Weitkamp T, Snigirev A. Phys Rev
Lett 1999;83:5062.[15] Bellet D, Bastie P, Baruchel J. J Phys D 1993;26:A50.[16] Biermann H, Ungar T, von Grossmann B, Mechsner S. Mater Sci
Eng A 2004;387-89:918.[17] Napolitano RE, Schaefer RJ. J Mater Sci 2000;35:1641.[18] Boyce BL, Chen X, Peters JO, Hutchinson JW, Ritchie RO. Mater Sci
Eng A 2003;349:48.
N.S. Husseini et al. / Acta Materialia 56 (2008) 4715–4723 4723
[19] Royer A, Bastie P, Veron M. Acta Mater 1998;46:5357.[20] Brown GS, Lavender W. In: Brown GS, Moncton DE, editors.
Handbook on synchrotron radiation, vol. 3. Amsterdam: ElsevierScience; 1983. p. 37.
[21] Dufresne EM, Arms DA, Pereira NR, Ilinski P, Clarke R. SRI2003;705:679.
[22] Rasband WS. ImageJ, US National Institutes of Health, Bethesda,MA, 1997–2007. Available from: http://rsb.info.nih.gov/ij/.
[23] The MathWorks Inc, Natick (MA).[24] Snigirev A, Snigireva I, Kohn V, Kuznetsov S, Schelokov I. Rev Sci
Instrum 1995;66:5486.[25] Tin S, Pollock TM. Metall Mater Trans A 2003;34A:1953.[26] Walston S, Cetel R, MacKay K, O’Hara D, Duhl D, Dreshfield R. In:
Green KA, et al. editors. Superalloys. Warrendale, PA: TMS; 2004. p.15.
[27] Sato A, Harada H, Kobayashi T, Murakumo T, Zhang JX,Yokokawa T. J Jap Inst Metals 2006;70:196.
[28] Sato J, Omori T, Oikawa K, Ohnuma I, Kainuma R, Ishida K.Science 2006;312:90.
[29] Suzuki A, DeNolf GC, Pollock TM. Scripta Mater 2007;56:385.[30] Quested PN, McLean M. In: Proc Conf Solid if Tech. London: TMS;
1980. p. 586.[31] Elliott AJ, Tin S, King WT, Huang SC, Gigliotti MFX, Pollock TM.
Metall Mater Trans A 2004;35A:3221.[32] D’Souza N, Newell M, Devendra K, Jennings PA, Ardakani MG,
Shollock BA. Mater Sci Eng A 2005;413:567.[33] Yi JZ, Torbet CJ, Feng Q, Pollock TM, Jones JW. Mater Sci Eng A
2007;443:142.[34] Liu L, Husseini NS, Torbet CJ, Kumah DP, Clarke R, Pollock TM,
Jones JW. J Eng Mater Tech 2008;130:021008–1.