Embed Size (px)
Citation preview

Research ArticleMapping Pyroclastic Flow Inundation Using Radar and OpticalSatellite Images and Lahar Modeling
Chang-Wook Lee ,1 Zhong Lu ,2 Jin-Woo Kim,2 and Sung-Jae Park 1
1Division of Science Education, Kangwon National University, 1 Kangwondaehak-gil, Chuncheon-si,Gangwon-do 24341, Republic of Korea2Huffington Department of Earth Sciences, Southern Methodist University, 3225 Daniel Avenue, Dallas, TX 75205, USA
Correspondence should be addressed to Zhong Lu; [email protected]
Received 29 May 2017; Revised 29 August 2017; Accepted 6 December 2017; Published 19 March 2018
Academic Editor: Jesus Corres
Copyright © 2018 Chang-Wook Lee et al. This is an open access article distributed under the Creative Commons AttributionLicense, which permits unrestricted use, distribution, and reproduction in any medium, provided the original work isproperly cited.
Sinabung volcano, located above the Sumatra subduction of the Indo-Australian plate under the Eurasian plate, became active in2010 after about 400 years of quiescence. We use ALOS/PALSAR interferometric synthetic aperture radar (InSAR) images tomeasure surface deformation from February 2007 to January 2011. We model the observed preeruption inflation and coeruptiondeflation using Mogi and prolate spheroid sources to infer volume changes of the magma chamber. We interpret that theinflation was due to magma accumulation in a shallow reservoir beneath Mount Sinabung and attribute the deflation due tomagma withdrawal from the shallow reservoir during the eruption as well as thermoelastic compaction of erupted material. Thepyroclastic flow extent during the eruption is then derived from the LAHARZ model based on the coeruption volume fromInSAR modeling and compared to that derived from the Landsat 7 Enhanced Thematic Mapper Plus (ETM+) image. Thepyroclastic flow inundation extents between the two different methods agree at about 86%, suggesting the capability of mappingpyroclastic flow inundation by combing radar and optical imagery as well as flow modeling.
1. Introduction
Volcanic pyroclastic flows consist of a large amount ofdestructive mass of very hot ash, lava fragments, and gasesejected explosively from a volcano and typically flow down-slope at great speed. Volcanic pyroclastic flows pose greatthreats to people and property downstream from volcanoes.In order to accurately estimate the extents that are likely tobe impacted by pyroclastic flows, computer models, such asLAHARZ [1], have been developed on the basis of statisticalanalyses of flow-path geometries and mathematical analysesof flow physics. LAHARZ [1] has been applied at many vol-canoes worldwide.
Mount Sinabung is a stratovolcano in the northwesternpart of the Sumatra Island, Indonesia (Figure 1). Formedduring the Pleistocene to Holocene, the volcano consists ofandesitic and dacitic lavas. The Sumatra Island, located onthe boundary between the Australian Plate to the south and
the Eurasian Plate to the north, was formed by the meltingof subducted rocks under enormous pressure and its subse-quent eruptions in volcanoes. Sumatra and Java, Indonesia,include a long line of volcanoes along the boundary betweenthe two plates and have produced a large number of earth-quakes and volcanic eruptions. Located within 50 km south-east of Sinabung, Sumatra Island’s Toba volcano had thelargest eruption with a volcanic explosivity index (VEI) of 8in the geological record during last 25 million years [2].
Mount Sinabung has a 2460m high conical structurewith four overlapping craters about 60 to 300m in diameterfrom north to south, respectively, and is mostly covered withdense vegetation exclusively at the top of the volcano(Figure 2). Sinabung volcano had its last historical activityabout 400 years ago, and the 2010 eruption started on August29 and lasted to the middle of September 2010. After the firstreawakened volcanic eruption in 2010, Mount Sinabungerupted again in 2013, 2014, and 2016.
HindawiJournal of SensorsVolume 2018, Article ID 8217565, 12 pageshttps://doi.org/10.1155/2018/8217565

SAR interferometry (InSAR) is an efficient method formeasuring surface deformation over large areas [3–7], andit has been applied worldwide to study volcanoes [8–13].
Chaussard and Amelung [10] processed 13 L-band ALOS/PALSAR images acquired before 2010 and showed progres-sive inflation at a rate of 2.2 cm/yr using small-baseline subset
Figure 1: Location of Mount Sinabung in Indonesia above the Sumatra subduction zone.
98 98 98º21′E
º12′
Nº1
0′N
33
3º8′N
º23′E º25′E
Figure 2: Landsat 7 ETM+ imagery at Mount Sinabung on 19 May 2003.
2 Journal of Sensors

(SBAS) InSAR technique [14–16]. They also measured thesurface displacement before the eruption and during theeruption and estimated the depth of magma storage(0.9 km) using volcanic source modeling (i.e., Mogi andYang) [17–21]. However, these previous InSAR studiesdid not calculate the substantive damages of the volcanicactivities but merely observed the volume change of themagma chamber according to the arithmetical deformationof the surface.
In this study, we have carried out a study of pyroclas-tic flow mapping using satellite imagery from both radarand optical sensors as well as the LAHARZ program
(Figure 3). We improve the preliminary results [22–24]by laying out details on how to derive the pyroclastic flowextent using maximum likelihood classification methodbased on Landsat 7 images where artifacts due to scan-line corrector have been rectified. We generate the coerup-tion InSAR image by stacking several interferograms inorder to improve the signal-to-noise ratio (SNR) of thecoeruption deformation map, based on which we derivethe extrusion volume associated with the 2010 eruptionat Sinabung from geophysical models. The goal is to gen-erate a high-SNR deformation map for an accurate esti-mate of the eruption volume and improve the earlier
SARacquisitions
Interferograms
SBAS processingfor the preeruption
Stacking imagefrom SBAS resultfor the preeruption
Stacking imagefrom SBAS resultfor the coeruption
Magma modeling
Calculation ofinundation area
Pyroclastic inundation areamodeling with modifiedLAHARZ
Verification of pyroclasticinundation area from tworesult
SBAS processingfor the coeeruption
Supervised imageclassification
Minimizingatmosphericeffects
Landsatacquisitions
Figure 3: Flowchart of the radar and optical data processing.
3Journal of Sensors

results of time-series deformation measurements where noisewas apparent in some individual InSAR images [22–24]. Wederive the volume change associated with Sinabung’s volca-nic eruption in 2010 using mechanical modeling, and the cal-culated volume change of the magma chamber is thenapplied to a pyroclastic flow modeling algorithm based onLAHARZ [1, 25–27] to obtain the hazard zone of pyroclasticflow deposit. We describe in detail how we model the pyro-clastic inundation map using the LAHARZ model and dis-cuss quantitatively the comparison of pyroclastic flowsimulation maps and pyroclastic flow map derived from theLandsat 7 ETM+ image of Sinabung volcano (Table 1).Finally, we highlight that the integration of satellite imageanalysis and pyroclastic flow simulation using the LAHARZprogram can accomplish volcano monitoring and pyroclasticflow inundation hazard mapping of active volcanoes and dis-cuss the limitation of the proposed method.
2. Processing of Optical Image
A pyroclastic flow inundation map can be generated by fieldsurveys from the crater rim to the furthest extent of thepyroclastic flow after a volcanic eruption. However, a field
survey in an active volcano can be dangerous due to the expo-sure to hazardous gases and abrupt activities. In contrast,remote sensing techniques are a useful tool for generatingpyroclastic flow deposit maps, providing a safe, cost effectivealternative to field mapping.
In this study, we aim to generate a pyroclastic flowdeposit map using a Landsat 7 ETM+ image acquired on 30Jul. 2012 after the 2010 Sinabung eruption (Table 1). Thisimage represents the land cover after the 2010 eruptions withan absence of atmospheric effects (Figure 4(a)). However, theLandsat 7 ETM+ data suffer from an artifact due to the failureof the scan-line corrector (SLC) in the ETM+ instrument.The Landsat 7 data can be restored by a gap-filling and filter-ing technique described by Lee et al. [28, 29] (Figure 4(b)).Finally, we use the gap-filled Landsat 7 ETM+ data(Figure 4(b)) to derive land-cover types through supervisedmaximum likelihood classification (Figure 4(c)). We estab-lish six classes, including farm land (orange), forest (green),city (gray), shadow (dark gray), water (blue), and pyroclasticflow deposit area (red). Based on the classification maps, thepyroclastic flow deposits from the 2010 eruption were mainlycontained over the southern and eastern upper flanks of thevolcano (red in Figure 4(c)). The pyroclastic flow inundation
Table 1: Characteristics of ALOS/PALSAR and Landsat data used in this study.
(a)
Number Mission Orbit number Date (YYYYMMDD) Perpendicular baseline (m)
1 ALOS/PALSAR 00702 20070220 0
2 ALOS/PALSAR 00707 20070708 181
3 ALOS/PALSAR 00708 20070823 205
4 ALOS/PALSAR 00801 20080108 15
5 ALOS/PALSAR 00802 20080223 194
6 ALOS/PALSAR 00804 20080409 305
7 ALOS/PALSAR 00805 20080525 −458 ALOS/PALSAR 00810 20081010 −1249 ALOS/PALSAR 00901 20090110 101
10 ALOS/PALSAR 00902 20090225 −22711 ALOS/PALSAR 00907 20090713 449
12 ALOS/PALSAR 00908 20090828 546
13 ALOS/PALSAR 00911 20091128 147
14 ALOS/PALSAR 01001 20100113 −315 ALOS/PALSAR 01002 20100228 189
16 ALOS/PALSAR 01007 20100716 46
17 ALOS/PALSAR 01008 20100831 202
18 ALOS/PALSAR 01010 20101016 154
19 ALOS/PALSAR 01012 20101201 −16520 ALOS/PALSAR 01101 20110116 31
(b)
Number Mission Path/Track Date Time (UTC)
1 Landsat/ETM+ 129/058 20120730 03:35:52.8
4 Journal of Sensors

area after the 2010 eruption of Sinabung volcano is estimatedas 0.872 km2 (red in Figure 4(d)).
3. Processing of Radar Images
InSAR processing is carried out to characterize the surfacedeformation of the Sinabung volcano. Using 20 ALOS/PAL-SAR images from 20 Feb. 2007 to 16 Jan. 2011 (Table 1), 40interferograms are generated. The best coherence was con-strained on the volcano summit. Outside the summit, coher-ence was maintained only at many scattered patches of rockyand less-vegetated areas.
The trend of surface deformation shows an uplift patternuntil the end of August 2010 but a deflation pattern from theeruption event to the end of the dataset, corresponding to thechanges in magma volume inside the reservoir. Therefore, wedivide our results into two different periods of inflation anddeflation separated by the onset of the 2010 eruption. Thetime-series SBAS technique is applied to measure the surface
deformation of the Sinabung volcano at each period [16].Using this method, we can minimize artificial atmosphericeffects [30, 31] and accurately measure surface deformationover a specific time period. Figure 5(a) displays the stackedimage showing inflation of magma volume change until the2010 eruption, and Figure 5(b) represents the stacked imagethat shows the deflation pattern of surface deformation dur-ing the 2010 eruption.
The two stacked images of surface deformation(Figures 6(a) and 6(b)) have opposite fringe tendency, witha maximum 1.2 cm/yr of preeruption inflation (Figure 6(c))and 7 cm/yr of coeruption deflation (Figure 6(d)).
4. Volume Change Model of Magma Chamber
The Mogi model, based on a point source embedded in anelastic homogeneous half-space [32], is applied to estimatethe location and volume change of the mean surface defor-mation rate maps (Figures 6(a) and 6(b)) before and during
3º10′0″
N98º20′0″E 98º25′0″E
km0 1 2 4
(a)
km0 1 2 4
3º10′0″
N
98º20′0″E 98º25′0″E
(b)
98º21′0″E 98º24′0″E
3º10′0″
N3º
12′0″
N
LegendForest
Pyroclastic flowdeposit
WaterFarm land
(c)
0 1 2 4km
3º10′0″
N
98º20′0″E 98º25′0″E
(d)
Figure 4: (a) False color composite (RGB= 742) image of Landsat 7 ETM+ acquired on 30 Jul. 2012. (b) The gap-filled Landsat 7 ETM+image. (c) Supervised classification map derived from (b). (d) Pyroclastic flow inundation after the 2010 eruption at Sinabung volcano.
5Journal of Sensors

98º20′E 98º22′E 98º24′E 98º26′E3º
12′N
3º10′N
3º8′
N
km
P(1)
P(2)
00 31.5
2 cm/yr1.5
(a)
98º20′E 98º22′E 98º24′E 98º26′E
3º12′N
3º10′N
3º8′
N
P(1)
P(2)
0 8 cm/yr1.5 0 31.5
km
(b)
Figure 5: Stacked unwrapped interferograms for preeruption (a) and coeruption (b) of Sinabung volcano (modified from [16]).
A−A′
B−B′C−C′D−D′
0 450 900 0Distance (m)
450 900−8
−6
−4
−2
0
2
−0.4
0
0.4
0.8
1.2
1.6
LOS
surfa
ce d
efor
mat
ion
(cm
)
0 2 cm/yr 6 cm/yr0(a) (b)
(c) (d)
Figure 6: (a) and (b) are magnified images in Figures 4(a) and 4(b) with the cross lines of A, B, C, and D. (c) and (d) represent the profile ofaveraged surface deformation along each cross line (modified from [16]).
6 Journal of Sensors

the eruption. The best-fit Mogi source models of the observedinterferograms (Figures 7(a) and 7(b)) are represented bysynthetic interferograms in Figures 6(c) and 6(d). Residualinterferograms (Figures 7(g) and 7(h)) can be calculatedfrom the difference between the observed and synthetic inter-ferograms. The depth of source is estimated to be ~0.3 kmbelow sea level (BSL) before eruption and ~0.6 km BSL dur-ing the eruption (Table 2). This Mogi model estimates anincrease in volume before the eruption as 1.9× 10⁻⁶ km3/yr(Figure 7). During the deflation of the coeruption period,the volume decrease is estimated to be −2.7× 10⁻⁵ km3/yr(Figure 7). As the Mogi model is essentially a point source,we further generate a best-fit model for using a prolatespheroid [8] for the preeruption and coeruption periods.The prolate spheroid source model (Figure 7(e)) is calcu-lated to be at a depth of 1.3 km BSL beneath the centerof the caldera before the eruption and ~1.1 km BSL duringthe eruption. The RMSE between the observations andmodel predictions from the prolate spheroid model is lessthan the corresponding one from the Mogi source(Table 2). Results from the prolate spheroid model suggestthat the source of coeruption deflation is a steeply dippingelongate spheroid with major and minor axes of 2.7 kmand 1.2 km, respectively, and a loss in pressure of−62.2MPa/yr (Table 3). The preeruption source axes areestimated to be 3.0 km and 2.4 km with an increased pres-sure of 4.3MPa/yr (Table 3).
5. LAHARZ Processing
The rationale for the delineation of lahar-inundation hazardzones [33, 34] is derived from the scaling analysis of laharpaths and statistical analysis using the LAHARZ program[35–37]. These analyses generate semiempirical equationsthat predict the inundated valley cross-sectional area (1)and the planimetric area (2) as a function of lahar volumewith proportionality coefficients c and C using volcanic eventdata of 27 paths of lahars at nine volcanoes.
log A = log C + 23 log V ,
1
log B = log c + 23 log V , 2
where A is the cross-sectional area, B is the planimetricarea, c and C are proportionality coefficients, and V isthe volume of the lahar. These calibrated predictive equa-tions involve all the information needed to calculate andplot inundation on topographic maps through an empiri-cal formula. Statistical methods from the LAHARZ pro-gram result in experience coefficients, C and c, C = 0 05and c = 200 ((3) and (4)).
A = 0 05V2/3, 3
B = 200V2/3 4
PF inundation maps are generated in this study using astatistically constrained simulation model to estimate poten-tial hazard areas [25] by adapting methodology from the
LAHARZ program [35]. The prediction equations forcross-sectional (5) and planimetric (6) areas of PF hazardsfor Sinabung volcano are calibrated using data from dozensof events at several volcanoes. The equations are expressedwith empirical proportionality coefficients (C = 0 05 to 0.1,c = 35 to 40) resulting from the adaptation of LAHARZprogram statistical analyses [35].
A = 0 05 to 0 1 V2/3, 5
B = 35 to 40 V2/3 6
The PF inundation map for the 2010 Sinabung eruptionis created in this study using the PF modeling algorithm fromthe modified LAHARZ program with empirical coefficientvalues of 0.1 for C and 40 for c. Several values for the volumeof the pyroclastic flow in (5) and (6) are tested, including thevolume change estimate calculated using the Mogi modelwith deformation observed in the coeruption interferogram(Table 2).
The inundation maps for the PF (Figure 8) estimatedfrom the LAHARZ program can be compared to the resultsof the supervised classification created using the posteruptiveLandsat 7 ETM+ image from 30 Jul. 2012. The modifiedLAHARZ program estimates are calculated using the fourdifferent values for the PF volume (red, brown, orange, andyellow colors).
Among the four different values for volume testedusing the modified LAHARZ method, the volume of−2.7× 10⁻⁵ km3 (red color) agrees relatively well with theresult from the supervised classification delineation for theinundation limits of the PF deposits from the Landsat image.Region B (volume of PF simulation) in Table 4 is alsoincluded within approximately 84% of the PF inundationarea delineated using the Landsat image. Region A representsa too small PF simulation area compared with the Landsatimage result. Regions C and D, however, have common areasof only 78% and 67%, respectively, between the PF simula-tions and pyroclastic inundation extents based on the Land-sat image (Figure 8).
6. Discussion
InSAR images over Sinabung indicate volcanic inflationbefore the 2010 eruption and deflation during the erup-tion. Modeling the observed deformation using Mogi andprolate spheroid sources has allowed us to estimate themagma source location, excessive pressure, the shape ofthe source, and volume changes during the preeruption andcoeruption periods. The model results suggest there is amagma storage underneath Sinabung. The reservoir islocated ~1 km BSL (~3 km beneath the peak of Sinabung).The magma reservoir is best characterized with a prolatespheroid with the vertical axis of ~2.7 km and horizontal axisof 1.2 km.
The location of the shallow magma reservoir matches theobservations of seismicity recorded by the local seismic net-work. The Indonesia’s Centre for Volcanology and Geologi-cal Hazard Mitigation (CVGHM) installed four seismicstations (KWR, SKN, SKM, and MRD; green stars in
7Journal of Sensors
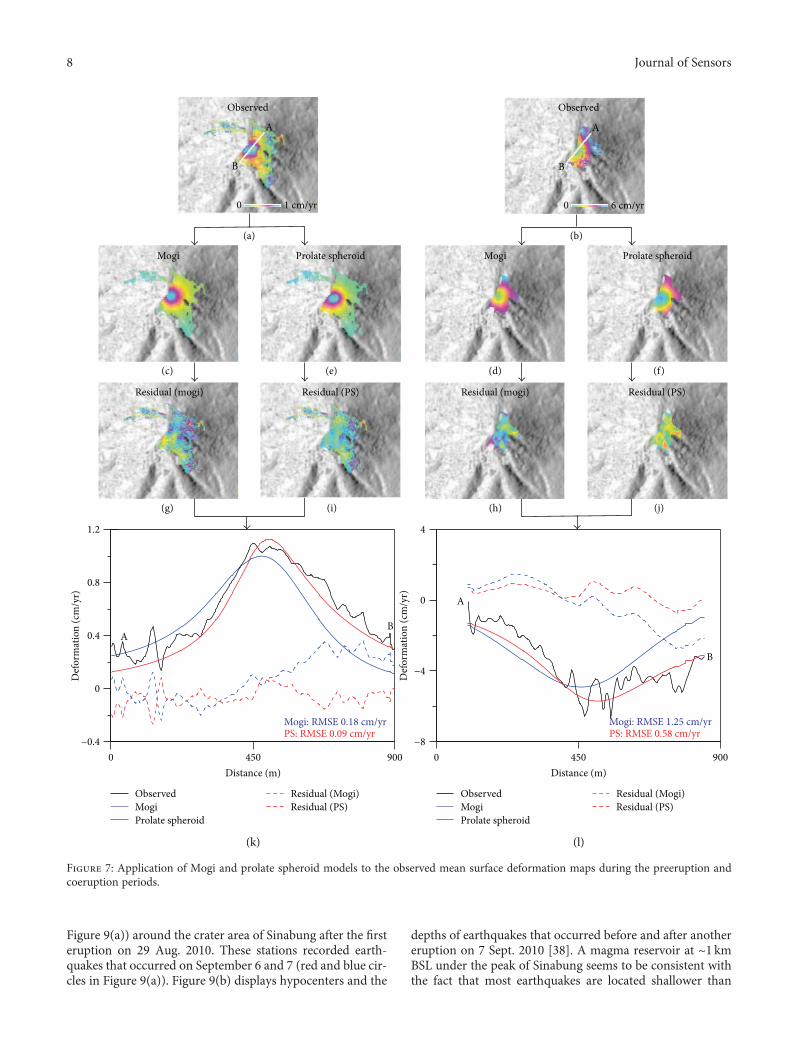
Figure 9(a)) around the crater area of Sinabung after the firsteruption on 29 Aug. 2010. These stations recorded earth-quakes that occurred on September 6 and 7 (red and blue cir-cles in Figure 9(a)). Figure 9(b) displays hypocenters and the
depths of earthquakes that occurred before and after anothereruption on 7 Sept. 2010 [38]. A magma reservoir at ~1 kmBSL under the peak of Sinabung seems to be consistent withthe fact that most earthquakes are located shallower than
0
0
900450−8
ObservedMogiProlate spheroid
Residual (Mogi)Residual (PS)
0.4
0.8
1.2
−0.4
Def
orm
atio
n (c
m/y
r)
Def
orm
atio
n (c
m/y
r)
Distance (m)
ObservedMogiProlate spheroid
Residual (Mogi)Residual (PS)
0 1 cm/yr 0
A
B
A
B
A
B
AB
Observed Observed
Mogi Prolate spheroid Prolate spheroidMogi
(a) (b)
(c) (e) (d) (f)
(j)(h)(i)(g)
(k) (l)
Residual (mogi) Residual (PS)Residual (mogi) Residual (PS)
6 cm/yr
Mogi: RMSE 0.18 cm/yrPS: RMSE 0.09 cm/yr
900450Distance (m)
0
Mogi: RMSE 1.25 cm/yrPS: RMSE 0.58 cm/yr
−4
0
4
Figure 7: Application of Mogi and prolate spheroid models to the observed mean surface deformation maps during the preeruption andcoeruption periods.
8 Journal of Sensors

1 km BSL (Figure 9). Such a magma reservoir is responsiblefor the observed inflation before the 2010 eruption and thedeflation associated with the 2010 eruption.
Pyroclastic inundation hazard maps are generated inthis study based on a modified LAHARZ program (PFsimulation) using the volume change calculated by theMogi model from the deformation results observed usingstacked interferograms and then are compared with theinundation map from the supervised classification methodwith Landsat imagery. When we generate these pyroclasticinundation hazard maps, the volume change associatedwith the deflation of the magma chamber after the erup-tion was found to be the better-fit value (approximately86% overlap) based on the comparison with the pyroclas-tic inundation maps from the Landsat images and the
other PF simulations. This study has demonstrated that avolcano hazard inundation map can be generated usingthe PF model [25] by inputting parameters estimated frommodels of the magma chamber based on InSAR-derivedsurface deformation measurements. However, our methodhas some limitations. First, the eruption volume is calcu-lated from the volume change by modeling the volcanicdeflation from InSAR. Due to the vascularity, the eruptionvolume can be different from the deflation volume [8].Hence, the volume used for LAHARZ modeling representsthe lower bound of the volume of eruptive material. Sec-ond, we have ignored other eruptive products such asvolcanic ash, which can lower our estimate for the volumeused in LAHARZ modeling. Third, we have also neglectedother thermodynamic effects on the magma chamber in
Table 3: Source parameters obtained from the prolate spheroid model.
Major axis (km) Minor axis (km) Depth (km) ΔP (MPa/yr) RMSE (cm/yr) between line A and B
Preeruption (inflation pattern) 3.0 2.4 1.3 4.3 0.09
Coeruption (deflation pattern) 2.7 1.2 1.1 −62.2 0.58
Table 2: Source parameters obtained from the Mogi model.
Depth (km) ΔV (km3/yr) RMSE (cm/yr) between line A and B
Preeruption (inflation pattern) 0.3 1.9× 10⁻⁶ 0.18
Coeruption (deflation pattern) 0.6 −2.7× 10⁻⁵ 1.25
0 0.5 1 2 3 4km
98°25′0′′E98°22′30′′E
3°12′3
0′′N
3°10′0′′
N
Pyroclastic flow volume (m3)
20,000 (area: 0.509 km3)
27,000 (area: 0.622 km3)
30,000 (area: 0.646 km3)
40,000 (area: 0.792 km3)
Region A
Region B
Region C
Region D
Hazard area from Landsat30 Jul, 2012
(a)
0 0.125 0.750.50.25 1km
Pyroclastic flow volume (m3)
20,000 (area: 0.509 km3)
27,000 (area: 0.622 km3)
30,000 (area: 0.646 km3)
40,000 (area: 0.792 km3)
Region A
Region B
Region C
Region D
3°10′0′′
N3°
9′2
0′′N
98°23′20′′E 98°24′0′′E
Hazard area from Landsat30 Jul, 2012
(b)
Figure 8: The pyroclastic flow inundation area (a) estimated from the revised LAHARZ program (PF simulation) with various volumes(20,000, 27,000, 30,000, and 40,000m3). The black line (b) is the pyroclastic flow inundation area from the supervised classification of theLandsat image acquired on 30 Jul. 2012 (after the 2010 eruption).
9Journal of Sensors

the derivation of a deflation volcano from InSAR-deriveddeformation measurements [8].
7. Conclusions
In this study, we firstly measure the mean surface deforma-tion using stacked interferograms by ALOS/PALSAR databefore and after the 2010 eruption of Sinabung volcano onthe Island of Sumatra, Indonesia. The mean surface defor-mation rate maps are used in the Mogi and spheroidmodels to estimate the depth, volume changes, and dimen-sions of the magma source before and during the 2010
eruption. The estimated depth of the magma source isaround 1 km BSL; the volume change during the coerup-tion is calculated. The change in volume estimated fromthe Mogi model is used to generate a PF inundation haz-ard map using the modified LAHARZ program. We finallyhave verified the pyroclastic flow inundation area usingthe inundation map from the supervised classificationmethod based on Landsat 7 ETM+ imagery. The best-fitresult is when the volume for the PF simulation is basedon the volume change from modeling the coeruptionInSAR deformation map. We conclude that the combina-tion of satellite image analysis and PF simulation using
Table 4: Comparison of the common region between the pyroclastic flow (PF) simulation and Landsat supervised classification hazard zonein Figure 7.
Pyroclastic flow volume (m3)Orientation(direction)
Common region between Landsatand PF simulation (pixels)
Pyroclastic flow inundation areafrom PF simulation (pixels)
Proportion ofcommon region (%)
Region A 20,000
E
Underestimated Underestimated UnderestimatedSE
SSE
S
Total — — —
Region B 27,000
E 252 284 88.73
SE 110 134 82.09
SSE 90 136 66.18
S 130 138 94.20
Total 582 692 84.10
Region C 30,000
E 256 292 87.67
SE 110 140 78.57
SSE 60 142 42.25
S 136 144 94.44
Total 562 718 78.27
Region E 40,000
E 272 356 76.40
SE 110 170 64.71
SSE 60 174 34.48
S 144 180 80.00
Total 586 880 66.59
Region F 50,000
E 272 402 67.66
SE 110 204 53.92
SSE 60 198 30.30
S 144 204 70.59
Total 586 1008 58.13
Region G 60,000
E 272 474 57.38
SE 110 230 47.83
SSE 60 238 25.21
S 144 226 63.72
Total 586 1168 50.17
Region H 70,000
E 272 500 54.40
SE 110 262 41.98
SSE 60 252 23.81
S 144 258 55.81
Total 586 1272 46.07
10 Journal of Sensors

the modified LAHARZ program can accomplish volcanomonitoring and pyroclastic flow inundation hazard map-ping of active volcanoes.
Conflicts of Interest
The authors declare that they have no conflicts of interest.
Acknowledgments
This research was supported by the National Research Foun-dation of Korea (NRF) grant funded by the Korea govern-ment (MSIP) (no. 2017R1A2B4003258); the Basic ScienceResearch Program through the National Research Founda-tion of Korea (NRF) funded by the Ministry of Science, ICT& Future Planning (2015M1A3A3A02013416); and theKorea Meteorological Administration Research and Devel-opment Program under Grant KMIPA (2015-3071). TheSAR data used in this study are copyrighted ©JAXA/METIand were provided by Alaska Satellite Facility.
References
[1] S.-P. Schilling, “LAHARZ: GIS programs for automated delin-eation of lahar hazard zones,”U.S. Geological Survey Open-fileReport 98-638, Reston, Virginia, 1998.
[2] Global Volcanism Program, Smithsonianhttp://volcano.si.edu/.
[3] D. Massonnet and K.-L. Feigl, “Radar interferometry and itsapplication to changes in the Earth’s surface,” Reviews of Geo-physics, vol. 36, no. 4, pp. 441–500, 1998.
[4] E. Rignot, “Changes in West Antarctic ice stream dynamicsobserved with ALOS PALSAR data,” Geophysical ResearchLetters, vol. 35, no. 12, 2008.
[5] A.-H.-M. Ng, H.-C. Chang, L. Ge, C. Rizos, and M. Omura,“Assessment of radar interferometry performance for groundsubsidence monitoring due to underground mining,” Earth,Planets and Space, vol. 61, no. 6, pp. 733–745, 2009.
[6] Z. Lu, J.-W. Kim, H. Lee et al., “Helmand River hydrologicstudies using ALOS PALSAR InSAR and ENVISAT altime-try,” Marine Geodesy, vol. 32, no. 3, pp. 320–333, 2009.
[7] H.-S. Jung, Z. Lu, and L. Zhang, “Feasibility of along-trackdisplacement measurement from Sentinel-1 interferometricwide-swath mode,” IEEE Transactions on Geoscience andRemote Sensing, vol. 51, no. 1, pp. 573–578, 2013.
[8] M.-E. Pritchard and M. Simons, “Surveying volcanic arcs withsatellite radar interferometry: the central Andes, Kamchatka,and beyond,” GSA Today, vol. 14, no. 8, pp. 4–10, 2004.
[9] Z. Lu and D. Dzurisin, InSAR Imaging of Aleutian Volcanoes:Monitoring a Volcanic Arc from Space, Springer-Verlag, BerlinHeidelberg, 2014.
[10] E. Chaussard and F. Amelung, “Monitoring the ups and downsof Sumatra and Java with D-Insar time-series,” in AmericanGeophysical Union, Fall Meeting, San Francisco, CA, USA,2010abstract G23C-0838.
[11] S. K. Ebmeier, J. Biggs, T. A. Mather, G. Wadge, andF. Amelung, “Steady downslope movement on the westernflank of Arenal volcano, Costa Rica,” Geochemistry, Geophys-ics, Geosystems, vol. 11, no. 12, 2010.
[12] B. Philibosian and M. Simons, “A survey of volcanic deforma-tion on Java using ALOS PALSAR interferometric time series,”Geochemistry, Geophysics, Geosystems, vol. 12, no. 11, 2011.
[13] R. Furuta, “Case study of small scale surface deformationdetection using ALOS PALSAR differential interferometry,”in Proceedings of FRINGE 2009Workshop, Frascati, Italy, 2009.
−5 −4 −3 −2 −1 0
SKM
MRD
KWR
SKN
West−east (km)
Sout
h−no
rth
(km
)
1 2 3 4 5
N
5
4
3
2
1
0
−1
−2
−3
−4
−5
(a)
−3
−5 −4 −3 −2 −1 0West−east (km)
1 2 3 4 5
−2
−1
0
1
2
Dep
th (k
m)
W E
3
4
5
6
7
(b)
Figure 9: (a) Hypocentral distribution of volcanic earthquakes at Sinabung volcano from 6 to 7 Sept. 2010. Green stars indicate the locationsof seismic survey stations. Red and blue dots indicate hypocenters before and after the eruption of 7 Sept. 2010 (from [38]).
11Journal of Sensors

[14] E. Chaussard and F. Amelung, “Precursory inflation of shallowmagma reservoirs at west Sunda volcanoes detected byInSAR,” Geophysical Research Letters, vol. 39, no. 21, 2012.
[15] C.-W. Lee, Z. Lu, H.-S. Jung, J.-S. Won, and D. Dzurisin, “Sur-face deformation of Augustine Volcano, 1992-2005, frommultiple-interferogram processing using a refined Small Base-line Subset (SBAS) Interferometric Synthetic Aperture Radar(InSAR) approach,” in The 2006 Eruption of Augustine Vol-cano, Alaska, pp. 453–465, U.S. Geological Survey ProfessionalPaper 1769, Alaska, USA, 2011.
[16] C.-W. Lee, Z. Lu, and H.-S. Jung, “Simulation of time-seriessurface deformation to validate a multi-interferogram InSARprocessing technique,” International Journal of Remote Sens-ing, vol. 33, no. 22, pp. 7075–7087, 2012.
[17] Z. Lu, T. Masterlark, D. Dzurisin, R. Rykhus, and C. Wicks Jr.,“Magma supply dynamics at Westdahl volcano, Alaska, mod-eled from satellite radar interferometry,” Journal of Geophysi-cal Research: Solid Earth, vol. 108, no. B7, 2003.
[18] Z. Lu, T. Masterlark, and D. Dzurisin, “Interferometric syn-thetic aperture radar study of Okmok volcano, Alaska, 1992–2003: magma supply dynamics and postemplacement lavaflow deformation,” Journal of Geophysical Research: SolidEarth, vol. 110, no. B2, 2005.
[19] T. Masterlark, “Magma intrusion and deformation predic-tions: sensitivities to the Mogi assumptions,” Journal of Geo-physical Research: Solid Earth, vol. 112, no. B6, 2007.
[20] H. S. Jung, Z. Lu, J. S. Won, M. P. Poland, and A. Miklius,“Mapping three-dimensional surface deformation by combin-ing multiple-aperture interferometry and conventional inter-ferometry: application to the June 2007 eruption of Kilaueavolcano, Hawaii,” IEEE Geoscience and Remote Sensing Letters,vol. 8, no. 1, pp. 34–38, 2011.
[21] C.-W. Lee, “Baekdusan volcano time-series analysis from 1992to 1998 using multi-interferogram InSAR processing,” Terres-trial, Atmospheric and Oceanic Sciences, vol. 25, no. 6, p. 743,2014.
[22] C. W. Lee, Z. Lu, J. W. Kim, and S. K. Lee, “Volcanic activityanalysis of Mt. Sinabung in Indonesia using InSAR and GIStechniques,” in 2015 IEEE International Geoscience andRemote Sensing Symposium (IGARSS), pp. 4793–4796, Milan,Italy, 2015.
[23] C. W. Lee, S. K. Lee, Z. Lu, and J. W. Kim, “Volcanic activityanalysis of Mt. Sinabung in Indonesia using remote sensingand GIS techniques,” in Near-Surface Asia Pacific Conference,pp. 150–153, Waikoloa, HI, USA, 2015.
[24] C. W. Lee, Z. Lu, and J. W. Kim, “Monitoring Mount Sinabungin Indonesia using multi-temporal InSAR,” Korean Journal ofRemote Sensing, vol. 33, no. 1, pp. 37–46, 2017.
[25] C. Widiwijayanti, B. Voight, D. Hidayat, and S.-P. Schilling,“Objective rapid delineation of areas at risk from block-and-ash pyroclastic flows and surges,” Bulletin of Volcanology,vol. 71, no. 6, pp. 687–703, 2009.
[26] B.-E. Hubbard, M.-F. Sheridan, G. Carrasco-Nunez, R. Diaz-Castellon, and S.-R. Rodriguez, “Comparative lahar hazardmapping at Volcan Citlaltépetl, Mexico using SRTM,ASTER and DTED-1 digital topographic data,” Journal ofVolcanology and Geothermal Research, vol. 160, no. 1-2,pp. 99–124, 2007.
[27] R.-M. Iverson, S.-P. Schilling, and J.-W. Vallance, “Objectivedelineation of lahar-inundation hazard zones,” GeologicalSociety of America Bulletin, vol. 110, no. 8, pp. 972–984, 1998.
[28] C.-W. Lee, M. Cho, and Y.-J. Choi, “Satellite imagery correc-tion method and system,” Korea Patent 10-1303730, 2013.
[29] C.-W. Lee, Z. Lu, J.-S. Won, H.-S. Jung, and D. Dzurisin,“Dynamic deformation of Seguam Island, Alaska, 1992–2008,from multi-interferogram InSAR processing,” Journal of Vol-canology and Geothermal Research, vol. 260, pp. 43–51, 2013.
[30] G. Nico, R. Tome, J. Catalao, and P. M. A. Miranda, “On theuse of the WRF model to mitigate tropospheric phase delayeffects in SAR interferograms,” IEEE Transactions on Geosci-ence and Remote Sensing, vol. 49, no. 12, pp. 4970–4976, 2011.
[31] J. Catalao, G. Nico, R. Hanssen, and C. Catita, “Merging GPSand atmospherically corrected InSAR data to map 3-D terraindisplacement velocity,” IEEE Transactions on Geoscience andRemote Sensing, vol. 49, no. 6, pp. 2354–2360, 2011.
[32] K. Mogi, “Relations between the eruptions of various volca-noes and the deformations of the ground surfaces aroundthem,” Bulletin of the Earthquake Research Institute, vol. 36,pp. 99–134, 1958.
[33] R.-J. Blong, “Volcanic hazards risk assessment,” inMonitoringand Mitigation of Volcanic Hazards, pp. 675–698, Springer,Berlin, Heidelberg, 1996.
[34] A.-R.Darnell, J.-C. Phillips, J. Barclay, R.-A.Herd,A.-A. Lovett,and P.-D. Cole, “Developing a simplified geographical infor-mation system approach to dilute lahar modelling for rapidhazard assessment,” Bulletin of Volcanology, vol. 75, no. 4,2013.
[35] E. Chaussard, F. Amelung, and Y. Aoki, “Characterization ofopen and closed volcanic systems in Indonesia and Mexicousing InSAR time series,” Journal of Geophysical Research:Solid Earth, vol. 118, no. 8, pp. 3957–3969, 2013.
[36] C.-S. Magirl, P.-G. Griffiths, and R.-H. Webb, “Analyzingdebris flows with the statistically calibrated empirical modelLAHARZ in southeastern Arizona, USA,” Geomorphology,vol. 119, no. 1-2, pp. 111–124, 2010.
[37] D. O. Dorta, G. Toyos, C. Oppenheimer, M. T. Pareschi,R. Sulpizio, and G. Zanchetta, “Empirical modelling of theMay 1998 small debris flows in Sarno (Italy) using LAHARZ,”Natural Hazards, vol. 40, no. 2, pp. 381–396, 2007.
[38] M. Iguchi, K. Ishihara, Surono, and M. Hendrasto, “Learnfrom 2010 Eruptions at Merapi and Sinabung Volcanoes inIndonesia,” Disaster Prevention Research Institute Annuals,vol. 54, no. B, pp. 185–194, 2011.
12 Journal of Sensors

International Journal of
AerospaceEngineeringHindawiwww.hindawi.com Volume 2018
RoboticsJournal of
Hindawiwww.hindawi.com Volume 2018
Hindawiwww.hindawi.com Volume 2018
Active and Passive Electronic Components
VLSI Design
Hindawiwww.hindawi.com Volume 2018
Hindawiwww.hindawi.com Volume 2018
Shock and Vibration
Hindawiwww.hindawi.com Volume 2018
Civil EngineeringAdvances in
Acoustics and VibrationAdvances in
Hindawiwww.hindawi.com Volume 2018
Hindawiwww.hindawi.com Volume 2018
Electrical and Computer Engineering
Journal of
Advances inOptoElectronics
Hindawiwww.hindawi.com
Volume 2018
Hindawi Publishing Corporation http://www.hindawi.com Volume 2013Hindawiwww.hindawi.com
The Scientific World Journal
Volume 2018
Control Scienceand Engineering
Journal of
Hindawiwww.hindawi.com Volume 2018
Hindawiwww.hindawi.com
Journal ofEngineeringVolume 2018
SensorsJournal of
Hindawiwww.hindawi.com Volume 2018
International Journal of
RotatingMachinery
Hindawiwww.hindawi.com Volume 2018
Modelling &Simulationin EngineeringHindawiwww.hindawi.com Volume 2018
Hindawiwww.hindawi.com Volume 2018
Chemical EngineeringInternational Journal of Antennas and
Propagation
International Journal of
Hindawiwww.hindawi.com Volume 2018
Hindawiwww.hindawi.com Volume 2018
Navigation and Observation
International Journal of
Hindawi
www.hindawi.com Volume 2018
Advances in
Multimedia
Submit your manuscripts atwww.hindawi.com


![Transport properties of pyroclastic rocks from … · canmodifytheiroriginalpetrophysicalcharacteristics[Fisher, 1998; Flint, 2003; Flint and Selker, 2003]. ... samples, mainly pyroclastic](https://img.pdfslide.us/doc/110x75/5b7728a97f8b9ad2498c1d87/transport-properties-of-pyroclastic-rocks-from-canmodifytheiroriginalpetrophysicalcharacteristicsfisher.jpg)