Embed Size (px)
Citation preview
Subscriber access provided by - Access paid by the | UCSF Library
The Journal of Physical Chemistry B is published by the American Chemical Society.1155 Sixteenth Street N.W., Washington, DC 20036Published by American Chemical Society. Copyright © American Chemical Society.However, no copyright claim is made to original U.S. Government works, or worksproduced by employees of any Commonwealth realm Crown government in the courseof their duties.
Article
Mapping Polymerization and Allostery of Hemoglobin S Using Point MutationsPatrick Weinkam, and Andrej Sali
J. Phys. Chem. B, Just Accepted Manuscript • DOI: 10.1021/jp4025156 • Publication Date (Web): 19 Aug 2013
Downloaded from http://pubs.acs.org on August 26, 2013
Just Accepted
“Just Accepted” manuscripts have been peer-reviewed and accepted for publication. They are postedonline prior to technical editing, formatting for publication and author proofing. The American ChemicalSociety provides “Just Accepted” as a free service to the research community to expedite thedissemination of scientific material as soon as possible after acceptance. “Just Accepted” manuscriptsappear in full in PDF format accompanied by an HTML abstract. “Just Accepted” manuscripts have beenfully peer reviewed, but should not be considered the official version of record. They are accessible to allreaders and citable by the Digital Object Identifier (DOI®). “Just Accepted” is an optional service offeredto authors. Therefore, the “Just Accepted” Web site may not include all articles that will be publishedin the journal. After a manuscript is technically edited and formatted, it will be removed from the “JustAccepted” Web site and published as an ASAP article. Note that technical editing may introduce minorchanges to the manuscript text and/or graphics which could affect content, and all legal disclaimersand ethical guidelines that apply to the journal pertain. ACS cannot be held responsible for errorsor consequences arising from the use of information contained in these “Just Accepted” manuscripts.
Mapping Polymerization and Allostery of Hemoglobin S Using Point
Mutations
Patrick Weinkama,* and Andrej Salia,b,*
a Department of Bioengineering and Therapeutic Sciences, b Department of Pharmaceutical
Chemistry, and California Institute for Quantitative Biosciences (QB3), University of California, San
Francisco, San Francisco, CA 94158, USA.
*Corresponding authors: 1700 4th Street, Byers Hall 503B, University of California, San Francisco,
San Francisco, CA 94158; tel 415-514-4227; web http://salilab.org; emails [email protected] and
Keywords: Energy landscape; funnel; Gō model; molecular dynamics; machine-learning
Page 1 of 42
ACS Paragon Plus Environment
The Journal of Physical Chemistry
123456789101112131415161718192021222324252627282930313233343536373839404142434445464748495051525354555657585960
2
Abstract
Hemoglobin is a complex system that undergoes conformational changes in response to oxygen,
allosteric effectors, mutations, and environmental changes. Here, we study allostery and
polymerization of hemoglobin and its variants by application of two previously described methods: (i)
AllosMod for simulating allostery dynamics given two allosterically related input structures and (ii) a
machine-learning method for dynamics- and structure-based prediction of the mutation impact on
allostery (Weinkam et al. J. Mol. Biol. 2013), now applicable to systems with multiple coupled binding
sites such as hemoglobin. First, we predict the relative stabilities of substates and microstates of
hemoglobin, which are determined primarily by entropy within our model. Next, we predict the impact
of 866 annotated mutations on hemoglobin’s oxygen binding equilibrium. We then discuss a subset of
30 mutations that occur in the presence of the sickle cell mutation and whose effects on
polymerization have been measured. Seven of these HbS mutations occur in three predicted
druggable binding pockets that might be exploited to directly inhibit polymerization; one of these
binding pockets is not apparent in the crystal structure but only in structures generated by AllosMod.
For the 30 mutations, we predict that mutation-induced conformational changes within a single
tetramer tend not to significantly impact polymerization; instead, these mutations more likely impact
polymerization by directly perturbing a polymerization interface. Finally, our analysis of allostery
allows us to hypothesize why hemoglobin evolved to have multiple subunits and a persistent low
frequency sickle cell mutation.
Introduction
For decades, hemoglobin has been a model system for studying proteins. The discovery that a
particular mutated hemoglobin (HbS) plays a role in sickle cell anemia was the first time that a
specific protein was linked to a genetic disease1. Hemoglobin A (HbA) was used in the first
mechanistic descriptions of allostery2,3, which led to the characterization of hundreds more allosteric
proteins4. Since these pioneering studies, there has been much progress regarding the allosteric
mechanism of Hb5-7 and the polymerization mechanism of HbS8-14. In fact, the two processes are
coupled because HbS polymers primarily consist of deoxygenated hemoglobin. By exploiting this
coupling, researchers discovered many ligands for hemoglobin that stabilize the oxygenated versus
deoxygenated state and in turn can reduce polymerization15,16, although hematologists disagree on
whether or not decreasing oxygen dissociation is appropriate for treating sickle cell disease. In fact,
there are no still effective therapies for this disease (those that can improve patient health without
Page 2 of 42
ACS Paragon Plus Environment
The Journal of Physical Chemistry
123456789101112131415161718192021222324252627282930313233343536373839404142434445464748495051525354555657585960
3
serious side effects). One of the problems is that a high concentration of hemoglobin in the blood
presumably requires a high concentration of the modulator. While stem cell transplantation has
yielded promising results17, it is currently prohibitively expensive for many patients. Instead,
treatments focus on stimulating the production of fetal hemoglobin using hydroxyurea (which has
sometimes fatal side effects)18,19, providing supplemental oxygen, and treating symptoms such as
pain. To contribute towards the discovery of HbS aggregation modulators, we predict which surface
sites on HbS could be targeted to inhibit polymerization, by applying our previously developed
allostery model20,21 to many experimentally characterized hemoglobin variants.
An allosteric transition involves an equilibrium between the effector bound and unbound states, each
of which follows a different energy landscape (Figure 1). An energy landscape describes the relative
stabilities of all conformations for a system in a specific chemical environment22,23. The effector bound
and unbound landscapes have two conformational substates, one that binds the effector and another
that binds the effector less well. A substate may contain diverse conformations, or microstates, which
are separated by energy and/or entropy barriers. A challenge for any protein dynamics model is to
account for how perturbations, such as point mutations and ligand binding, can affect these complex
and hierarchal energy landscapes24,25.
Our allostery model is a dual basin structure-based Gō model26-29, and can be used to deconstruct a
protein’s energy landscape into relevant substates and microstates. Atomic contacts from the effector
bound and unbound crystal structures are used to define major minima in the energy landscape,
which is then sampled using constant temperature molecular dynamics. The two major minima in the
landscape correspond to conformational substates whose relative stability can be varied with a single
input parameter (rAS). All atoms within a distance rAS of the effector in the crystal structure are
assigned to the allosteric site. Atomic contacts in the allosteric site have a single energetic minimum
corresponding to the effector bound or unbound structure, while the remaining contacts have dual
minima corresponding to both bound and unbound structures. While rAS is a fully adjustable
parameter, we demonstrated that using a value of 12 Å allows relatively accurate predictions of the
change in ligand binding free energy due to mutation20,21. These predictions depend on energy
landscape features derived from input crystal structures, including contact density patterns30.
We can create separate landscapes to model conformational changes that occur as a result of
perturbations, including ligands, mutations, and environmental changes. For instance, different
Page 3 of 42
ACS Paragon Plus Environment
The Journal of Physical Chemistry
123456789101112131415161718192021222324252627282930313233343536373839404142434445464748495051525354555657585960
4
solvent pH and salt concentrations can result in different side chain ionization states and therefore
distinct energy landscapes. A landscape perturbation due to changes in solvent conditions is also
termed chemical frustration31,32. Such perturbations can cause a protein to experience different
allosteric7,33 and folding mechanisms27,32,34,35. For hemoglobin to efficiently transport oxygen, its
energy landscape has evolved to be influenced by pH36, effector ligands, and polymerization of
hemoglobin monomers. For such complex systems, we may gain insight by monitoring
conformational changes resulting from different energy landscapes.
Phenomenological models of allosteric mechanisms for proteins in general include Monod-Wyman-
Changeux (MWC)2, Koshland-Nemethy-Filmer (KNF)3, population shift37,38, and induced fit39,40. These
mechanisms differ by the degree of cooperativity observed during the allosteric transition. A highly
cooperative mechanism occurs when effector binding induces a concerted change in many residues,
corresponding to the KNF and induced fit mechanisms. In our allostery model, we can model such a
cooperative mechanism by creating a landscape with a large allosteric site (i.e., a large rAS). For
smaller values of rAS, our allostery model results in relatively weak coupling between residues, which
is consistent with the MWC and population shift mechanisms.
Here, we analyze HbS allostery and polymerization in the context of point mutations, with the goal to
facilitate prediction of small molecule binding sites that might be used to inhibit HbS polymerization
(Figure 1). To identify such sites, we use experimental annotations of mutations to probe
polymerization. A mutation at a given site can be a useful probe because it often has effects similar to
drug binding, phosphorylation, and other post-translational modifications at the same site41; in all of
these cases, including mutations, the system’s energy landscape is perturbed by adding, deleting, or
modifying a few atoms, which may covalently or non-covalently interact with the rest of the system. In
addition, we predict conformational substate stabilities, by using our AllosMod model of allostery
dynamics20, followed by relating our findings to phenomenological views of allostery. We then predict
the impact of mutations on the oxygen binding affinity, by using our generalized machine-learning
method21, which in turn allows us to speculate about the evolutionary advantage of the HbS mutation.
Lastly, we explore the coupling between allostery and polymerization, which occurs because
polymers are primarily composed of deoxygenated hemoglobin. A simplified model of the
thermodynamic equilibrium between the R, T, and polymeric states allows us to relate the predicted
impact of a mutation on allostery to its corresponding impact on polymerization. However, this
simplified model turned out not to fit the data within the estimated experimental and computational
Page 4 of 42
ACS Paragon Plus Environment
The Journal of Physical Chemistry
123456789101112131415161718192021222324252627282930313233343536373839404142434445464748495051525354555657585960
5
errors. Therefore, under the conditions of the experiments, mutations are more likely to perturb
polymerization primarily via a direct impact on polymerization interfaces rather than on the R to T
equilibrium.
Methods Our approach is described in Figure 1. Briefly, we create energy landscapes for binding of oxygen
and 2,3-diphosphoglycerate (DPG). We then sample the energy landscapes by constant temperature
molecular dynamics simulations. The resulting structural ensembles are analyzed using machine-
learning21 to predict the impact of a mutation on the binding affinity for either oxygen or DPG. These
separate predictions are combined into a single prediction of the mutation effect on the oxygen
binding equilibrium, using “atomic density” around the effector binding sites. We then focus on a
subset of these predictions corresponding to HbS mutations whose impact on polymerization has
been measured by experiment. We discuss the relationship between allostery and polymerization, by
assuming a simplified equilibrium between oxyhemoglobin, deoxyhemoglobin, and the aggregate
states. Finally, we identify three predicted druggable binding sites that might be exploited to directly
inhibit polymerization. Each step listed above is indicated by an arrow in Figure 1 and explained in
detail in the following sections.
Allostery model simulations for oxygen and DPG binding
Simulations of HbA ligand-induced dynamics in vacuo were performed using our web server at
http://salilab.org/allosmod/20,21. These simulations were based on several effector bound and
unbound landscapes with allosteric effectors including the 4 oxygen molecules and 1 DPG molecule.
Constant temperature molecular dynamics simulations were used to sample the landscapes. 30
simulations were ran for each effector bound and unbound landscape at 3 different rAS (6, 9, and 12 Å
for oxygen and 9, 15, and 18 Å for DPG). In each simulation, the system was first equilibrated starting
from a perturbed structure that is an interpolation between the input crystal structures (2DN2 and
2DN1 or 1B86) and then simulated for 6 nanoseconds using three femtosecond time steps and
velocity rescaling every 200 steps. Appropriate velocity rescaling ensures energy conservation within
the system and is necessary to avoid artifacts from energy dissipation. Artifacts rarely occur because
AllosMod’s smooth energy landscape facilitates rapid equilibration. The simulations are likely to be
Page 5 of 42
ACS Paragon Plus Environment
The Journal of Physical Chemistry
123456789101112131415161718192021222324252627282930313233343536373839404142434445464748495051525354555657585960
6
effectively longer than 6 nanoseconds of real time, primarily because of the absence of damping by
the solvent and electrostatic interactions occurring in the real system42.
Assigning substates and microstates: QIdiff
Substates and microstates within the simulation structural ensembles are assigned based on QIdiff
that is calculated over one or more residues. QIdiff is defined as (Qe+ - Qe-) / (1 - ΔQ), where Q is the
overall fold similarity43 to the effector bound (e+) or the unbound (e-) crystal structure and ΔQ is the
structural similarity (Q) between the effector-bound and unbound crystal structures:
.
The summation is over all contacting pairs of sequentially non-adjacent residues; two residues are in
contact when the average side chain atom positions are less than 11 Å apart. N is the number of
contacts, is the distance between average side chain atom positions for residues i and j in structure
t, and σij is 2 Å.
QIdiff(i) is a distance metric that describes the local environment of residue i; it is positive if a residue
configuration is closer to the effector bound structure than to the effector unbound structure and
negative otherwise20. We assign the effector bound or unbound substate with QIdiff calculated using
all residues in all oxygen binding sites. Microstates are assigned with QIdiff calculated using all
residues at each oxygen binding site. The oxygen binding site is defined as all residues with average
side chain atom positions less than 11 Å from any oxygen atom in the crystal structure.
Machine-learning based on simulation trajectories: allostery mutation effects
Prediction of a mutation effect is made by a machine-learning algorithm that is based on relating
experimentally characterized mutations to structures from our allostery model simulations21. Each
mutation effect prediction reflects 37 features, including those based on molecular mechanics energy
functions, entropy calculations, stereochemical effects, mutation properties, and predictions of
coupling between sites. These features capture local properties of the mutation and global properties
of the entire system. To train the method, we use a boosted decision tree regression algorithm,
Page 6 of 42
ACS Paragon Plus Environment
The Journal of Physical Chemistry
123456789101112131415161718192021222324252627282930313233343536373839404142434445464748495051525354555657585960
7
available in the “Toolkit for Multivariate Data Analysis” as part of Root44, to relate a set of
experimentally measured mutation effects to the corresponding 37 features. For hemoglobin, we train
the decision tree on 9 unrelated proteins (152 mutations). While the 9 proteins differ in protein
function and experimental data types, mutation effects are defined for hemoglobin to be the ΔΔG of
the oxygen dissociation reaction: ΔΔG’oxy = ΔGmut – ΔGwt = RT log(Kdwt / Kd
mut), which directly
measures the equilibrium shift between the oxy and deoxy conformational substates21. Note that Kdwt
and Kdmut are measured in the same solvent conditions. For oxygen binding, Kd is P50n where P50 is
the midpoint of the oxygen dissociation reaction and n is the Hill coefficient, which is set to 2.7. For
DPG binding, ΔΔG’DPG = -RT log(Kdwt / Kd
mut) where Kd is the dissociation constant of DPG. The
negative sign allows direct comparison of the effects of DPG (an inhibitor of oxygen binding) and
oxygen.
Spatial density calculation: assessing the contribution of each binding site to the overall impact of
mutation on oxygen binding (ΔΔGoxy)
In systems with multiple effector binding sites, mutations may have complicated effects on the
allosteric transition because of the coupling between the sites. The spatial density calculation allows
mutation effects to transmit further in less dense regions of the protein than in more dense regions.
We therefore combine separate predictions (ΔΔG’oxy and ΔΔG’poly) into a single prediction of a
mutation’s effect on the oxygen binding equilibria (ΔΔGoxy) using a Boltzmann-like average based on
the spatial density (SD):
where both summations (i and lig) iterate over the 5 binding sites, MElig is the mutation effect
calculated from the trajectory with the effector lig (ΔΔG’oxy or ΔΔG’DPG), SD is the spatial density, and
0.0005 allows smooth interpolation between multiple MElig values. SD is based on the atomic density
of the region between the ligand and mutation site, calculated from the ligand bound crystal structure:
Page 7 of 42
ACS Paragon Plus Environment
The Journal of Physical Chemistry
123456789101112131415161718192021222324252627282930313233343536373839404142434445464748495051525354555657585960
8
where rligand is the distance between the mutated average side chain’s atom position and the ligand,
Natoms is the number of non-hydrogen atoms in the region defined by the intersection of the 2 spheres
with radius rligand centered on either the mutation site or the ligand, and Rg is the radius of gyration of
the atoms in that region. Heme atoms are counted in Natoms if the heme is directly in-between the
ligand and mutation site, which allows for mutants on the oxygen-proximal side of the heme to have
more of an effect on binding than mutants on the oxygen-distal side. F is a sigmoidal function that is
parameterized to ensure a smooth transition of the spatial density at long distances to a value of
0.105, which is the maximum density at 30 Å calculated using 10 representative crystal structures
other than hemoglobin. Residues 30 Å from the binding site are more likely to be affected by intra-
protein contacts than ligand binding, imposing the range on our spatial density calculations.
Relating the impacts of a mutation on allostery (ΔΔGoxy) and polymerization (ΔΔGpoly)
To facilitate a discussion of coupling between allostery and polymerization, we need a simple model
of thermodynamic equilibrium involving all relevant hemoglobin states. The prediction of a mutation’s
impact on the oxygen binding equilibria (ΔΔGoxy) could be used to hypothesize its corresponding
impact on polymerization, based on the following thermodynamic equilibrium at a given oxygen partial
pressure and other conditions: , where “R” corresponds to the
oxy substate (i.e., the oxy quaternary structure, with or without oxygen), “T” corresponds to the deoxy
substate (i.e., the deoxy quaternary structure), and Ti corresponds to an aggregate with i monomers;
note that the stoichiometry is omitted for visual clarity. When concentrations of monomers and
polymers are equal (i.e., at the polymerization critical concentration), we approximate the equilibrium
as , where n is the size of the effective aggregate. The effective aggregate represents,
as an approximation, a minimal aggregate that forms at the critical concentration; in principle, the
effective aggregate should not be stable below the critical concentration, and larger polymers should
be stable above the critical concentration. The left side of the equation can describe a mutation’s
impact on the allosteric conformational equilibrium and right side of the equation can describe a
mutation’s impact on the stability of the effective aggregate, which represents experimental
measurement of a shift in the critical concentration. The effective aggregate size can be as large as
the polymerization nucleus; aggregates smaller than the nucleus are not stable. Given the simplified
equilibrium, a mutation that impacts allostery also impacts polymerization as follows:
Page 8 of 42
ACS Paragon Plus Environment
The Journal of Physical Chemistry
123456789101112131415161718192021222324252627282930313233343536373839404142434445464748495051525354555657585960
9
. This equation allows us to relate allostery to polymerization by
expressing the concentration of unbound hemoglobin quaternary structure (T) as a function of the
free energy difference between the oxy and deoxy substates for the wild type (ΔGoxy) and the impact
of mutation on the equilibrium between the oxy and deoxy substates (ΔΔGoxy). The hypothetical
impact of allostery on polymerization is plotted for discrete values of ΔGoxy and for a given value of n:
The estimates of the nucleus size vary from 10 to 100 and can change dramatically in different
solvent conditions, in part due to changes of the polymerization mechanism45,46. Hemoglobin
aggregation is a multistep process that begins with homogeneous polymerization and is followed by
heterogeneous polymerization, which involves new polymers nucleating from existing polymers5,47.
Varying solvent conditions and temperature can shift the ratio of the polymerization types46.
The ΔΔGpoly equation can be used to create limiting models of the coupling between allostery and
polymerization. These limiting models represent all ways the equation could possibly fit the data.
Therefore, if the deviation between the data and limiting models is greater than experimental and
computational error, there is no set of parameters that would allow the equation to fit the data.
Limiting models are obtained by maximizing the range of ΔΔGpoly as a function of ΔΔGoxy; we do this
by fixing n to an arbitrary value between 10 and a very large number, and selecting discrete values of
ΔGoxy. In other words, varying ΔGoxy has a stronger effect on the ΔΔGpoly equation than varying n. The
conclusions presented here are not affected by changing n so long as we also select discrete values
of ΔGoxy.
Measured impact of mutations on polymerization
Polymerization data were collected from several studies based on 4 techniques. Each experiment
directly or indirectly measures changes in the concentration of HbS critical for polymerization: 1)
solubility midpoint measured by ultracentrifugation (csat)10,11,13, 2) hemoglobin concentration at which
oxygen binding affinity drops rapidly (c*)10,12-14, 3) solubility at a high ionic strength of 2 M phosphate
(s)9, and 4) ionic strength at which the solubility is 10-5 M (i)8. Based on the simplified equilibria
described above, polymerization mutation effects are defined as ΔΔGpoly = nλRT log(Xwt / Xmut), where
Page 9 of 42
ACS Paragon Plus Environment
The Journal of Physical Chemistry
123456789101112131415161718192021222324252627282930313233343536373839404142434445464748495051525354555657585960
10
X is one of the experimental data, λ is a correction factor, and n is the effective aggregate size. As
discussed in the previous section, we can vary n to an arbitrary value greater than 10 without
affecting the coarse conclusions presented here. Xwt and Xmut are measured in the same solvent
conditions. The correction factor λ attempts to account for different data types. The factor is set by
minimizing the difference between mutation effects measured for chemically similar mutations at the
same site: 1 for csat, 1 for c*, 0.13 for s, and 1.17 for i. For a given value of λ, ΔΔGpoly for one
experimental method correlates with the ΔΔGpoly for any other experimental method when comparing
chemically similar mutations.
Prediction error
Experimental error is the difference between a measured value of quantity and its true value (Oxford
Dictionary definition); similarly, computational error is the difference between a prediction and its true
value. These errors must be considered to assess the significance of the experimental results and
predictions. Next, we estimate the experimental and computational errors, demonstrating that the
errors are small enough to justify the conclusions.
Experimental error in ΔΔGoxy is approximated with the precision of a set of experimental
measurements. To maximize the use of data and thus coverage, for any given ΔΔGoxy estimate, this
set includes measurements at different, uncertain, or even unknown pH values, temperatures, ionic
strengths, and effector concentrations. Of these, temperature and pH can be the most impactful on
hemoglobin oxygen binding and can contribute to experimental error when not precisely specified,
due to systematic changes in hemoglobin structure and dynamics36. They can each be estimated
from the linear relationships between free energy and either pH or temperature48, respectively. The
average difference between experiments is about 0.3 pH units and 8 oC, which would yield errors in
ΔΔGoxy of 0.3 kBT and 0.4 kBT, respectively. For the other variable conditions, we can estimate
experimental error of ΔΔGoxy using measurements of chemically similar mutations at the same site,
which presumably reflect primarily the varying experimental conditions. We define a pair of mutants to
be chemically similar if they are alike in terms of size (difference in the number of heavy atoms is two
or less) and charge (positive, negative, or neutral); thus, chemically similar groups are (Asp, Glu),
(Arg, His, Lys), (Tyr, Phe, Trp), and (Val, Ala, Ile, Leu, Met, Ser, Thr, Asn, Gln, Cys). The average
unsigned difference between all pairs of ΔΔGoxy for chemically similar mutations is 0.2 kBT for whole
blood samples and 0.9 kBT for purified hemoglobin. The larger error for purified hemoglobin may
Page 10 of 42
ACS Paragon Plus Environment
The Journal of Physical Chemistry
123456789101112131415161718192021222324252627282930313233343536373839404142434445464748495051525354555657585960
11
reflect the increased sensitivity of measurements to relevant environmental conditions. An example is
the low oxygenation midpoint (P50) that scales similarly to the Hill coefficient (n), thus potentially
resulting in larger uncertainty in measuring dissociation constants (P50n) for purified HbA [(5 tor)2.9]
than for whole blood HbA [(27 tor)2.7] (ref. 49). Also, purified hemoglobin experiments are typically
performed using phosphate buffer, which is known to affect hemoglobin dynamics differently than
whole blood. Purified hemoglobin data is therefore not used in the analysis. Similarly, the average
unsigned difference between all pairs of ΔΔGpoly for chemically similar mutations is 1.4 kBT. In
summary, the experimental error as defined here may be as much as 0.9 kBT for ΔΔGoxy and 1.4 kBT
for ΔΔGpoly.
Computational error is estimated as the average difference between ΔΔGoxy predictions and
experimentally measured values, which was 1.3 kBT in our previous study of allosteric proteins in
general21 and is 0.8 kBT in the current study. In comparison, the experimentally measured range of
ΔΔG’s for a mutation’s impact on hemoglobin oxygen binding is 6 kBT (see Results)21. Also, the
difference between ΔΔGoxy and the hypothetical curves describing the relationship between allostery
and polymerization is greater than 1 kBT for ΔΔGoxy and greater than 5 kBT for ΔΔGpoly. Thus,
experimental measurements and computational predictions may be sufficiently accurate to be useful.
We calculate the likelihood of accurately predicting mutation effects using an error score empirically
derived from our previous study21. The features that increase error, from least to most, are: 1) wild
type residue is charged, 2) mutation to a charged residue, 3) mutation increases side chain size by 3
or more atoms, and 4) mutation is less than 8 Å from binding site. The error score is a sum of factors
pertaining to these features: 0.2, 0.5, 1.0, and 2.0. A score of less than 1.3 implies a mutation effect
prediction that should be on average less than 1 kBT from the correct value. Mutations with scores of
greater than 1.3 are omitted from analysis to avoid large outliers.
Predicting druggable binding pockets
We predict druggable pockets by applying the program FPocket50 to snapshots from the oxygen
bound and unbound AllosMod simulations (600 each). The FPocket druggability score was obtained
by machine-learning optimization against a dataset of holo and apo crystal structures. Here, we
create a residue specific score, di, which is the druggability of the most druggable pocket that has a
vertex, which FPocket uses to identify pockets, within rcutoff of the residue’s average side chain atom
Page 11 of 42
ACS Paragon Plus Environment
The Journal of Physical Chemistry
123456789101112131415161718192021222324252627282930313233343536373839404142434445464748495051525354555657585960
12
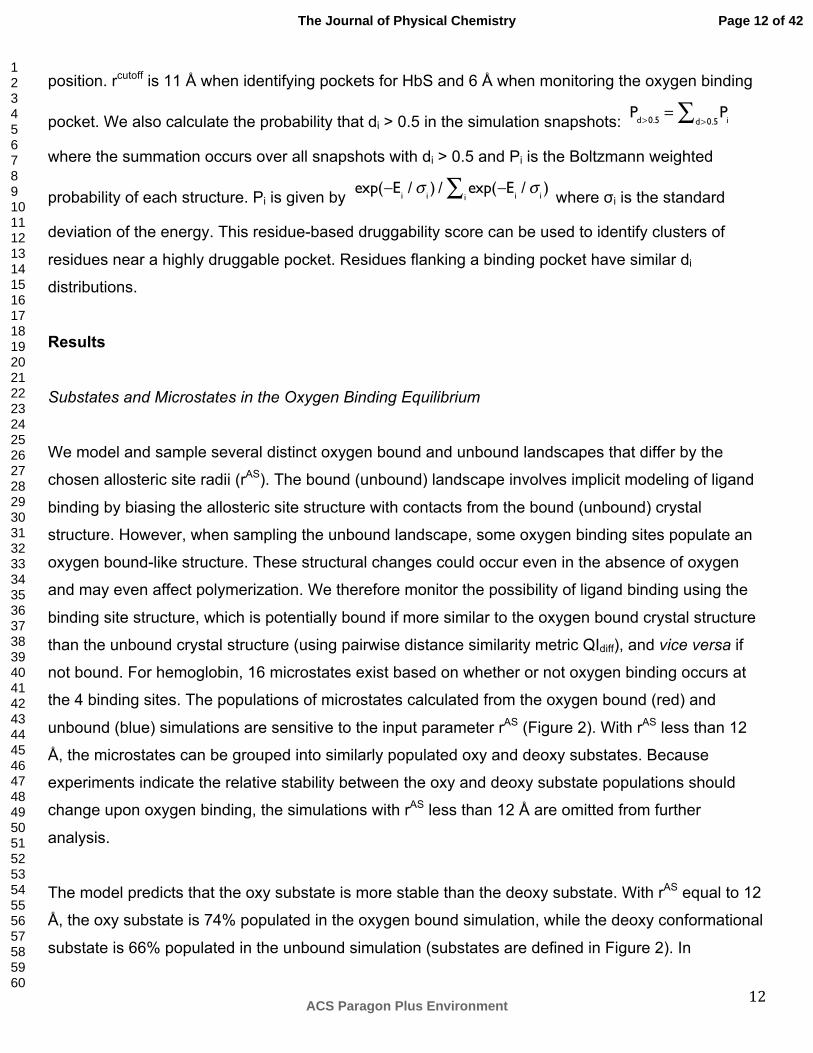
position. rcutoff is 11 Å when identifying pockets for HbS and 6 Å when monitoring the oxygen binding
pocket. We also calculate the probability that di > 0.5 in the simulation snapshots:
where the summation occurs over all snapshots with di > 0.5 and Pi is the Boltzmann weighted
probability of each structure. Pi is given by where σi is the standard
deviation of the energy. This residue-based druggability score can be used to identify clusters of
residues near a highly druggable pocket. Residues flanking a binding pocket have similar di
distributions.
Results
Substates and Microstates in the Oxygen Binding Equilibrium
We model and sample several distinct oxygen bound and unbound landscapes that differ by the
chosen allosteric site radii (rAS). The bound (unbound) landscape involves implicit modeling of ligand
binding by biasing the allosteric site structure with contacts from the bound (unbound) crystal
structure. However, when sampling the unbound landscape, some oxygen binding sites populate an
oxygen bound-like structure. These structural changes could occur even in the absence of oxygen
and may even affect polymerization. We therefore monitor the possibility of ligand binding using the
binding site structure, which is potentially bound if more similar to the oxygen bound crystal structure
than the unbound crystal structure (using pairwise distance similarity metric QIdiff), and vice versa if
not bound. For hemoglobin, 16 microstates exist based on whether or not oxygen binding occurs at
the 4 binding sites. The populations of microstates calculated from the oxygen bound (red) and
unbound (blue) simulations are sensitive to the input parameter rAS (Figure 2). With rAS less than 12
Å, the microstates can be grouped into similarly populated oxy and deoxy substates. Because
experiments indicate the relative stability between the oxy and deoxy substate populations should
change upon oxygen binding, the simulations with rAS less than 12 Å are omitted from further
analysis.
The model predicts that the oxy substate is more stable than the deoxy substate. With rAS equal to 12
Å, the oxy substate is 74% populated in the oxygen bound simulation, while the deoxy conformational
substate is 66% populated in the unbound simulation (substates are defined in Figure 2). In
Page 12 of 42
ACS Paragon Plus Environment
The Journal of Physical Chemistry
123456789101112131415161718192021222324252627282930313233343536373839404142434445464748495051525354555657585960
13
comparison, low rAS results in similarly populated substates, which indicates that the unequal
populations at high rAS are not an artifact of substate assignment. The unequal substate populations
at high rAS conflict with the equivalent relative stabilization energy in landscapes with the same rAS, in
which the oxy crystal structure should be favored in the oxygen bound landscape by the same
amount as the deoxy crystal structure in the unbound landscape. In this case, entropy drives the
stability of the oxy substate because there are more ways to satisfy oxygen bound conformations
than unbound conformations. This stability difference is consistent with previous molecular dynamics
studies51,52 and predictions from a Gaussian network model that the carbon monoxide bound
structure (similar to that with oxygen bound) is entropically more stable than the unbound structure53.
The simulations also predict varying populations of microstates. The fully oxygen bound microstate is
dominant in the oxygen bound simulation, while the fully unbound microstate is never dominant
(Figure 2). In transition from the unbound (bound) microstate to the single-oxygen (triple-oxygen)
bound microstate, the α subunits are more likely than the β subunits to be oxygenated
(deoxygenated). This result is consistent with a study of the unbound crystal that found a stronger
preference for oxygenation of the α subunits compared to the β subunits54. The simulations may
provide an explanation for this observation. We find that the α subunit oxygen binding site
conformational ensembles differ only slightly between the oxygen bound and unbound simulations
(Figure 3). In contrast, the β subunit oxygen binding sites populate distinct conformational ensembles
in the oxygen bound and unbound simulations, in agreement with a previous study51. Therefore, the β
subunits may be most important for determining the oxygen binding state while the α subunits
undergo relatively modest changes in conformation and oxygen binding.
Predicting the impact of mutation on oxygen binding: ΔΔGoxy
Allosteric coupling in hemoglobin involves one DPG binding site and four oxygen binding sites.
Allostery occurs because the four oxygen binding sites are coupled to the tertiary/quaternary structure
and therefore oxygen binding at one site positively modulates binding at another site. This positive
cooperativity is broken by a single DPG ligand that has strong binding affinity to a pocket in the
unbound conformation. The DPG binding pocket is more highly solvated than most binding pockets
and contains residues not supported by a dense network of interactions (Figure 4D), which makes
DPG binding relatively susceptible to perturbations, such as mutations.
Page 13 of 42
ACS Paragon Plus Environment
The Journal of Physical Chemistry
123456789101112131415161718192021222324252627282930313233343536373839404142434445464748495051525354555657585960
14
We predict impact of mutations on the binding of oxygen or DPG. As described previously21, we
define a mutation effect as the free energy change of ligand binding due to mutation (ΔΔG’oxy and
ΔΔG’poly in Figure 1). Each mutation effect prediction requires features that either describe the
mutation itself or are calculated from the simulations of the allostery model of HbA (Methods). A given
mutation effect is relatively accurately predicted using either the oxygen binding or DPG binding
simulations (Figure 4A-B). The results show that mutation effects far from the DPG binding site
(greater than 20 Å) are well predicted using the oxygen bound simulations and the remaining effects
are well predicted using the DPG bound simulations (average unsigned error of 0.70 kBT and 0.96
kBT, respectively). This trend may indicate that a mutation impacts the DPG binding site at further
distances than for an oxygen binding site. If so, there must be a physical explanation for how
mutations affect one binding site more than another. We propose such an explanation, as follows.
The atomic density surrounding ligand binding sites can be used to assess the contribution of each
binding site to the overall impact of a mutation on oxygen binding. We use a spatial density
calculation, which allows mutation effects to transmit further in less dense regions of the protein than
in more dense regions (Methods), to combine separate predictions (ΔΔG’oxy and ΔΔG’poly) into a
single prediction of a mutation’s impact on the oxygen binding equilibria (ΔΔGoxy). In support of this
approach, we previously analyzed mutation effects on binding sites from 10 different proteins21. While
significant mutation effects on ligand binding (> 2 kBT) generally occur at sites within 8 Å of the ligand,
we observed here that significant mutation effects on hemoglobin oxygen binding regularly occur at
sites much further than 8 Å from oxygen or DPG. Our spatial density calculation exploits the fact that
the atomic density of the region within 20 Å of the DPG binding site is similar to the density of the
region within 8 Å of a typical binding site (Figure 4D). Using the spatial density calculation, our
combined predictions yield an average unsigned error of 0.84 kBT and a 0.76 Pearson correlation
coefficient with experiment (Figure 4C).
Impact of mutations on allostery and polymerization
Allostery is coupled to polymerization because polymers consist of hemoglobin in the unbound
quaternary structure. We can approximate the equilibria between oxyhemoglobin, deoxyhemoglobin,
and aggregates using a simplified equation (Methods). This approach effectively provides limiting
hypotheses about how the impact of a mutation on allostery could be coupled to its corresponding
impact on polymerization.
Page 14 of 42
ACS Paragon Plus Environment
The Journal of Physical Chemistry
123456789101112131415161718192021222324252627282930313233343536373839404142434445464748495051525354555657585960
15
However, there is uncertainty regarding the propensity of conformational fluctuations that occur in the
absence of oxygen (i.e., the conditions of some polymerization experiments). Studies of gel
encapsulated hemoglobin in deoxygenated conditions demonstrate carbon monoxide rebinding
kinetics that suggest multiple conformations (not a single T state structure), including at least one that
binds oxygen with a higher affinity than the T state55. In fact, this state (T-high) is thought to be on
pathway between the R and T structures55. This data is consistent with other results that suggest a
transiently stable R-like conformation in deoxy conditions: 1) the oxy substate is predicted to be more
stable than the deoxy substate in other computational studies51-53 in addition to the work presented
here and 2) the existence of a deoxyhemoglobin crystal structure in the oxygen bound conformation
with a well-structured but empty oxygen binding pocket56. In contrast, a two state model (T and T
aggregate) does fit polymerization data, suggesting that the allosteric transition is unnecessary to
interpret the data57. For polymerization experiments in deoxy conditions, the conformational changes
induced by mutation within a single tetramer are not well characterized. For example, if adding a
small oxygen molecule can shift the equilibrium between the R and T structures sufficiently to impact
polymerization, so could in principle a single point mutation.
We therefore use the simplified equilibrium outlined in Methods to hypothesize about the coupling
between mutation impacts on allostery and polymerization (hypothetical curves in Figure 5). The
curves are plotted at different relative stabilities between the oxy and deoxy substates, representing
varying oxygen pressure or concentrations of allosteric effectors, for an arbitrary value of n = 30
(Methods). We also plot a set of experimentally measured HbS mutations58, using the measured
polymerization mutation effects (ΔΔGpoly) and the predicted allostery mutation effects (ΔΔGoxy). Here,
we assume that all HbS mutations are uncoupled to β-Glu6Val. The difference between the data and
the hypothetical curves is larger than the computational and experimental errors. For example, many
mutations are predicted to decrease hemoglobin oxygen affinity, while the corresponding experiments
indicate the mutations inhibit polymerization. Thus, our simplified equilibrium cannot fit the data for
most mutations, suggesting that (i) most of the mutations disrupt a polymerization interface directly
without an impact on oxygen binding and/or (ii) the population of the oxy substate of the mutant is
small because most of the experiments are performed in deoxygenated conditions. The first
suggestion is supported by the location of many mutations on the protein surface near interfaces
between tetramers in the crystal structure. The second suggestion is supported by the dominance of
the deoxy substate of the native hemoglobin under the conditions of experiment. However, a clear
Page 15 of 42
ACS Paragon Plus Environment
The Journal of Physical Chemistry
123456789101112131415161718192021222324252627282930313233343536373839404142434445464748495051525354555657585960
16
picture requires additional thermodynamic and structural data for the mutants under a broader set of
experimental conditions.
Druggable binding pockets that can be used to affect polymerization
We can identify sites of mutations that perturb polymerization and then predict potentially druggable
binding pockets near these sites, many of which are close to a protein-protein interface in the HbS
crystal59. We predict druggable pockets by applying the program FPocket50 to the structures from our
allostery model simulations. Due to structural changes, pockets grow and disappear during the
simulation trajectories, thereby making pocket identification non-trivial. We therefore create a residue
specific score di, which is the druggability of the most druggable pocket within a cutoff distance of
residue i (Methods). We can predict druggable pockets using di distributions calculated from
simulation trajectories.
We identify three druggable pockets near mutations that perturb polymerization. These pockets are
also near tetramer-tetramer interfaces in the HbS crystal structure (Figure 6). Pocket 3 has a bimodal
di distribution indicating distinct conformations sampled in the simulation (Figure 7A). In comparison,
pockets 1 and 2 have unimodal distributions and are more likely to form druggable pockets. Pockets 1
and 2, however, may not be better targets than pocket 3, which is (i) more druggable in
deoxyhemoglobin than oxyhemoglobin, (ii) adjacent to sites of mutations predicted to decrease
oxygenation, and (iii) adjacent to sites of mutations predicted to significantly decrease polymerization.
Therefore, a ligand may bind specifically to pocket 3 in deoxyhemoglobin and inhibit a polymerization
interface.
Pocket prediction using simulation trajectories can be advantageous in the case of dynamic proteins
such as hemoglobin. For instance, ligand binding pockets can form transiently even if no pockets
exist in the crystal structure60. Even in the absence of significant structural change, ligand binding
prediction based on structural ensembles can be more accurate than predictions based on a single
structure61,62. In hemoglobin, pockets populate slightly expanded conformations in the simulation
trajectories compared to the crystal structure (Figure 6). These expanded conformations could be
favored upon ligand binding and in turn perturb an interface in the HbS polymer. In the simulation
trajectories, pocket 3 occurs in such an expanded conformation and is predicted to be much more
Page 16 of 42
ACS Paragon Plus Environment
The Journal of Physical Chemistry
123456789101112131415161718192021222324252627282930313233343536373839404142434445464748495051525354555657585960
17
druggable than the corresponding location in the crystal structure (Figure 7B). In contrast, pockets 1
and 2 maintain druggability in the simulation trajectories and the crystal structures.
Discussion
The original descriptions of allostery in general as well as hemoglobin in particular were
phenomenological and rooted in experimental data. The dominant states of hemoglobin, favored with
and without oxygen (R and T, respectively), were determined by X-ray crystallography. The KNF
mechanism, shown to be inadequate for hemoglobin, hypothesized that oxygen binding induces a
concerted change from T to R3. The MWC mechanism hypothesized that there is a structural
equilibrium between R and T, and that oxygen binding promotes the R state, effectively allowing
oxygen binding in both the oxygen bound and unbound structures. Subsequent more intricate models
accounted for structural details such as salt bridges that contribute to pH dependence of hemoglobin
oxygen binding (known as the Bohr effect)63-65.
More recent descriptions of allostery rely not only on the crystal structures but also broader
conformational ensembles37-40. In fact, several structural states of hemoglobin other than R and T
have been identified66. While the MWC and KNF mechanisms do not explicitly describe structural
ensembles, they are generally consistent with the population shift and induced fit mechanisms,
respectively. A clear divergence from the purely structural view of allostery is entropy driven
allostery67. This mechanism describes dynamic coupling between sites in which the average structure
remains unchanged, but includes different excursions from the average structure in the bound and
unbound states.
Phenomenological mechanisms explicitly relate structural details to experimental observables. For
instance, the MWC and related mechanisms2,64,65 explain measured subunit oxygen binding affinities
using the quaternary structure. Another mechanism, called TTS, decouples subunit tertiary structure
from the quaternary structure5, thereby allowing subunits to adopt the R or T conformations without a
quaternary structure change. The TTS mechanism is consistent with our approach of assigning one
of two substates to the binding site structure, which in our model moderately correlates with the
subunit tertiary structure (correlation coefficient of 0.5 if using QIdiff).
Page 17 of 42
ACS Paragon Plus Environment
The Journal of Physical Chemistry
123456789101112131415161718192021222324252627282930313233343536373839404142434445464748495051525354555657585960
18
Here, we rely on a model of hemoglobin allostery defined by its energy landscape rather than a
phenomenological mechanism. The inputs to our model are the effector bound and unbound crystal
structures and the parameter rAS that controls how strongly effector binding influences the energy
landscape. The output is a set of energy landscapes with minima corresponding to the effector bound
and bound crystal structures as well as the corresponding simulated trajectories. These trajectories
describe the transition between the input structures and can describe new conformations that are
distinct from the input structures. The trajectories are then used to predict (i) the impact of a mutation
on oxygen or DPG binding, (ii) the relative populations of substates and microstates, and (iii) the
magnitude of coupling between sites.
Our simulations describe weak coupling between hemoglobin’s oxygen binding sites. Such behavior
has also been reported in molecular dynamics simulations51,52,68-70, elastic network models53,71, and
an experimental study of gel encapsulated hemoglobin that separately mapped tertiary and
quaternary structure changes72. Weak coupling involves oxygen binding at one site triggering both
tertiary and quaternary structural changes, which in turn result in changes of the size and shape of
the other oxygen binding pockets. Binding site dynamics is not homogeneous, however, as indicated
by the stronger coupling of the quaternary structure with the oxygen binding sites in the β subunits
than in the α subunits (Figure 3). This result is consistent with experiments that report a larger impact
on oxygen binding for mutations in the β subunits than for mutations in the α subunits (average
magnitude of 1.5 ± 0.6 kBT and 0.5 ± 0.5 kBT, respectively). Therefore, modulation of hemoglobin’s
allosteric transition may well be achieved by perturbing the interface between the two β subunits.
Interestingly, such a perturbation has resulted from evolution that positioned the DPG binding pocket
at the β subunit interface.
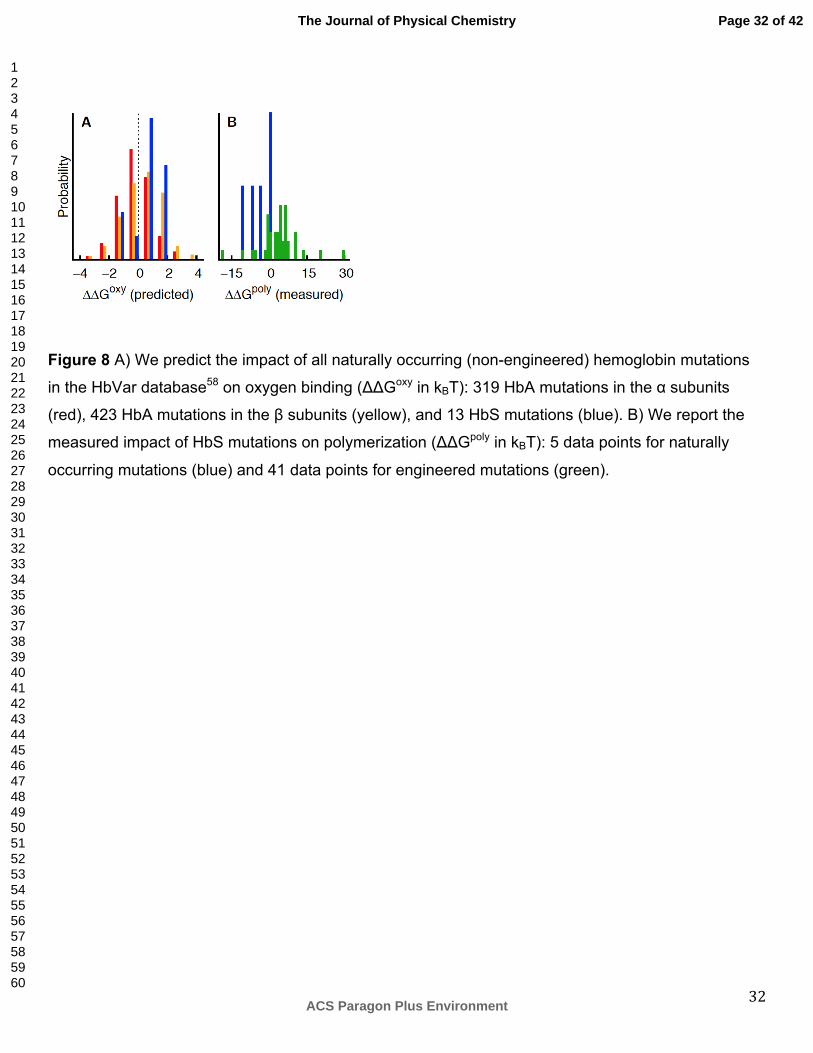
Hemoglobin has evolved to have a complex allosteric mechanism, yet also permits point mutations at
many sites. Our predictions suggest that naturally occurring mutations58 can be tolerated due to
hemoglobin’s structural symmetry (Figure 8). We predict α subunit mutations to typically inhibit
oxygen binding, which can counteract β subunit mutations that we predict to typically promote oxygen
binding (Figure 8A). Natural HbS mutations (those that occur in patients with β-Glu6Val)58 display an
even stronger predicted trend of increased oxygen binding than the β subunit mutations (Figure 8A).
These HbS mutations may improve hemoglobin’s oxygen delivery if they shift the equilibrium to the
oxy state, thus sufficiently reducing polymerization, but do not increase oxygen affinity too much so
that sufficient oxygen is still released.
Page 18 of 42
ACS Paragon Plus Environment
The Journal of Physical Chemistry
123456789101112131415161718192021222324252627282930313233343536373839404142434445464748495051525354555657585960
19
One might expect the sickle cell mutation to be selected out of the human population, but the HbS
allele persists, possibly at least in part because it allows malaria resistance73. In fact, the HbS allele
occurs in 18% of some populations that suffer from a high frequency of malaria. Unfortunately, the
detailed mechanism of resistance is not known. Some insight is gained by considering the impact of 5
naturally occurring HbS mutations on polymerization. These 5 mutants tend to increase
polymerization even though most HbS mutants decrease polymerization (Figure 8B). If caused by
selective pressure, this result suggests that malaria resistance is a direct result of polymerization,
which either promotes red blood cell destruction or kills parasites more directly74,75. Because we
predict two of these HbS mutations to also recover oxygen binding inhibited by polymerization (Figure
5), evolution may be improving hemoglobin’s ability to transport oxygen while simultaneously
increasing hemoglobin’s tendency for polymerization.
Interpreting the role of a mutation on hemoglobin dynamics is a challenge because so many
processes can occur simultaneously and inter-dependently. A mutation may impact (i) oxygen
binding, (ii) binding of DPG or other effectors, (iii) the allosteric conformational equilibrium between
oxy and deoxy substates, (iv) pH or temperature induced conformational changes, and (v)
polymerization. Here, we use a model that describes the allosteric conformational transition, yet
without an atomic structural modeling of interactions between hemoglobin and any of its ligands.
Nevertheless, the relative accuracy of our predictions (Figure 4C) supports the model; moreover,
most naturally occurring mutations are unlikely to affect oxygen binding without affecting the allosteric
transition, because they are located far from the oxygen binding sites (98 % greater than 5 Å and 92
% greater than 8 Å). A more detailed model is, however, necessary to predict a mutation’s impact on
the binding affinity within the oxy substate. Similarly, a detailed model of polymerization is necessary
to characterize the role of any mutation in aggregation. Thus, our model of allostery may be a
convenient stepping stone to these more explicit models.
Conclusion
Hemoglobin exists in a conformational equilibrium, involving allostery and polymerization, that is
affected by mutations and conditions such as oxygen and DPG concentration, pH, and temperature48.
Using separate landscapes for each ligand-induced conformational change, the prediction allows us
to further interpret experimental data. In particular, we identify 3 binding sites that can potentially be
Page 19 of 42
ACS Paragon Plus Environment
The Journal of Physical Chemistry
123456789101112131415161718192021222324252627282930313233343536373839404142434445464748495051525354555657585960
20
used to inhibit HbS aggregation by destabilizing a polymerization interface. These sites might be
more effective than sites that are distant to polymerization interfaces because ligand binding effects
tend to dissipate at long distances. In conclusion, mutations can serve as natural probes of function
and may help identify ligand binding pockets that can be used to perturb allosteric proteins such as
hemoglobin.
Acknowledgments
We are grateful for helpful discussions with Charles Homcy, Matt Jacobson, William Eaton, Natalia
Khuri, Seung Joong Kim, and Riccardo Pellarin. We also thank the reviewers for many critical
comments that improved the manuscript during the journal review process. The work was supported
by an NIH grant R01 GM083960.
Page 20 of 42
ACS Paragon Plus Environment
The Journal of Physical Chemistry
123456789101112131415161718192021222324252627282930313233343536373839404142434445464748495051525354555657585960
21
References 1. Pauling, L.; Itano, H. A., Sickle Cell Anemia a Molecular Disease. Science 1949, 110, 543-548. 2. Monod, J.; Wyman, J.; Changeux, J. P., On Nature of Allosteric Transitions - a Plausible Model. J Mol Biol 1965, 12, 88-118. 3. Koshland, D. E.; Nemethy, G.; Filmer, D., Comparison of Experimental Binding Data and Theoretical Models in Proteins Containing Subunits. Biochemistry 1966, 5, 365-368. 4. Huang, Z. M.; Zhu, L. A.; Cao, Y.; Wu, G.; Liu, X. Y.; Chen, Y. Y.; Wang, Q.; Shi, T.; Zhao, Y. X.; Wang, Y. F.; et.al., ASD: A Comprehensive Database of Allosteric Proteins and Modulators. Nucleic Acids Res 2011, 39, D663-D669. 5. Henry, E. R.; Bettati, S.; Hofrichter, J.; Eaton, W. A., A Tertiary Two-State Allosteric Model for Hemoglobin. Biophys Chem 2002, 98, 149-164. 6. Knapp, J. E.; Pahl, R.; Srajer, V.; Royer, W. E., Allosteric action in real time: Time-resolved Crystallographic Studies of a Cooperative Dimeric Hemoglobin. Proc Natl Acad Sci U S A 2006, 103, 7649-7654. 7. Cui, Q.; Karplus, M., Allostery and Cooperativity Revisited. Protein Sci 2008, 17, 1295-307. 8. Benesch, R. E.; Yung, S.; Benesch, R.; Mack, J.; Schneider, R. G., Alpha-Chain Contacts in Polymerization of Sickle Hemoglobin. Nature 1976, 260, 219-221. 9. Benesch, R. E.; Kwong, S.; Benesch, R.; Edalji, R., Location and Bond Type of Intermolecular Contacts in Polymerization of Hemoglobin-S. Nature 1977, 269, 772-775. 10. Benesch, R. E.; Kwong, S.; Edalji, R.; Benesch, R., Alpha-Chain Mutations with Opposite Effects on the Gelation of Hemoglobin-S. J Biol Chem 1979, 254, 8169-8172. 11. Nagel, R. L.; Johnson, J.; Bookchin, R. M.; Garel, M. C.; Rosa, J.; Schiliro, G.; Wajcman, H.; Labie, D.; Moopenn, W.; Castro, O., Beta-Chain Contact Sites in the Haemoglobin-S Polymer. Nature 1980, 283, 832-834. 12. Monplaisir, N.; Merault, G.; Poyart, C.; Rhoda, M. D.; Craescu, C.; Vidaud, M.; Galacteros, F.; Blouquit, Y.; Rosa, J., Hemoglobin-S Antilles - a Variant with Lower Solubility Than Hemoglobin-S and Producing Sickle-Cell Disease in Heterozygotes. Proc Natl Acad Sci U S A 1986, 83, 9363-9367. 13. Dellano, J. J. M.; Manning, J. M., Properties of a Recombinant Human Hemoglobin Double Mutant - Sickle Hemoglobin with Leu-88(Beta) at the Primary Aggregation Site Substituted by Ala. Protein Sci 1994, 3, 1206-1212. 14. Li, X. F.; Himanen, J. P.; de Llano, J. J. M.; Padovan, J. C.; Chait, B. T.; Manning, J. M., Mutational Analysis of Sickle Haemoglobin (Hb) Gelation. Biotechnology and Applied Biochemistry 1999, 29, 165-184. 15. Fylaktakidou, K. C.; Duarte, C. D.; Koumbis, A. E.; Nicolau, C.; Lehn, J. M., Polyphosphates and Pyrophosphates of Hexopyranoses as Allosteric Effectors of Human Hemoglobin: Synthesis, Molecular Recognition, and Effect on Oxygen Release. Chemmedchem 2011, 6, 153-168. 16. Abdulmalik, O.; Ghatge, M. S.; Musayev, F. N.; Parikh, A.; Chen, Q. K.; Yang, J. S.; Nnamani, I.; Danso-Danquah, R.; Eseonu, D. N.; Asakura, T.; et.al., Crystallographic Analysis of Human Hemoglobin Elucidates the Structural Basis of the Potent and Dual Antisickling Activity of Pyridyl derivatives of vanillin (vol D67, pg 920, 2011). Acta Crystallogr D 2011, 67, 1076-1076. 17. Fitzhugh, C. D.; Unno, H.; Hathaway, V.; Coles, W. A.; Link, M. E.; Weitzel, R. P.; Zhao, X. C.; Wright, E. C.; Stroncek, D. F.; Kato, G. J.; Hsieh, M. M.; Tisdale, J. F., Infusion of Hemolyzed Red Blood Cells within Peripheral Blood Stem Cell Grafts in Patients with and without Sickle Cell Disease. Blood 2012, 119, 5671-5673. 18. Platt, O. S.; Orkin, S. H.; Dover, G.; Beardsley, G. P.; Miller, B.; Nathan, D. G., Hydroxyurea Enhances Fetal Hemoglobin Production in Sickle Cell Anemia. J Clin Invest 1984, 74, 652-656.
Page 21 of 42
ACS Paragon Plus Environment
The Journal of Physical Chemistry
123456789101112131415161718192021222324252627282930313233343536373839404142434445464748495051525354555657585960
22
19. Sankaran, V. G.; Menne, T. F.; Xu, J.; Akie, T. E.; Lettre, G.; Van Handel, B.; Mikkola, H. K.; Hirschhorn, J. N.; Cantor, A. B.; Orkin, S. H., Human Fetal Hemoglobin Expression is Regulated by the Developmental Stage-Specific Repressor BCL11A. Science 2008, 322, 1839-1842. 20. Weinkam, P.; Pons, J.; Sali, A., Structure-based Model of Allostery Predicts Coupling Between Distant Sites. Proc Natl Acad Sci U S A 2012, 109, 4875-4880. 21. Weinkam, P.; Chen, Y. C.; Pons, J.; Sali, A., Impact of Mutations on the Allosteric Conformational Equilibrium. J Mol Biol 2013, 425, 647-661. 22. Bryngelson, J. D.; Wolynes, P. G., Intermediates and Barrier Crossing in a Random Energy-Model (with applications to protein folding). J Phys Chem 1989, 93, 6902-6915. 23. Dill, K. A., Dominant Forces in Protein Folding. Biochemistry 1990, 29, 7133-7155. 24. Frauenfelder, H.; Sligar, S. G.; Wolynes, P. G., The Energy Landscapes and Motions of Proteins. Science 1991, 254, 1598-1603. 25. Zhuravlev, P. I.; Materese, C. K.; Papoian, G. A., Deconstructing the Native State: Energy Landscapes, Function, and Dynamics of Globular Proteins. J Phys Chem B 2009, 113, 8800-8812. 26. Ueda, Y.; Taketomi, H.; Go, N., Studies on Protein Folding, Unfolding, and Fluctuations by Computer-Simulation .2. 3-Dimensional Lattice Model of Lysozyme. Biopolymers 1978, 17, 1531-1548. 27. Schug, A.; Whitford, P. C.; Levy, Y.; Onuchic, J. N., Mutations as Trapdoors to Two Competing Native Conformations of the Rop-Dimer. Proc Natl Acad Sci U S A 2007, 104, 17674-17679. 28. Whitford, P. C.; Noel, J. K.; Gosavi, S.; Schug, A.; Sanbonmatsu, K. Y.; Onuchic, J. N., An All-Atom Structure-based Potential for Proteins: Bridging Minimal Models with All-atom Empirical Forcefields. Proteins: Struct, Funct, Bioinf. 2009, 75, 430-441. 29. Li, W.; Wolynes, P. G.; Takada, S., Frustration, Specific Sequence Dependence, and Nonlinearity in Large-amplitude Fluctuations of Allosteric Proteins. Proc Natl Acad Sci U S A 2011, 108, 3504-3509. 30. Weinkam, P.; Zong, C. H.; Wolynes, P. G., A Funneled Energy Landscape for Cytochrome c Directly Predicts the Sequential Folding Route Inferred from Hydrogen Exchange Experiments. Proc Natl Acad Sci U S A 2005, 102, 12401-12406. 31. Weinkam, P.; Romesberg, F. E.; Wolynes, P. G., Chemical Frustration in the Protein Folding Landscape: Grand Canonical Ensemble Simulations of Cytochrome c. Biochemistry 2009, 48, 2394-2402. 32. Weinkam, P.; Zimmermann, J.; Romesberg, F. E.; Wolynes, P. G., The Folding Energy Landscape and Free Energy Excitations of Cytochrome c. Acc Chem Res 2010, 43, 652-60. 33. Yifrach, O.; Horovitz, A., Nested Cooperativity in the Atpase Activity of the Oligomeric Chaperonin Groel. Biochemistry 1995, 34, 5303-5308. 34. Krishna, M. M.; Maity, H.; Rumbley, J. N.; Englander, S. W., Branching in the Sequential Folding Pathway of Cytochrome c. Protein Sci 2007, 16, 1946-56. 35. Cho, S. S.; Weinkam, P.; Wolynes, P. G., Origins of Barriers and Barrierless Folding in BBL. Proc Natl Acad Sci U S A 2008, 105, 118-23. 36. Benesch, R. E.; Benesch, R.; Yu, C. I., Oxygenation of Hemoglobin in Presence of 2,3-Diphosphoglycerate . Effect of Temperature pH Ionic Strength and Hemoglobin Concentration. Biochemistry 1969, 8, 2567-2571. 37. Kumar, S.; Ma, B. Y.; Tsai, C. J.; Sinha, N.; Nussinov, R., Folding and Binding Cascades: Dynamic Landscapes and Population Shifts. Protein Sci 2000, 9, 10-19. 38. Motlagh, H. N.; Hilser, V. J., Agonism/Antagonism Switching in Allosteric Ensembles. Proc Natl Acad Sci U S A 2012, 109, 4134-4139. 39. Bosshard, H. R., Molecular Recognition by Induced Fit: How Fit is the Concept? News in Physiological Sciences 2001, 16, 171-173.
Page 22 of 42
ACS Paragon Plus Environment
The Journal of Physical Chemistry
123456789101112131415161718192021222324252627282930313233343536373839404142434445464748495051525354555657585960
23
40. James, L. C.; Tawfik, D. S., Conformational Diversity and Protein Evolution - a 60-Year-Old Hypothesis Revisited. Trends in Biochemical Sciences 2003, 28, 361-368. 41. Salazar, C.; Hofer, T., Allosteric Regulation of the Transcription Factor NFAT1 by Multiple Phosphorylation Sites: A Mathematical Analysis. J Mol Biol 2003, 327, 31-45. 42. Hinsen, K.; Kneller, G. R., Solvent Effects in the Slow Dynamics of Proteins. Proteins: Struct., Funct., Bioinf. 2008, 70, 1235-1242. 43. Cho, S. S.; Levy, Y.; Wolynes, P. G., P Versus Q: Structural Reaction Coordinates Capture Protein Folding on Smooth Landscapes. Proc. Natl. Acad. Sci. USA 2006, 103, 586-591. 44. Hoecker, A.; Speckmayer, P.; Stelzer, J.; Therhaag, J.; von Toerne, E.; Voss, H., TMVA: Toolkit for Multivariate Data Analysis. PoS 2007, ACAT, 040. 45. Behe, M. J.; Englander, S. W., Sickle Hemoglobin Gelation - Reaction Order and Critical Nucleus Size. Biophys J 1978, 23, 129-145. 46. Christoph, G. W.; Hofrichter, J.; Eaton, W. A., Understanding the Shape of Sickled Red Cells. Biophys J 2005, 88, 1371-1376. 47. Ferrone, F. A.; Rotter, M. A., Crowding and the Polymerization of Sickle Hemoglobin. Journal of Molecular Recognition 2004, 17, 497-504. 48. Samaja, M.; Melotti, D.; Rovida, E.; Rossibernardi, L., Effect of Temperature on the P50 Value for Human-Blood. Clinical Chemistry 1983, 29, 110-114. 49. Wajcman, H.; Galacteros, F., Hemoglobins with High Oxygen Affinity Leading to Erythrocytosis. New Variants and New Concepts. Hemoglobin 2005, 29, 91-106. 50. Le Guilloux, V.; Schmidtke, P.; Tuffery, P., Fpocket: An Open Source Platform for Ligand Pocket Detection. Bmc Bioinformatics 2009, 10, e1. 51. Hub, J. S.; Kubitzki, M. B.; de Groot, B. L., Spontaneous Quaternary and Tertiary T-R Transitions of Human Hemoglobin in Molecular Dynamics Simulation. PLoS Comput Biol 2010, 6, e1000774. 52. Yusuff, O. K.; Babalola, J. O.; Bussi, G.; Raugei, S., Role of the Subunit Interactions in the Conformational Transitions in Adult Human Hemoglobin: An Explicit Solvent Molecular Dynamics Study. J Phys Chem B 2012, 116, 11004-11009. 53. Xu, C. Y.; Tobi, D.; Bahar, I., Allosteric Changes in Protein Structure Computed by a Simple Mechanical Model: Hemoglobin T <-> R2 Transition. J Mol Biol 2003, 333, 153-168. 54. Mozzarelli, A.; Rivetti, C.; Rossi, G. L.; Eaton, W. A.; Henry, E. R., Allosteric Effectors do not Alter the Oxygen Affinity of Hemoglobin Crystals. Protein Sci 1997, 6, 484-489. 55. Samuni, U.; Roche, C. J.; Dantsker, D.; Juszczak, L. J.; Friedman, J. M., Modulation of Reactivity and Conformation within the T-Quaternary State of Human Hemoglobin: the Combined use of Mutagenesis and Sol-Gel Encapsulation. Biochemistry 2006, 45, 2820-2835. 56. Wilson, J.; Phillips, K.; Luisi, B., The Crystal Structure of Horse Deoxyhaemoglobin Trapped in the High-Affinity (R) State. J Mol Biol 1996, 264, 743-756. 57. Sunshine, H. R.; Hofrichter, J.; Ferrone, F. A.; Eaton, W. A., Oxygen Binding by Sickle-Cell Hemoglobin Polymers. J Mol Biol 1982, 158, 251-273. 58. Giardine, B.; Borg, J.; Higgs, D. R.; Peterson, K. R.; Philipsen, S.; Maglott, D.; Singleton, B. K.; Anstee, D. J.; Basak, A. N.; Clark, B.; et.al., Systematic Documentation and Analysis of Human Genetic Variation in Hemoglobinopathies using the Microattribution Approach. Nature Genetics 2011, 43, 295-302. 59. Harrington, D. J.; Adachi, K.; Royer, W. E., The High Resolution Crystal Structure of Deoxyhemoglobin S. J Mol Biol 1997, 272, 398-407. 60. Bowman, G. R.; Geissler, P. L., Equilibrium Fluctuations of a Single Folded Protein Reveal a Multitude of Potential Cryptic Allosteric Sites. Proc Natl Acad Sci U S A 2012, 109, 11681-11686.
Page 23 of 42
ACS Paragon Plus Environment
The Journal of Physical Chemistry
123456789101112131415161718192021222324252627282930313233343536373839404142434445464748495051525354555657585960
24
61. Fan, H.; Irwin, J. J.; Webb, B. M.; Klebe, G.; Shoichet, B. K.; Sali, A., Molecular Docking Screens Using Comparative Models of Proteins. Journal of Chemical Information and Modeling 2009, 49, 2512-2527. 62. Schmidtke, P.; Bidon-Chanal, A.; Luque, F. J.; Barril, X., MDpocket: Open-Source Cavity Detection and Characterization on Molecular Synamics Trajectories. Bioinformatics 2011, 27, 3276-3285. 63. Perutz, M. F., Stereochemistry of Cooperative Effects in Haemoglobin. Nature 1970, 228, 726-734. 64. Szabo, A.; Karplus, M., Mathematical-Model for Structure-Function Relations in Hemoglobin. J Mol Biol 1972, 72, 163-197. 65. Lee, A. W. M.; Karplus, M., Structure-Specific Model of Hemoglobin Cooperativity. Proc Natl Acad Sci U S A 1983, 80, 7055-7059. 66. Dey, S.; Chakrabarti, P.; Janin, J., A Survey of Hemoglobin Quaternary Structures. Proteins 2011, 79, 2861-2870. 67. Popovych, N.; Sun, S.; Ebright, R. H.; Kalodimos, C. G., Dynamically Driven Protein Allostery. Nat Struct Mol Biol 2006, 13, 831-838. 68. Gelin, B. R.; Lee, A. W. M.; Karplus, M., Hemoglobin Tertiary Structural-Change on Ligand-Binding - Its Role in the Co-Operative Mechanism. J Mol Biol 1983, 171, 489-559. 69. Mouawad, L.; Perahia, D., Motions in Hemoglobin Studied by Normal Mode Analysis and Energy Minimization: Evidence for the Existence of Tertiary T-like, Quaternary R-like Intermediate Structures. J Mol Biol 1996, 258, 393-410. 70. Fischer, S.; Olsen, K. W.; Nam, K.; Karplus, M., Unsuspected Pathway of the Allosteric Transition in Hemoglobin. Proc Natl Acad Sci U S A 2011, 108, 5608-5613. 71. Eom, K.; Baek, S. C.; Ahn, J. H.; Na, S., Coarse-Graining of Protein Structures for the Normal Mode Studies. J Comput Chem 2007, 28, 1400-1410. 72. Jones, E. M.; Balakrishnan, G.; Spiro, T. G., Heme Reactivity is Uncoupled from Quaternary Structure in Gel-Encapsulated Hemoglobin: A Resonance Raman Spectroscopic Study. J Am Chem Soc 2012, 134, 3461-3471. 73. Piel, F. B.; Patil, A. P.; Howes, R. E.; Nyangiri, O. A.; Gething, P. W.; Williams, T. N.; Weatherall, D. J.; Hay, S. I., Global Distribution of the Sickle Cell Gene and Geographical Confirmation of the Malaria Hypothesis. Nature Communications 2010, 1, 104-110. 74. Luzzatto, L.; Nwachuku, E. S.; Reddy, S., Increased Sickling of Parasitised Erythrocytes as Mechanism of Resistance against Malaria in Sickle-Cell Trait. Lancet 1970, 1, 319-321. 75. Friedman, M. J., Erythrocytic Mechanism of Sickle-Cell Resistance to Malaria. Proc Natl Acad Sci U S A 1978, 75, 1994-1997.
Page 24 of 42
ACS Paragon Plus Environment
The Journal of Physical Chemistry
123456789101112131415161718192021222324252627282930313233343536373839404142434445464748495051525354555657585960
25
Figures
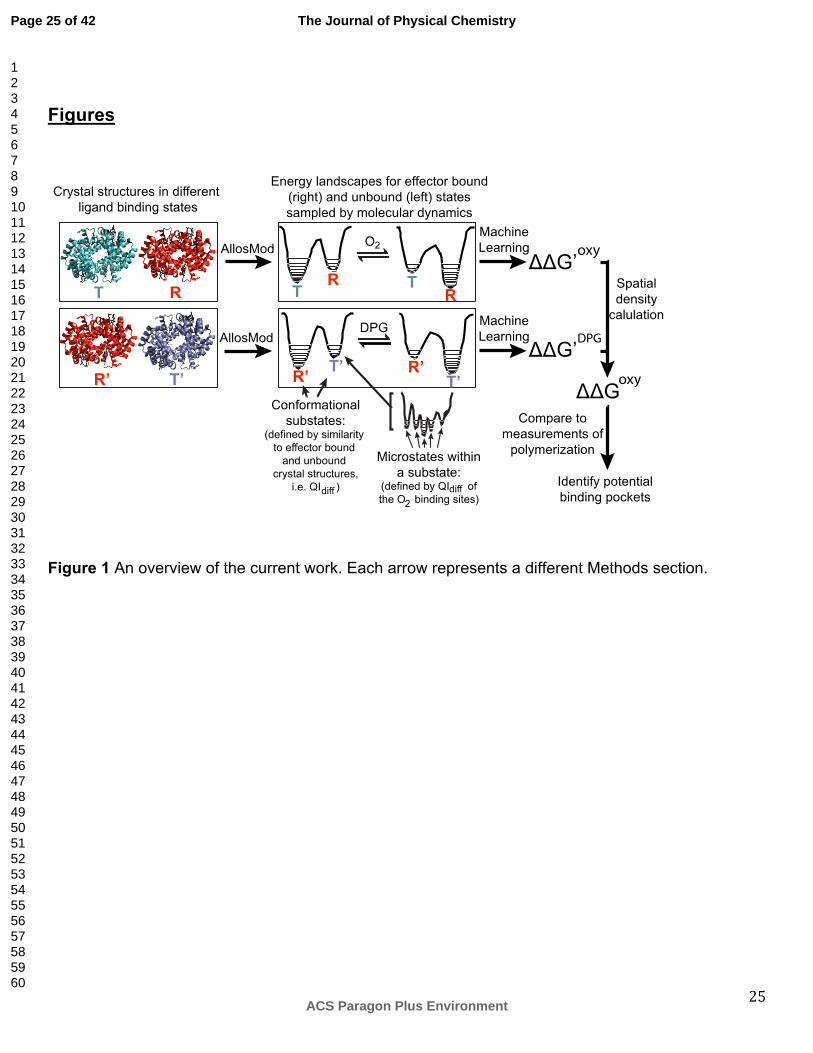
Figure 1 An overview of the current work. Each arrow represents a different Methods section.
Page 25 of 42
ACS Paragon Plus Environment
The Journal of Physical Chemistry
123456789101112131415161718192021222324252627282930313233343536373839404142434445464748495051525354555657585960
26
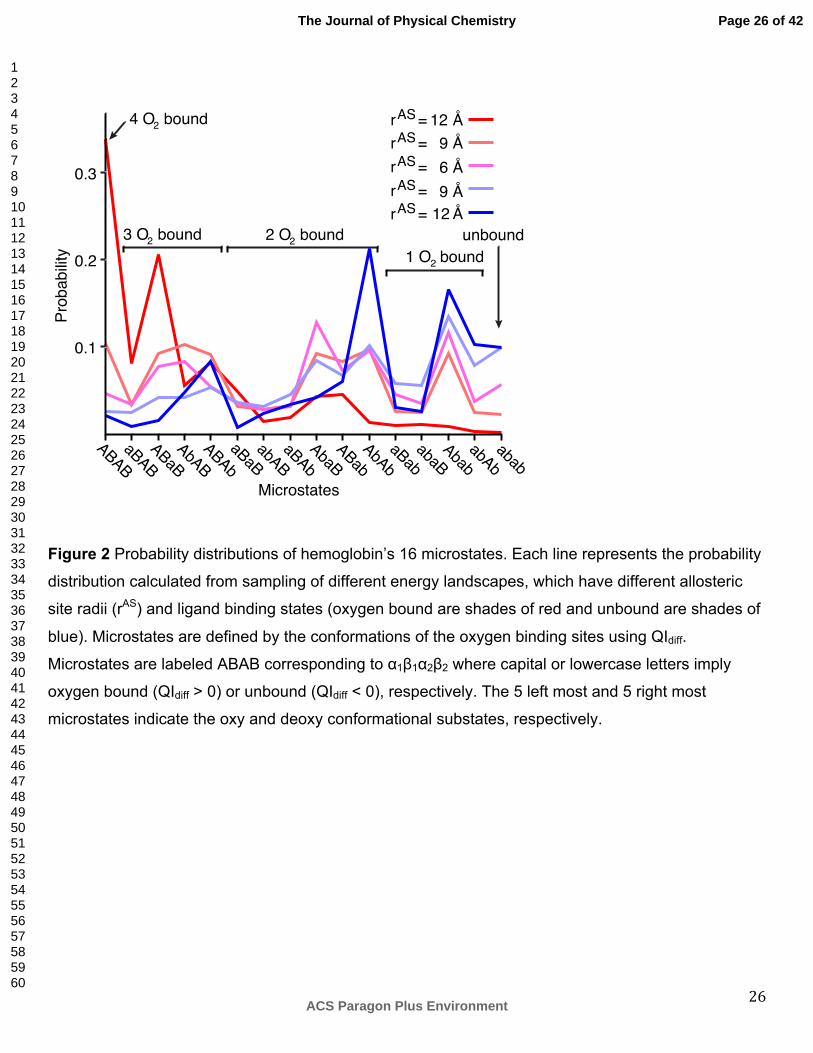
Figure 2 Probability distributions of hemoglobin’s 16 microstates. Each line represents the probability
distribution calculated from sampling of different energy landscapes, which have different allosteric
site radii (rAS) and ligand binding states (oxygen bound are shades of red and unbound are shades of
blue). Microstates are defined by the conformations of the oxygen binding sites using QIdiff.
Microstates are labeled ABAB corresponding to α1β1α2β2 where capital or lowercase letters imply
oxygen bound (QIdiff > 0) or unbound (QIdiff < 0), respectively. The 5 left most and 5 right most
microstates indicate the oxy and deoxy conformational substates, respectively.
Page 26 of 42
ACS Paragon Plus Environment
The Journal of Physical Chemistry
123456789101112131415161718192021222324252627282930313233343536373839404142434445464748495051525354555657585960
27
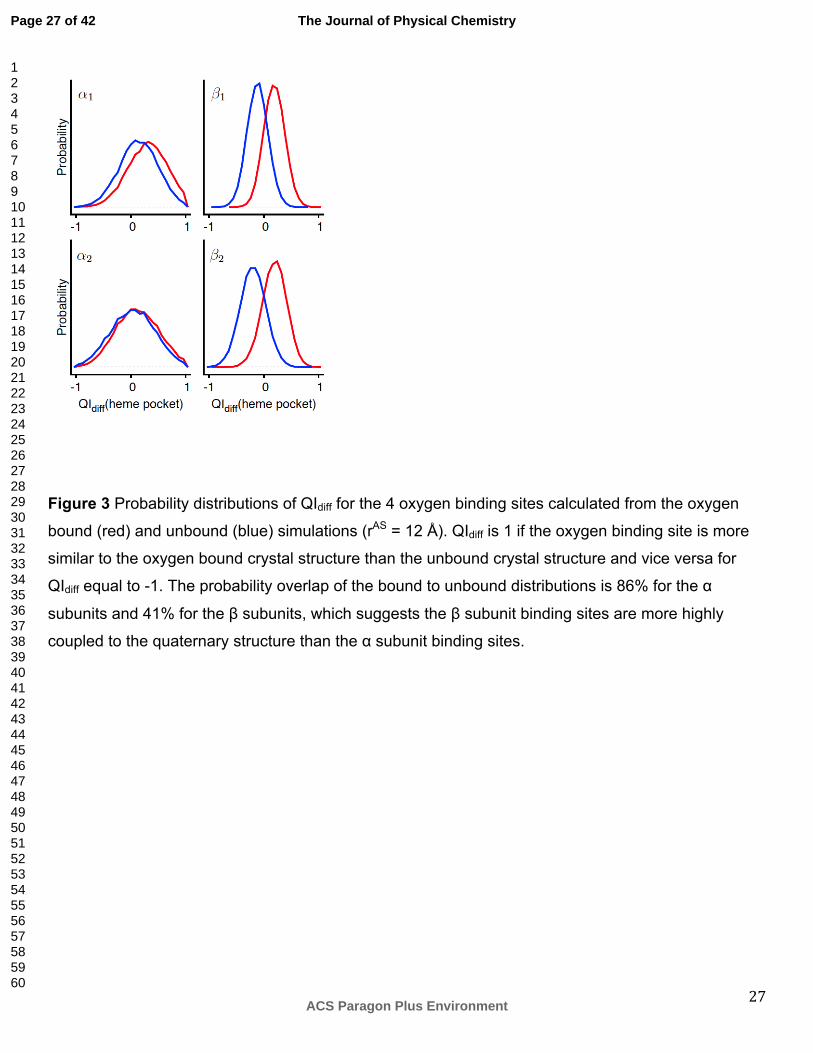
Figure 3 Probability distributions of QIdiff for the 4 oxygen binding sites calculated from the oxygen
bound (red) and unbound (blue) simulations (rAS = 12 Å). QIdiff is 1 if the oxygen binding site is more
similar to the oxygen bound crystal structure than the unbound crystal structure and vice versa for
QIdiff equal to -1. The probability overlap of the bound to unbound distributions is 86% for the α
subunits and 41% for the β subunits, which suggests the β subunit binding sites are more highly
coupled to the quaternary structure than the α subunit binding sites.
Page 27 of 42
ACS Paragon Plus Environment
The Journal of Physical Chemistry
123456789101112131415161718192021222324252627282930313233343536373839404142434445464748495051525354555657585960
28
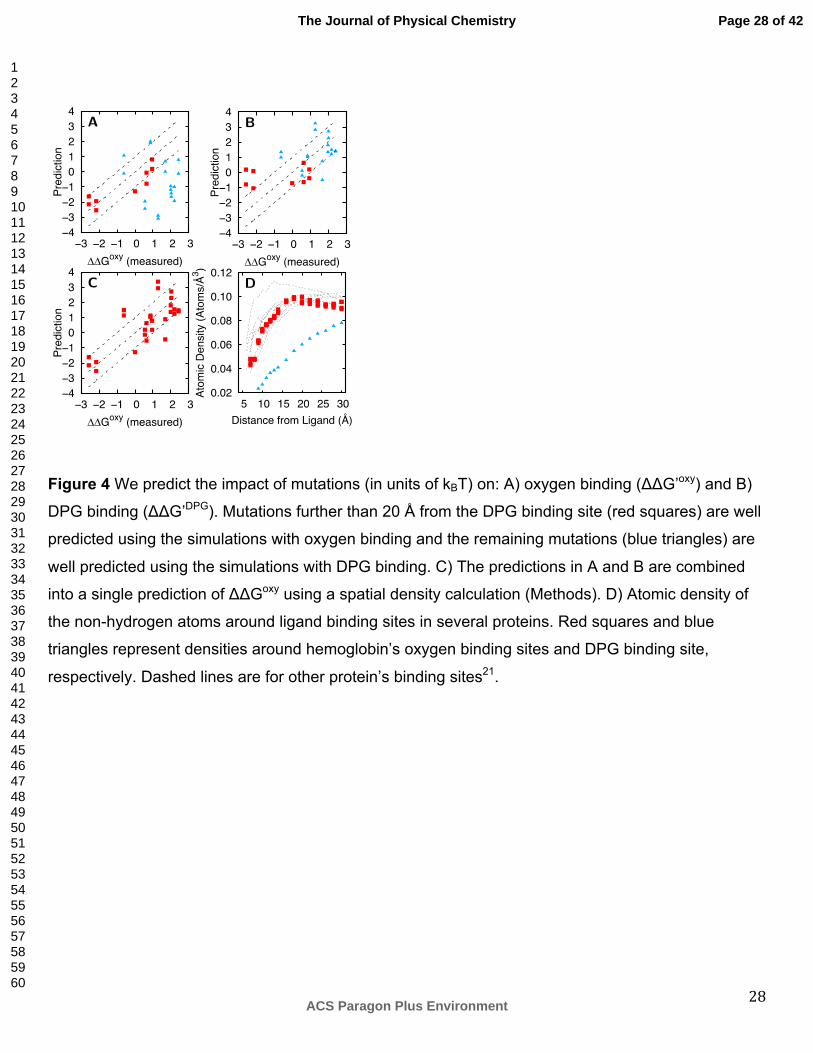
Figure 4 We predict the impact of mutations (in units of kBT) on: A) oxygen binding (ΔΔG’oxy) and B)
DPG binding (ΔΔG’DPG). Mutations further than 20 Å from the DPG binding site (red squares) are well
predicted using the simulations with oxygen binding and the remaining mutations (blue triangles) are
well predicted using the simulations with DPG binding. C) The predictions in A and B are combined
into a single prediction of ΔΔGoxy using a spatial density calculation (Methods). D) Atomic density of
the non-hydrogen atoms around ligand binding sites in several proteins. Red squares and blue
triangles represent densities around hemoglobin’s oxygen binding sites and DPG binding site,
respectively. Dashed lines are for other protein’s binding sites21.
Page 28 of 42
ACS Paragon Plus Environment
The Journal of Physical Chemistry
123456789101112131415161718192021222324252627282930313233343536373839404142434445464748495051525354555657585960
29
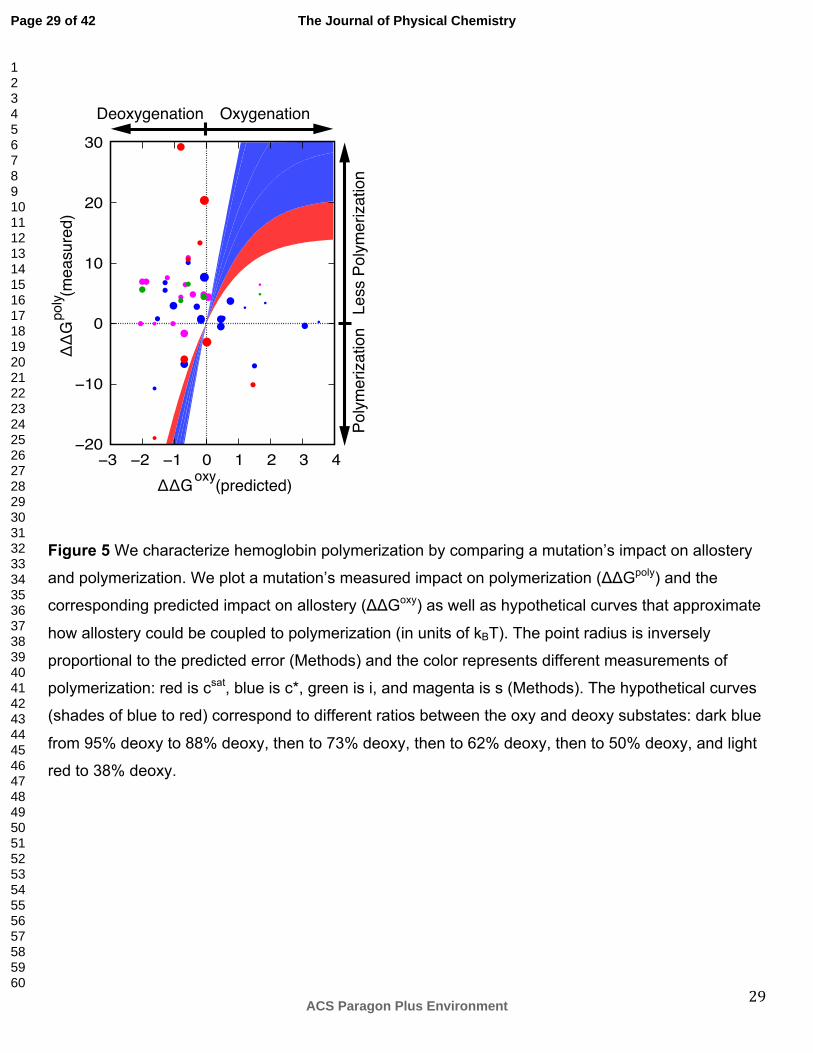
Figure 5 We characterize hemoglobin polymerization by comparing a mutation’s impact on allostery
and polymerization. We plot a mutation’s measured impact on polymerization (ΔΔGpoly) and the
corresponding predicted impact on allostery (ΔΔGoxy) as well as hypothetical curves that approximate
how allostery could be coupled to polymerization (in units of kBT). The point radius is inversely
proportional to the predicted error (Methods) and the color represents different measurements of
polymerization: red is csat, blue is c*, green is i, and magenta is s (Methods). The hypothetical curves
(shades of blue to red) correspond to different ratios between the oxy and deoxy substates: dark blue
from 95% deoxy to 88% deoxy, then to 73% deoxy, then to 62% deoxy, then to 50% deoxy, and light
red to 38% deoxy.
Polym
eriza
tion
Less
Pol
ymer
izatio
n
Deoxygenation Oxygenation
уу*oxy (predicted)
уу*
poly (m
easu
red)
�
�
��
���
���
3�
ï� ï� ï� �� �� �� 3 4
Page 29 of 42
ACS Paragon Plus Environment
The Journal of Physical Chemistry
123456789101112131415161718192021222324252627282930313233343536373839404142434445464748495051525354555657585960
30
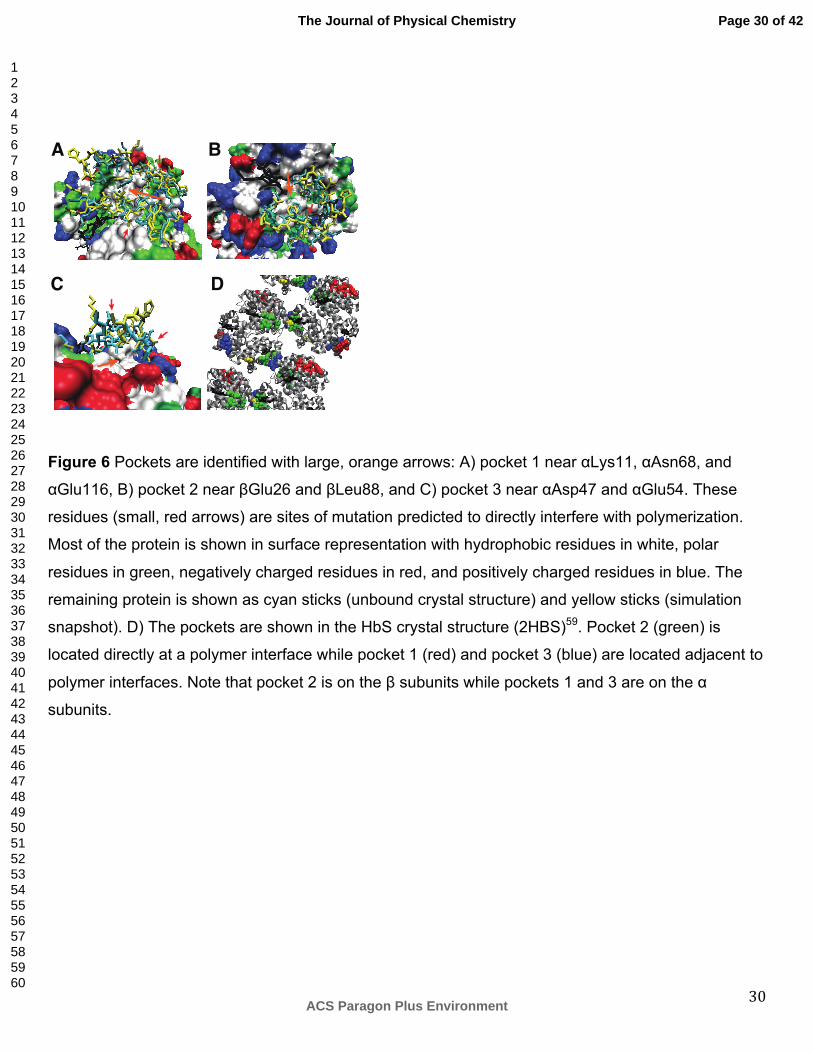
Figure 6 Pockets are identified with large, orange arrows: A) pocket 1 near αLys11, αAsn68, and
αGlu116, B) pocket 2 near βGlu26 and βLeu88, and C) pocket 3 near αAsp47 and αGlu54. These
residues (small, red arrows) are sites of mutation predicted to directly interfere with polymerization.
Most of the protein is shown in surface representation with hydrophobic residues in white, polar
residues in green, negatively charged residues in red, and positively charged residues in blue. The
remaining protein is shown as cyan sticks (unbound crystal structure) and yellow sticks (simulation
snapshot). D) The pockets are shown in the HbS crystal structure (2HBS)59. Pocket 2 (green) is
located directly at a polymer interface while pocket 1 (red) and pocket 3 (blue) are located adjacent to
polymer interfaces. Note that pocket 2 is on the β subunits while pockets 1 and 3 are on the α
subunits.
Page 30 of 42
ACS Paragon Plus Environment
The Journal of Physical Chemistry
123456789101112131415161718192021222324252627282930313233343536373839404142434445464748495051525354555657585960
31
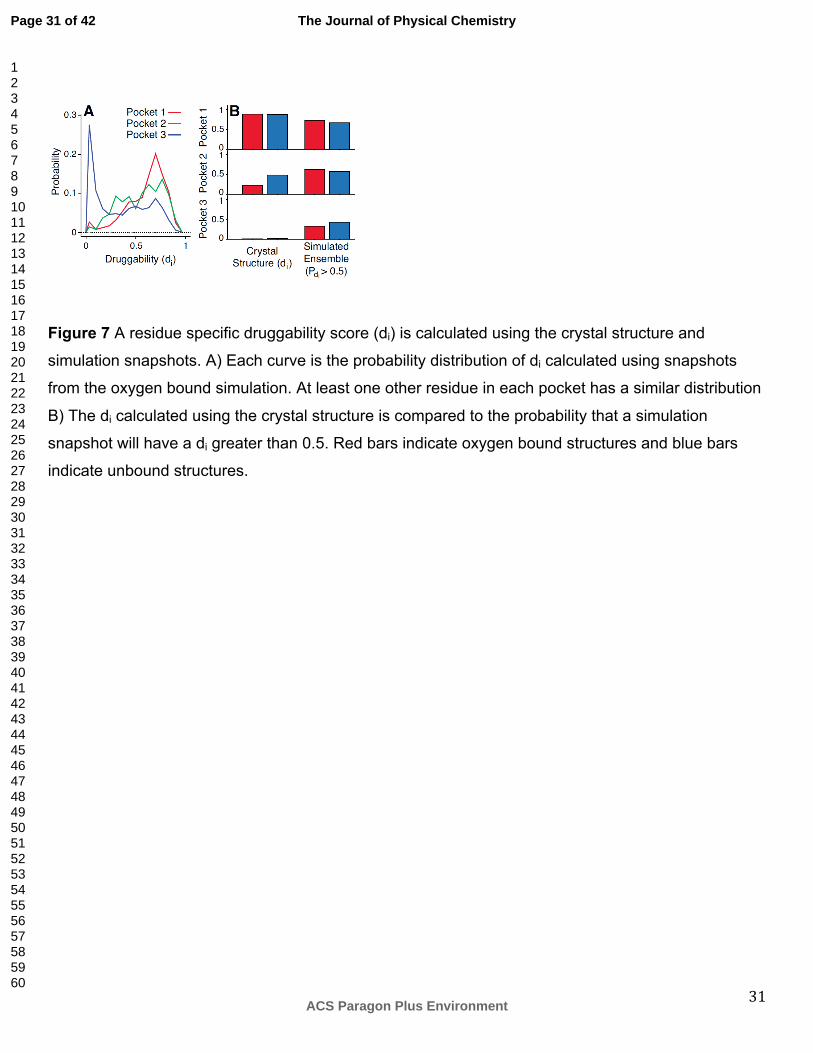
Figure 7 A residue specific druggability score (di) is calculated using the crystal structure and
simulation snapshots. A) Each curve is the probability distribution of di calculated using snapshots
from the oxygen bound simulation. At least one other residue in each pocket has a similar distribution
B) The di calculated using the crystal structure is compared to the probability that a simulation
snapshot will have a di greater than 0.5. Red bars indicate oxygen bound structures and blue bars
indicate unbound structures.
Page 31 of 42
ACS Paragon Plus Environment
The Journal of Physical Chemistry
123456789101112131415161718192021222324252627282930313233343536373839404142434445464748495051525354555657585960
32
Figure 8 A) We predict the impact of all naturally occurring (non-engineered) hemoglobin mutations
in the HbVar database58 on oxygen binding (ΔΔGoxy in kBT): 319 HbA mutations in the α subunits
(red), 423 HbA mutations in the β subunits (yellow), and 13 HbS mutations (blue). B) We report the
measured impact of HbS mutations on polymerization (ΔΔGpoly in kBT): 5 data points for naturally
occurring mutations (blue) and 41 data points for engineered mutations (green).
Page 32 of 42
ACS Paragon Plus Environment
The Journal of Physical Chemistry
123456789101112131415161718192021222324252627282930313233343536373839404142434445464748495051525354555657585960
33
Table of contents figure
Page 33 of 42
ACS Paragon Plus Environment
The Journal of Physical Chemistry
123456789101112131415161718192021222324252627282930313233343536373839404142434445464748495051525354555657585960
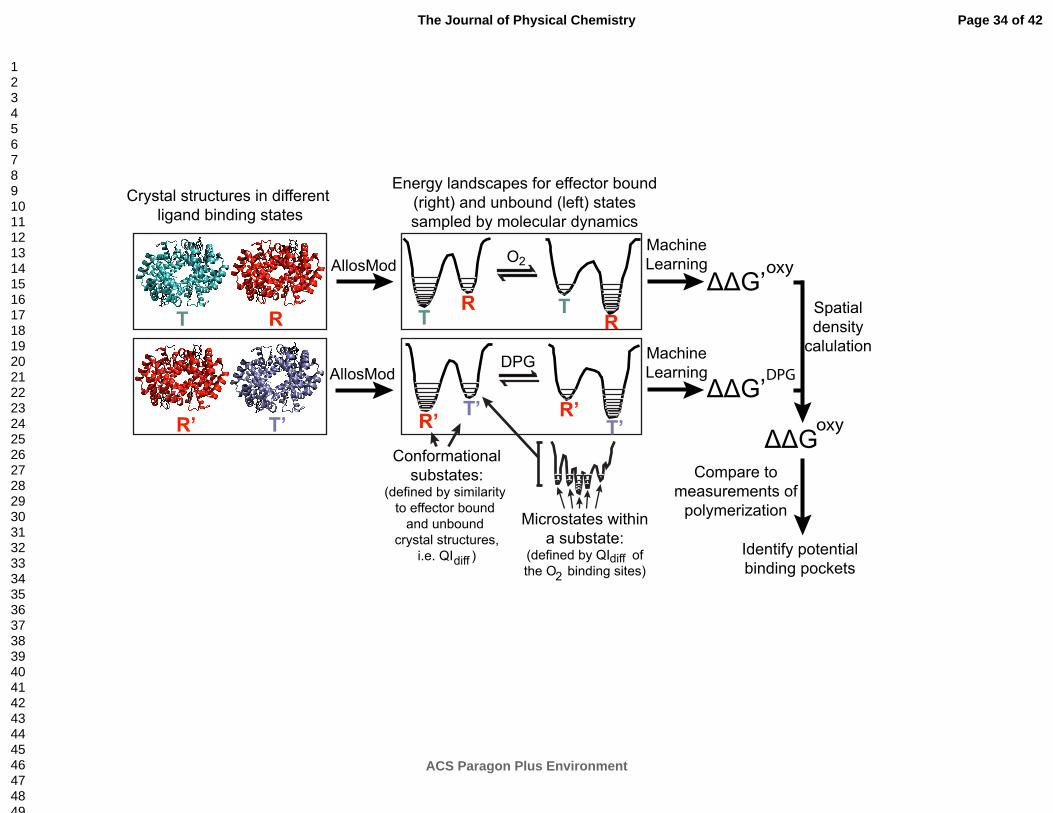
O
DPG
Energy landscapes for effector bound(right) and unbound (left) statessampled by molecular dynamics
AllosMod 2
Microstates withina substate:
(defined by QI ofthe O binding sites)
Conformationalsubstates:
(defined by similarity to effector bound
and unbound crystal structures,
i.e. QI )
MachineLearning
Crystal structures in different ligand binding states
ΔΔG’oxy
Spatialdensity
calulation
diff diff2
R
R’
T
T’
AllosMod
RRT T
T’T’ R’R’
MachineLearning
ΔΔG’DPG
ΔΔGoxy
Compare tomeasurements of
polymerization
Identify potentialbinding pockets
Page 34 of 42
ACS Paragon Plus Environment
The Journal of Physical Chemistry
123456789101112131415161718192021222324252627282930313233343536373839404142434445464748495051525354555657585960
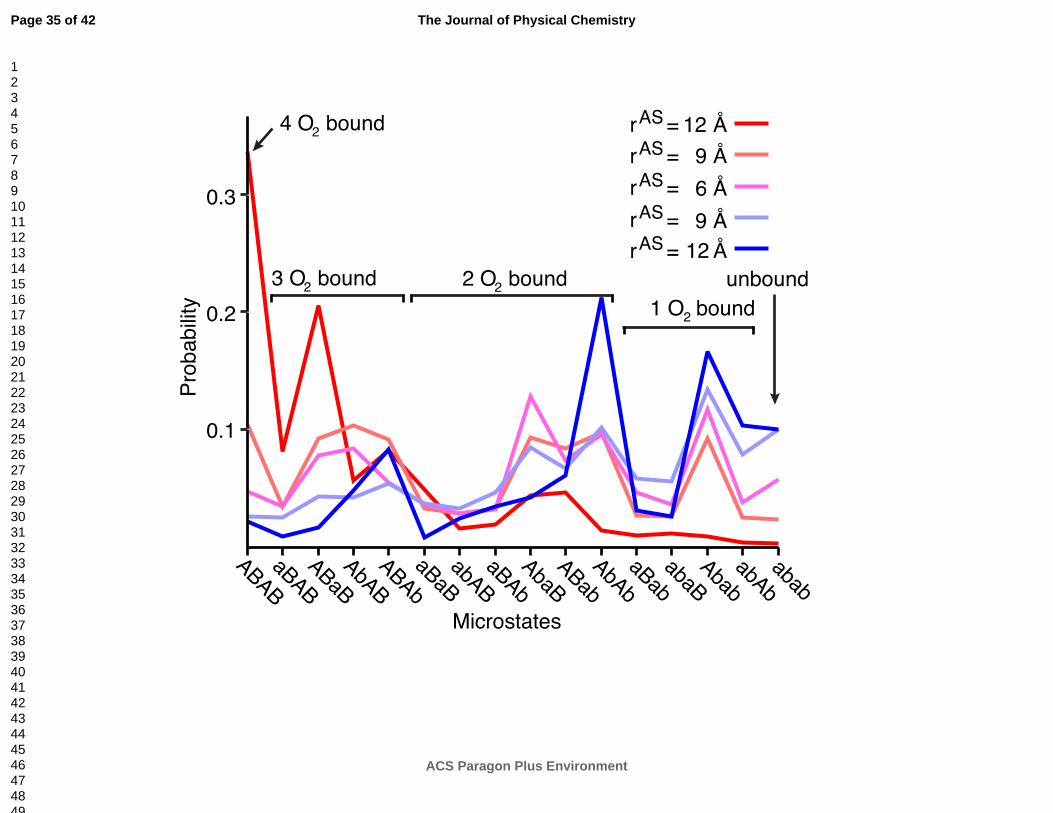
4 O bound2
3 O bound2 2 O bound21 O bound2
unbound
ABABaBAB
ABaBAbAB
ABAbaBaB
abABaBAb
AbaBABab
AbAbaBab
abaBAbab
abAbabab
Prob
abilit
y
Microstates
12 Å 9 Å 6 Å 9 Å
12 Å
0.3
0.2
0.1
r = AS
r = AS
r = AS
r = AS
r = AS
Page 35 of 42
ACS Paragon Plus Environment
The Journal of Physical Chemistry
123456789101112131415161718192021222324252627282930313233343536373839404142434445464748495051525354555657585960
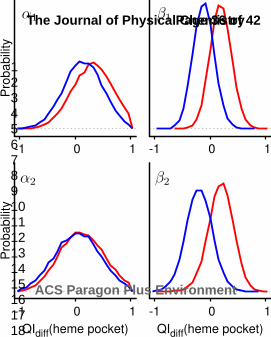
-1 0 1
Pro
babili
tyα1
-1 0 1
Pro
babili
ty
QIdiff(heme pocket)
α2
-1 0 1
β1
-1 0 1
QIdiff(heme pocket)
β2
Page 36 of 42
ACS Paragon Plus Environment
The Journal of Physical Chemistry
123456789101112131415161718192021222324252627282930313233343536373839404142434445464748495051525354555657585960
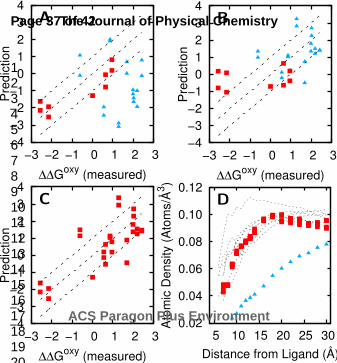
−4−3−2−1 0 1 2 3 4
−3 −2 −1 0 1 2 3
Pre
dict
ion
∆∆Goxy (measured)
A
−4−3−2−1 0 1 2 3 4
−3 −2 −1 0 1 2 3
Pre
dict
ion
∆∆Goxy (measured)
C
−4−3−2−1 0 1 2 3 4
−3 −2 −1 0 1 2 3
Pre
dict
ion
∆∆Goxy (measured)
B
0.02
0.04
0.06
0.08
0.10
0.12
5 10 15 20 25 30
Ato
mic
Den
sity
(A
tom
s/Å
3 )
Distance from Ligand (Å)
D
Page 37 of 42
ACS Paragon Plus Environment
The Journal of Physical Chemistry
123456789101112131415161718192021222324252627282930313233343536373839404142434445464748495051525354555657585960
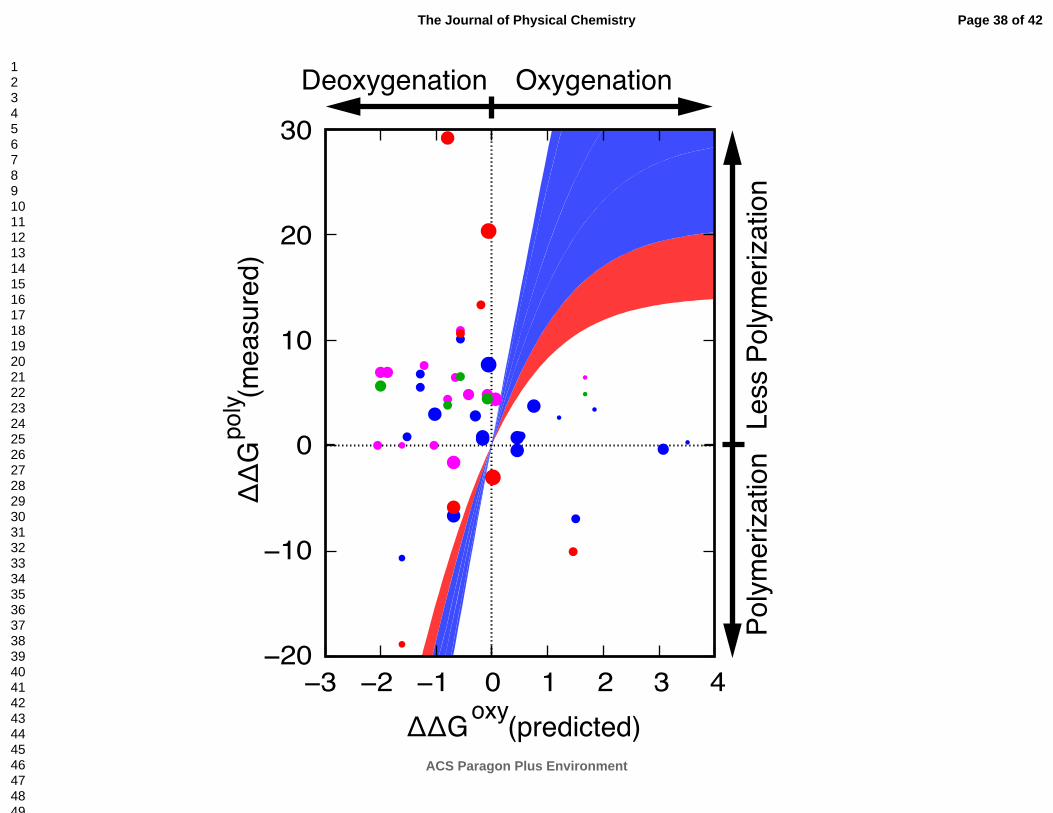
Poly
mer
izat
ion
Less
Pol
ymer
izat
ion
Deoxygenation Oxygenation
ΔΔGoxy (predicted)
ΔΔ
Gpo
ly (mea
sure
d)
−20
−10
0
10
20
30
−3 −2 −1 0 1 2 3 4
Page 38 of 42
ACS Paragon Plus Environment
The Journal of Physical Chemistry
123456789101112131415161718192021222324252627282930313233343536373839404142434445464748495051525354555657585960
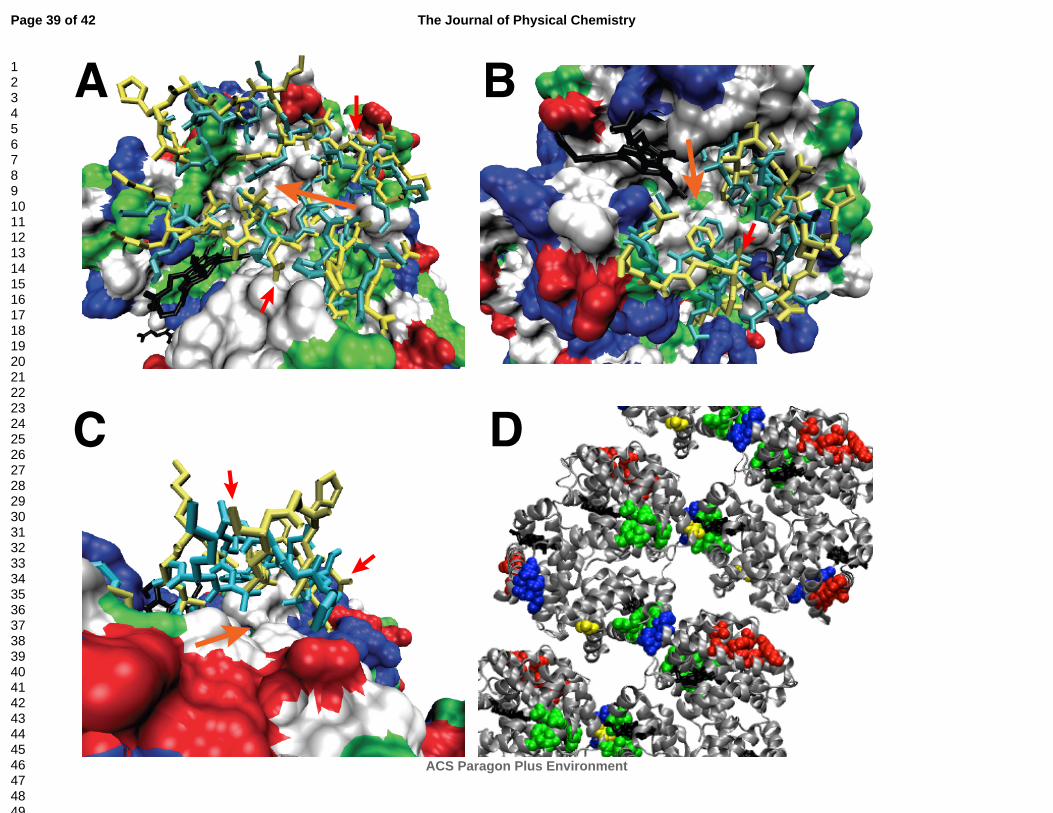
A B
C D
Page 39 of 42
ACS Paragon Plus Environment
The Journal of Physical Chemistry
123456789101112131415161718192021222324252627282930313233343536373839404142434445464748495051525354555657585960
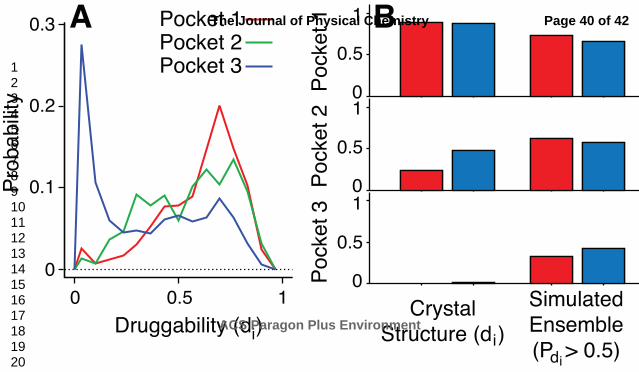
0
0.5
1
Po
cke
t 1
Po
cke
t 3
Po
cke
t 2
Crystal
Structure (d )
Simulated
Ensemble
(P > 0.5)
0 0.5 1
Pro
ba
bili
ty
Druggability (di)
Pocket 1Pocket 2Pocket 3
0.3
0
0
0.5
1
0
0.5
1 0.1
0.2
A B
idi
Page 40 of 42
ACS Paragon Plus Environment
The Journal of Physical Chemistry
123456789101112131415161718192021222324252627282930313233343536373839404142434445464748495051525354555657585960
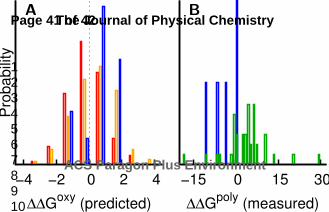
−4 −2 0 2 4
Pro
babili
ty
∆∆Goxy
(predicted)
A
−15 0 15 30
∆∆Gpoly
(measured)
BPage 41 of 42
ACS Paragon Plus Environment
The Journal of Physical Chemistry
123456789101112131415161718192021222324252627282930313233343536373839404142434445464748495051525354555657585960
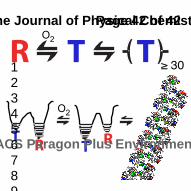
R T ≥ 30( )TO2
RTT R
O2
Page 42 of 42
ACS Paragon Plus Environment
The Journal of Physical Chemistry
123456789101112131415161718192021222324252627282930313233343536373839404142434445464748495051525354555657585960