Embed Size (px)
Citation preview
Mapping Permeable Landscapes for a
Changing Climate in the Eastern US
Melissa Clark
The Nature Conservancy, Eastern Conservation Science
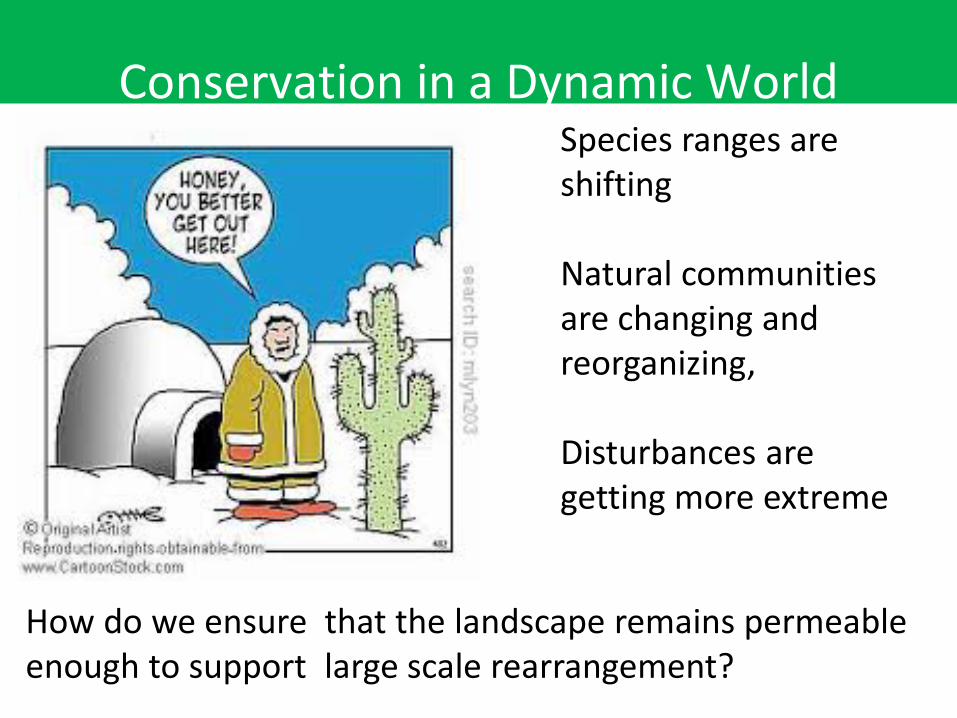
Conservation in a Dynamic World
Species ranges are shifting Natural communities are changing and reorganizing, Disturbances are getting more extreme
How do we ensure that the landscape remains permeable enough to support large scale rearrangement?
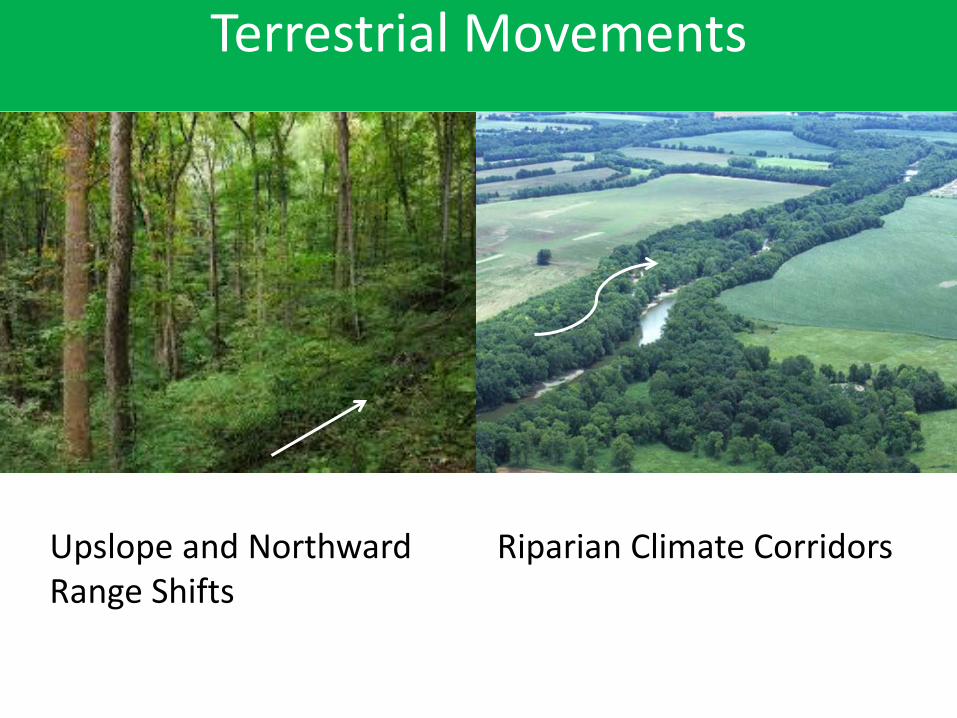
Terrestrial Movements
Upslope and Northward Riparian Climate Corridors Range Shifts
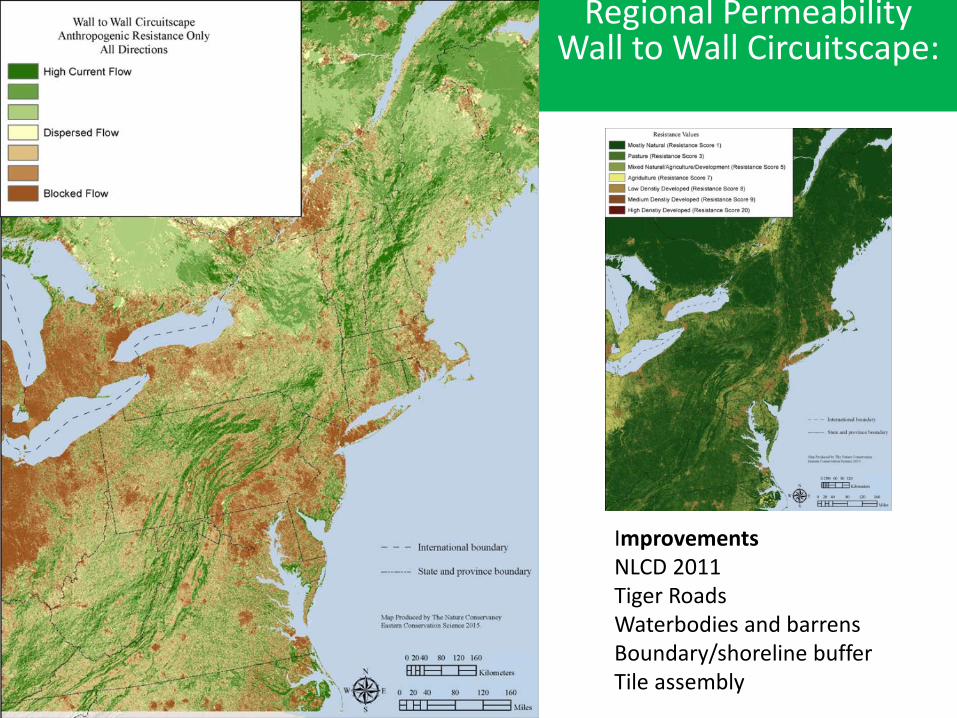
Regional Permeability Wall to Wall Circuitscape:
Improvements NLCD 2011 Tiger Roads Waterbodies and barrens Boundary/shoreline buffer Tile assembly
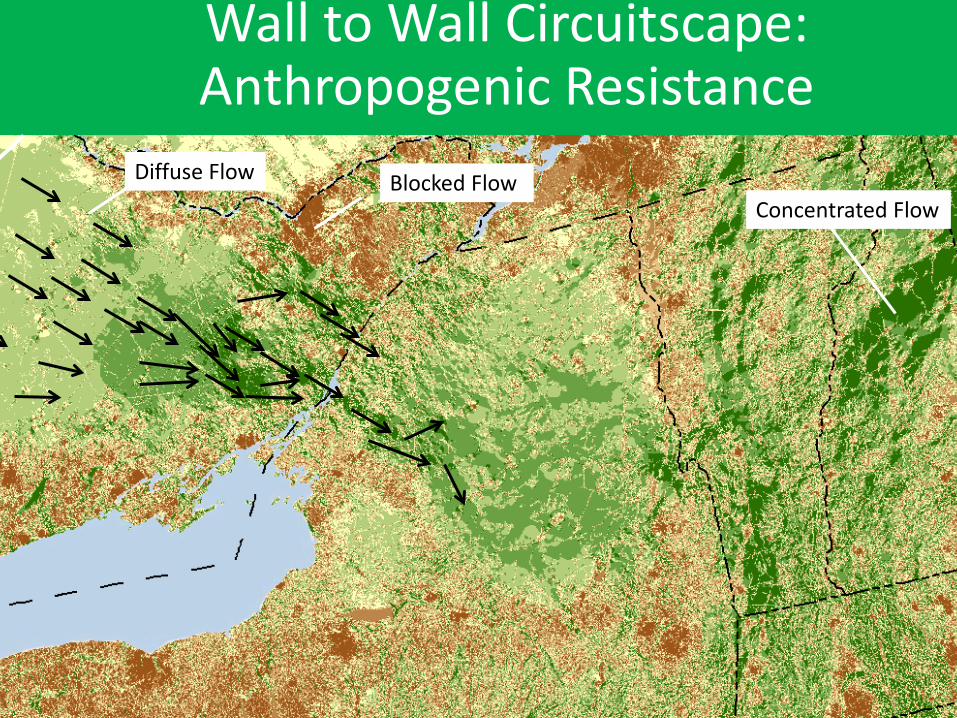
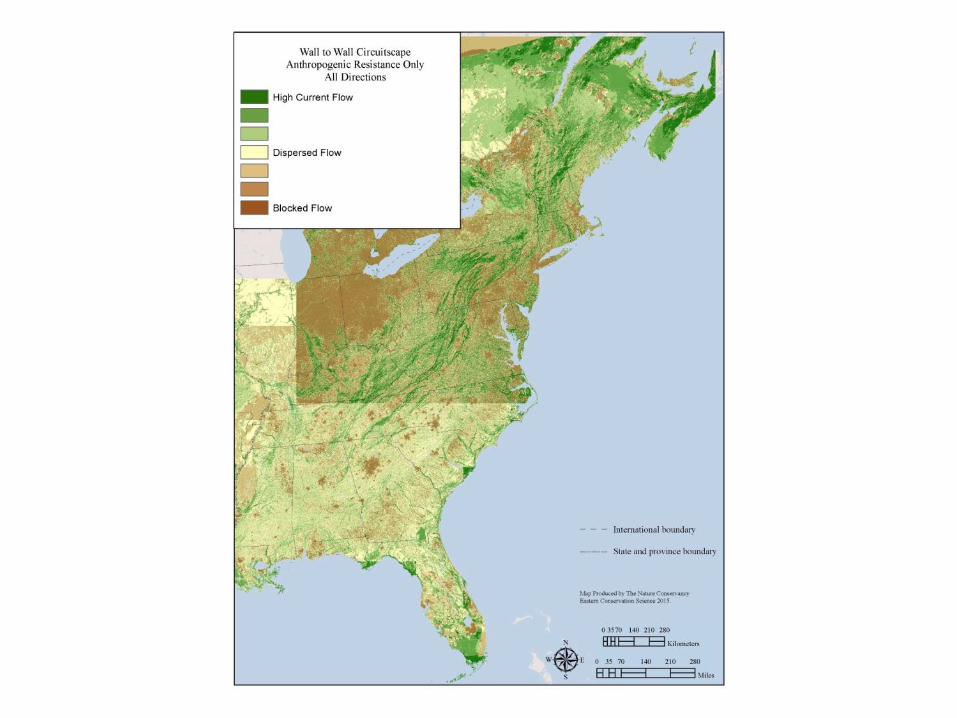
Wall to Wall Circuitscape: Anthropogenic Resistance
Diffuse Flow
Concentrated Flow Blocked Flow
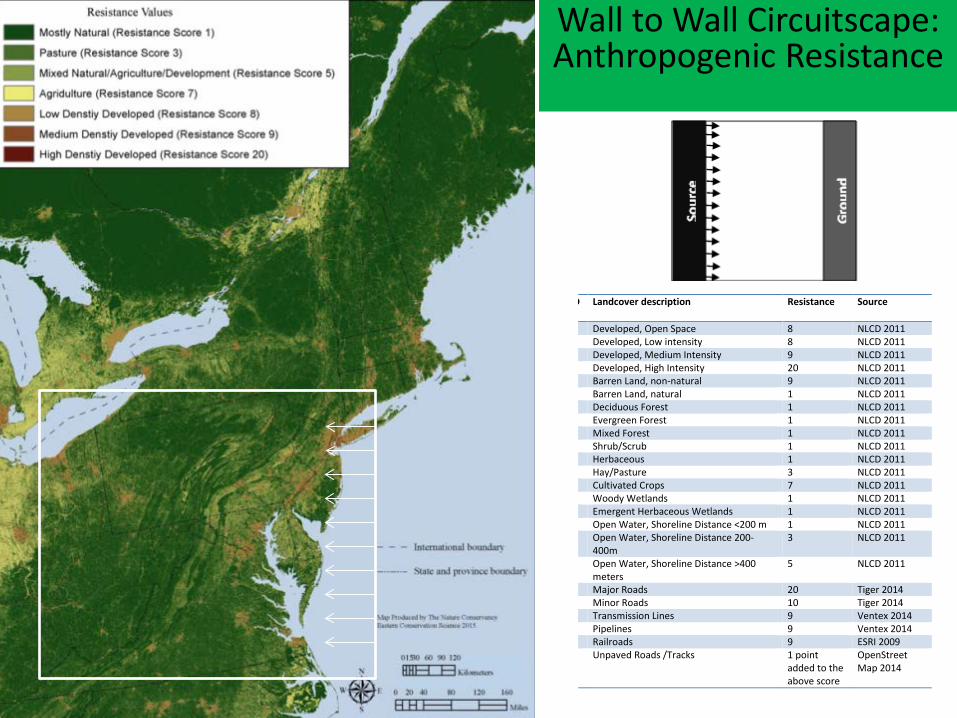
Wall to Wall Circuitscape: Anthropogenic Resistance
D
Landcover description Resistance Source
Developed, Open Space 8 NLCD 2011 Developed, Low intensity 8 NLCD 2011 Developed, Medium Intensity 9 NLCD 2011 Developed, High Intensity 20 NLCD 2011 Barren Land, non-natural 9 NLCD 2011 Barren Land, natural 1 NLCD 2011 Deciduous Forest 1 NLCD 2011 Evergreen Forest 1 NLCD 2011 Mixed Forest 1 NLCD 2011 Shrub/Scrub 1 NLCD 2011 Herbaceous 1 NLCD 2011 Hay/Pasture 3 NLCD 2011 Cultivated Crops 7 NLCD 2011 Woody Wetlands 1 NLCD 2011 Emergent Herbaceous Wetlands 1 NLCD 2011 Open Water, Shoreline Distance <200 m 1 NLCD 2011 Open Water, Shoreline Distance 200-
400m 3 NLCD 2011
Open Water, Shoreline Distance >400 meters
5 NLCD 2011
Major Roads 20 Tiger 2014 Minor Roads 10 Tiger 2014 Transmission Lines 9 Ventex 2014 Pipelines 9 Ventex 2014 Railroads 9 ESRI 2009 Unpaved Roads /Tracks 1 point
added to the above score
OpenStreet Map 2014
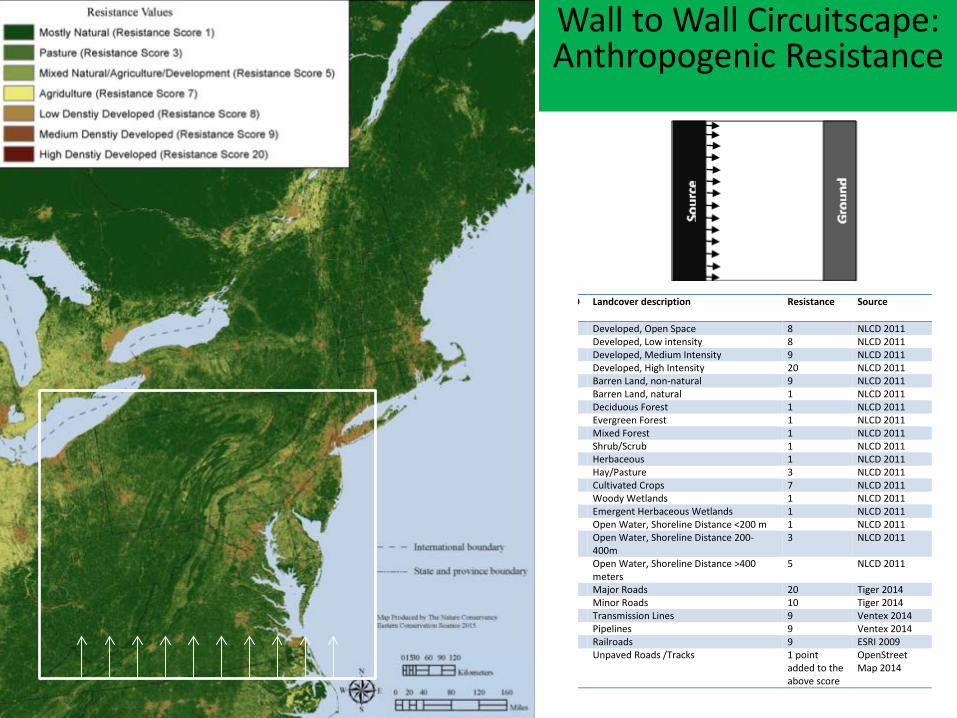
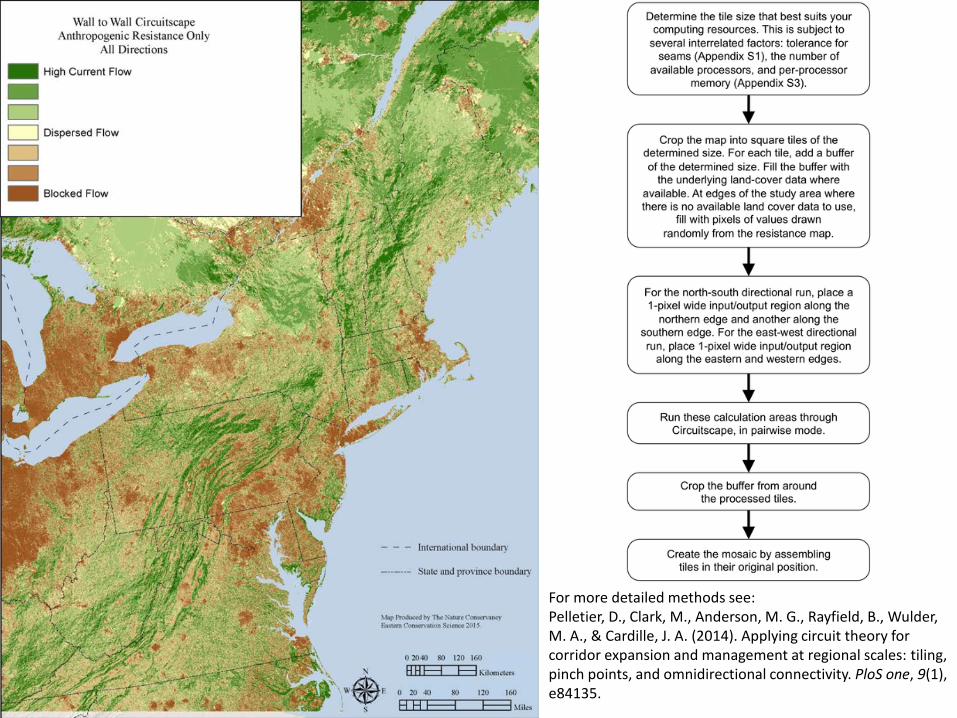
For more detailed methods see: Pelletier, D., Clark, M., Anderson, M. G., Rayfield, B., Wulder, M. A., & Cardille, J. A. (2014). Applying circuit theory for corridor expansion and management at regional scales: tiling, pinch points, and omnidirectional connectivity. PloS one, 9(1), e84135.

Does the model work?
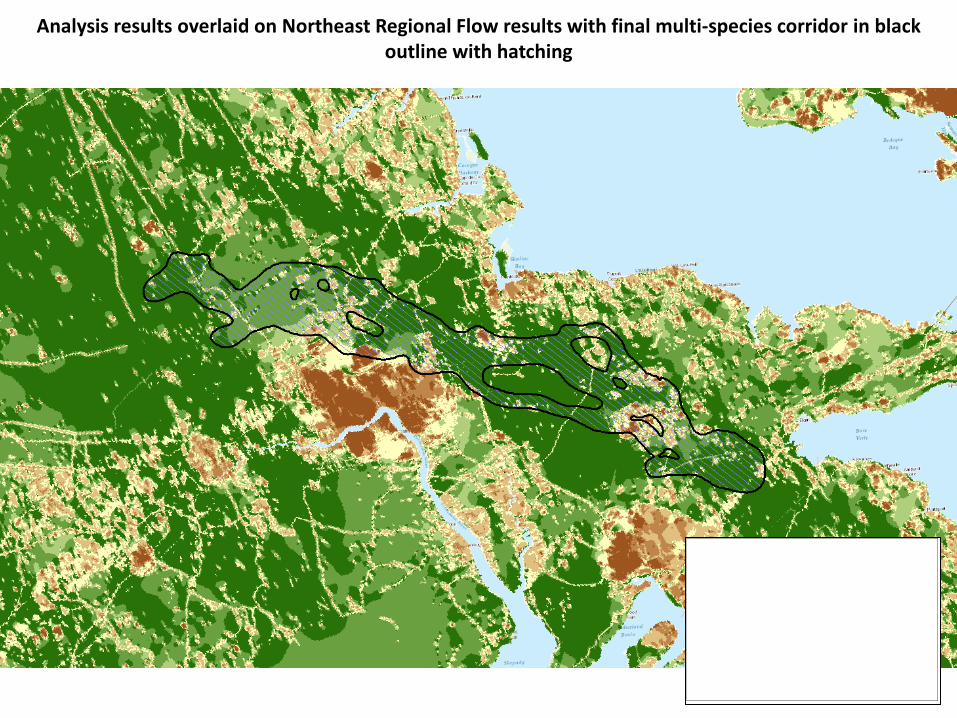
Analysis results overlaid on Northeast Regional Flow results with final multi-species corridor in black outline with hatching
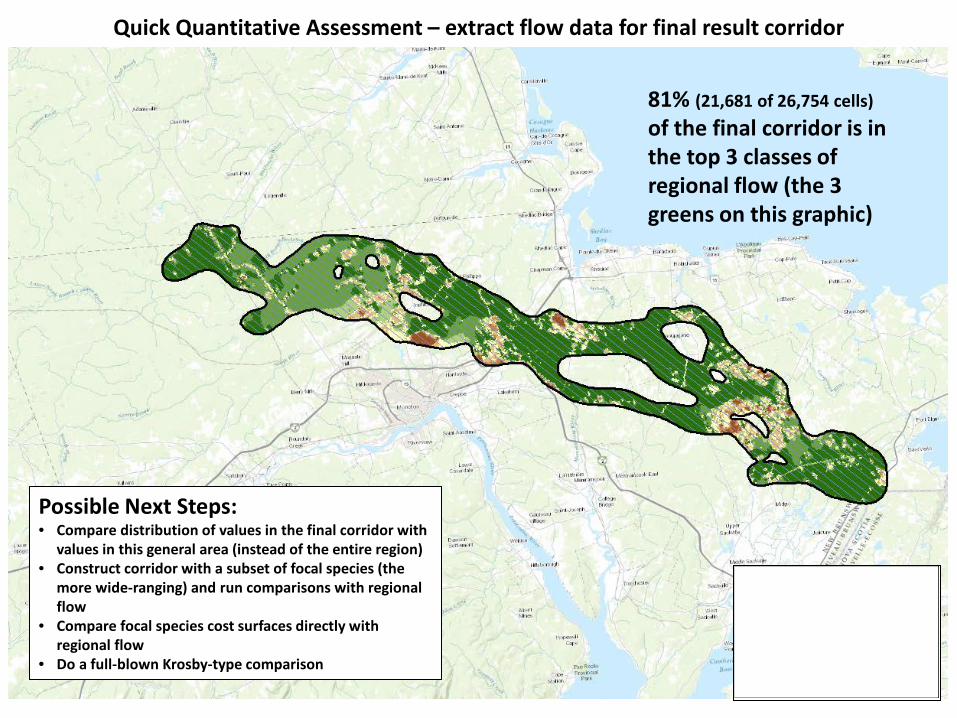
Quick Quantitative Assessment – extract flow data for final result corridor
81% (21,681 of 26,754 cells) of the final corridor is in the top 3 classes of regional flow (the 3 greens on this graphic)
Possible Next Steps: • Compare distribution of values in the final corridor with
values in this general area (instead of the entire region) • Construct corridor with a subset of focal species (the
more wide-ranging) and run comparisons with regional flow
• Compare focal species cost surfaces directly with regional flow
• Do a full-blown Krosby-type comparison
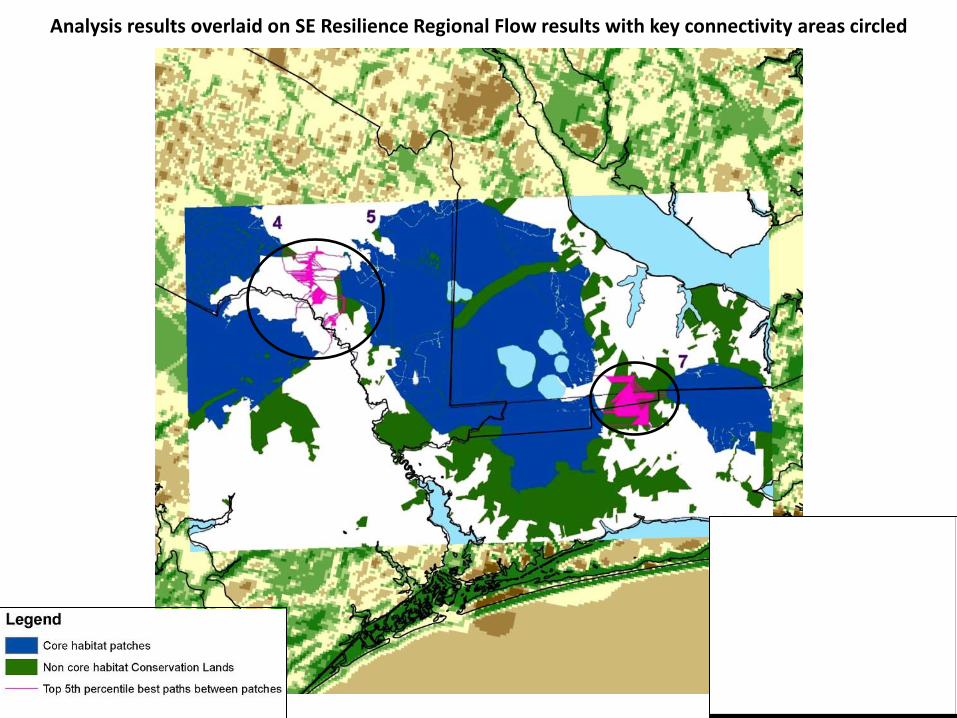
Analysis results overlaid on SE Resilience Regional Flow results with key connectivity areas circled
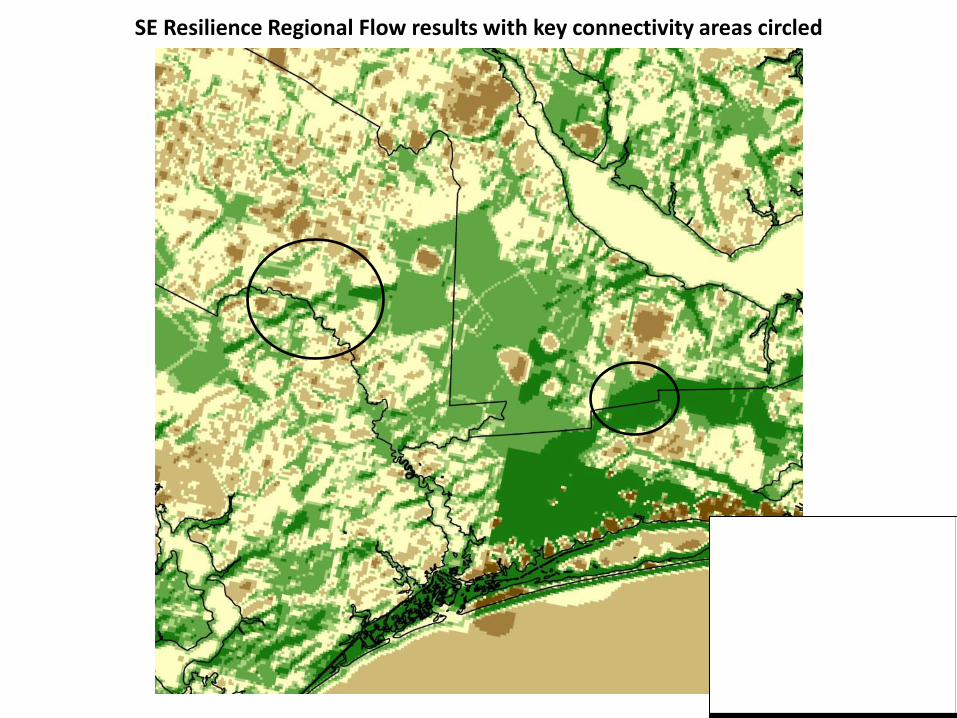
SE Resilience Regional Flow results with key connectivity areas circled
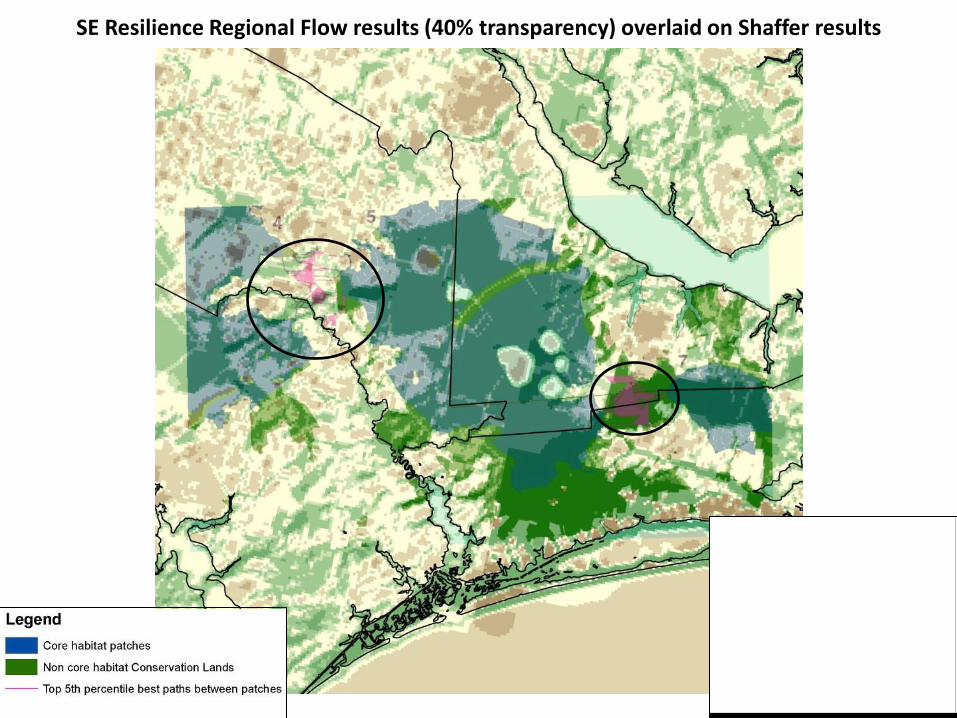
SE Resilience Regional Flow results (40% transparency) overlaid on Shaffer results
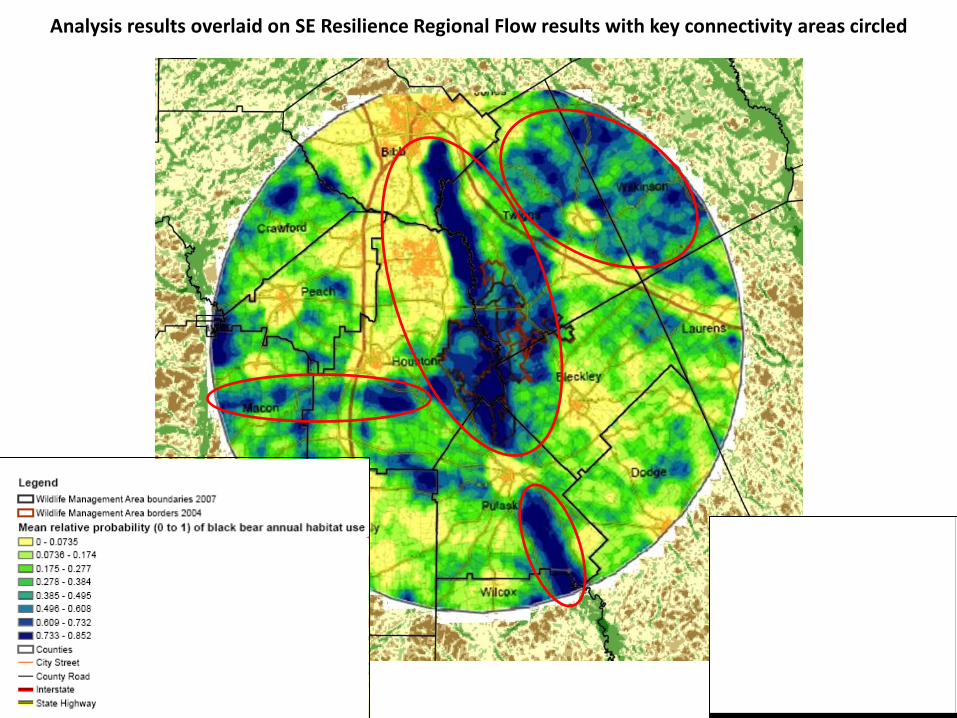
Analysis results overlaid on SE Resilience Regional Flow results with key connectivity areas circled
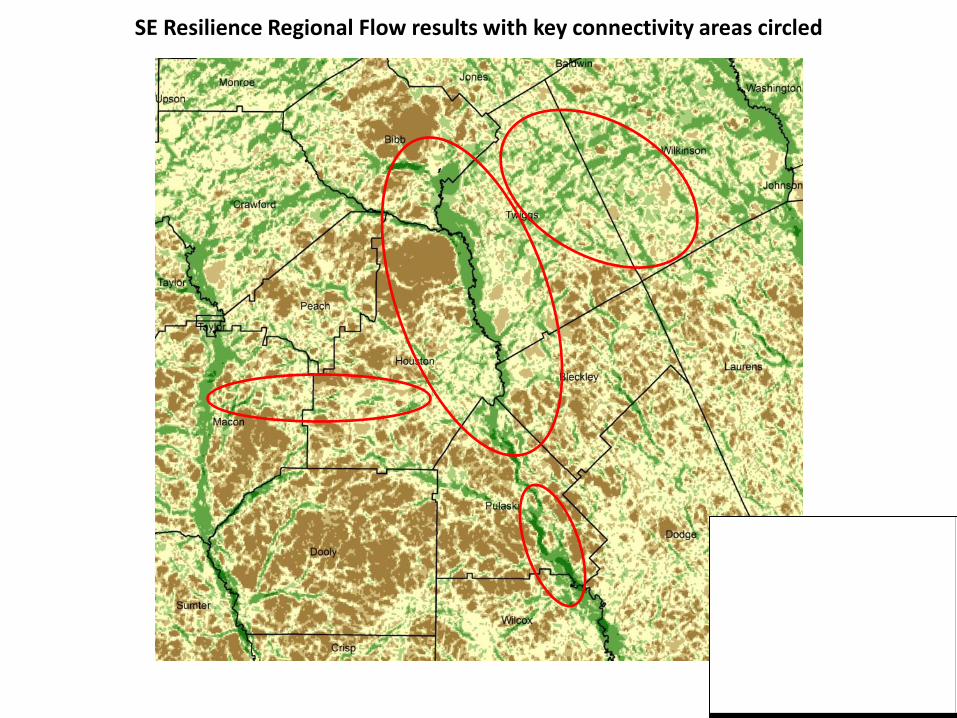
SE Resilience Regional Flow results with key connectivity areas circled
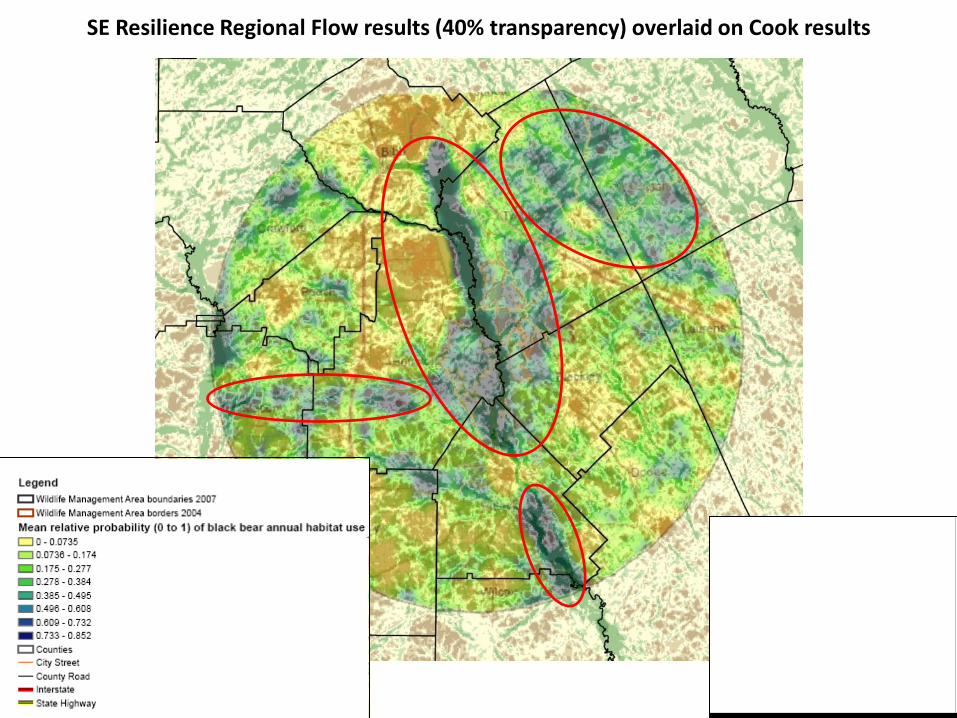
SE Resilience Regional Flow results (40% transparency) overlaid on Cook results
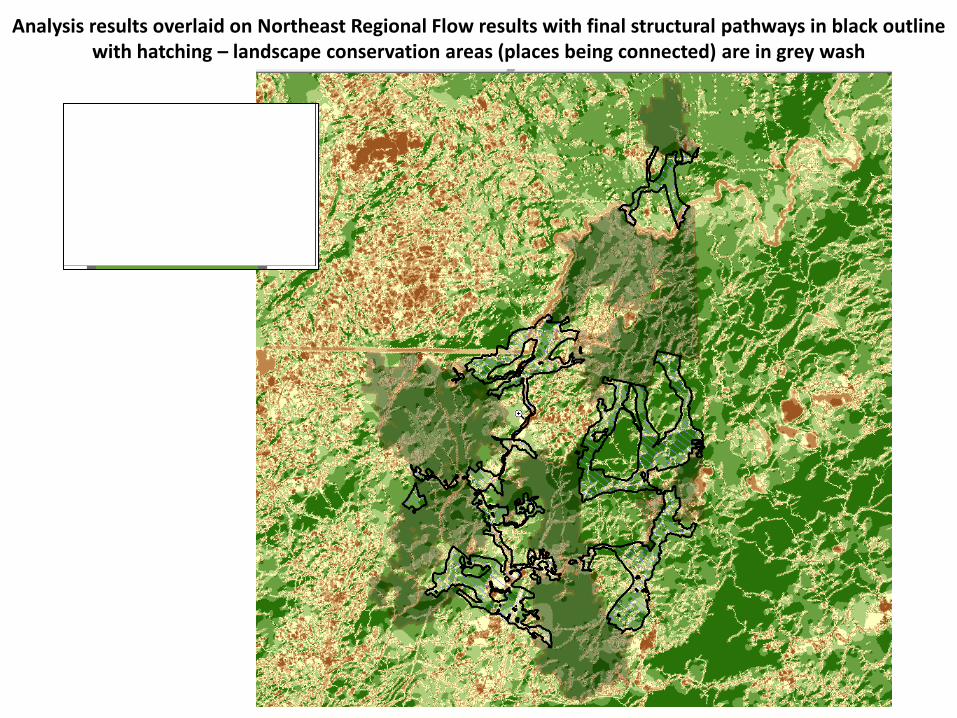
Analysis results overlaid on Northeast Regional Flow results with final structural pathways in black outline with hatching – landscape conservation areas (places being connected) are in grey wash
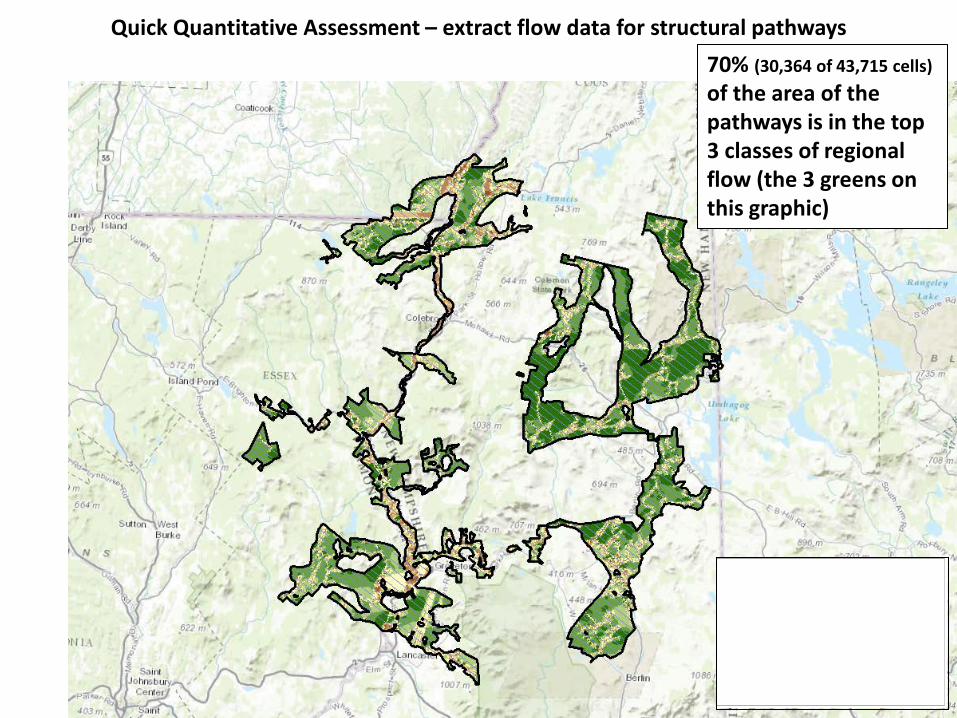
Quick Quantitative Assessment – extract flow data for structural pathways
70% (30,364 of 43,715 cells) of the area of the pathways is in the top 3 classes of regional flow (the 3 greens on this graphic)
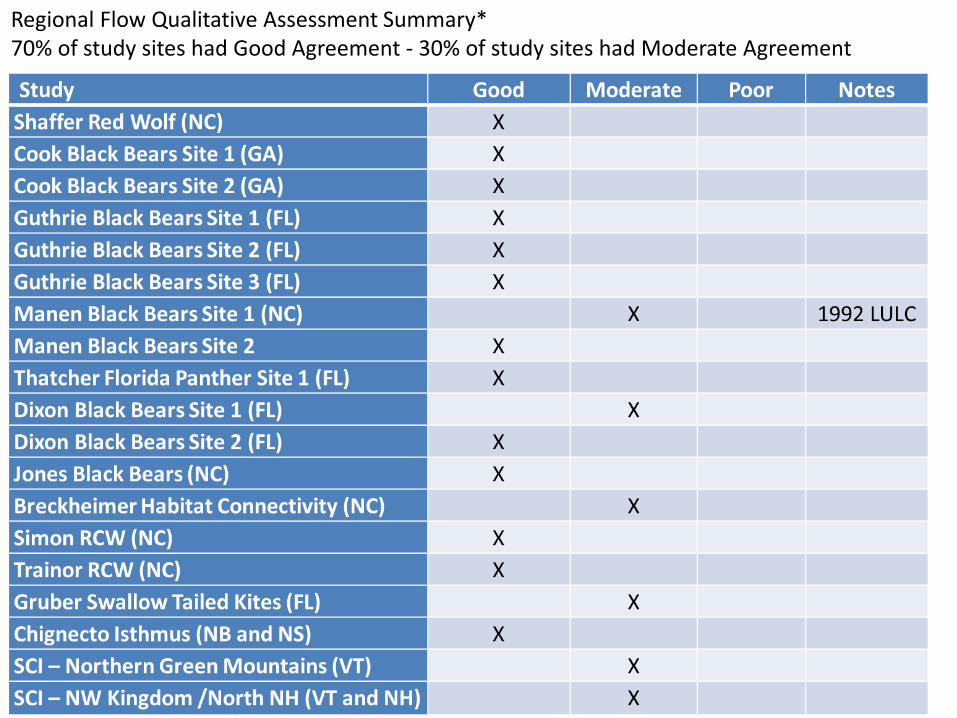
Regional Flow Qualitative Assessment Summary* 70% of study sites had Good Agreement - 30% of study sites had Moderate Agreement

Can Climate Change be incorporated into the Regional
Permeability Model?
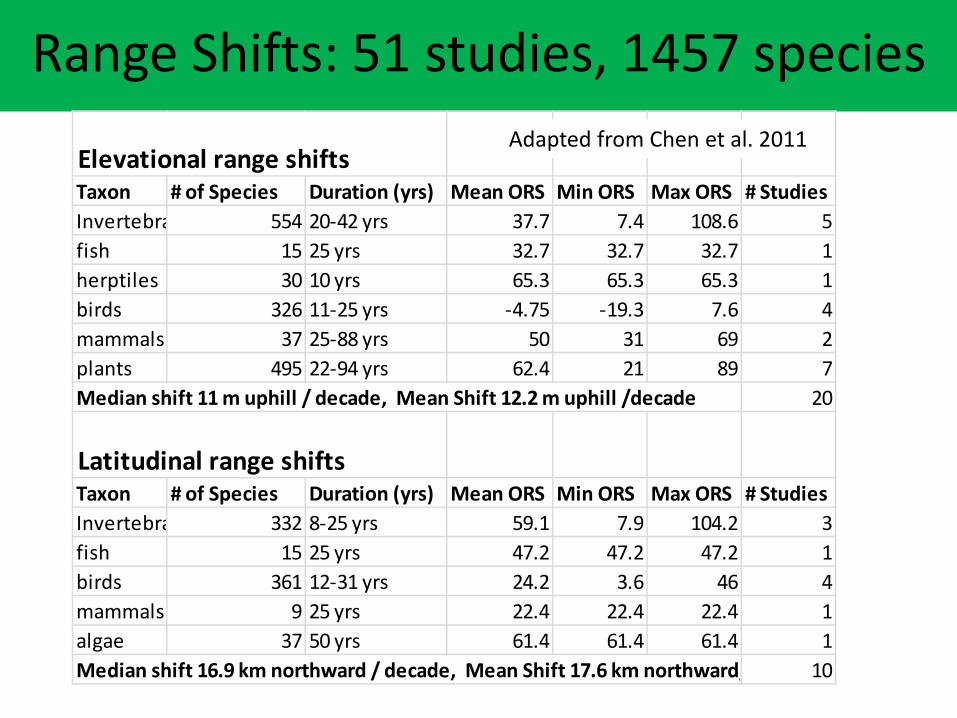
Range Shifts: 51 studies, 1457 species
Elevational range shifts Taxon # of Species Duration (yrs) Mean ORS Min ORS Max ORS # StudiesInvertebra 554 20-42 yrs 37.7 7.4 108.6 5fish 15 25 yrs 32.7 32.7 32.7 1herptiles 30 10 yrs 65.3 65.3 65.3 1birds 326 11-25 yrs -4.75 -19.3 7.6 4mammals 37 25-88 yrs 50 31 69 2plants 495 22-94 yrs 62.4 21 89 7Median shift 11 m uphill / decade, Mean Shift 12.2 m uphill /decade 20
Latitudinal range shifts Taxon # of Species Duration (yrs) Mean ORS Min ORS Max ORS # StudiesInvertebra 332 8-25 yrs 59.1 7.9 104.2 3fish 15 25 yrs 47.2 47.2 47.2 1birds 361 12-31 yrs 24.2 3.6 46 4mammals 9 25 yrs 22.4 22.4 22.4 1algae 37 50 yrs 61.4 61.4 61.4 1Median shift 16.9 km northward / decade, Mean Shift 17.6 km northward/ 10
Adapted from Chen et al. 2011
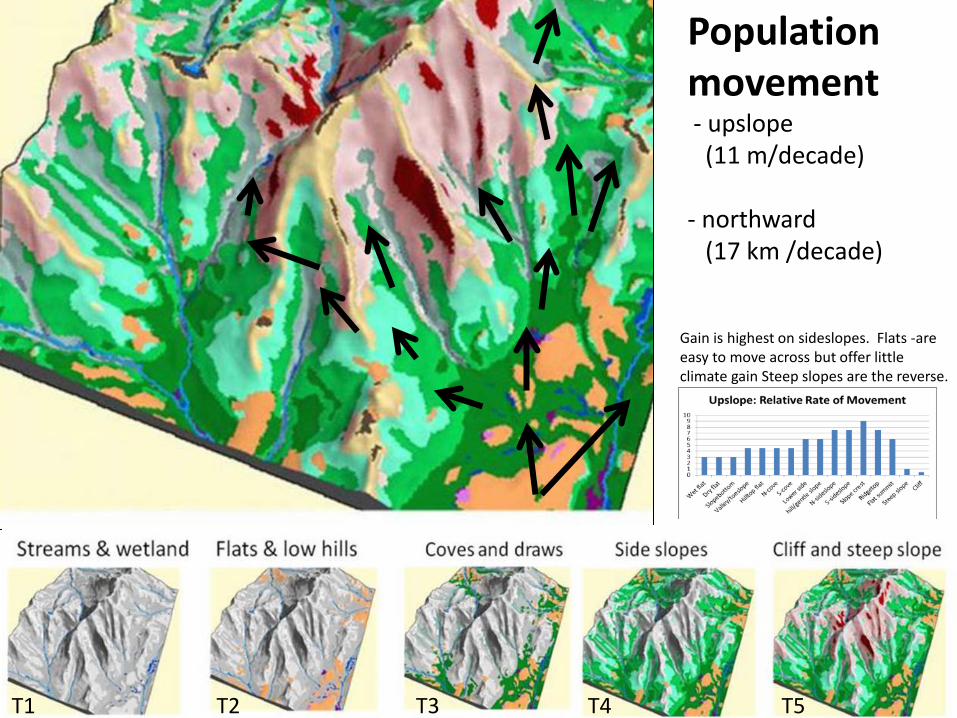
Population movement - upslope (11 m/decade) - northward (17 km /decade)
Gain is highest on sideslopes. Flats -are easy to move across but offer little climate gain Steep slopes are the reverse.
T1 T2 T3 T4 T5
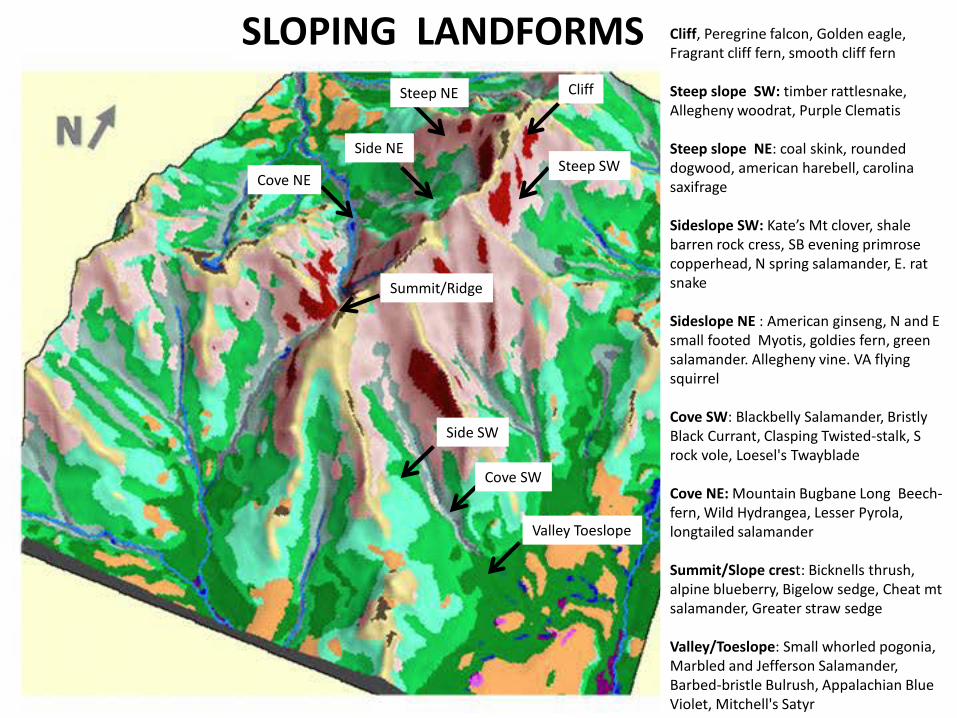
Cliff, Peregrine falcon, Golden eagle, Fragrant cliff fern, smooth cliff fern Steep slope SW: timber rattlesnake, Allegheny woodrat, Purple Clematis Steep slope NE: coal skink, rounded dogwood, american harebell, carolina saxifrage Sideslope SW: Kate’s Mt clover, shale barren rock cress, SB evening primrose copperhead, N spring salamander, E. rat snake Sideslope NE : American ginseng, N and E small footed Myotis, goldies fern, green salamander. Allegheny vine. VA flying squirrel Cove SW: Blackbelly Salamander, Bristly Black Currant, Clasping Twisted-stalk, S rock vole, Loesel's Twayblade Cove NE: Mountain Bugbane Long Beech-fern, Wild Hydrangea, Lesser Pyrola, longtailed salamander Summit/Slope crest: Bicknells thrush, alpine blueberry, Bigelow sedge, Cheat mt salamander, Greater straw sedge Valley/Toeslope: Small whorled pogonia, Marbled and Jefferson Salamander, Barbed-bristle Bulrush, Appalachian Blue Violet, Mitchell's Satyr
Cliff
Side SW
Steep NE
Steep SW
Cove SW
Side NE
Cove NE
Valley Toeslope
Summit/Ridge
SLOPING LANDFORMS
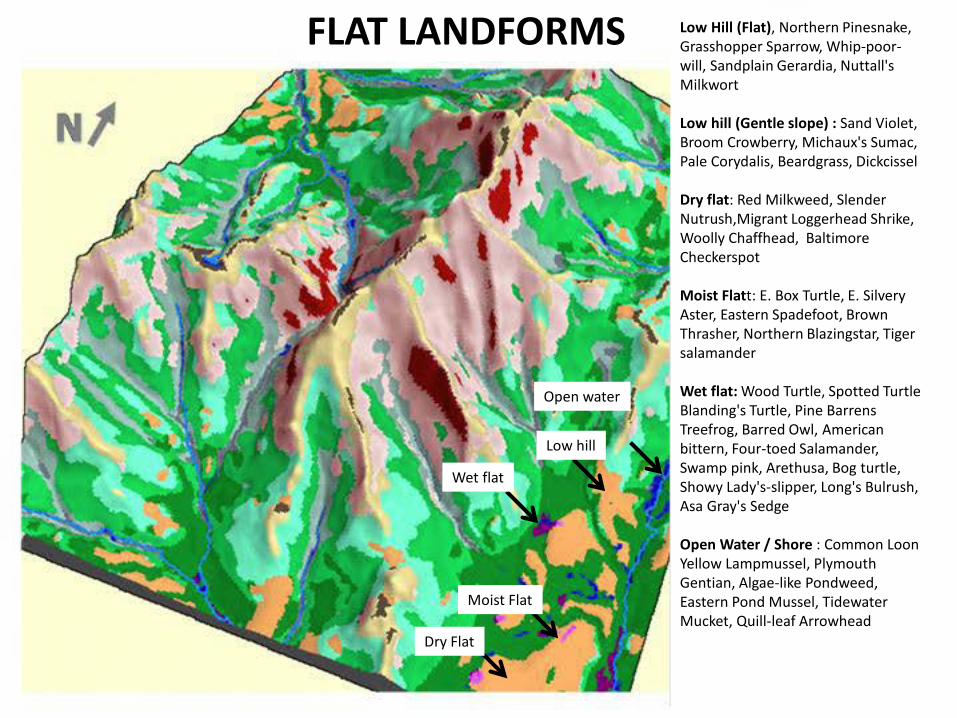
Low Hill (Flat), Northern Pinesnake, Grasshopper Sparrow, Whip-poor-will, Sandplain Gerardia, Nuttall's Milkwort Low hill (Gentle slope) : Sand Violet, Broom Crowberry, Michaux's Sumac, Pale Corydalis, Beardgrass, Dickcissel Dry flat: Red Milkweed, Slender Nutrush,Migrant Loggerhead Shrike, Woolly Chaffhead, Baltimore Checkerspot Moist Flatt: E. Box Turtle, E. Silvery Aster, Eastern Spadefoot, Brown Thrasher, Northern Blazingstar, Tiger salamander Wet flat: Wood Turtle, Spotted Turtle Blanding's Turtle, Pine Barrens Treefrog, Barred Owl, American bittern, Four-toed Salamander, Swamp pink, Arethusa, Bog turtle, Showy Lady's-slipper, Long's Bulrush, Asa Gray's Sedge Open Water / Shore : Common Loon Yellow Lampmussel, Plymouth Gentian, Algae-like Pondweed, Eastern Pond Mussel, Tidewater Mucket, Quill-leaf Arrowhead
Dry Flat
Low hill
Open water
Wet flat
Moist Flat
FLAT LANDFORMS
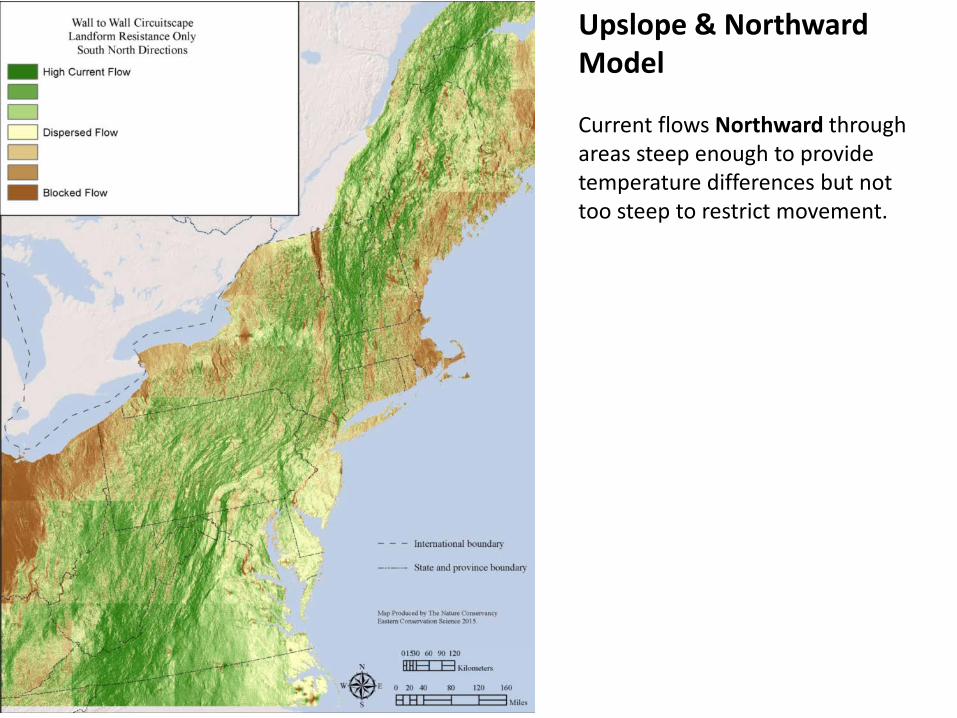
Upslope & Northward Model Current flows Northward through areas steep enough to provide temperature differences but not too steep to restrict movement.
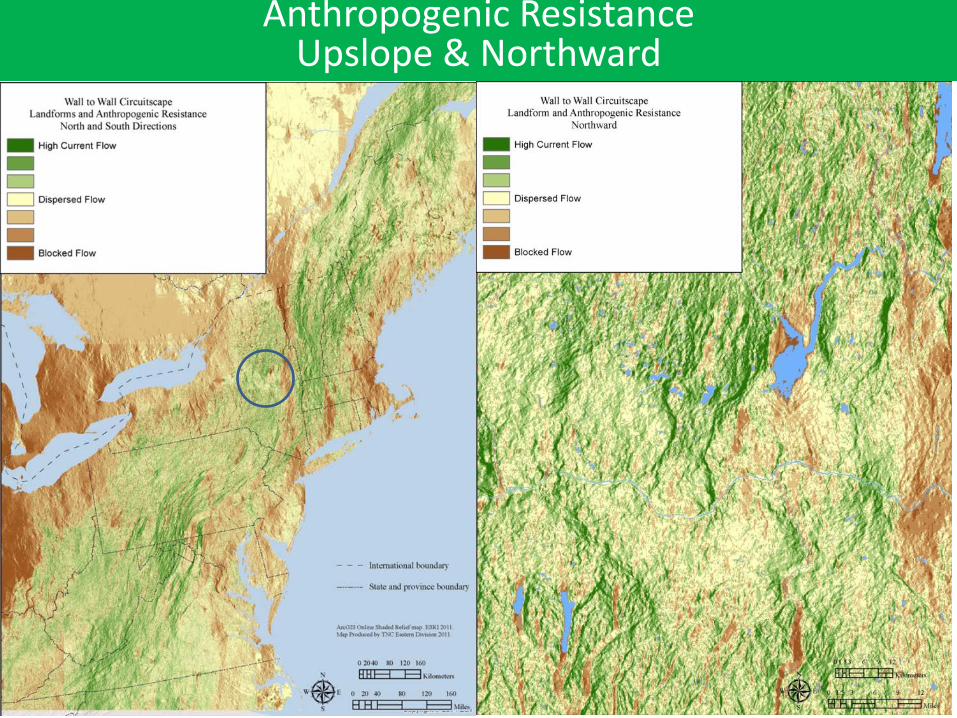
Anthropogenic Resistance Upslope & Northward
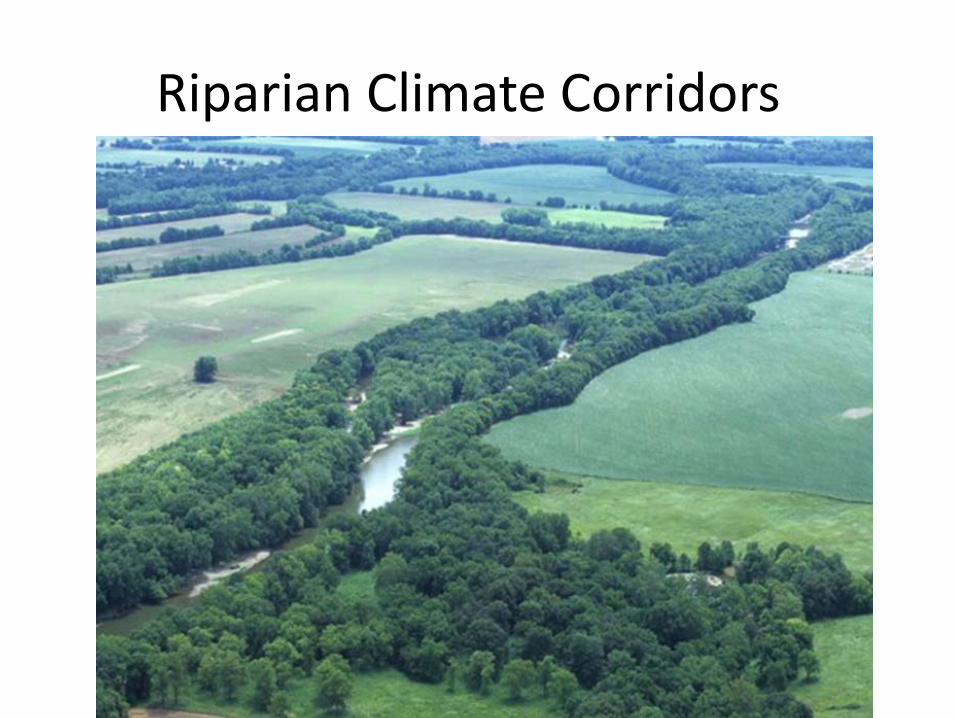
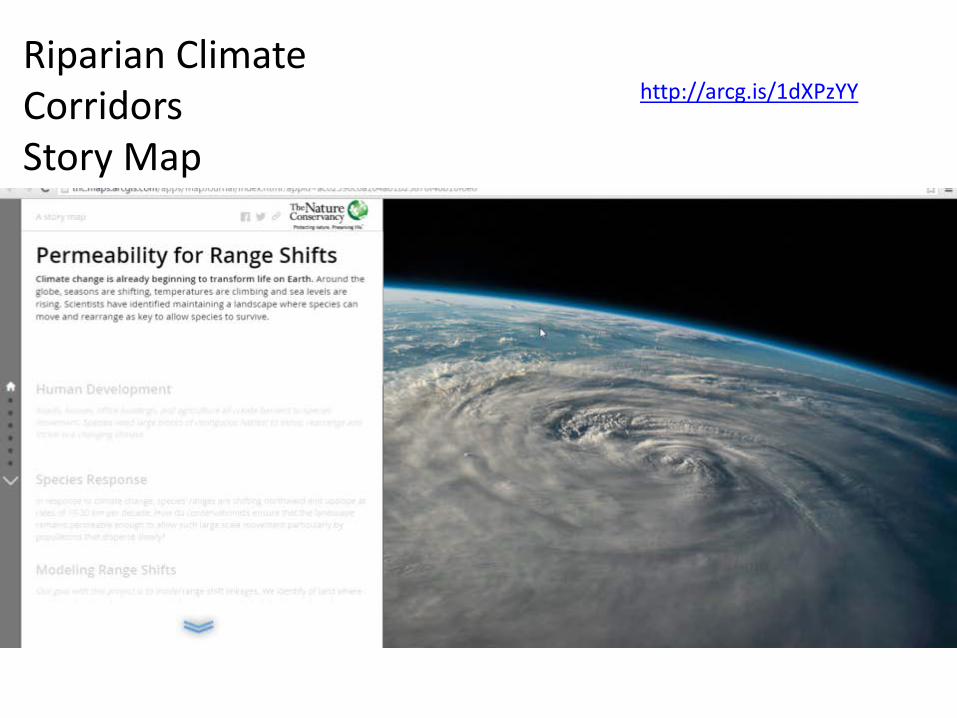
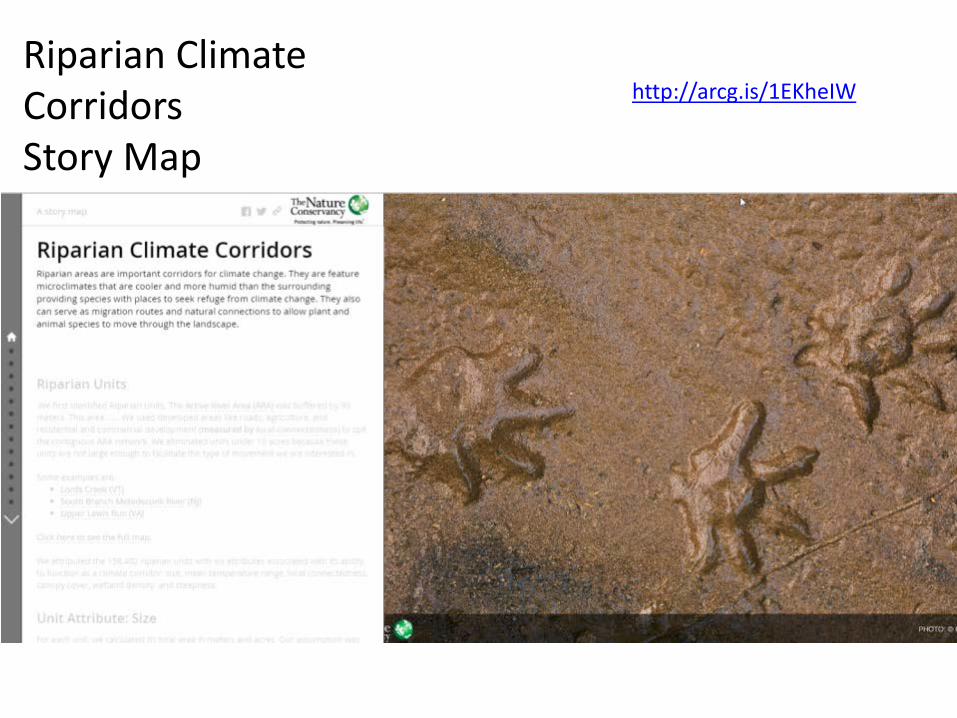
Riparian Climate Corridors
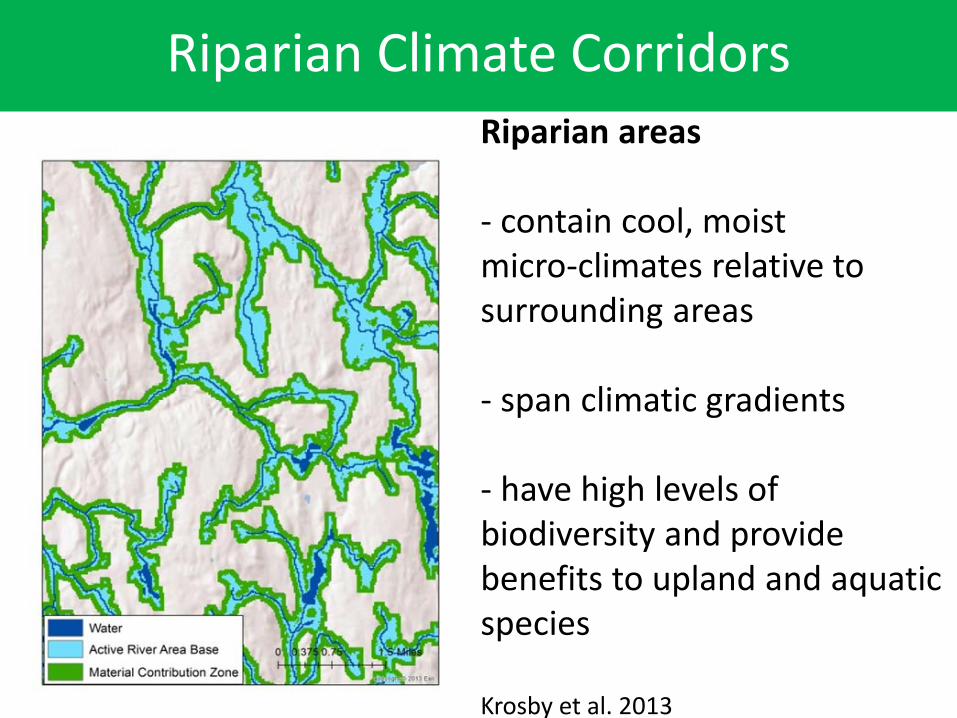
Riparian Climate Corridors Riparian areas - contain cool, moist micro-climates relative to surrounding areas - span climatic gradients - have high levels of biodiversity and provide benefits to upland and aquatic species
Krosby et al. 2013
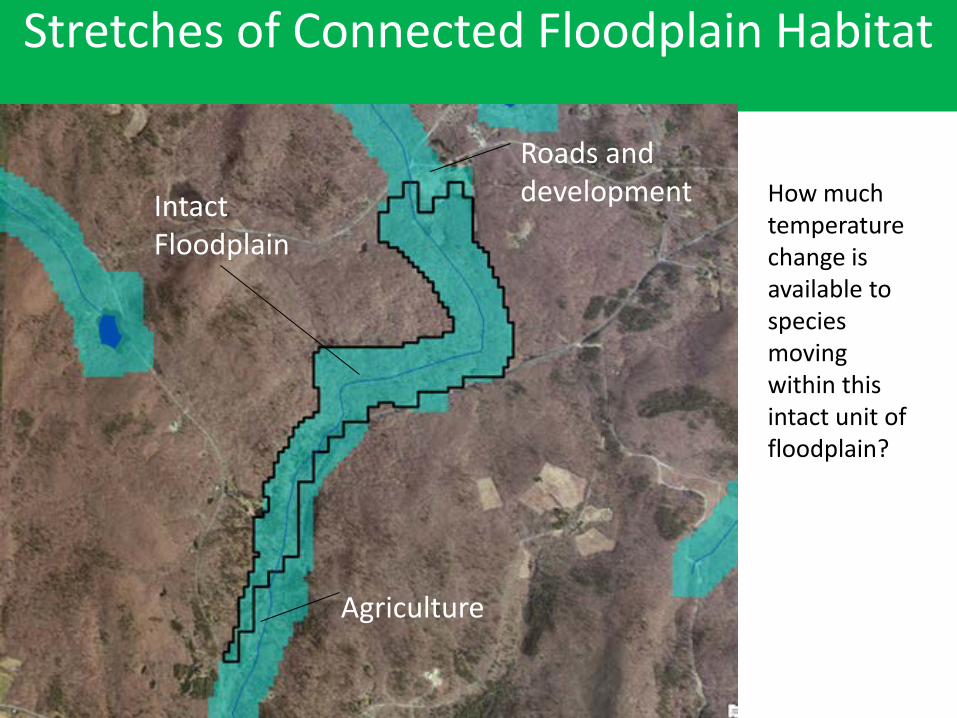
Stretches of Connected Floodplain Habitat
Roads and development
Agriculture
How much temperature change is available to species moving within this intact unit of floodplain?
Intact Floodplain
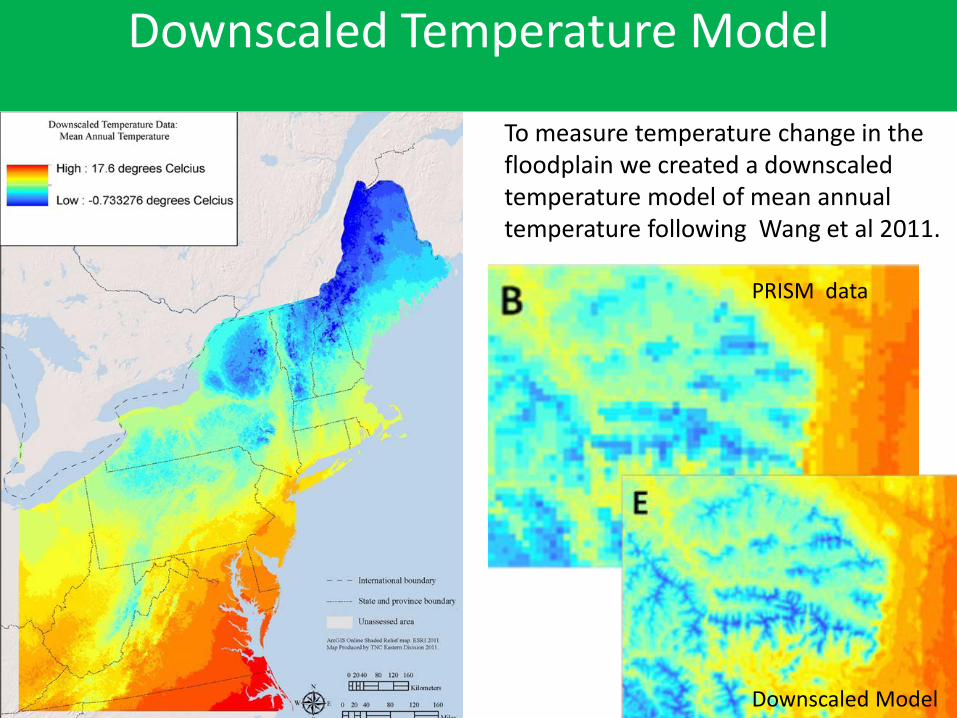
Downscaled Temperature Model
Roads and development
Agriculture
To measure temperature change in the floodplain we created a downscaled temperature model of mean annual temperature following Wang et al 2011.
Intact Floodplain
PRISM data
Downscaled Model
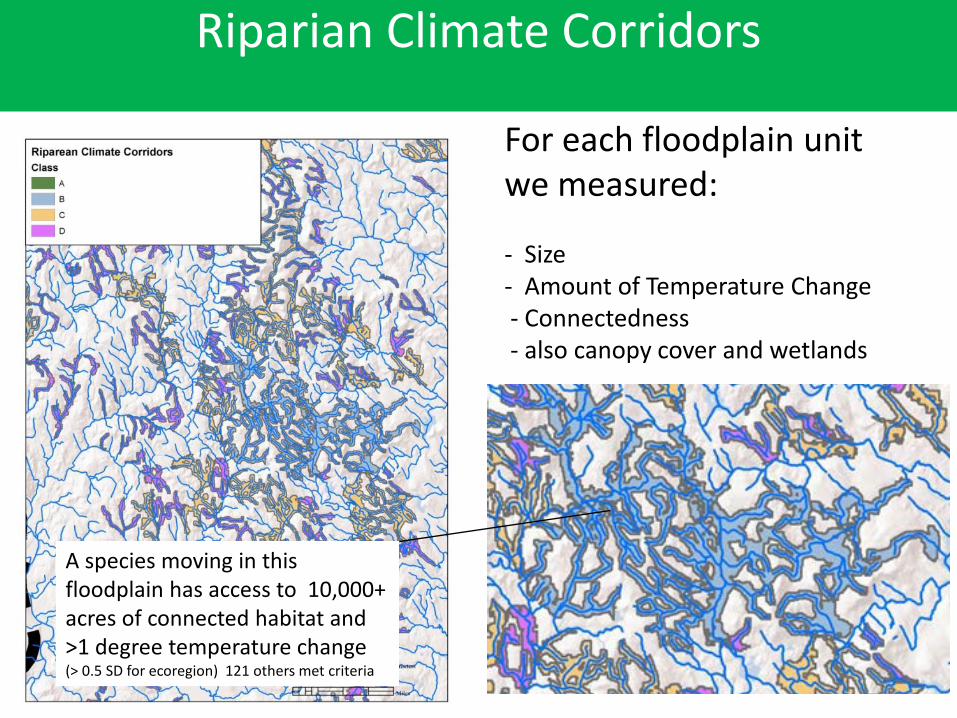
Riparian Climate Corridors
Roads and development
Agriculture
For each floodplain unit we measured: - Size - Amount of Temperature Change - Connectedness - also canopy cover and wetlands
Intact Floodplain
A species moving in this floodplain has access to 10,000+ acres of connected habitat and >1 degree temperature change (> 0.5 SD for ecoregion) 121 others met criteria
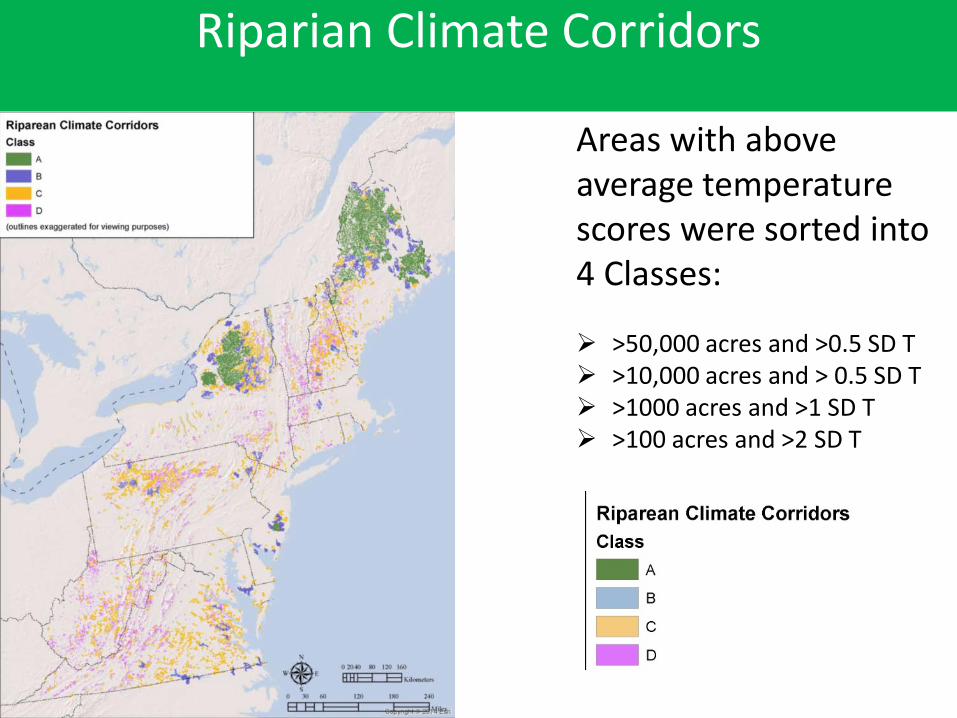
Riparian Climate Corridors
Roads and development
Agriculture
Areas with above average temperature scores were sorted into 4 Classes:
>50,000 acres and >0.5 SD T >10,000 acres and > 0.5 SD T >1000 acres and >1 SD T >100 acres and >2 SD T
Intact Floodplain
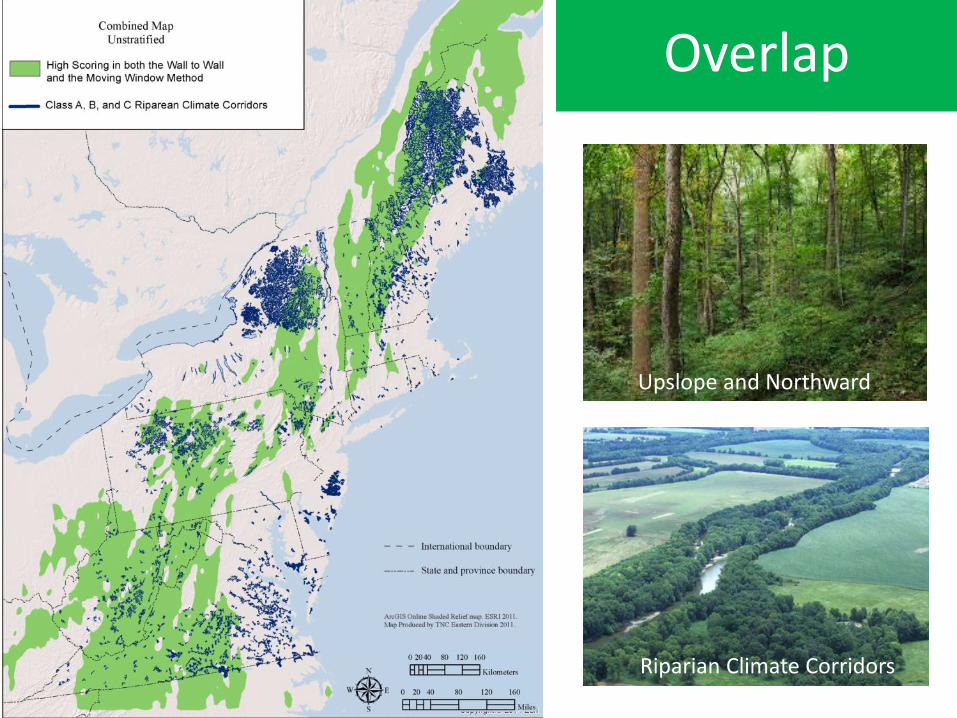
Overlap
Connect natural pixels that differ by ..
Upslope and Northward
Riparian Climate Corridors
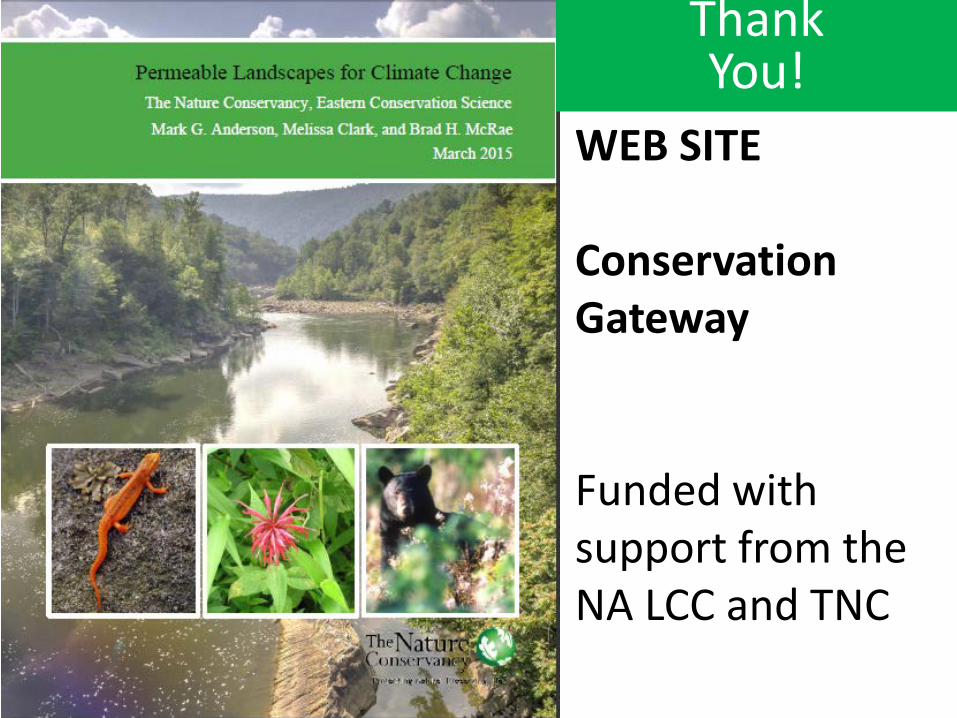
THANK YOU Conservation Gateway:
Thank You!
WEB SITE Conservation Gateway Funded with support from the NA LCC and TNC