Embed Size (px)
Citation preview
MAPPING OF SERVICE DELIVERY GAPS Proof of Concept
Prepared by Altai Consulting for the World Bank | Afghanistan – DECEMBER 2015
TABLE OF CONTENTS
TABLE OF CONTENTS 2
ACKNOWLEDGEMENT 3
ABBREVIATIONS AND ACRONYMS 3
EXECUTIVE SUMMARY 4
1.1 What is Feasible with the Existing Data 4 1.2 What is Required for a More Comprehensive Picture 4
INTRODUCTION 5
METHODOLOGY 6
3.1 Data Collection 6
3.2 Fieldwork 7 3.3 Analysis 7 3.4 Limitations 7
SERVICE DELIVERY 8
4.1 Health 8 4.2 Education 22 4.3 NSP and MRRD Road and CDC Data 35
PROOF-OF –CONCEPT 39
5.1 Assessment of Methodology 39 5.2 Expanding the Service Gap Assessment 39 5.3 Proposed Methodology 40
ACKNOWLEDGEMENT The analysis and reporting in the following was prepared by Antoine Rochette de Lempdes and Holly Robinson, with the support of Kamran Parwana and Fabien Dany, all from Altai Consulting.
All of the GIS mapping was prepared by Antoine Rochette de Lempdes, with the support of Fabien Dany and Philibert de Mercey.
Altai Consulting would like to thank the MIS teams at the Ministry of Education, Ministry of Health, and Ministry of Rural Rehabilitation and Development for their support and contribution to this report; as well as the generous support of the World Bank team.
ABBREVIATIONS AND ACRONYMS BHC Basic Health Centre BHS Basic Health Services CDC Community Development Council
COMHS Complex Health Services CSO Central Statistics Organisation CHF Community Health Facility CHC Comprehensive Health Centre CHS Comprehensive Health Services
CHW Community Health Worker GoA Government of Afghanistan MAIL Ministry of Agriculture, Irrigation, and Livestock MIS Management Information Systems MoE Ministry of Education
MoHE Ministry of Higher Education MoPH Ministry of Public Health MRRD Ministry of Rural Rehabilitation and Development NRVA National Risk and Vulnerability Assessment NSP National Solidarity Programme PHS Primary Health Services
PTR Pupil-Teacher Ratio SHC Secondary Health Centre
ALTAI CONSULTING – MAPPING OF SERVICE DELIVERY GAPS IN 2 AFGHAN PROVINCES – DECEMBER 2015
MAPPING OF SERVICE DELIVERY
GAPS Proof of Concept 4
FINAL REPORT December 2015
EXECUTIVE SUMMARY For newly created governments in a post-conflict environment, creating and gaining legitimacy can filter down to every level, including the provision of public services around the country. However, in creating
effective public services, accurate and updated data is critical to monitor service presence and quality at the district and community level. For this reason, Management Information Systems (MIS) were integrated to the scope of the development of key line ministries over the last 15 years, with varied success across sectors.
Altai Consulting has been engaged by the World Bank to provide a proof of concept for the mapping of the current level of service delivery through data collated by three ministries, forming the first step in
understanding the current gap in basic services provision around Afghanistan. This research focuses on two contrasting provinces, allowing for analysis into how accurate and useful such data can be when bringing together the information available from the MIS of the Ministry of Education (MoE), Ministry of Public Health (MoPH), and Ministry of Rural Rehabilitation and Development (MRRD).
This pilot project shows us that while a number of aspects of service delivery can be mapped out through the data available in Ministries’ MIS, a lot of gaps and inaccuracies can be found in current data bases, and more comprehensive research including numerous field checks would be required to fully map out service delivery gaps throughout Afghanistan. While the total cost of filling gaps in services provision is estimated within the context of this research, this first extrapolation would require refinement in order
to be actionable. Concrete next steps on what would be needed to more accurately assess gaps and costs are outlined below.
1.1 WHAT IS FEASIBLE WITH THE EXISTING DATA
With the data currently available and shared for this project, Altai was able to undertake a fairly
comprehensive mapping exercise of the education and health assets in the country, including:
Community Development Council (CDC) data including, for example, disbursement levels and population numbers;
Over or under-capacity in healthcare according to population served; and in education according
to the ratio of teacher to student; Average distance to assets, through the road network (although a functionally limited data
source), or through an “as the crow flies” analysis; Capacity analysis based on data such as the level of population per staff member, equipment
levels, bed numbers, ratios of female staff, teacher qualifications, etc.; Identification of CDCs outside of the standard distance from an asset.
1.2 WHAT IS REQUIRED FOR A MORE COMPREHENSIVE PICTURE
To complement the available data and best support the work of the ministries, as well as the Citizen’s
Charter planning department, Altai proposes a number of supporting elements to the methodology:
Clearly defined standards measuring what is considered “accessible”; Geolocation of all assets. For many assets GPS coordinates were found to be missing,
opening an opportunity for future programmes such as the Citizen’s Charter to collect
complementary data; Road mapping data, which is particularly needed for any distance based analysis, is too often
limited to one point (a community where a road was built by a CDC), without any reference to start and end points or path, that would be necessary to future mapping exercises.
Integrating data related to off-budget structures within the ministries’ MIS is highly necessary to gain a comprehensive picture of all services available in a given province;
Fieldwork for verification purposes would allow for the verification of GPS coordinates and further analyse the capacity, quality and extent of service delivery;
ERREUR ! UTILISEZ L'ONGLET ACCUEIL POUR APPLIQUER HEADING 1 AU TEXTE QUE VOUS SOUHAITEZ FAIRE
APPARAITRE ICI.
FINAL REPORT December 2015
MAPPING OF SERVICE DELIVERY GAPS Proof of Concept
5
The beginning of the Citizen’s Charter could provide an interesting moment to cooperate with and develop the capacity of the Central Statistics Organisation (CSO), ideally resulting in a direct feed of vital data related to each CDC and the Citizen’s Charter services.
INTRODUCTION Despite strong economic growth over the period, continuous improvement in human development indicators, and increasing international spending, the latest data from the National Risk and Vulnerability Assessment (NRVA) indicates that there has been no significant progress in poverty reduction over the four-year period 2007-2011 in Afghanistan. Analysis suggests this is largely attributable to widening
inequalities; and thus for poverty to decrease, spatial disparities in welfare have to be significantly reduced.
In line with this objective, the Government of Afghanistan (GoA) wishes to develop a National Programme on Citizens Charter, intending to provide universal access to a core set of basic services to communities. This Charter commits not only to the services to be delivered to the population, but the
quality of the service received. As such, each ministry responsible for the implementation of sectoral services will develop specific quality standards encompassing the service. Initial key ministries to be involved will be the MRRD, MoE, MoPH, and of Agriculture Irrigation, and Livestock (MAIL); concentrating on the following service delivery sectors:
Maternal and child health services;
Basic education access for all village children; Water management (safe drinking water, irrigation, and flood control); Improved farming technologies and delivery of extension services;
Farm to market roads; Rural renewable energy.
In order to design the programming, the team evidently need to understand the “gap” between what is currently being delivered, and what needs to be delivered as a part of the programme.
A starting point for such an objective is to understand the availability of assets that have already been created at the community level (and by aggregation at the district and provincial level) by the key participating ministries.
As such, Altai Consulting has been engaged by the World Bank to provide a proof of concept for the mapping of the current level of service delivery through data collated by the above ministries, as a
means to understand the current gap in provision. This research seeks to explore what is feasible in this regard by conducting a pilot focusing on two contrasting provinces, allowing for analysis on how useful such data can be when the MIS of key ministries (MoE, MoPH, MRRD) are brought together.
More specifically, the aim of this research is to develop and refine a methodology to explore service delivery gaps in health, education, and other key infrastructure areas (as feasible) at the community, district, and provincial levels, through the mapping of service assets.
ALTAI CONSULTING – MAPPING OF SERVICE DELIVERY GAPS IN 2 AFGHAN PROVINCES – DECEMBER 2015
MAPPING OF SERVICE DELIVERY
GAPS Proof of Concept 6
FINAL REPORT December 2015
METHODOLOGY The specific tasks required to complete this pilot include:
1. The exploration of the MIS of the Ministries of Education, Health, and Rural Rehabilitation and
Development’s National Solidarity Programme (NSP) to uncover what picture this can provide of service assets;
2. To collate the data from these different sources into maps; 3. To prepare a short report indicating:
The most appropriate methodology for expanding this at a wider scale;
The extent of asset gaps uncovered from the data; Coverage “black holes”, and the reasons for this; The costs of improving access to ensure equitable access by all.
3.1 DATA COLLECTION
3.1.1 SAMPLE
GEOGRAPHICAL SAMPLE
Two contrasting provinces, in terms of their geographic location (in reference to their distance from Kabul), and their poverty profile were chosen for this proof of concept pilot.
Balkh, with a poverty rate of 21.6%1, was chosen as representative of provinces relatively well-off –
which would typically be considered as having a broader coverage of services, and greater accessibility and security.
In contrast, Badakhshan, with a poverty rate of 62.7%, was chosen as representative of geographically remote provinces within a region suffering from insecurity and a region identified as lagging.2
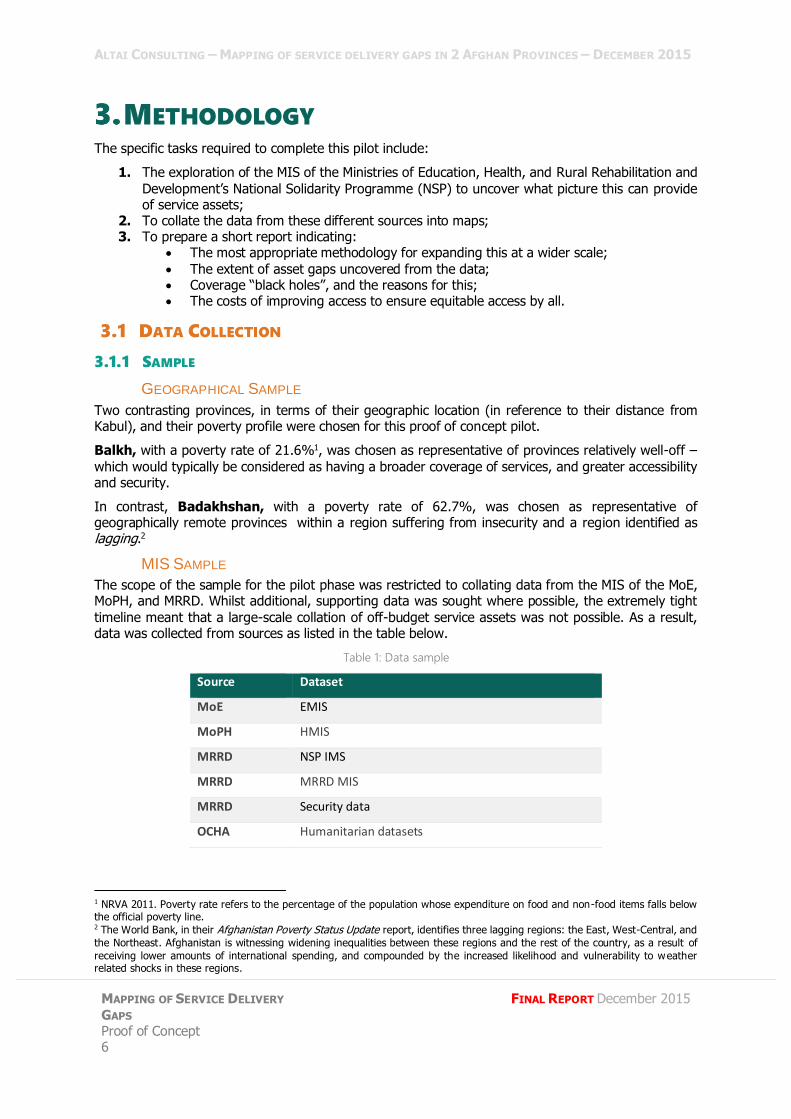
MIS SAMPLE
The scope of the sample for the pilot phase was restricted to collating data from the MIS of the MoE, MoPH, and MRRD. Whilst additional, supporting data was sought where possible, the extremely tight
timeline meant that a large-scale collation of off-budget service assets was not possible. As a result, data was collected from sources as listed in the table below.
Table 1: Data sample
Source Dataset
MoE EMIS
MoPH HMIS
MRRD NSP IMS
MRRD MRRD MIS
MRRD Security data
OCHA Humanitarian datasets
1 NRVA 2011. Poverty rate refers to the percentage of the population whose expenditure on food and non-food items falls below the official poverty line. 2 The World Bank, in their Afghanistan Poverty Status Update report, identifies three lagging regions: the East, West-Central, and
the Northeast. Afghanistan is witnessing widening inequalities between these regions and the rest of the country, as a result of
receiving lower amounts of international spending, and compounded by the increased likelihood and vulnerability to weather related shocks in these regions.
ERREUR ! UTILISEZ L'ONGLET ACCUEIL POUR APPLIQUER HEADING 1 AU TEXTE QUE VOUS SOUHAITEZ FAIRE
APPARAITRE ICI.
FINAL REPORT December 2015
MAPPING OF SERVICE DELIVERY GAPS Proof of Concept
7
3.2 FIELDWORK
Supporting the data collection, a basic level of fieldwork was undertaken to explore what might be
possible in a broader attempt to map out service delivery gaps. As was the case throughout this project, the methodology was experimental. Province-level discussions were undertaken with key personnel in the line departments of the MoE and MoPH. These provincial discussions sought to identify explanations and verification of the gaps in service delivery. An international consultant and a senior national consultant directed the interviews, focusing on collating field level information on:
Planning processes;
Current plans for new facilities, and how these were decided upon; Major challenges faced in delivering services in their province; Major gaps in service delivery in their province, and why they existed;
Groups of people excluded from service delivery, and why; What they considered would be required to fill these gaps; Support required in order to complete service delivery;
How quality assessment is currently undertaken, and how this could be improved.
3.3 ANALYSIS
It should be noted that the data and maps presented in this report are fashioned to present what is
possible with the existing data and the different methodologies to do so in order to fully explore the proof of concept, rather than as an exhaustive analysis.
3.4 LIMITATIONS
3.4.1 ACCESS TO DATA
Data used for this proof of concept is limited to the data that was shared by the ministries. Whilst eventually all three of the ministries shared portions of the data requested from them, the MoPH was the most collaborative ministry, granting Altai with full access to their data sets, while data collected from other ministries was limited to extractions organised by their MIS teams.3
3.4.2 OFF-BUDGET DATA
Within the restrictions of the pilot, every endeavour was made to include off-budget service assets in the mapping exercise. However, given the aim of mapping out service delivery to support the Citizen’s Charter, it is important to keep in mind the objectives of such a charter. Whilst currently, it is undeniable that a large portion of the Afghan service delivery is either directly or indirectly delivered by off-budget means, the entire purpose of the Citizen’s Charter is to reinstitute and rehabilitate the Afghan state to
be the legitimate provider of basic services. As such, whilst current off-budget service provision and assets may be filling black holes in government coverage, and can therefore act as an explanatory factor as to why there may currently be “holes” in coverage, ultimately the aim is to have government-provided services covering the population. As such, the absence of off budget data is not inhibitory to the extrapolation of the data to be meaningful for its intent.
3 For example, NSP provided access to their online data, which they referred to as including the full set of their data. However,
Altai Consulting struggled to access any of the data through the portal, and eventually relied on an extraction of data supplied by
NSP IMS staff. It appeared that all available data was not accessible online, which is understandable but will have to be factored
in, and complemented by a strong collaboration with the NSP IMS team if further service mapping is undertaken.
ALTAI CONSULTING – MAPPING OF SERVICE DELIVERY GAPS IN 2 AFGHAN PROVINCES – DECEMBER 2015
MAPPING OF SERVICE DELIVERY
GAPS Proof of Concept 8
FINAL REPORT December 2015
SERVICE DELIVERY
4.1 HEALTH
4.1.1 HEALTH IN THE CITIZEN’S CHARTER
Health in the Citizen’s Charter concentrates on the improvement of the health of mothers and children, with a focus on rural areas, through three components:
Establishment of 10,000 Community Health Facilities (CHF) in rural areas of the country where
access to primary healthcare services (particularly in maternal and child healthcare) is below 50%. Costed at 15,000 USD per CHF (150,000,000 USD for the total 10,000 CHFs).
Incentivising of 23,000 Community Health Workers (CHWs) through a performance-based
payment mechanism. Maximum cost of 170,000,000 USD over three years.
Construction of 218 health facilities that currently operate in private and/or non-standard buildings in rural areas in 34 provinces of Afghanistan.
Total budget to construct 216 Basic Health Centres (BHCs) and CHCs estimated at 35,700,000 USD
4.1.2 THE DATA
THE MIS
The MoPH MIS team appeared exceptionally organised, transparent, and supportive. They had a full set of GPS data on health facilities, with a large amount of additional data on the capacity, performance, and catchment areas of these facilities. This meant that mapping out MoPH data was easier, and more
reliable than much of the other data.
The HMIS was well organised, and collected a large variety of data targeted towards feeding into specific indicators defined by the Basic Package of Health Services (BPHS) and Essential Package of Hospital Services (EPHS). While gaps remain, it appeared to be the best organised MIS that Altai explored.
DATA QUALITY
A number of data points were however missing from the available health data, including:
12 health facilities in Balkh missing coordinates;
95 health facilities without information on catchment population across the two provinces. For these, a theoretical catchment population was substituted for the analysis – 200,000 for a provincial hospital; 100,000 for a district hospital; 50,000 for a CHC; 20,000 for a BHC; and 1,500 for a Secondary Health Centre (SHC).
DATA GAPS
Capturing the entire network of health assets posed a particular challenge. While MoPH appeared to
have quite solid records of all health clinics and hospitals within the public system, as far as Altai could ascertain, private clinics were not comprehensively tracked anywhere. A small number of private clinics were registered with the ministry, but a far greater number were found to be acting outside of any formal system. As such, these were not covered in the MIS data, and could not be fully captured. Again however, the absence of these within the analysis is not necessarily problematic, given the concentration of this task on mapping government service delivery. It is also likely that most private clinics are located
within urban areas, therefore not polluting much of the gap analysis that is largely situated in rural areas.
ERREUR ! UTILISEZ L'ONGLET ACCUEIL POUR APPLIQUER HEADING 1 AU TEXTE QUE VOUS SOUHAITEZ FAIRE
APPARAITRE ICI.
FINAL REPORT December 2015
MAPPING OF SERVICE DELIVERY GAPS Proof of Concept
9
4.1.3 ANALYSIS
When considering what was most interesting to map from the available MoPH data, a number of factors were considered, including:
Access to the different levels of health facilities; The population dependent on each health facility; Available bed numbers per population.
Additionally, given that the existence alone of a health clinic does not reflect the provision of a centre
that provides a service, more qualitative, capacity-driven analysis was undertaken, looking into, for example:
Staff levels per population; The availability of certain equipment in a province;
The gender breakdown of staff available.
STANDARDS
Setting standards for assessing the adequacy of health care is a difficult measurement, in that the required health services in a country are dependent on a number of factors. These, for example, include the burden of disease, or the social acceptability of certain medical services; with all factors compounded by demographic pressures within a country.
The health system in Afghanistan is relatively more standardised than other sectors, with the EPHS, developed in 2005, establishing a set framework for secondary health services and integrating them with the primary health care system established in 2003 and the BPHS.
In order to analyse the CDCs access to different levels of health services, four different categories of facilities were retained:
Primary health services (PHS) (delivered by all facilities: SHC, BHC, CHC, District or
Provincial Hospitals)
Basic health services (BHS) (delivered by BHC, CHC, District or Provincial Hospitals)
Comprehensive health services (CHS) (delivered by CHC, District or Provincial
Hospitals)
Complex health services (COMHS) (delivered only by District or Provincial Hospitals)
ANALYSIS
Three methods were undertaken for assessing the gaps in health facilities, in order to provide a number of options for assessment if moving forward from the proof of concept. Each of the separate methods offer differing angles to assess the gap in healthcare, and provide an interesting insight into the way data can be manipulated to provide innovative answers.
METHOD 1: The first methodology uses areas defined theoretically to assess the catchment area of the highest level of health provision. The polygons as outlined in the maps below represent the area around
the closest CHC, or District or Provincial Hospital. These areas correspond approximately to districts, but are more coherent to use for health analysis as it is optimised to display the areas that are the closest to a facility offering CHS. It should be noted that for areas where several facilities were close to each other (three in Mazar, and three in Kholm), the facilities were merged to ensure the polygons were still representative of a bigger area, and did not only include a small part of a city.
ALTAI CONSULTING – MAPPING OF SERVICE DELIVERY GAPS IN 2 AFGHAN PROVINCES – DECEMBER 2015
MAPPING OF SERVICE DELIVERY
GAPS Proof of Concept 10
FINAL REPORT December 2015
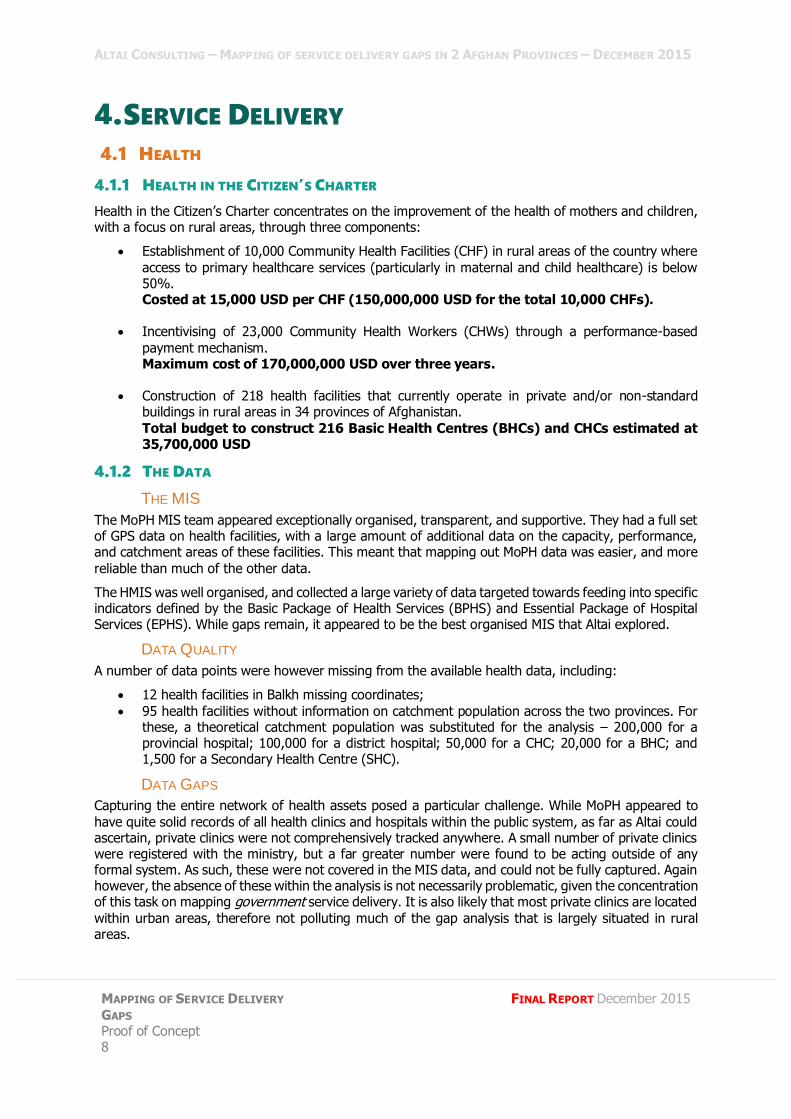
Figure 1: Ratio of Population Served to Total Population in Comprehensive Health Care Services in Balkh
The same areas could not be designed for BHC or SHC, as the distance between centres were too close. Given that BHCs and SHCs are not designed to cover the whole territory of a province, those polygons would have been misleading. Therefore, for the same analysis with basic or PHS, the identical polygons as for CHS were used.
Three maps were created – one for each of the primary, basic, and comprehensive health coverage,
representing for each polygon the ratio of total catchment population for all health facilities in the area (data given by MoPH, representing the “capacity”) over the total population in the area. These maps help to identify underserved areas, and consequently where new centres would be most effectively located. For example, if two adjacent areas or districts are shown to be under-covered, a new facility would be well placed in-between these two areas.
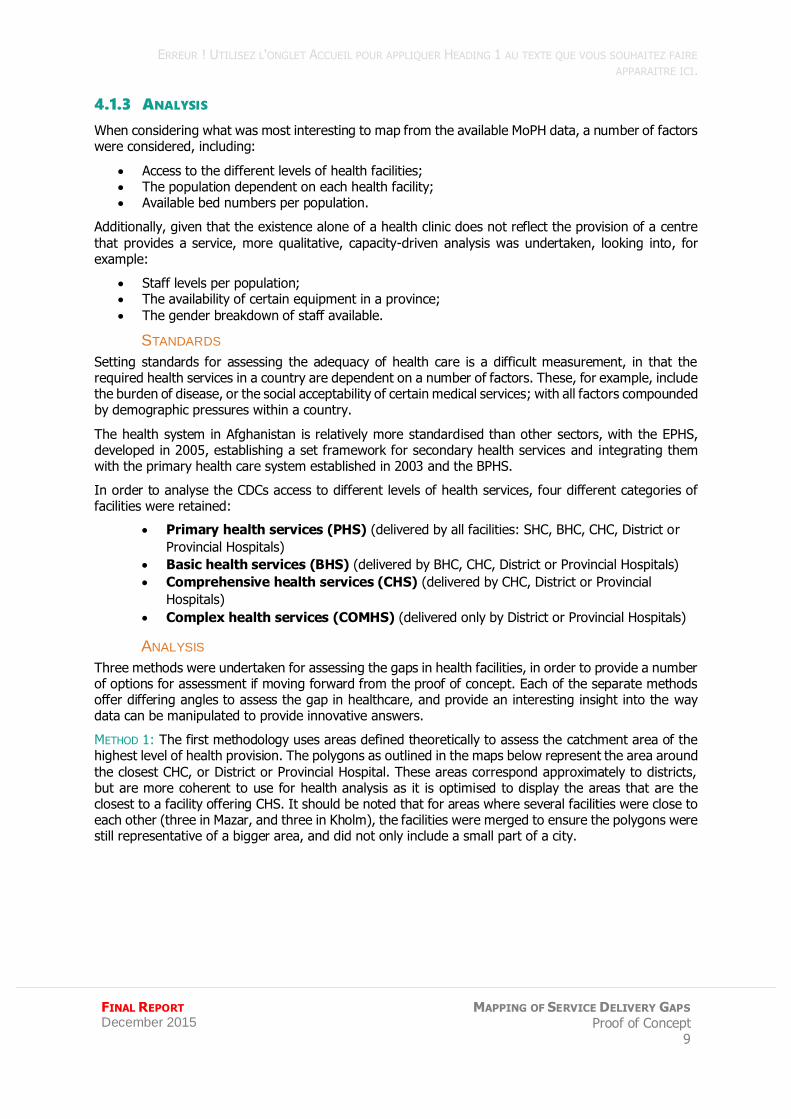
A final map was created, representing over or under-capacity in CHS in each of those areas. The over
or under-capacity was formulated by calculating the difference between the catchment population for all health facilities in each area, and the population of all CDCs linked to their nearest facility.
ERREUR ! UTILISEZ L'ONGLET ACCUEIL POUR APPLIQUER HEADING 1 AU TEXTE QUE VOUS SOUHAITEZ FAIRE
APPARAITRE ICI.
FINAL REPORT December 2015
MAPPING OF SERVICE DELIVERY GAPS Proof of Concept
11
Figure 2: Over-Capacity and Under-Capacity in Comprehensive Health Care Services by Area in Balkh
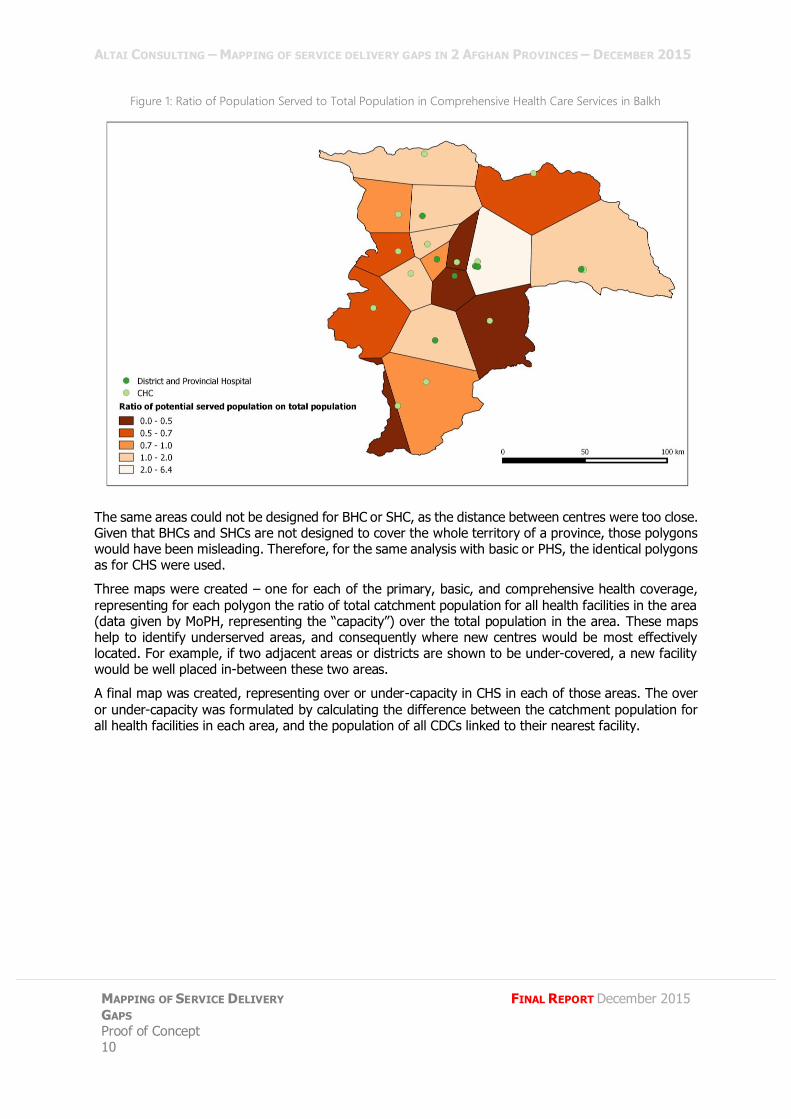
METHOD 2: For the second method, the statistical repartition of the distance between each CDC and its nearest facility was investigated, as shown for Balkh in the table below.
The 20% of CDCs that were the furthest away from a health facility (183 CDCs for Balkh) were then identified and placed on a map as shown below. The CDCs are displayed per their population, and as such, the maps allow for the identification of areas unserved by certain health services (according to a
ALTAI CONSULTING – MAPPING OF SERVICE DELIVERY GAPS IN 2 AFGHAN PROVINCES – DECEMBER 2015
MAPPING OF SERVICE DELIVERY
GAPS Proof of Concept 12
FINAL REPORT December 2015
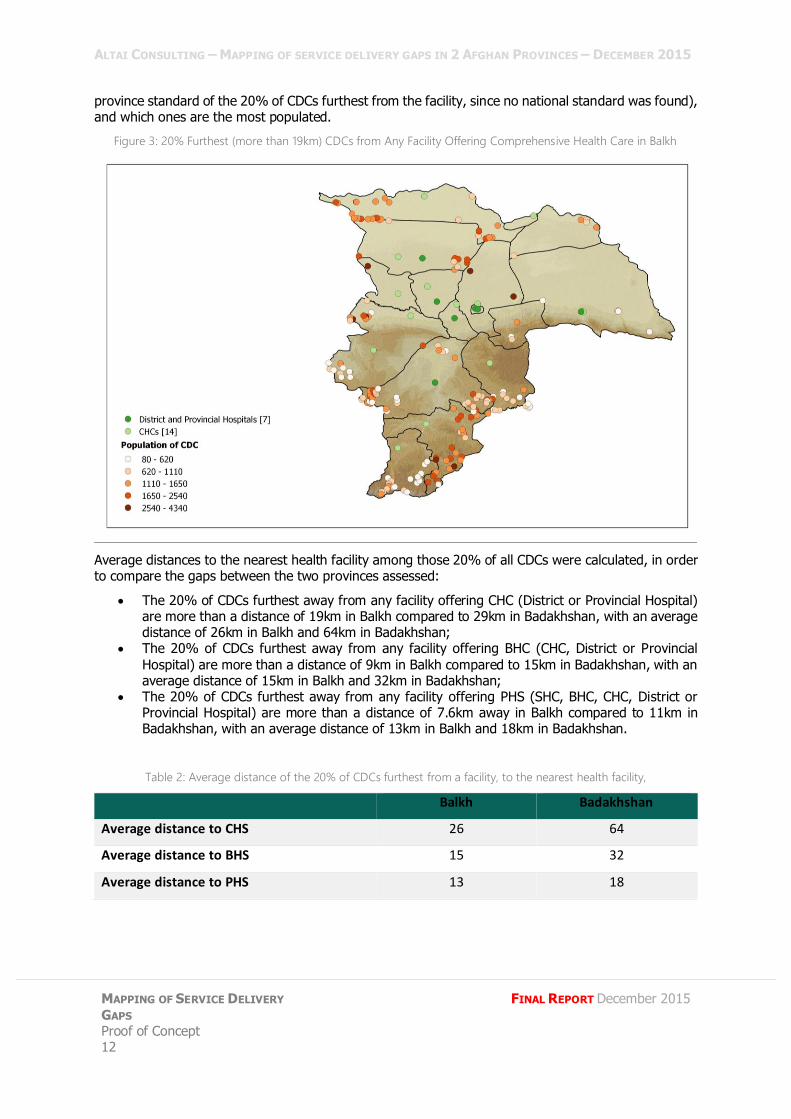
province standard of the 20% of CDCs furthest from the facility, since no national standard was found), and which ones are the most populated.
Figure 3: 20% Furthest (more than 19km) CDCs from Any Facility Offering Comprehensive Health Care in Balkh
Average distances to the nearest health facility among those 20% of all CDCs were calculated, in order to compare the gaps between the two provinces assessed:
The 20% of CDCs furthest away from any facility offering CHC (District or Provincial Hospital) are more than a distance of 19km in Balkh compared to 29km in Badakhshan, with an average distance of 26km in Balkh and 64km in Badakhshan;
The 20% of CDCs furthest away from any facility offering BHC (CHC, District or Provincial
Hospital) are more than a distance of 9km in Balkh compared to 15km in Badakhshan, with an average distance of 15km in Balkh and 32km in Badakhshan;
The 20% of CDCs furthest away from any facility offering PHS (SHC, BHC, CHC, District or Provincial Hospital) are more than a distance of 7.6km away in Balkh compared to 11km in Badakhshan, with an average distance of 13km in Balkh and 18km in Badakhshan.
Table 2: Average distance of the 20% of CDCs furthest from a facility, to the nearest health facility,
Balkh Badakhshan
Average distance to CHS 26 64
Average distance to BHS 15 32
Average distance to PHS 13 18
ERREUR ! UTILISEZ L'ONGLET ACCUEIL POUR APPLIQUER HEADING 1 AU TEXTE QUE VOUS SOUHAITEZ FAIRE
APPARAITRE ICI.
FINAL REPORT December 2015
MAPPING OF SERVICE DELIVERY GAPS Proof of Concept
13
METHOD 3: The third method consisted of taking the catchment population of each health facility, as reported in the HMIS as the starting point. Each of the health facilities were then linked to the closest CDCs, adding them in turn until the population of those CDCs matched the catchment population of the facility. The distance to the closest CDC to reach this number would then be considered as the radius
of the catchment area for each facility.
This method was found to be fairly inconclusive. To reach the correct catchment population number, some facilities have a catchment area radius that is obviously wrong; and it was concluded that whilst data could still be coherent for the analysis of CHS, it did not make any sense for BHS. This also reflected the possibility that the data of catchment population in the HMIS was not always coherent with the
population and geography of CDCs.
AVERAGE DISTANCE TO FACILITY: Limiting the distance required to travel to a clinic, as well as equalising it to be at a maximum distance, can help in optimisation of usage from that variable. As such, beyond the three methodologies explored above, the average distance to facility, as the crow flies, was calculated at the provincial level, weighted with CDC data, as outlined in the table below for Balkh.
Table 3: Average Distance to Health Facilities as the Crow Flies (Balkh)
Average distance by CDC (km)
Average distance by inhabitant (km)
Facility with comprehensive health services 12.0 11.1
Facility with basic health services 6.6 5.8
Facility with primary health services 5.4 4.7
Access is determined by a larger number of factors than just distance. A number of these have been accounted for in the analysis, with travel times roughly judged to account for the difficulties associated with the geographical terrain, and the mode of transport. Therefore, using the road network to assess
the average travel time was also calculated for Badakhshan, see table 4. Combined with the “as the crow flies” analysis, the road network analysis can help arbitrate between building new roads and building new facilities: for example, CDCs that are listed as some of the furthest from a health facility with a road network, but not with “as the crow flies” analysis, likely need better roads that would reduce the travel time to the facility.
To perform the distance analysis through the road network, the OCHA road network had to be modified to allow for the analysis in the following ways:
CDCs that were not linked to any road were artificially linked to a road, trying to follow the
topography of the area (roads following valleys or passes). The roads created were
considered to be walking pathways;
A theoretical speed was assigned to each type of road to calculate the travel time using the
road network:
o 60km/h for primary roads;
o 30km/h for secondary roads;
o 10km/h for tertiary roads;
o 3.5km/h for pathways.
ALTAI CONSULTING – MAPPING OF SERVICE DELIVERY GAPS IN 2 AFGHAN PROVINCES – DECEMBER 2015
MAPPING OF SERVICE DELIVERY
GAPS Proof of Concept 14
FINAL REPORT December 2015
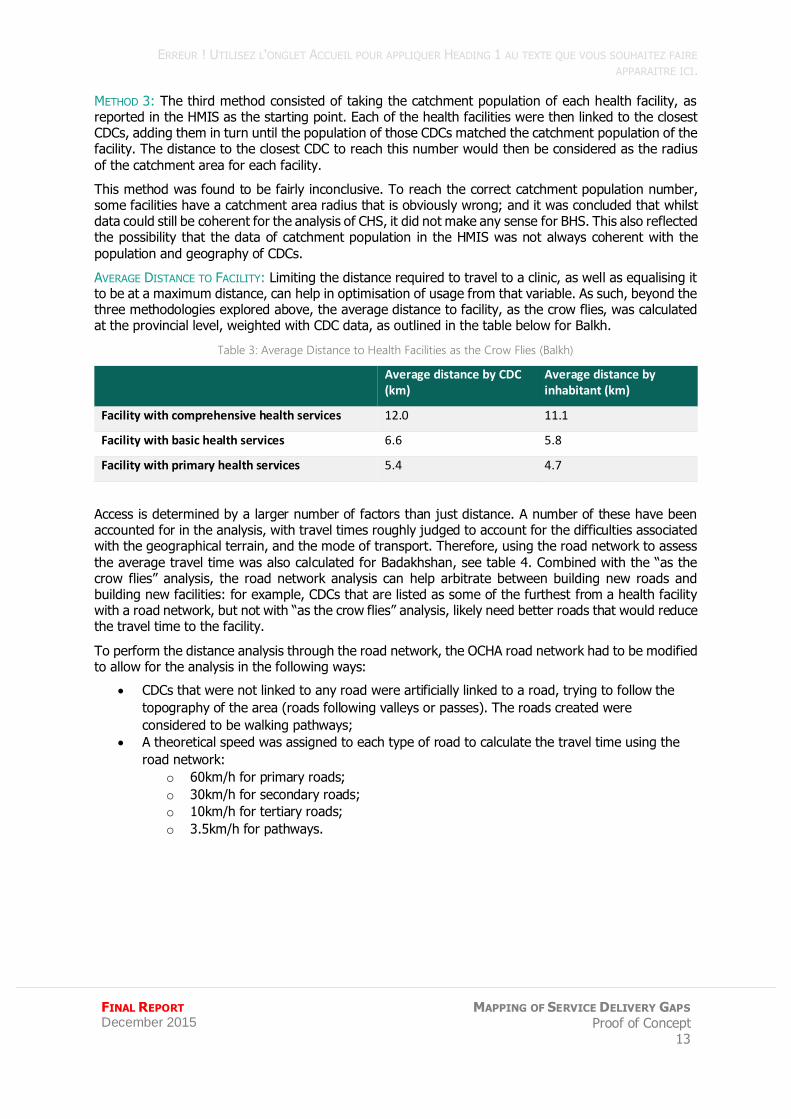
Table 4: Average Distance to Health Facilities as the Crow Flies (Distance), and Travel Time (Through the Road
Network) (Badakhshan)
BY CDC BY INHABITANT
Average distance (km)
Average travel time (min)
Top quartile* distance
Top quartile* travel time
Average distance (km)
Average travel time (min)
Maximum distance
Maximum travel time
Facility with comprehensive health services
22.5 220 24 279 17.9 185 346 2505
Facility with basic health services
11.8 130 12 159 9.5 110 258 2017
Facility with primary health services
7.7 98 9 118 6.6 85 133 1534
* The top quartile distance and travel time are the distance and travel time at which the 25% of CDCs the farthest from a facility
are located.
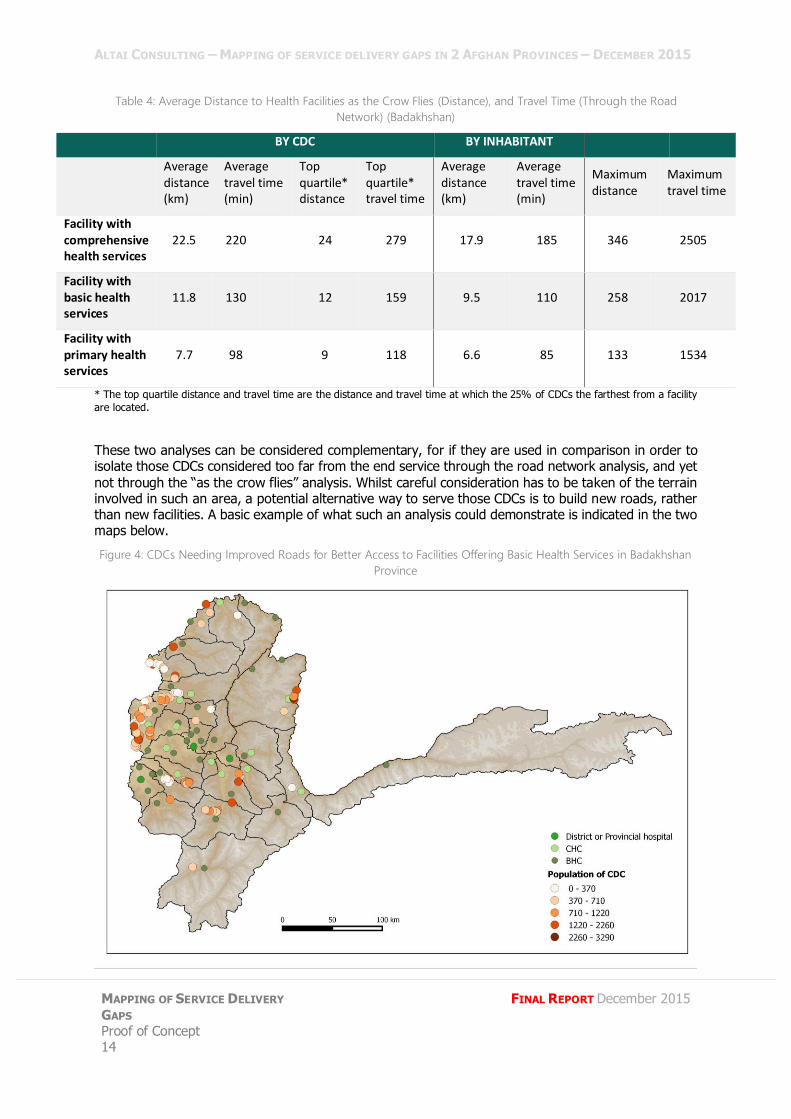
These two analyses can be considered complementary, for if they are used in comparison in order to isolate those CDCs considered too far from the end service through the road network analysis, and yet
not through the “as the crow flies” analysis. Whilst careful consideration has to be taken of the terrain involved in such an area, a potential alternative way to serve those CDCs is to build new roads, rather than new facilities. A basic example of what such an analysis could demonstrate is indicated in the two maps below.
Figure 4: CDCs Needing Improved Roads for Better Access to Facilities Offering Basic Health Services in Badakhshan
Province
ERREUR ! UTILISEZ L'ONGLET ACCUEIL POUR APPLIQUER HEADING 1 AU TEXTE QUE VOUS SOUHAITEZ FAIRE
APPARAITRE ICI.
FINAL REPORT December 2015
MAPPING OF SERVICE DELIVERY GAPS Proof of Concept
15
Figure 5: CDCs Needing Improved Roads for Better Access to Facilities Offering Basic Health Services in Badakhshan
Province - Zoom in Shinghnan District
Many other factors beyond convenience however, have been shown to affect the maximum distance a society is prepared to accept in terms of accessibility of healthcare – largely related to the cost, the quality, and the capability of service. For this reason, the following capacity analyses were also added.
CAPACITY ANALYSIS: Given that qualitative information regarding the services provided at health facilities
are evidently unavailable purely through the MIS, capacity was measured through a number of key factors, including staff to population ratios with, for example, the doctor to population ratio mapped out below.
WHO standards indicate a minimum number of doctors, nurses and midwives required per a 10,000 population to be 23. From this map, we can see how certain areas are underserved in relation to the
presence of doctors, with the most sparsely staffed region having a ratio of over 1 : 91,750 – vastly understaffed in relation to WHO standards; and this is without verification of the education or certification credentials of these doctors.
ALTAI CONSULTING – MAPPING OF SERVICE DELIVERY GAPS IN 2 AFGHAN PROVINCES – DECEMBER 2015
MAPPING OF SERVICE DELIVERY
GAPS Proof of Concept 16
FINAL REPORT December 2015
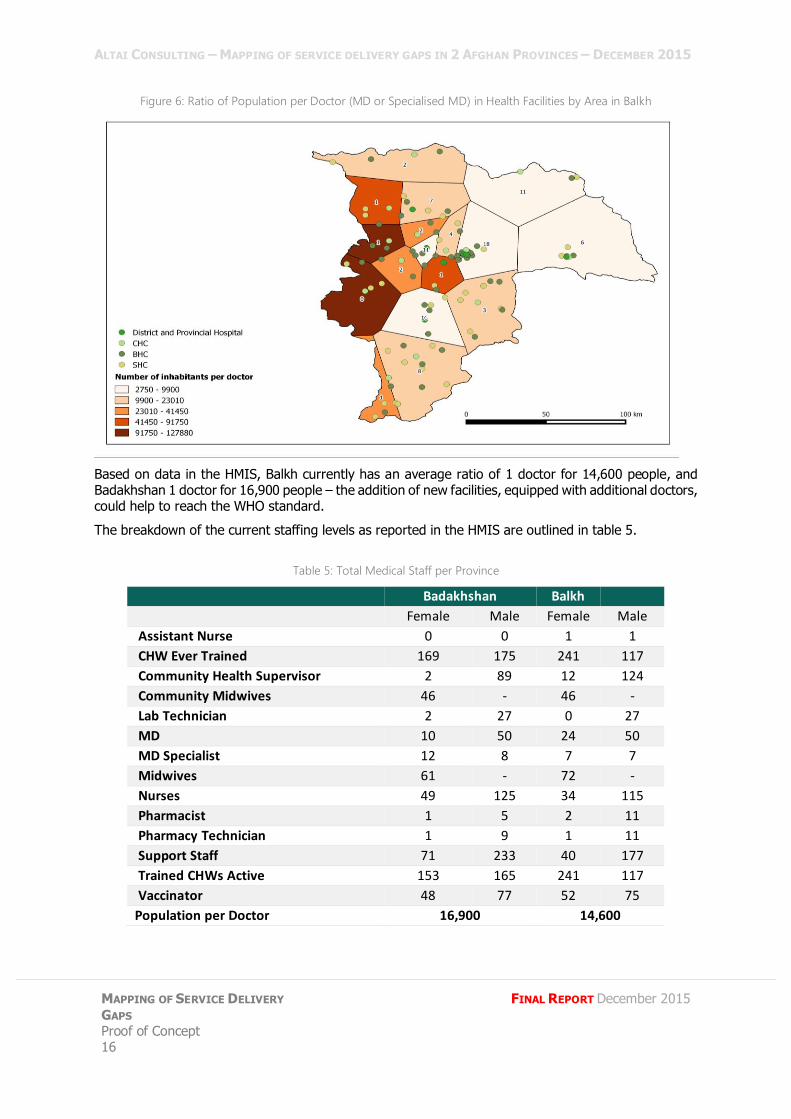
Figure 6: Ratio of Population per Doctor (MD or Specialised MD) in Health Facilities by Area in Balkh
Based on data in the HMIS, Balkh currently has an average ratio of 1 doctor for 14,600 people, and Badakhshan 1 doctor for 16,900 people – the addition of new facilities, equipped with additional doctors, could help to reach the WHO standard.
The breakdown of the current staffing levels as reported in the HMIS are outlined in table 5.
Table 5: Total Medical Staff per Province
Badakhshan Balkh
Female Male Female Male
Assistant Nurse 0 0 1 1
CHW Ever Trained 169 175 241 117
Community Health Supervisor 2 89 12 124
Community Midwives 46 - 46 -
Lab Technician 2 27 0 27
MD 10 50 24 50
MD Specialist 12 8 7 7
Midwives 61 - 72 -
Nurses 49 125 34 115
Pharmacist 1 5 2 11
Pharmacy Technician 1 9 1 11
Support Staff 71 233 40 177
Trained CHWs Active 153 165 241 117
Vaccinator 48 77 52 75
Population per Doctor 16,900 14,600
ERREUR ! UTILISEZ L'ONGLET ACCUEIL POUR APPLIQUER HEADING 1 AU TEXTE QUE VOUS SOUHAITEZ FAIRE
APPARAITRE ICI.
FINAL REPORT December 2015
MAPPING OF SERVICE DELIVERY GAPS Proof of Concept
17
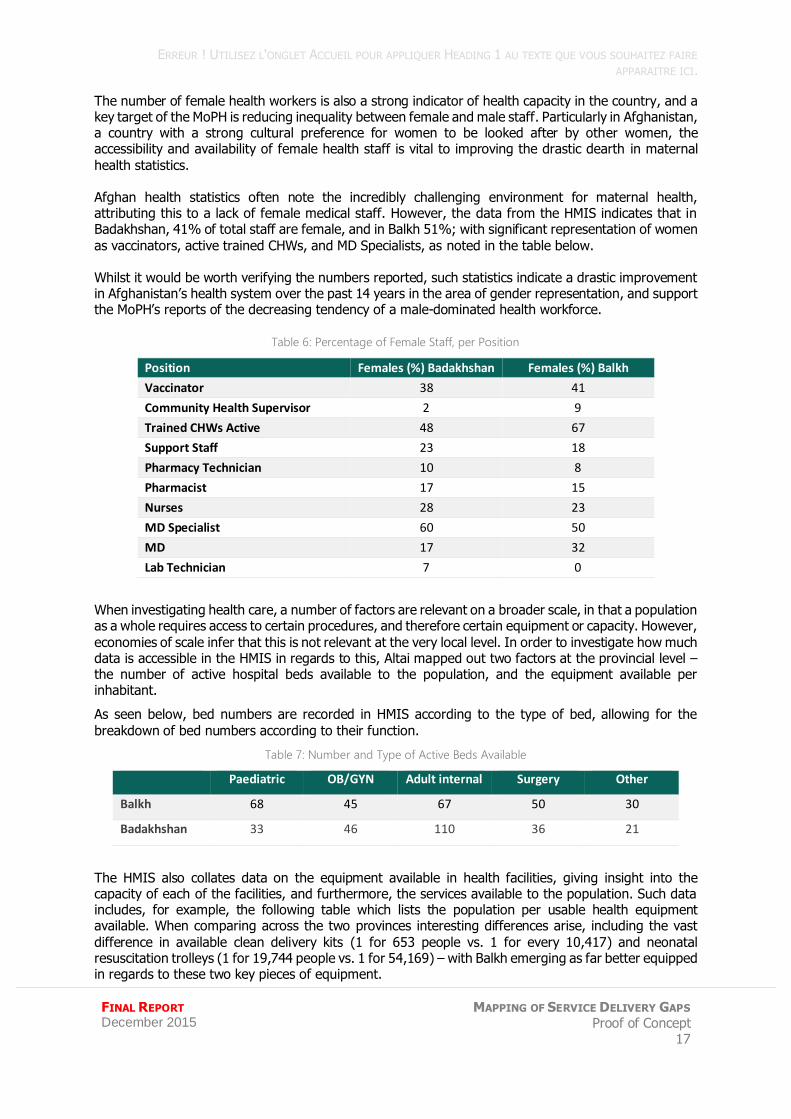
The number of female health workers is also a strong indicator of health capacity in the country, and a key target of the MoPH is reducing inequality between female and male staff. Particularly in Afghanistan, a country with a strong cultural preference for women to be looked after by other women, the accessibility and availability of female health staff is vital to improving the drastic dearth in maternal
health statistics. Afghan health statistics often note the incredibly challenging environment for maternal health, attributing this to a lack of female medical staff. However, the data from the HMIS indicates that in Badakhshan, 41% of total staff are female, and in Balkh 51%; with significant representation of women
as vaccinators, active trained CHWs, and MD Specialists, as noted in the table below. Whilst it would be worth verifying the numbers reported, such statistics indicate a drastic improvement in Afghanistan’s health system over the past 14 years in the area of gender representation, and support the MoPH’s reports of the decreasing tendency of a male-dominated health workforce.
Table 6: Percentage of Female Staff, per Position
Position Females (%) Badakhshan Females (%) Balkh
Vaccinator 38 41
Community Health Supervisor 2 9
Trained CHWs Active 48 67
Support Staff 23 18
Pharmacy Technician 10 8
Pharmacist 17 15
Nurses 28 23
MD Specialist 60 50
MD 17 32
Lab Technician 7 0
When investigating health care, a number of factors are relevant on a broader scale, in that a population as a whole requires access to certain procedures, and therefore certain equipment or capacity. However,
economies of scale infer that this is not relevant at the very local level. In order to investigate how much data is accessible in the HMIS in regards to this, Altai mapped out two factors at the provincial level – the number of active hospital beds available to the population, and the equipment available per inhabitant.
As seen below, bed numbers are recorded in HMIS according to the type of bed, allowing for the
breakdown of bed numbers according to their function.
Table 7: Number and Type of Active Beds Available
Paediatric OB/GYN Adult internal Surgery Other
Balkh 68 45 67 50 30
Badakhshan 33 46 110 36 21
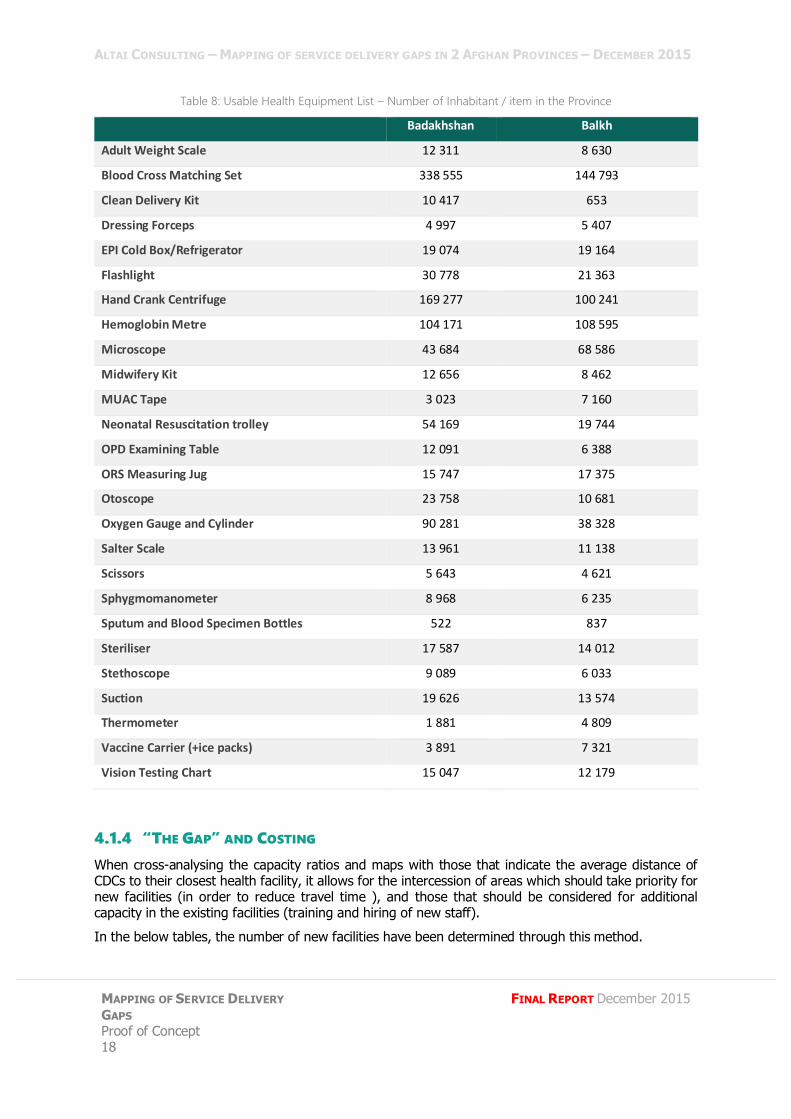
The HMIS also collates data on the equipment available in health facilities, giving insight into the capacity of each of the facilities, and furthermore, the services available to the population. Such data includes, for example, the following table which lists the population per usable health equipment available. When comparing across the two provinces interesting differences arise, including the vast
difference in available clean delivery kits (1 for 653 people vs. 1 for every 10,417) and neonatal resuscitation trolleys (1 for 19,744 people vs. 1 for 54,169) – with Balkh emerging as far better equipped in regards to these two key pieces of equipment.
ALTAI CONSULTING – MAPPING OF SERVICE DELIVERY GAPS IN 2 AFGHAN PROVINCES – DECEMBER 2015
MAPPING OF SERVICE DELIVERY
GAPS Proof of Concept 18
FINAL REPORT December 2015
Table 8: Usable Health Equipment List – Number of Inhabitant / item in the Province
Badakhshan Balkh
Adult Weight Scale 12 311 8 630
Blood Cross Matching Set 338 555 144 793
Clean Delivery Kit 10 417 653
Dressing Forceps 4 997 5 407
EPI Cold Box/Refrigerator 19 074 19 164
Flashlight 30 778 21 363
Hand Crank Centrifuge 169 277 100 241
Hemoglobin Metre 104 171 108 595
Microscope 43 684 68 586
Midwifery Kit 12 656 8 462
MUAC Tape 3 023 7 160
Neonatal Resuscitation trolley 54 169 19 744
OPD Examining Table 12 091 6 388
ORS Measuring Jug 15 747 17 375
Otoscope 23 758 10 681
Oxygen Gauge and Cylinder 90 281 38 328
Salter Scale 13 961 11 138
Scissors 5 643 4 621
Sphygmomanometer 8 968 6 235
Sputum and Blood Specimen Bottles 522 837
Steriliser 17 587 14 012
Stethoscope 9 089 6 033
Suction 19 626 13 574
Thermometer 1 881 4 809
Vaccine Carrier (+ice packs) 3 891 7 321
Vision Testing Chart 15 047 12 179
4.1.4 “THE GAP” AND COSTING
When cross-analysing the capacity ratios and maps with those that indicate the average distance of CDCs to their closest health facility, it allows for the intercession of areas which should take priority for new facilities (in order to reduce travel time ), and those that should be considered for additional capacity in the existing facilities (training and hiring of new staff).
In the below tables, the number of new facilities have been determined through this method.
ERREUR ! UTILISEZ L'ONGLET ACCUEIL POUR APPLIQUER HEADING 1 AU TEXTE QUE VOUS SOUHAITEZ FAIRE
APPARAITRE ICI.
FINAL REPORT December 2015
MAPPING OF SERVICE DELIVERY GAPS Proof of Concept
19
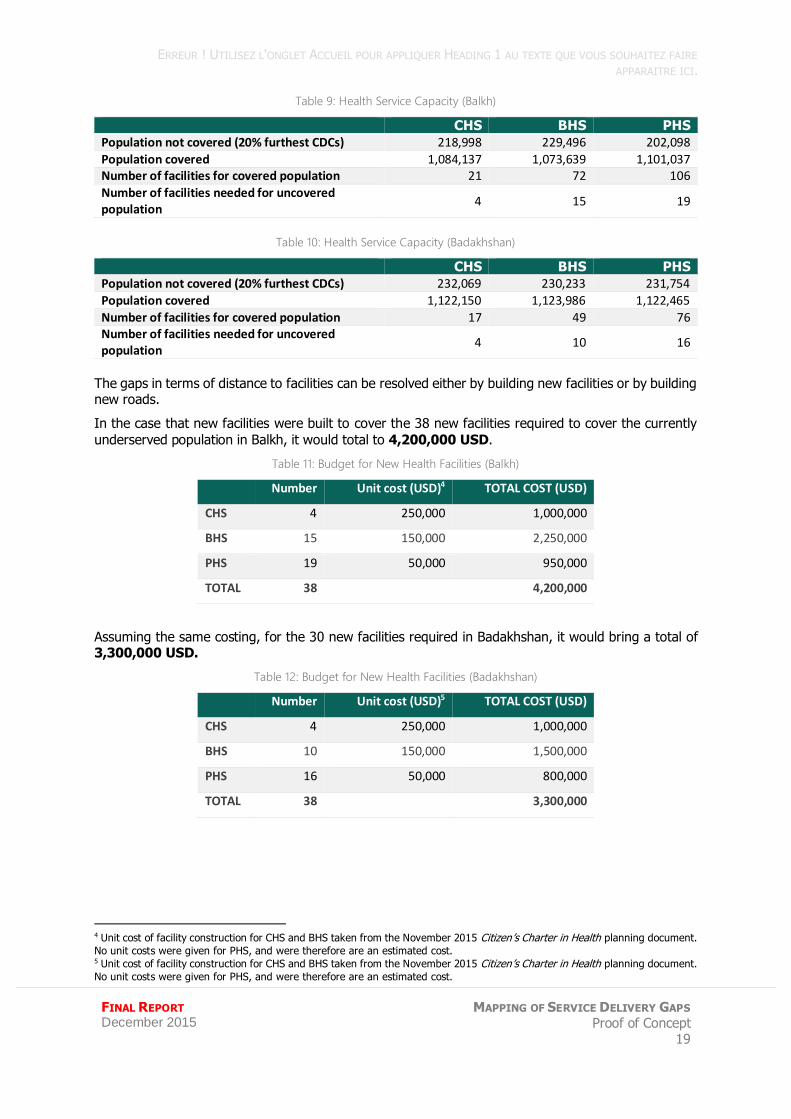
Table 9: Health Service Capacity (Balkh)
CHS BHS PHS
Population not covered (20% furthest CDCs) 218,998 229,496 202,098
Population covered 1,084,137 1,073,639 1,101,037
Number of facilities for covered population 21 72 106
Number of facilities needed for uncovered population
4 15 19
Table 10: Health Service Capacity (Badakhshan)
CHS BHS PHS
Population not covered (20% furthest CDCs) 232,069 230,233 231,754
Population covered 1,122,150 1,123,986 1,122,465
Number of facilities for covered population 17 49 76
Number of facilities needed for uncovered population
4 10 16
The gaps in terms of distance to facilities can be resolved either by building new facilities or by building new roads.
In the case that new facilities were built to cover the 38 new facilities required to cover the currently
underserved population in Balkh, it would total to 4,200,000 USD.
Table 11: Budget for New Health Facilities (Balkh)
Number Unit cost (USD)4 TOTAL COST (USD)
CHS 4 250,000 1,000,000
BHS 15 150,000 2,250,000
PHS 19 50,000 950,000
TOTAL 38 4,200,000
Assuming the same costing, for the 30 new facilities required in Badakhshan, it would bring a total of 3,300,000 USD.
Table 12: Budget for New Health Facilities (Badakhshan)
Number Unit cost (USD)5 TOTAL COST (USD)
CHS 4 250,000 1,000,000
BHS 10 150,000 1,500,000
PHS 16 50,000 800,000
TOTAL 38 3,300,000
4 Unit cost of facility construction for CHS and BHS taken from the November 2015 Citizen’s Charter in Health planning document.
No unit costs were given for PHS, and were therefore are an estimated cost. 5 Unit cost of facility construction for CHS and BHS taken from the November 2015 Citizen’s Charter in Health planning document.
No unit costs were given for PHS, and were therefore are an estimated cost.
ALTAI CONSULTING – MAPPING OF SERVICE DELIVERY GAPS IN 2 AFGHAN PROVINCES – DECEMBER 2015
MAPPING OF SERVICE DELIVERY
GAPS Proof of Concept 20
FINAL REPORT December 2015
4.1.5 RESULTS OF FIELDWORK
BADAKHSHAN
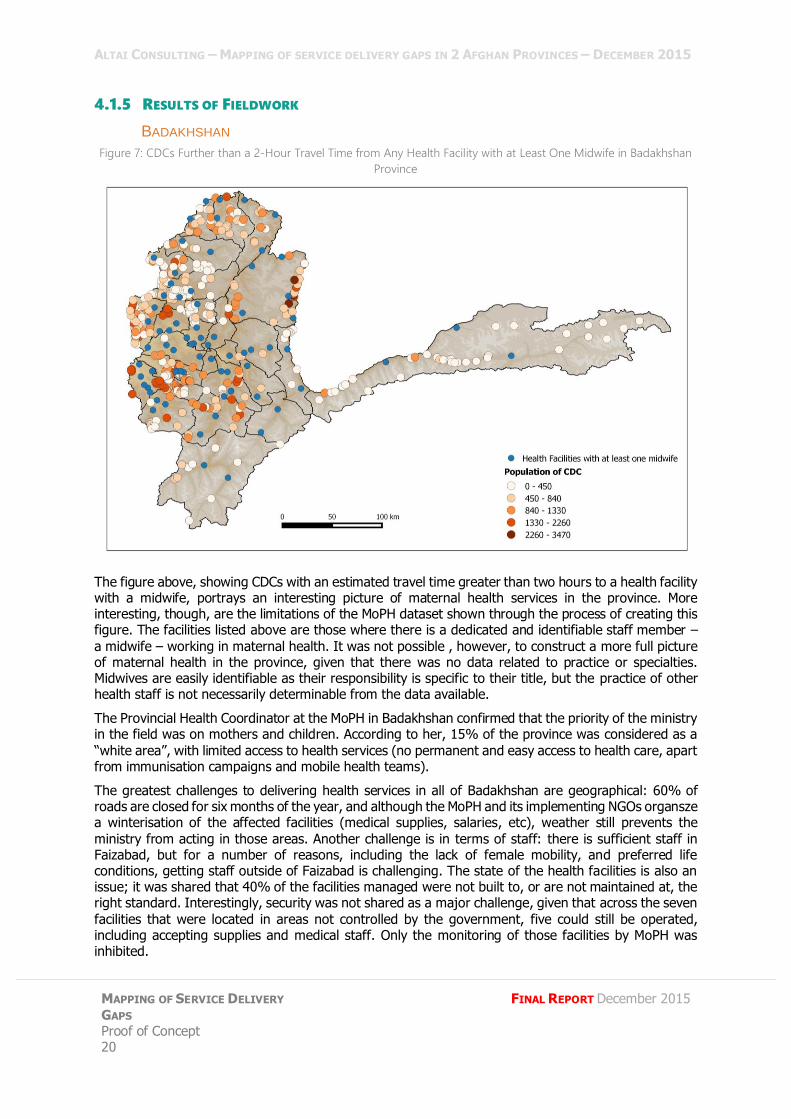
Figure 7: CDCs Further than a 2-Hour Travel Time from Any Health Facility with at Least One Midwife in Badakhshan
Province
The figure above, showing CDCs with an estimated travel time greater than two hours to a health facility with a midwife, portrays an interesting picture of maternal health services in the province. More interesting, though, are the limitations of the MoPH dataset shown through the process of creating this figure. The facilities listed above are those where there is a dedicated and identifiable staff member –
a midwife – working in maternal health. It was not possible , however, to construct a more full picture of maternal health in the province, given that there was no data related to practice or specialties. Midwives are easily identifiable as their responsibility is specific to their title, but the practice of other health staff is not necessarily determinable from the data available.
The Provincial Health Coordinator at the MoPH in Badakhshan confirmed that the priority of the ministry in the field was on mothers and children. According to her, 15% of the province was considered as a
“white area”, with limited access to health services (no permanent and easy access to health care, apart from immunisation campaigns and mobile health teams).
The greatest challenges to delivering health services in all of Badakhshan are geographical: 60% of roads are closed for six months of the year, and although the MoPH and its implementing NGOs organsze a winterisation of the affected facilities (medical supplies, salaries, etc), weather still prevents the
ministry from acting in those areas. Another challenge is in terms of staff: there is sufficient staff in Faizabad, but for a number of reasons, including the lack of female mobility, and preferred life conditions, getting staff outside of Faizabad is challenging. The state of the health facilities is also an issue; it was shared that 40% of the facilities managed were not built to, or are not maintained at, the right standard. Interestingly, security was not shared as a major challenge, given that across the seven
facilities that were located in areas not controlled by the government, five could still be operated, including accepting supplies and medical staff. Only the monitoring of those facilities by MoPH was inhibited.
ERREUR ! UTILISEZ L'ONGLET ACCUEIL POUR APPLIQUER HEADING 1 AU TEXTE QUE VOUS SOUHAITEZ FAIRE
APPARAITRE ICI.
FINAL REPORT December 2015
MAPPING OF SERVICE DELIVERY GAPS Proof of Concept
21
The MoPH has a joint-monitoring programme, implemented by the ministry and partner NGOs, which consists of identifying capacity issues, and allegedly also the geographical gaps in health services in the province. Altai was unable to access this document to assess the precision and quality of the geographical gap analysis, however considering no standard in terms of distance seemed to have been
set, and that the notion of catchment area or catchment population could not be clarified with the interviewee, it remains doubtful that such an analysis has been performed thoroughly.
Despite this, MoPH does have a five-year Strategic Plan, which lists the priorities of improving health services in the province; there is apparently no plan to build facilities in new locations in the province.
BALKH
The head of the Communicable Disease Control department in Balkh listed the major gaps in the province as challenges in terms of capacity: lack of standard health facilities (50% of the existing health
facilities have no building or a building that does not respect the ministry’s standards); a lack of ambulances; and shortage of staff, especially at the regional hospital. The main reasons he cited for these gaps are a lack of resources, as well as security challenges. He assured researchers that there was no geographical gap in the province.
As in Badakhshan, the interviewee asserted they received monthly monitoring reports on service delivery
based on site visits, but this reflects an analysis of the quality of service and capacity at the existing health facilities, rather than an cross-analysis looking at geographical gaps in service delivery.
It is worth noting that the interviewee in Balkh provincial MoPH department was able to share the standard cost for the construction of new facilities: 120,000 USD for a BHC and 240,000 USD for a CHC, in line with the standard costs found in the Citizen’s Charter in Health planning document quoted above.
ALTAI CONSULTING – MAPPING OF SERVICE DELIVERY GAPS IN 2 AFGHAN PROVINCES – DECEMBER 2015
MAPPING OF SERVICE DELIVERY
GAPS Proof of Concept 22
FINAL REPORT December 2015
4.2 EDUCATION
4.2.1 EDUCATION IN THE CITIZEN’S CHARTER
The education module of the Citizen’s Charter aims to reduce the number of out of school children, increase the number of schools with buildings, to print and distribute textbooks, and to upgrade teacher qualification to grade 14.
Targets for these activities have been set with, for example, Citizen’s Charter documents noting that the total schools required for national rural coverage is 100,000, of which 80,000 are complete to date.
Based on the data shared in the MRRD Working Group PowerPoint, the three-year target is to build 6,000 schools over three years, with a unit cost of 150,000 USD, resulting in a total budget of 900,000,000 USD for the school construction element alone.
4.2.2 THE DATA
DATA IN THE MIS
The MoE MIS (EMIS) collects data on schools, with a focus on teachers, students and school-level information. They do not collect data on payroll or costs, which are collected by the Finance Department.
Collection of GPS data on education assets has only recently been adopted at the Ministry. A first set of
data has been collected for 27 provinces, with a full set of coordinates cleaned and available for eleven of those provinces.6 As a result, Altai was granted access to the cleaned GPS data of Balkh, but not for Badakhshan, which is one of the eight provinces for which GPS data has yet to be collected. Due to a lack of on-the-ground access created by insecurity, remoteness, or time constraints around 14% of the existing GPS data was generated by approximating the facility’s location on a map rather than recording
coordinates at the facility itself.
EMIS collates detailed information on schools ranging from basic information such as the school type, teaching language, gender of students; the number of teachers both male and female, whether it has a building or not (including whether it has a roof), the type of utility services used, and the students enrolled; to more intricate details such as a check of the equipment (functional or not) in the school,
the bathroom facilities, and the age and ethnicity of students enrolled. Assuming the quality of this data, it offers a great potential for use in mapping and analysis attempts such as this proof of concept.
DATA QUALITY
EMIS collects and stores a large amount of information. However, challenges were faced in utilising this information, mainly due to the lack of locating information, making it difficult to map facilities and any information related to them.
BADAKHSHAN: As no GPS data was available for education assets in Badakhshan, a number of methods were used to locate them as accurately as possible. Firstly, names of schools were matched with names
of CDCs, and their associated GPS coordinates supplied from NSP data. Those that remained were then cross-checked with OCHA settlement data, and finally with the U.S. National Geospatial Agency Data.7
A total of 684 out of the 722 schools were located in this manner. Four of the schools however, were found to have erroneous location data, as a result of being located through CDC data which had errors. Therefore, 680 schools from Badakhshan were used in the analysis.
BALKH: Out of 592 schools, 100 schools had no GPS data in the dataset given by the MoE (42 general education schools, and none of the 10 professional education, 28 Islamic education, 18 teacher education, or 2 basic literacy schools).
6 The cleaned set of GPS data is available for Balkh, Bamyan, Farah, Ghazni, Kapisa, Laghman, Nangarhar, Panjshir, Samangan,
Takhar, and Wardak. Provinces that have GPS data that iscollected, but not cleaned and entered in to the EMIS system are Kabul
Province and Kabul City, Parwan, Logar, Paktia, Kunar, Baghlan, Kunduz, Jawzjan, Herat, Kandahar, Ghor, Nooristan, Khost,
Daikundi, and Sari Pul. 7 The data is available at http://geonames.nga.mil/gns/html/namefiles.html
ERREUR ! UTILISEZ L'ONGLET ACCUEIL POUR APPLIQUER HEADING 1 AU TEXTE QUE VOUS SOUHAITEZ FAIRE
APPARAITRE ICI.
FINAL REPORT December 2015
MAPPING OF SERVICE DELIVERY GAPS Proof of Concept
23
Only four of these could be identified through the method listed above, resulting in 96 with no GPS data available.
A further 11 schools were excluded from the analysis because their location was found to be obviously inaccurate, resulting in 481 out of the 592 schools used in the analysis.
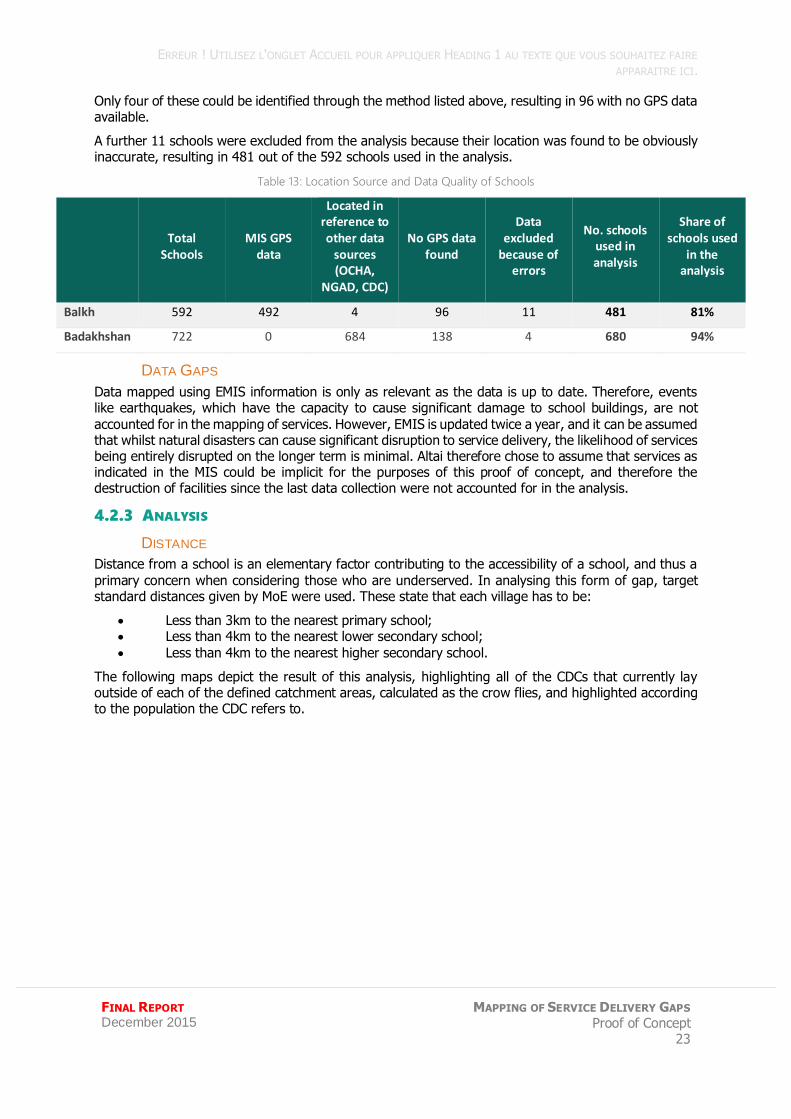
Table 13: Location Source and Data Quality of Schools
Total
Schools MIS GPS
data
Located in reference to other data
sources (OCHA,
NGAD, CDC)
No GPS data found
Data excluded
because of errors
No. schools used in analysis
Share of schools used
in the analysis
Balkh 592 492 4 96 11 481 81%
Badakhshan 722 0 684 138 4 680 94%
DATA GAPS
Data mapped using EMIS information is only as relevant as the data is up to date. Therefore, events like earthquakes, which have the capacity to cause significant damage to school buildings, are not
accounted for in the mapping of services. However, EMIS is updated twice a year, and it can be assumed that whilst natural disasters can cause significant disruption to service delivery, the likelihood of services being entirely disrupted on the longer term is minimal. Altai therefore chose to assume that services as indicated in the MIS could be implicit for the purposes of this proof of concept, and therefore the destruction of facilities since the last data collection were not accounted for in the analysis.
4.2.3 ANALYSIS
DISTANCE
Distance from a school is an elementary factor contributing to the accessibility of a school, and thus a
primary concern when considering those who are underserved. In analysing this form of gap, target standard distances given by MoE were used. These state that each village has to be:
Less than 3km to the nearest primary school; Less than 4km to the nearest lower secondary school;
Less than 4km to the nearest higher secondary school.
The following maps depict the result of this analysis, highlighting all of the CDCs that currently lay outside of each of the defined catchment areas, calculated as the crow flies, and highlighted according to the population the CDC refers to.
ALTAI CONSULTING – MAPPING OF SERVICE DELIVERY GAPS IN 2 AFGHAN PROVINCES – DECEMBER 2015
MAPPING OF SERVICE DELIVERY
GAPS Proof of Concept 24
FINAL REPORT December 2015
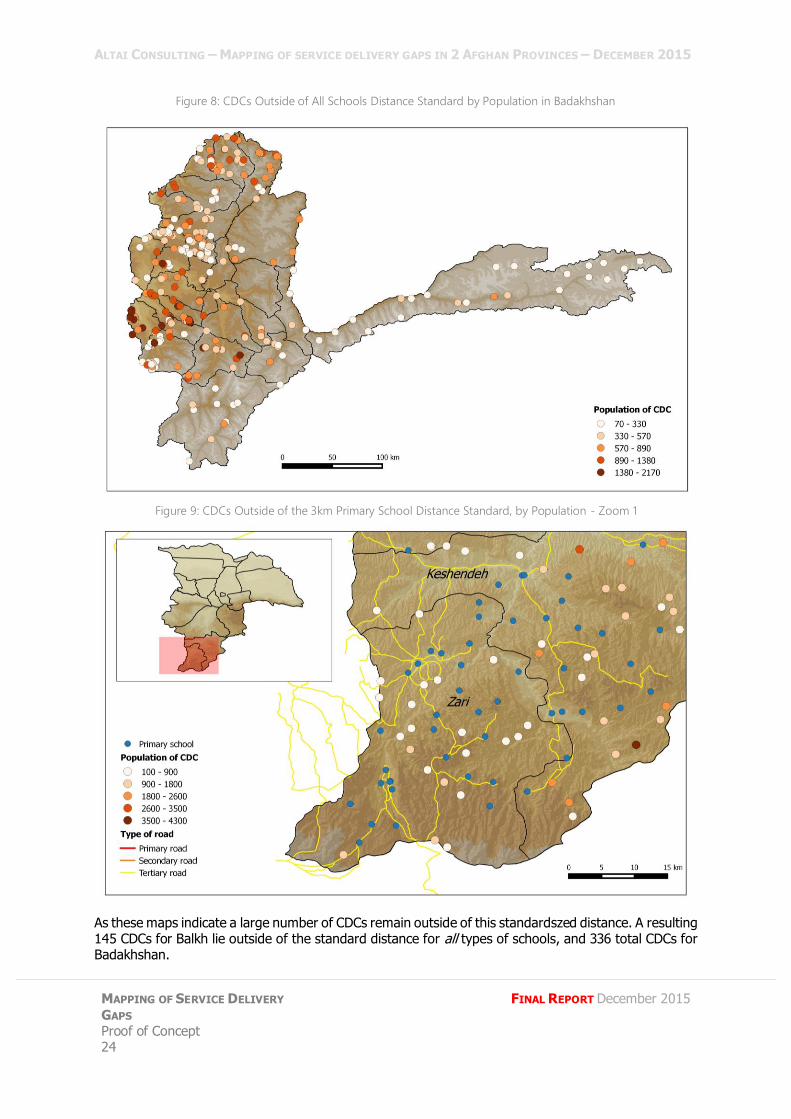
Figure 8: CDCs Outside of All Schools Distance Standard by Population in Badakhshan
Figure 9: CDCs Outside of the 3km Primary School Distance Standard, by Population - Zoom 1
As these maps indicate a large number of CDCs remain outside of this standardszed distance. A resulting 145 CDCs for Balkh lie outside of the standard distance for all types of schools, and 336 total CDCs for Badakhshan.
ERREUR ! UTILISEZ L'ONGLET ACCUEIL POUR APPLIQUER HEADING 1 AU TEXTE QUE VOUS SOUHAITEZ FAIRE
APPARAITRE ICI.
FINAL REPORT December 2015
MAPPING OF SERVICE DELIVERY GAPS Proof of Concept
25
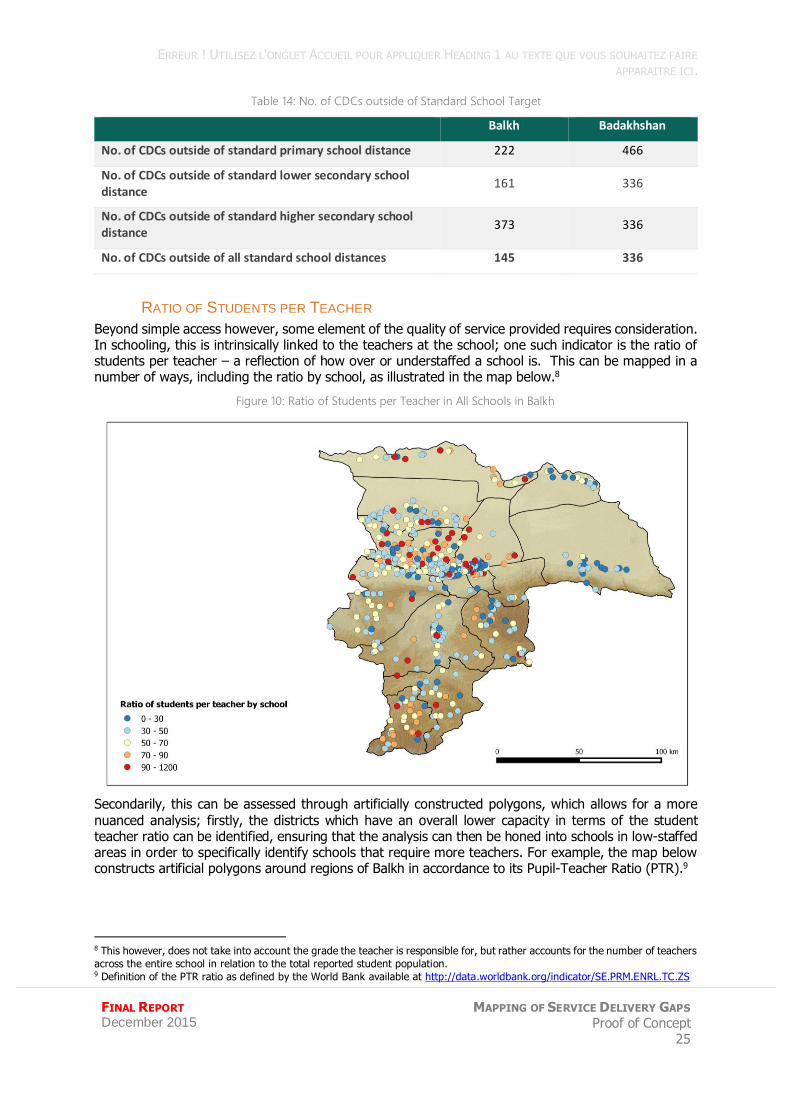
Table 14: No. of CDCs outside of Standard School Target
Balkh Badakhshan
No. of CDCs outside of standard primary school distance 222 466
No. of CDCs outside of standard lower secondary school distance
161 336
No. of CDCs outside of standard higher secondary school distance
373 336
No. of CDCs outside of all standard school distances 145 336
RATIO OF STUDENTS PER TEACHER
Beyond simple access however, some element of the quality of service provided requires consideration. In schooling, this is intrinsically linked to the teachers at the school; one such indicator is the ratio of students per teacher – a reflection of how over or understaffed a school is. This can be mapped in a number of ways, including the ratio by school, as illustrated in the map below.8
Figure 10: Ratio of Students per Teacher in All Schools in Balkh
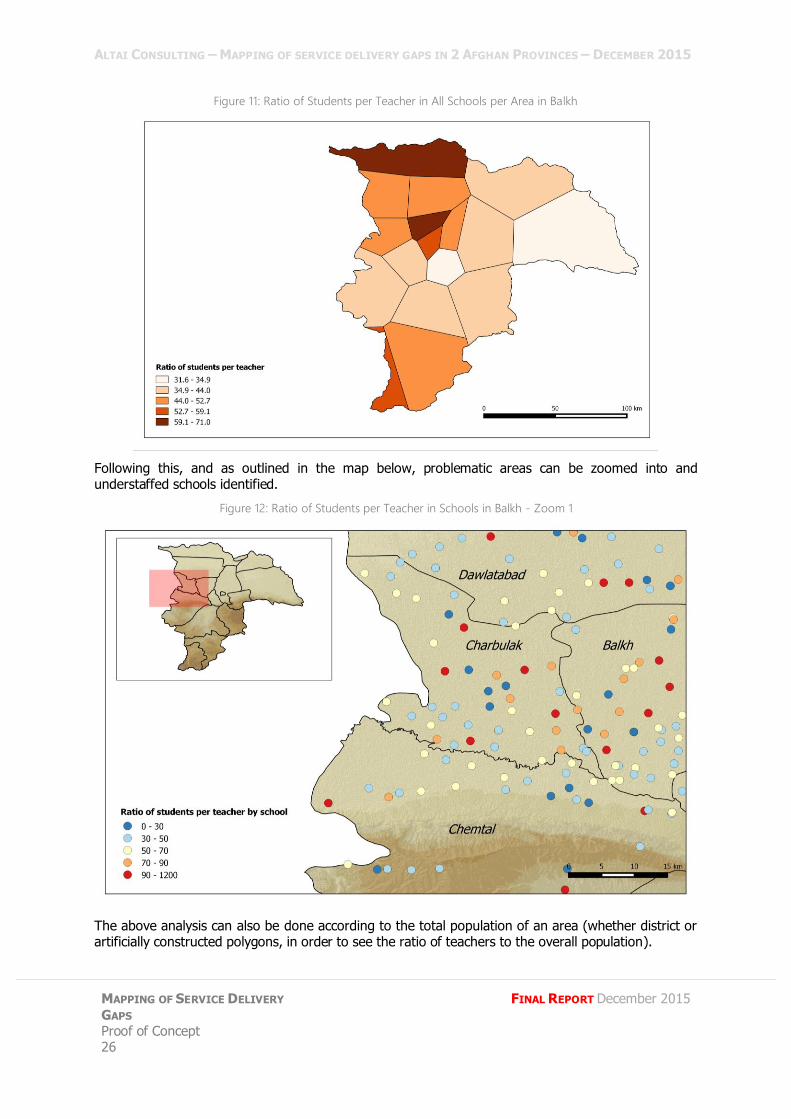
Secondarily, this can be assessed through artificially constructed polygons, which allows for a more
nuanced analysis; firstly, the districts which have an overall lower capacity in terms of the student teacher ratio can be identified, ensuring that the analysis can then be honed into schools in low-staffed areas in order to specifically identify schools that require more teachers. For example, the map below constructs artificial polygons around regions of Balkh in accordance to its Pupil-Teacher Ratio (PTR).9
8 This however, does not take into account the grade the teacher is responsible for, but rather accounts for the number of teachers
across the entire school in relation to the total reported student population. 9 Definition of the PTR ratio as defined by the World Bank available at http://data.worldbank.org/indicator/SE.PRM.ENRL.TC.ZS
ALTAI CONSULTING – MAPPING OF SERVICE DELIVERY GAPS IN 2 AFGHAN PROVINCES – DECEMBER 2015
MAPPING OF SERVICE DELIVERY
GAPS Proof of Concept 26
FINAL REPORT December 2015
Figure 11: Ratio of Students per Teacher in All Schools per Area in Balkh
Following this, and as outlined in the map below, problematic areas can be zoomed into and understaffed schools identified.
Figure 12: Ratio of Students per Teacher in Schools in Balkh - Zoom 1
The above analysis can also be done according to the total population of an area (whether district or artificially constructed polygons, in order to see the ratio of teachers to the overall population).
ERREUR ! UTILISEZ L'ONGLET ACCUEIL POUR APPLIQUER HEADING 1 AU TEXTE QUE VOUS SOUHAITEZ FAIRE
APPARAITRE ICI.
FINAL REPORT December 2015
MAPPING OF SERVICE DELIVERY GAPS Proof of Concept
27
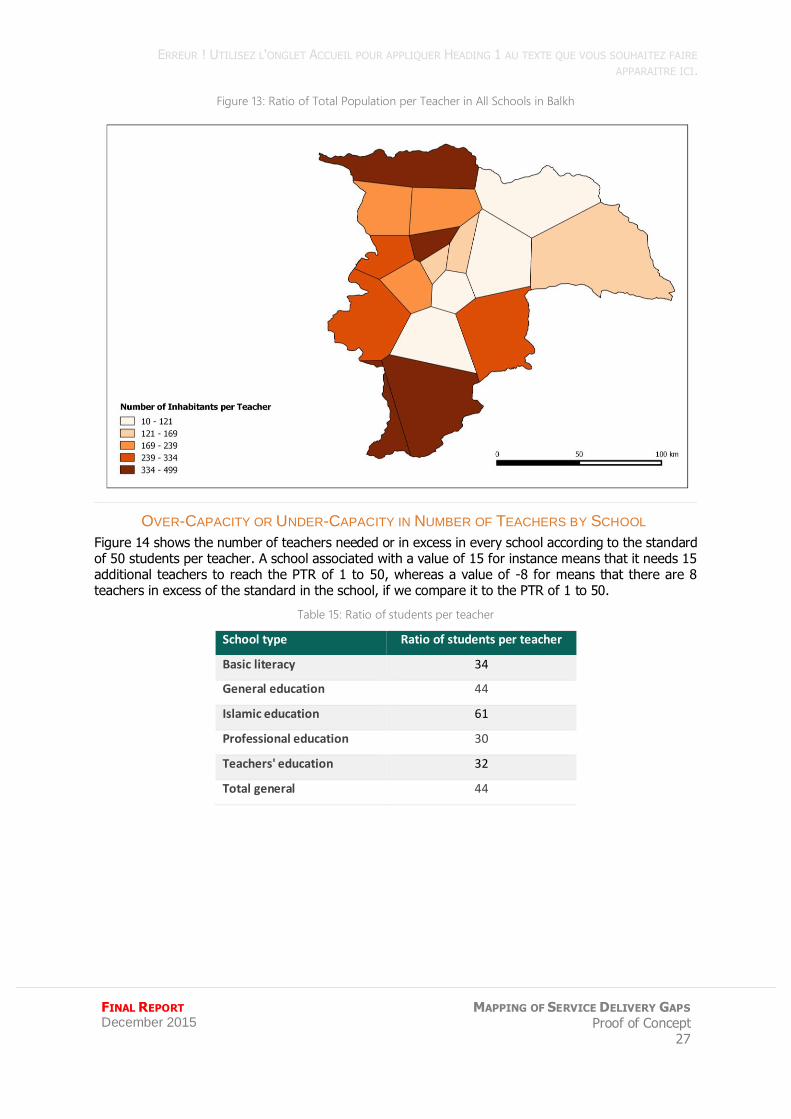
Figure 13: Ratio of Total Population per Teacher in All Schools in Balkh
OVER-CAPACITY OR UNDER-CAPACITY IN NUMBER OF TEACHERS BY SCHOOL
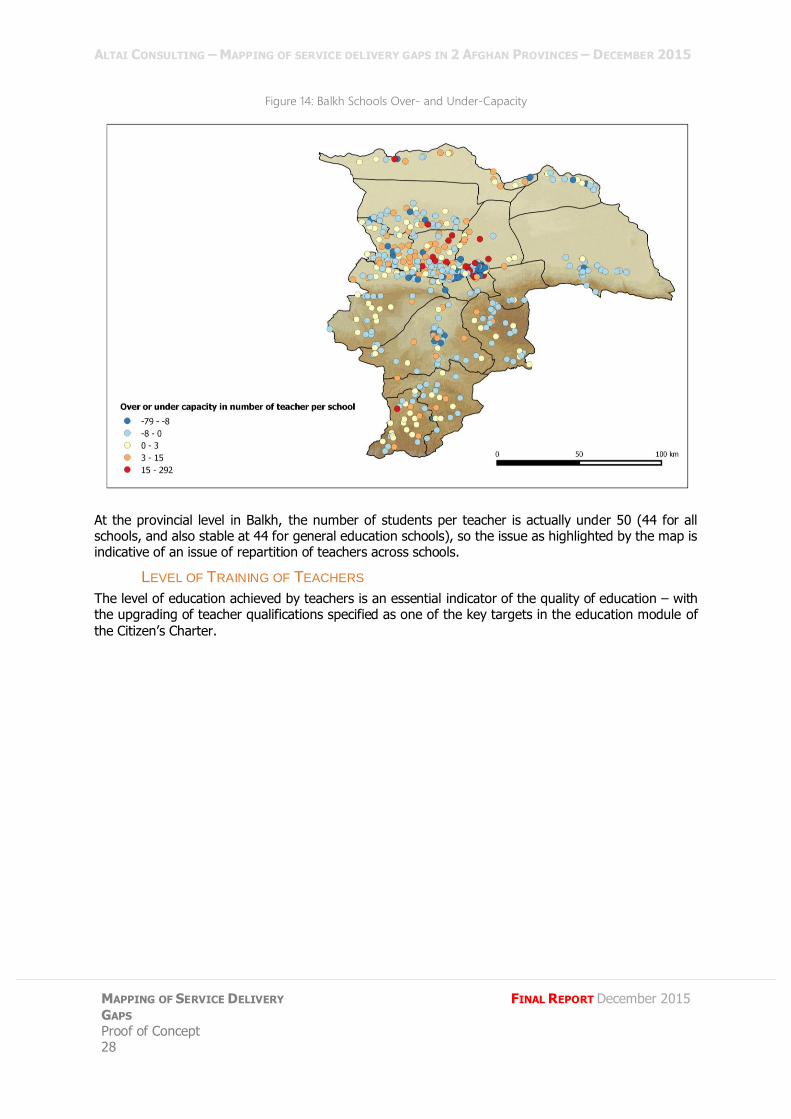
Figure 14 shows the number of teachers needed or in excess in every school according to the standard of 50 students per teacher. A school associated with a value of 15 for instance means that it needs 15 additional teachers to reach the PTR of 1 to 50, whereas a value of -8 for means that there are 8 teachers in excess of the standard in the school, if we compare it to the PTR of 1 to 50.
Table 15: Ratio of students per teacher
School type Ratio of students per teacher
Basic literacy 34
General education 44
Islamic education 61
Professional education 30
Teachers' education 32
Total general 44
ALTAI CONSULTING – MAPPING OF SERVICE DELIVERY GAPS IN 2 AFGHAN PROVINCES – DECEMBER 2015
MAPPING OF SERVICE DELIVERY
GAPS Proof of Concept 28
FINAL REPORT December 2015
Figure 14: Balkh Schools Over- and Under-Capacity
At the provincial level in Balkh, the number of students per teacher is actually under 50 (44 for all schools, and also stable at 44 for general education schools), so the issue as highlighted by the map is indicative of an issue of repartition of teachers across schools.
LEVEL OF TRAINING OF TEACHERS
The level of education achieved by teachers is an essential indicator of the quality of education – with the upgrading of teacher qualifications specified as one of the key targets in the education module of
the Citizen’s Charter.
ERREUR ! UTILISEZ L'ONGLET ACCUEIL POUR APPLIQUER HEADING 1 AU TEXTE QUE VOUS SOUHAITEZ FAIRE
APPARAITRE ICI.
FINAL REPORT December 2015
MAPPING OF SERVICE DELIVERY GAPS Proof of Concept
29
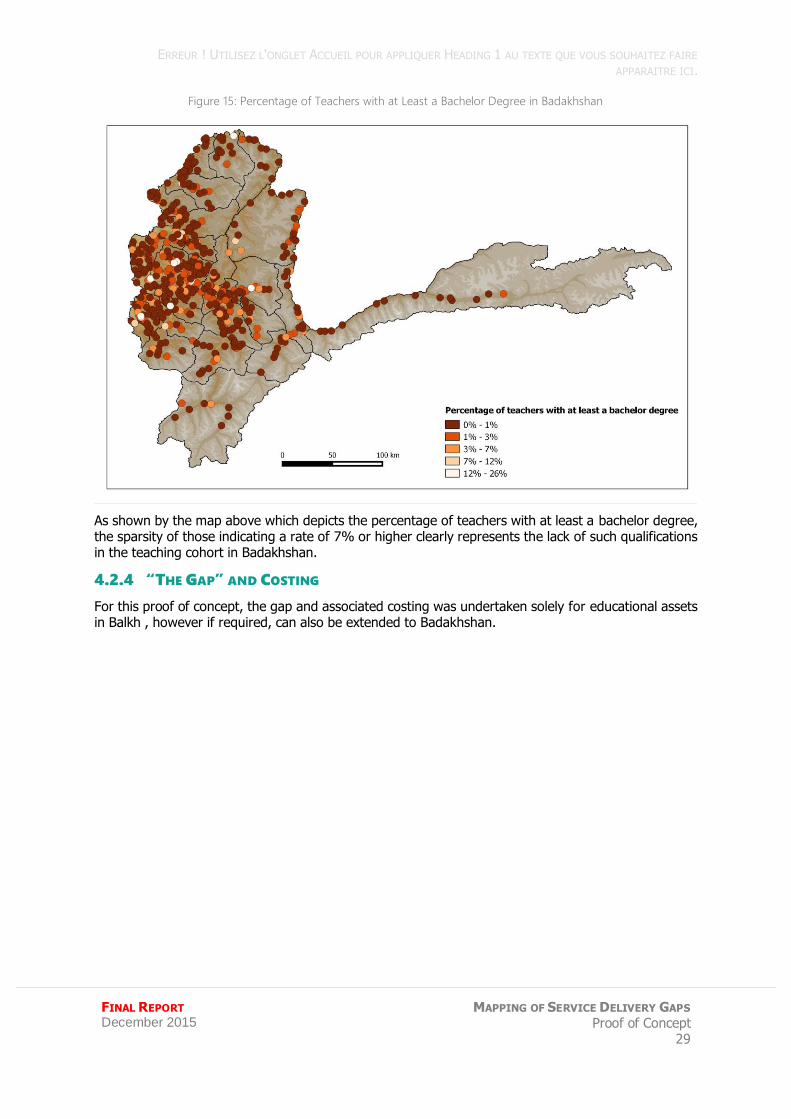
Figure 15: Percentage of Teachers with at Least a Bachelor Degree in Badakhshan
As shown by the map above which depicts the percentage of teachers with at least a bachelor degree, the sparsity of those indicating a rate of 7% or higher clearly represents the lack of such qualifications in the teaching cohort in Badakhshan.
4.2.4 “THE GAP” AND COSTING
For this proof of concept, the gap and associated costing was undertaken solely for educational assets in Balkh , however if required, can also be extended to Badakhshan.
ALTAI CONSULTING – MAPPING OF SERVICE DELIVERY GAPS IN 2 AFGHAN PROVINCES – DECEMBER 2015
MAPPING OF SERVICE DELIVERY
GAPS Proof of Concept 30
FINAL REPORT December 2015
BALKH
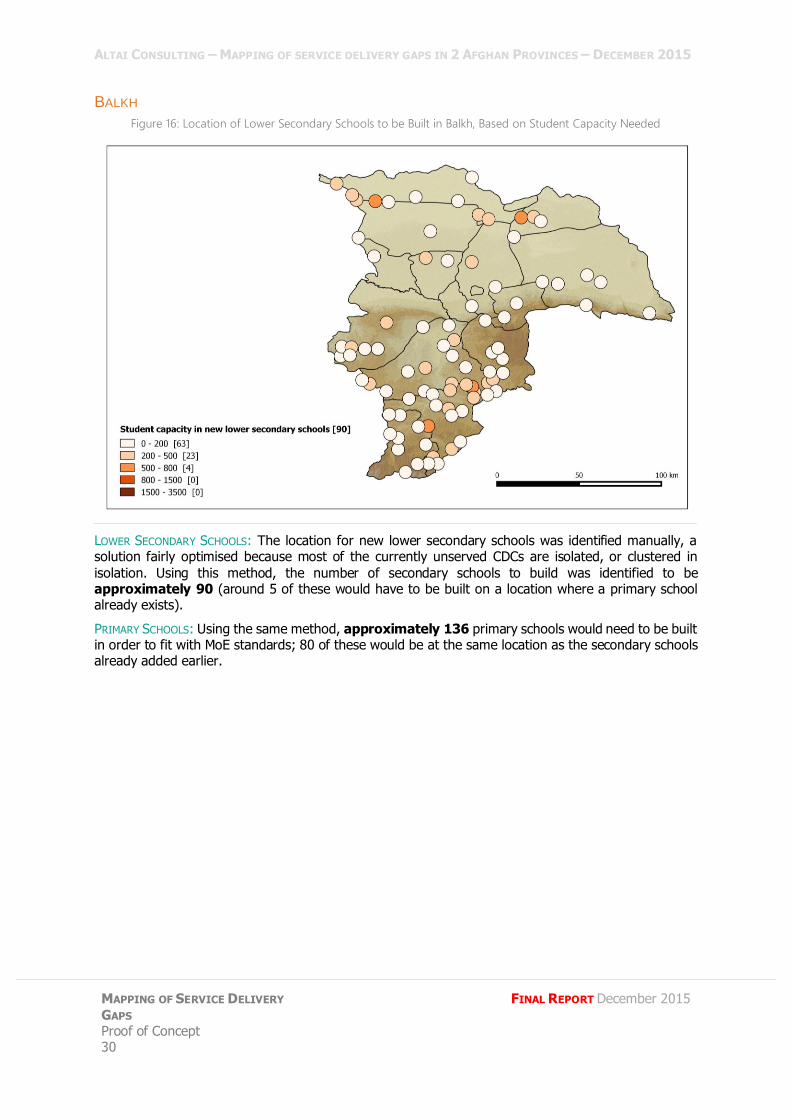
Figure 16: Location of Lower Secondary Schools to be Built in Balkh, Based on Student Capacity Needed
LOWER SECONDARY SCHOOLS: The location for new lower secondary schools was identified manually, a solution fairly optimised because most of the currently unserved CDCs are isolated, or clustered in
isolation. Using this method, the number of secondary schools to build was identified to be approximately 90 (around 5 of these would have to be built on a location where a primary school already exists).
PRIMARY SCHOOLS: Using the same method, approximately 136 primary schools would need to be built in order to fit with MoE standards; 80 of these would be at the same location as the secondary schools already added earlier.
ERREUR ! UTILISEZ L'ONGLET ACCUEIL POUR APPLIQUER HEADING 1 AU TEXTE QUE VOUS SOUHAITEZ FAIRE
APPARAITRE ICI.
FINAL REPORT December 2015
MAPPING OF SERVICE DELIVERY GAPS Proof of Concept
31
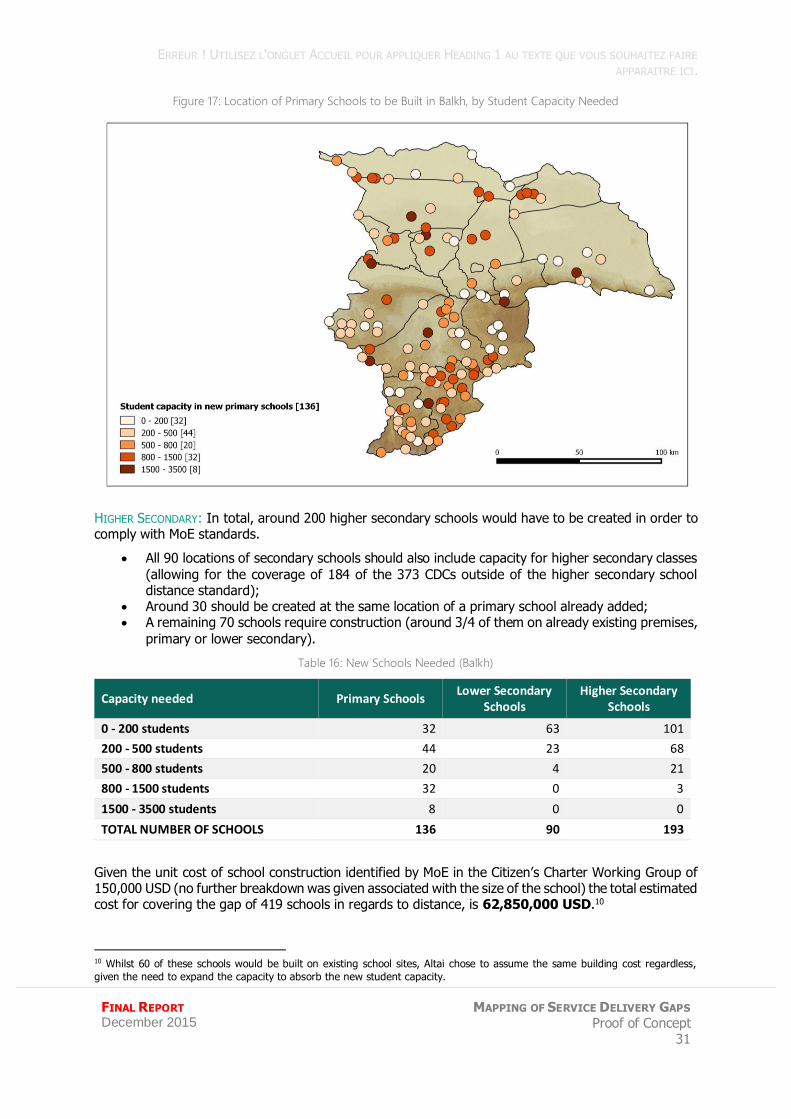
Figure 17: Location of Primary Schools to be Built in Balkh, by Student Capacity Needed
HIGHER SECONDARY: In total, around 200 higher secondary schools would have to be created in order to comply with MoE standards.
All 90 locations of secondary schools should also include capacity for higher secondary classes
(allowing for the coverage of 184 of the 373 CDCs outside of the higher secondary school distance standard);
Around 30 should be created at the same location of a primary school already added; A remaining 70 schools require construction (around 3/4 of them on already existing premises,
primary or lower secondary).
Table 16: New Schools Needed (Balkh)
Capacity needed Primary Schools Lower Secondary
Schools Higher Secondary
Schools
0 - 200 students 32 63 101
200 - 500 students 44 23 68
500 - 800 students 20 4 21
800 - 1500 students 32 0 3
1500 - 3500 students 8 0 0
TOTAL NUMBER OF SCHOOLS 136 90 193
Given the unit cost of school construction identified by MoE in the Citizen’s Charter Working Group of 150,000 USD (no further breakdown was given associated with the size of the school) the total estimated cost for covering the gap of 419 schools in regards to distance, is 62,850,000 USD.10
10 Whilst 60 of these schools would be built on existing school sites, Altai chose to assume the same building cost regardless,
given the need to expand the capacity to absorb the new student capacity.
ALTAI CONSULTING – MAPPING OF SERVICE DELIVERY GAPS IN 2 AFGHAN PROVINCES – DECEMBER 2015
MAPPING OF SERVICE DELIVERY
GAPS Proof of Concept 32
FINAL REPORT December 2015
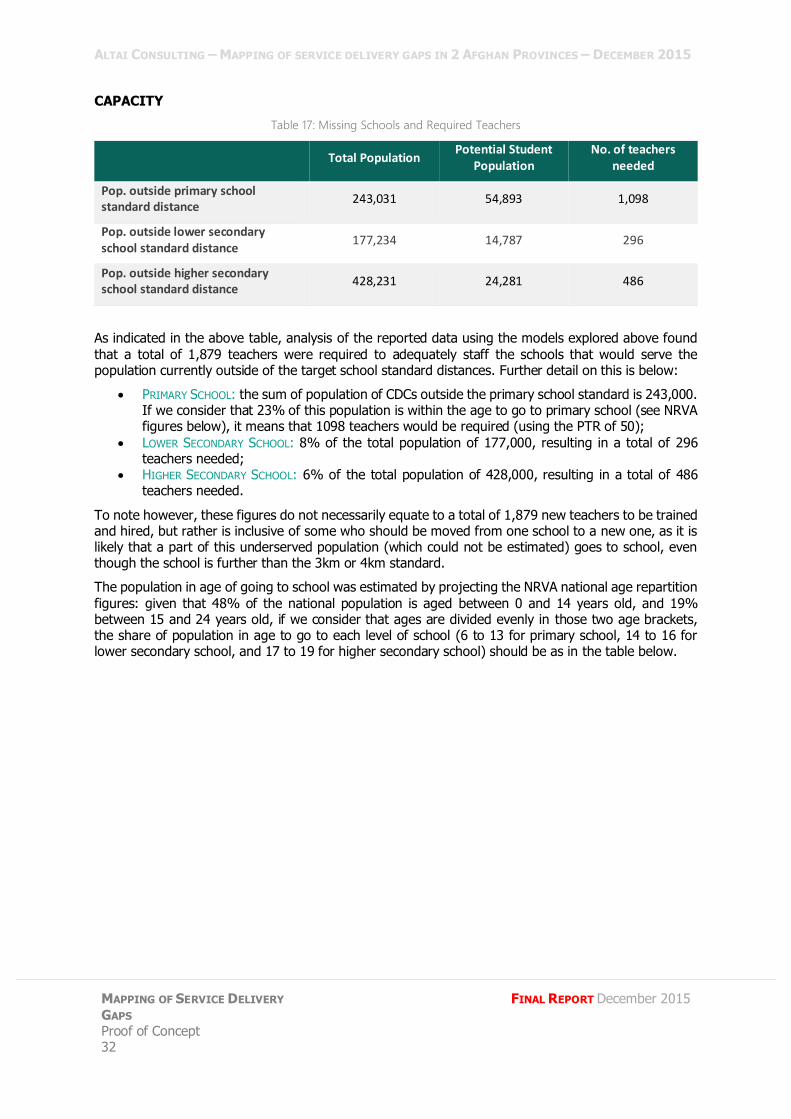
CAPACITY
Table 17: Missing Schools and Required Teachers
Total Population Potential Student
Population No. of teachers
needed
Pop. outside primary school standard distance
243,031 54,893 1,098
Pop. outside lower secondary school standard distance
177,234 14,787 296
Pop. outside higher secondary school standard distance
428,231 24,281 486
As indicated in the above table, analysis of the reported data using the models explored above found
that a total of 1,879 teachers were required to adequately staff the schools that would serve the population currently outside of the target school standard distances. Further detail on this is below:
PRIMARY SCHOOL: the sum of population of CDCs outside the primary school standard is 243,000. If we consider that 23% of this population is within the age to go to primary school (see NRVA figures below), it means that 1098 teachers would be required (using the PTR of 50);
LOWER SECONDARY SCHOOL: 8% of the total population of 177,000, resulting in a total of 296 teachers needed;
HIGHER SECONDARY SCHOOL: 6% of the total population of 428,000, resulting in a total of 486 teachers needed.
To note however, these figures do not necessarily equate to a total of 1,879 new teachers to be trained and hired, but rather is inclusive of some who should be moved from one school to a new one, as it is likely that a part of this underserved population (which could not be estimated) goes to school, even though the school is further than the 3km or 4km standard.
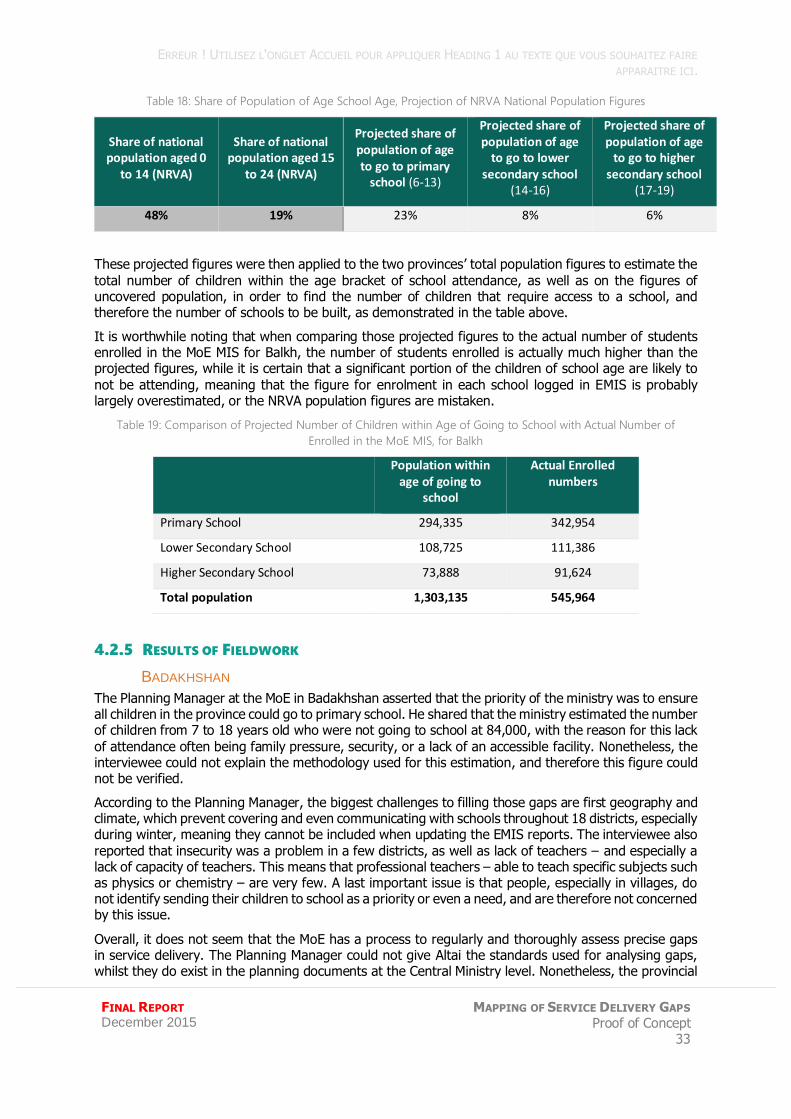
The population in age of going to school was estimated by projecting the NRVA national age repartition
figures: given that 48% of the national population is aged between 0 and 14 years old, and 19% between 15 and 24 years old, if we consider that ages are divided evenly in those two age brackets, the share of population in age to go to each level of school (6 to 13 for primary school, 14 to 16 for lower secondary school, and 17 to 19 for higher secondary school) should be as in the table below.
ERREUR ! UTILISEZ L'ONGLET ACCUEIL POUR APPLIQUER HEADING 1 AU TEXTE QUE VOUS SOUHAITEZ FAIRE
APPARAITRE ICI.
FINAL REPORT December 2015
MAPPING OF SERVICE DELIVERY GAPS Proof of Concept
33
Table 18: Share of Population of Age School Age, Projection of NRVA National Population Figures
Share of national population aged 0
to 14 (NRVA)
Share of national population aged 15
to 24 (NRVA)
Projected share of population of age to go to primary
school (6-13)
Projected share of population of age
to go to lower secondary school
(14-16)
Projected share of population of age
to go to higher secondary school
(17-19)
48% 19% 23% 8% 6%
These projected figures were then applied to the two provinces’ total population figures to estimate the
total number of children within the age bracket of school attendance, as well as on the figures of uncovered population, in order to find the number of children that require access to a school, and therefore the number of schools to be built, as demonstrated in the table above.
It is worthwhile noting that when comparing those projected figures to the actual number of students enrolled in the MoE MIS for Balkh, the number of students enrolled is actually much higher than the projected figures, while it is certain that a significant portion of the children of school age are likely to
not be attending, meaning that the figure for enrolment in each school logged in EMIS is probably largely overestimated, or the NRVA population figures are mistaken.
Table 19: Comparison of Projected Number of Children within Age of Going to School with Actual Number of
Enrolled in the MoE MIS, for Balkh
Population within
age of going to school
Actual Enrolled numbers
Primary School 294,335 342,954
Lower Secondary School 108,725 111,386
Higher Secondary School 73,888 91,624
Total population 1,303,135 545,964
4.2.5 RESULTS OF FIELDWORK
BADAKHSHAN
The Planning Manager at the MoE in Badakhshan asserted that the priority of the ministry was to ensure all children in the province could go to primary school. He shared that the ministry estimated the number of children from 7 to 18 years old who were not going to school at 84,000, with the reason for this lack
of attendance often being family pressure, security, or a lack of an accessible facility. Nonetheless, the interviewee could not explain the methodology used for this estimation, and therefore this figure could not be verified.
According to the Planning Manager, the biggest challenges to filling those gaps are first geography and climate, which prevent covering and even communicating with schools throughout 18 districts, especially during winter, meaning they cannot be included when updating the EMIS reports. The interviewee also
reported that insecurity was a problem in a few districts, as well as lack of teachers – and especially a lack of capacity of teachers. This means that professional teachers – able to teach specific subjects such as physics or chemistry – are very few. A last important issue is that people, especially in villages, do not identify sending their children to school as a priority or even a need, and are therefore not concerned by this issue.
Overall, it does not seem that the MoE has a process to regularly and thoroughly assess precise gaps in service delivery. The Planning Manager could not give Altai the standards used for analysing gaps, whilst they do exist in the planning documents at the Central Ministry level. Nonetheless, the provincial
ALTAI CONSULTING – MAPPING OF SERVICE DELIVERY GAPS IN 2 AFGHAN PROVINCES – DECEMBER 2015
MAPPING OF SERVICE DELIVERY
GAPS Proof of Concept 34
FINAL REPORT December 2015
department apparently developed a list of 30 locations where a primary school should be built. Unfortunately, the location of those places or the methodology used to define them could not be assessed either, given a lack of access to the documents, which again casts doubt on whether the MoE carries out a complete and precise assessment of service delivery gaps. It is more likely that the
department proceeds on a case by case basis, trying to fill gaps in areas that were assessed individually or that are well known for missing a school, rather than an overall review of which areas need a school in priority.
BALKH
The head of EQUIP department at Balkh MoE provincial department assured Altai that there were no geographical gaps in terms of educational services delivery in his province, saying that the 580 schools were sufficient to cover the 14 districts, and that remote areas were also covered by schools managed
by partner NGOs. Nonetheless, he asserted there were some gaps in terms of capacity and professional teaching staff. He also noted that 90% of the teachers were female teachers, were not able or willing to work in rural areas, and a high rate of maternity leave (300 to 400 female teachers in maternity leave every month according to him), while male graduates from education faculties did not want to become teachers because of low salaries.
Another gap is in terms of teaching equipment, and more importantly facilities: a lack of suitable school buildings (for instance, the city of Mazar-e Sharif has a total of 12,000 classes, but only 3,000 classrooms), which affects the quality of teaching due to the number of shifts per day, and the short length of lessons.
A final issue identified was that standards finalised by the ministry for the construction of new schools were sometimes not respected, because of public figures pressuring for schools to be built near to their
own villages: the interviewee assumes that some schools have 40 students but 12 classrooms.
Finally, he stated that his department had no budget from the ministry or other donors for building new schools in the next three years, and shared that the standard cost he had for the construction of new schools was 10,000 USD per classroom.
ERREUR ! UTILISEZ L'ONGLET ACCUEIL POUR APPLIQUER HEADING 1 AU TEXTE QUE VOUS SOUHAITEZ FAIRE
APPARAITRE ICI.
FINAL REPORT December 2015
MAPPING OF SERVICE DELIVERY GAPS Proof of Concept
35
4.3 NSP AND MRRD ROAD AND CDC DATA
4.3.1 ROADS IN THE CITIZEN’S CHARTER
One of the targeted service delivery ambitions of the Citizen’s Charter is to develop farm to market roads. The MRRD Working Group document states that data used for the development of this module is digitally mapped. However, no GIS mapping was shared with Altai by the MRRD, and it was noted by the NSP team that this has not been undertaken as of yet by their team.11 As far as Altai understands, no targets appear to be set for the farm to market module of the Citizen’s Charter.
4.3.2 THE DATA
THE MIS
During the proof of concept phase, it was found that while NSP and MRRD are tracking the implementation of road projects under their programming, there is currently no GPS data or GIS mapping initiative available showing the path or end points of roads.
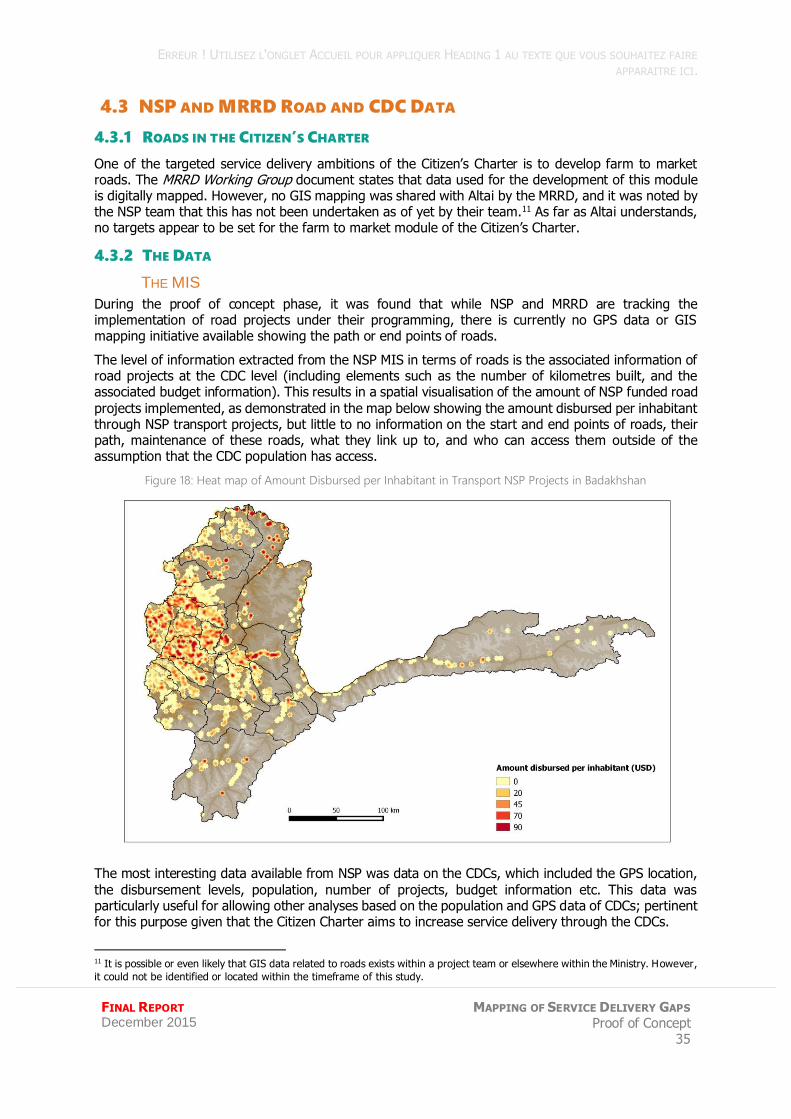
The level of information extracted from the NSP MIS in terms of roads is the associated information of road projects at the CDC level (including elements such as the number of kilometres built, and the associated budget information). This results in a spatial visualisation of the amount of NSP funded road
projects implemented, as demonstrated in the map below showing the amount disbursed per inhabitant through NSP transport projects, but little to no information on the start and end points of roads, their path, maintenance of these roads, what they link up to, and who can access them outside of the assumption that the CDC population has access.
Figure 18: Heat map of Amount Disbursed per Inhabitant in Transport NSP Projects in Badakhshan
The most interesting data available from NSP was data on the CDCs, which included the GPS location,
the disbursement levels, population, number of projects, budget information etc. This data was particularly useful for allowing other analyses based on the population and GPS data of CDCs; pertinent for this purpose given that the Citizen Charter aims to increase service delivery through the CDCs.
11 It is possible or even likely that GIS data related to roads exists within a project team or elsewhere within the Ministry. However,
it could not be identified or located within the timeframe of this study.
ALTAI CONSULTING – MAPPING OF SERVICE DELIVERY GAPS IN 2 AFGHAN PROVINCES – DECEMBER 2015
MAPPING OF SERVICE DELIVERY
GAPS Proof of Concept 36
FINAL REPORT December 2015
DATA QUALITY
Table 20: CDC Data Quality
Balkh Badakhshan Total
No. of CDCs reported 935 1817 2752
No. of CDCs without location data 0 107 107
No. of CDCs with erroneous locations 20 32 52
No. of CDCs usable for GIS analysis 915 1678 2593
% of CDCs usable for GIS analysis 97.8% 92.4% 94.2%
Across both provinces, 94.2% of CDCs were used in the final analysis, resulting from the exclusion of:
107 CDCs that have no GPS data available, representative of 39,500 people, and a total disbursement of 4.0M USD of NSP money;
52 CDCs that have GPS data that is evidently incorrect, accounting for a population of 52,443, and a total disbursement of 2.7M USD of the NSP programme.
DATA GAPS
Many roads in Afghanistan have been built off-budget, by a variety of donors both large and small,
many of which are lacking related centralised data, and therefore it is likely that these may be outside of the road network mapped in this project. However, the maintenance required of roads, particularly in the harsh environment of Afghanistan, should require that at some stage, these roads be handed over to a ministry for their continued maintenance, at which point they should be captured by the ministry’s MIS system. In the case that this hasn’t occurred, it seems relatively safe to assume that any
road built over two years ago, and which is not being maintained, can be considered as no longer an improved road. This is a relevant caveat to note in any future mapping process, which would require inclusion of more comprehensive data on the road network.
4.3.3 ANALYSIS
Given the lack of GPS data on the road network in the MIS of MRRD and NSP, little can be done in terms
of mapping roads through ministry data; much less so on specifying how many farm to market roads are required to provide full service to rural areas.
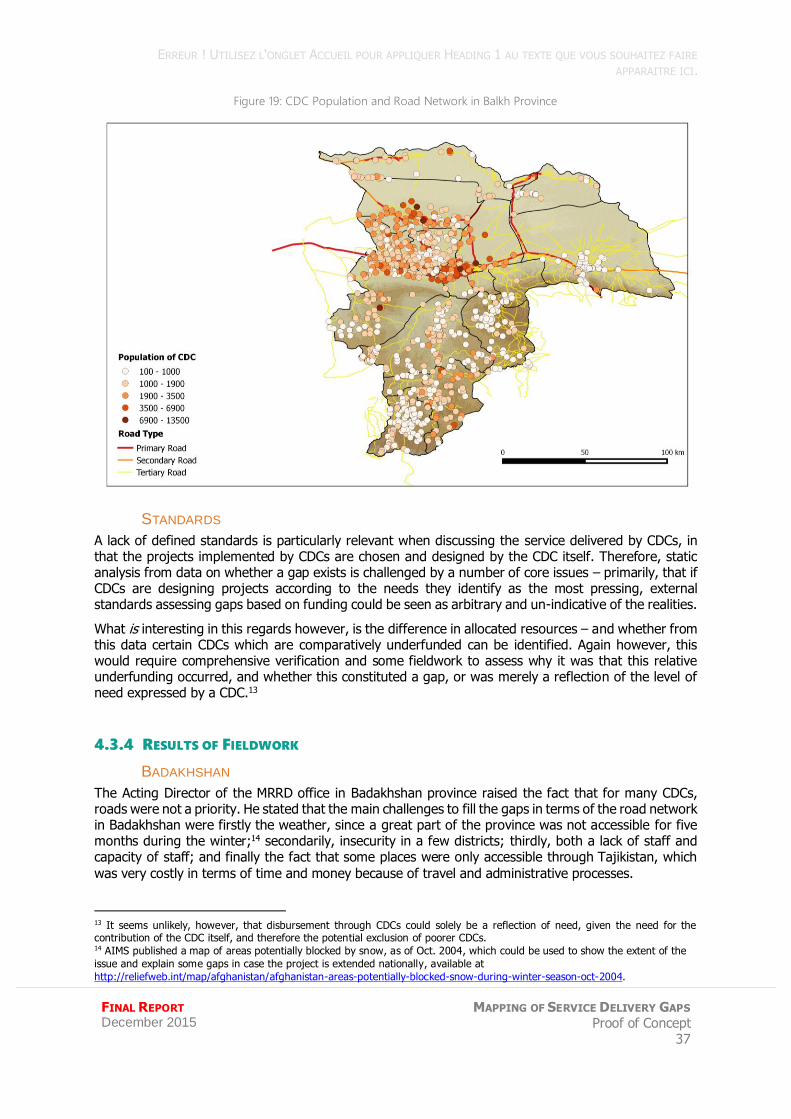
For the sake of this proof of concept therefore, road data was largely important in regards to the access that roads provide to other service assets. Road mapping data used was taken from OCHA’s roads dataset, produced for humanitarian purposes from a number of different sources.12 However, whilst
some analysis is included in the health and education sectors conducted through the road network, this is largely to demonstrate the capacity to utilise such analysis, if a more comprehensive, verified source of road data was to be collected or used in the future.
An example of the layers provided by the road network, and CDC data from the NSP MIS is shown for Balkh below.
12 The road mapping shared by OCHA on The Humanitarian Data Exchange is based on the original dataset from Afghanistan
Information Management Services (AIMS), and updated using OSM, Google Earth, and field observation. Permission was sought by and granted to Altai Consulting to use this dataset in the proof of concept.
ERREUR ! UTILISEZ L'ONGLET ACCUEIL POUR APPLIQUER HEADING 1 AU TEXTE QUE VOUS SOUHAITEZ FAIRE
APPARAITRE ICI.
FINAL REPORT December 2015
MAPPING OF SERVICE DELIVERY GAPS Proof of Concept
37
Figure 19: CDC Population and Road Network in Balkh Province
STANDARDS
A lack of defined standards is particularly relevant when discussing the service delivered by CDCs, in that the projects implemented by CDCs are chosen and designed by the CDC itself. Therefore, static analysis from data on whether a gap exists is challenged by a number of core issues – primarily, that if CDCs are designing projects according to the needs they identify as the most pressing, external standards assessing gaps based on funding could be seen as arbitrary and un-indicative of the realities.
What is interesting in this regards however, is the difference in allocated resources – and whether from this data certain CDCs which are comparatively underfunded can be identified. Again however, this would require comprehensive verification and some fieldwork to assess why it was that this relative underfunding occurred, and whether this constituted a gap, or was merely a reflection of the level of need expressed by a CDC.13
4.3.4 RESULTS OF FIELDWORK
BADAKHSHAN
The Acting Director of the MRRD office in Badakhshan province raised the fact that for many CDCs, roads were not a priority. He stated that the main challenges to fill the gaps in terms of the road network in Badakhshan were firstly the weather, since a great part of the province was not accessible for five months during the winter;14 secondarily, insecurity in a few districts; thirdly, both a lack of staff and capacity of staff; and finally the fact that some places were only accessible through Tajikistan, which
was very costly in terms of time and money because of travel and administrative processes.
13 It seems unlikely, however, that disbursement through CDCs could solely be a reflection of need, given the need for the contribution of the CDC itself, and therefore the potential exclusion of poorer CDCs. 14 AIMS published a map of areas potentially blocked by snow, as of Oct. 2004, which could be used to show the extent of the
issue and explain some gaps in case the project is extended nationally, available at
http://reliefweb.int/map/afghanistan/afghanistan-areas-potentially-blocked-snow-during-winter-season-oct-2004.
ALTAI CONSULTING – MAPPING OF SERVICE DELIVERY GAPS IN 2 AFGHAN PROVINCES – DECEMBER 2015
MAPPING OF SERVICE DELIVERY
GAPS Proof of Concept 38
FINAL REPORT December 2015
In regards to analysing the gaps in the province, it appears that the MRRD does not have a systematic and thorough screening of where precisely those gaps are situated, even though he could cite the districts where the road network was less dense compared to the centre of the province. The MRRD apparently has a monthly meeting with other ministries, NGOs and organisations for coordination of
projects where they talk about gaps in service delivery, but it has never led to a complete report of the precise gaps. Moreover, according to its Acting Director, the MRRD has no input on the choice of locations to build new roads: the communities are the ones choosing, and the NGOs selected as facilitating partners are then in charge of carrying out the work.
BALKH
The interview in Balkh with the head of programmes at MRRD allowed researchers to uncover new possible reasons for gaps in terms of NSP coverage: the interviewee asserted that there was a need to
establish new CDCs – 100 CDCs needed for instance in Nahre Shahee district according to him – but that NSP did not plan on extending its reach, and its resources did not allow to establish new CDCs. Other reasons of those gaps include security in some districts of the province such as Zaree, Charbolak, Dawlatabad and Chamtal (9 employees of the NGO and NSP implementing partner PIN were killed in Zaree this year), political interventions, disputes among the people in the community that prevent
projects from being implemented properly, or unwillingness of people to participate in the NSP programme.
The interviewee also stated MRRD had challenges in terms of staff and the capacity of staff: for instance, the ministry only has social workers in 3 districts (2 in each), and no social worker in the remaining 11 districts; while according to him the engineering capacity of its staff overall was not high enough, despite capacity building programmes run by GIZ.
He shared that one solution to improve public service delivery in the province would be a better coordination between ministries and programme partners: citing some issues he encountered with the MoE when NSP took care of the building of a school in a CDC following plans of the MoE, but the latter not taking over the school management after the end of the construction.
ERREUR ! UTILISEZ L'ONGLET ACCUEIL POUR APPLIQUER HEADING 1 AU TEXTE QUE VOUS SOUHAITEZ FAIRE
APPARAITRE ICI.
FINAL REPORT December 2015
MAPPING OF SERVICE DELIVERY GAPS Proof of Concept
39
PROOF-OF –CONCEPT
5.1 ASSESSMENT OF METHODOLOGY
As a proof of concept project, the aim was to test the capacity to provide meaningful mapping of government service assets in order to identify the current gaps that exist. As has been discussed throughout the above sections, the current data available in the Ministry MIS provides a significant resource with which to develop modelling to analyse service delivery gaps.
However, much of this is basic analysis based on assumptions, challenged population data and a lack of comprehensive road data; and whilst Altai is confident with the results given the data provided, it remains that many assumptions are contained. Whilst it is possible to make assumptions at a macro level, and infer gaps in certain areas, the lack of detail, and accompanying incapacity to drill down into specifics renders the exercise weak in terms of supporting the Citizens Charter initiative.
5.2 EXPANDING THE SERVICE GAP ASSESSMENT
For an in-depth case study analysis on design and placement of services to support the development and roll-out of the Citizen’s Charter, a number of factors need to be taken into account.
THE IMPORTANCE OF QUALITY
Quality of service delivery is without doubt essential to any programme attempting to ensure the most marginalised in society are provided access to basic services. Without expanding the methodology to assess the quality of service delivered, a lack of comprehension on perhaps the most fundamental
element of service delivery exists.
For example, whilst locating and assessing the accessibility of schools is one important aspect, it lacks an insight into the usability of these schools, including for example, how many of the teachers noted in the MIS actually turn up for work each day; how many days the schools are open on average, etc.
UNDERSTANDING THE MINISTRIES CAPACITIES
The ministry MIS, in particular HMIS, are well developed, and all appear to be under progression to improve their processes and capacity. Projects to complement and support this development through a
mapping process such as this, could play a powerful role in enhancing the ministries’ planning department, and subsequently supporting the Citizen’s Charter to most effectively deliver on their goals. For such a project to support most adequately the work of the MIS departments, the strengths and weaknesses of the ministries should be incorporated into the future design of the programme.
As such, the fieldwork confirmed that the monitoring departments at the provincial level had well established processes and collected thorough data on the existing facilities and capacities that allows to
assess the needs in covered areas, but that none of the three departments assessed have a complete understanding of the needs outside of the covered areas. In particular, even though the ministries have an idea of the districts where more capacity or facilities would be needed or of the total population not covered, the absence of standards in terms of distance from a CDC or settlement to a facility (or ignorance of it in the case of the MoE provincial departments), prevents from carrying out an analysis
of the precise locations where those additional facilities would be needed. Some of the strategic and operational plans finalised by the ministries do talk about building new facilities in uncovered regions, but that rather seems to be the result of individual assessments on specific areas, and not of a global assessment stating where are the more urgent needs.
ALTAI CONSULTING – MAPPING OF SERVICE DELIVERY GAPS IN 2 AFGHAN PROVINCES – DECEMBER 2015
MAPPING OF SERVICE DELIVERY
GAPS Proof of Concept 40
FINAL REPORT December 2015
5.3 PROPOSED METHODOLOGY
Altai proposes a number of measures which can ensure that an enlargement of this concept is most
effective in its aims:
Citizen’s Charter has clearly defined standards of measuring what is considered “accessible” and therefore how to identify gaps that exist outside of this; Geolocation of all assets should be undertaken. The largescale monitoring processes
involved in programmes such as the Citizen’s Charter should allow for not only the collection of such data, but the verification of the location;
Road mapping data, which is particularly powerful in grounding any distance based analysis in reality could either be considered for purchase, or more likely, be mapped out. Private sources
were spoken of during the data collection phase (such as Louis Berger’s data) but as access was not provided to these, Altai cannot attest to its quality or comprehensiveness. Data from ministries or departments whose collaboration was not sought in the scope of work was not used either (MoPW, and NRAP data at the MRRD). The World Bank could consider supporting the collation and distribution of such data as a project that could provide essential information
to a number of partners, beyond just the Ministries, and into the humanitarian sphere;
Sharing results, especially mapping data, could be done using an online platform that allows for an interactive version of the maps created in QGIS. This would enable the World Bank and potentially other selected people interested in the project to have permanent access to the
mapping data on a protected platform, for more extensive exploration – for instance zooming in to areas of interest – for all of the maps and analyses performed by Altai;
Fieldwork for verification purposes would strongly support any analysis on the capacity and
extent of service delivery. Despite its limited nature, the fieldwork that formed a part of this proof of concept provided vital insight into the realities on the ground. Altai proposes that any extension of this project strongly integrate fieldwork to not only talk with line department staff, but to conduct verification visits, to assess the usage rate of services amongst the population, satisfaction levels, and needs. As rough identification of underserved areas is possible with the
current level of data, this information can be used to guide fieldwork in a number of ways, including:
o Gauging the level of awareness of provincial authorities; o Assessing what has been attempted to solve the gap; o Visiting a small sample of locations in each gap to understand the realities framing this
lack of service; and
o Interviewing local residents to understand coping mechanisms to counter the absence of public services;
Existing M&E of service delivery includes a minor assessments of the quality of service
delivery, which includes aspects such as counting the number of textbooks, or equipment available, but not investigating the actual education or health outcomes. In order to support a comprehensive assessment of service delivery, assessing these factors could be approached through a variety of on-the-ground and desk research formats;
Accounting for off-budget service delivery within the ministries’ MIS by systematically
integrating their data, beginning even with just data on their location and services, can help to avoid the risk of duplication of services, and also allow for the integration of such services into the public system in the future. Whilst this will be a timely process, and one that essentially relies on the capacity for the ministries to enforce registration of private facilities, it can also
help to enforce quality control of service delivery;
ERREUR ! UTILISEZ L'ONGLET ACCUEIL POUR APPLIQUER HEADING 1 AU TEXTE QUE VOUS SOUHAITEZ FAIRE
APPARAITRE ICI.
FINAL REPORT December 2015
MAPPING OF SERVICE DELIVERY GAPS Proof of Concept
41
The beginning of the Citizen’s Charter could provide an interesting moment to cooperate with and develop the capacity of the CSO, with the aim of building the long-term capacity of the CSO to be the providers of community-based data on the country. This would ideally result
in a direct feed of vital data related to each CDC and the Citizen’s Charter services, allowing for programming to be best designed to reflect on this data. By directing the search for data through the CSO, you channel capacity through the national agency, ensuring a sustainable option for the country. However, considerable work would remain to be done in building the correct systems and capacity to channel data useful to the programme.