Embed Size (px)
Citation preview
© Queen’s Printer and Controller of HMSO 2011. This work was produced by the
Birthplace in England research programme et al. under the terms of a commissioning
contract issued by the Secretary of State for Health.
Project 08/1604/140
Mapping maternity care: the configuration of maternity care in England Birthplace in England research programme. Final report part 3
Maggie Redshaw1, Rachel Rowe1, Liz Schroeder1, David
Puddicombe1, Alison Macfarlane2, Mary Newburn3,Chris McCourt2, Jane Sandall4, Louise Silverton5 and Neil Marlow6
on behalf of the Birthplace in England Collaborative Group
1 National Perinatal Epidemiology Unit, University of Oxford 2 City University, London 3 NCT 4 Kings College, London 5Royal College of Midwives (RCM) 6University College, London
Published November 2011

© Queen’s Printer and Controller of HMSO 2011. This work was produced by the
Birthplace in England research programme et al. under the terms of a commissioning
contract issued by the Secretary of State for Health.
Project 08/1604/140 2
Address for correspondence
Maggie Redshaw
National Perinatal Epidemiology Unit
University of Oxford
Old Road Campus
Oxford OX3 7LF
Email: [email protected]
This report should be referenced as follows
Redshaw M, Rowe R, Schroeder L, Puddicombe D, Macfarlane A, Newburn
M, McCourt C, Sandall J, Silverton L and Marlow N. Mapping maternity care:
the configuration of maternity care in England. Birthplace in England
research programme. Final report part 3. NIHR Service Delivery and
Organisation programme; 2011.
Copyright information
This report may be freely reproduced for the purposes of private research
and study and extracts (or indeed, the full report) may be included in
professional journals provided that suitable acknowledgement is made and
the reproduction is not associated with any form of advertising. Applications
for commercial reproduction should be addressed to NETSCC, SDO.
Disclaimer
This report presents independent research commissioned by the National
Institute for Health Research Service Delivery and Organisation (NIHR SDO)
programme and the Department of Health Policy Research Programme (DH
PRP). The views and opinions expressed by authors in this publication are
those of the authors and do not necessarily reflect those of the NHS, the
NIHR, the NIHR SDO programme, the DH PRP or the Department of Health.
The views and opinions expressed by the interviewees in this publication are
those of the interviewees and do not necessarily reflect those of the
authors, those of the NHS, the NIHR, the NIHR SDO programme, DH PRP or
the Department of Health.
© Queen’s Printer and Controller of HMSO 2011. This work was produced by the
Birthplace in England research programme et al. under the terms of a commissioning
contract issued by the Secretary of State for Health.
Project 08/1604/140 3
Contents
List of tables .............................................................................................. 5
List of figures ............................................................................................. 6
Glossary of terms/abbreviations ................................................................... 7
Acknowledgements ..................................................................................... 8
Mapping working group ............................................................................ 8
Contributions .......................................................................................... 8
Executive Summary .................................................................................... 9
Background ............................................................................................ 9
Aims ...................................................................................................... 9
Methods ................................................................................................. 9
Results ................................................................................................. 10
Units and configuration ........................................................................ 10
Workload ........................................................................................... 10
Capacity, occupancy and eligibility ........................................................ 11
Staffing ............................................................................................. 11
Intrapartum related services ................................................................ 12
Gaps in provision ................................................................................ 12
Recent and future changes in service provision ....................................... 13
Conclusions .......................................................................................... 13
1 Introduction ....................................................................................... 15
1.1 The research question.................................................................... 15
2 Methods ............................................................................................ 16
2.1 Data collection .............................................................................. 16
2.1.1 2007 survey ............................................................................ 16
2.1.2 2010 follow-up survey .............................................................. 17
2.2 Data analysis ................................................................................ 17
3 Results .............................................................................................. 19
3.1 How is intrapartum maternity care provided and where is care available? .
.................................................................................................. 19
© Queen’s Printer and Controller of HMSO 2011. This work was produced by the
Birthplace in England research programme et al. under the terms of a commissioning
contract issued by the Secretary of State for Health.
Project 08/1604/140 4
3.1.1 Configuration within trusts ........................................................ 19
3.1.2 The geographical location of maternity units ............................... 20
3.2 Births in maternity units ................................................................ 22
3.3 Home births ................................................................................. 24
3.4 Where are the beds? ..................................................................... 24
3.4.1 Capacity in units and regions .................................................... 24
3.4.2 Beds and throughput ................................................................ 26
3.5 Eligibility for admission to FMUs and AMUs ....................................... 28
3.6 Staffing in maternity care ............................................................... 31
3.6.1 Midwifery and maternity support worker staff .............................. 31
3.6.2 Midwifery staffing and throughput .............................................. 33
3.6.3 Skill mix in midwifery staffing ................................................... 34
3.6.4 Non-clinical staff ...................................................................... 38
3.6.5 Medical staff associated with AMUs and FMUs .............................. 38
3.6.6 Medical staff employed in OUs ................................................... 38
3.6.7 General practitioner involvement ............................................... 39
3.6.8 Models of midwifery care .......................................................... 40
3.6.9 Availability of specialist and intrapartum related services .............. 40
3.7 Where are the gaps? ..................................................................... 42
3.7.1 Closures ................................................................................. 42
3.7.2 Use of bank and agency midwifery and support staff .................... 42
3.7.3 Vacancies and turnover ............................................................ 43
3.8 Changes in maternity services since 2007 ........................................ 46
3.8.1 Changes in numbers of units to 2010 ......................................... 46
3.8.2 Plans for provision in 2007, changes up to 2010 and future plans .. 47
3.8.3 Changes in configuration within trusts to 2010 ............................ 50
4 Discussion and conclusions .................................................................. 52
4.1 Key messages ............................................................................... 54
4.2 Recommendations for further research ............................................ 54
References .............................................................................................. 56
© Queen’s Printer and Controller of HMSO 2011. This work was produced by the
Birthplace in England research programme et al. under the terms of a commissioning
contract issued by the Secretary of State for Health.
Project 08/1604/140 5
List of tables
Table 1. Configuration of maternity care within trusts in England in 2007 ... 20
Table 2. Types of maternity unit by geographical area of England in 2007
(SHAs) ............................................................................................. 21
Table 3. Numbers of women delivered in different types of maternity unit in
year to 31 March 2007 .............................................................................. 22
Table 4. Women giving birth at home in the year to 31 March 2007 in trusts
with different configuration ........................................................................ 24
Table 5. Delivery bed numbers by type of maternity unit in 2007 ............... 25
Table 6. Women delivered per bed/per bed space by types of maternity unit in
2007 ............................................................................................. 26
Table 7. Criteria for eligibility for admission to FMUs and AMUs in 2007 ...... 29
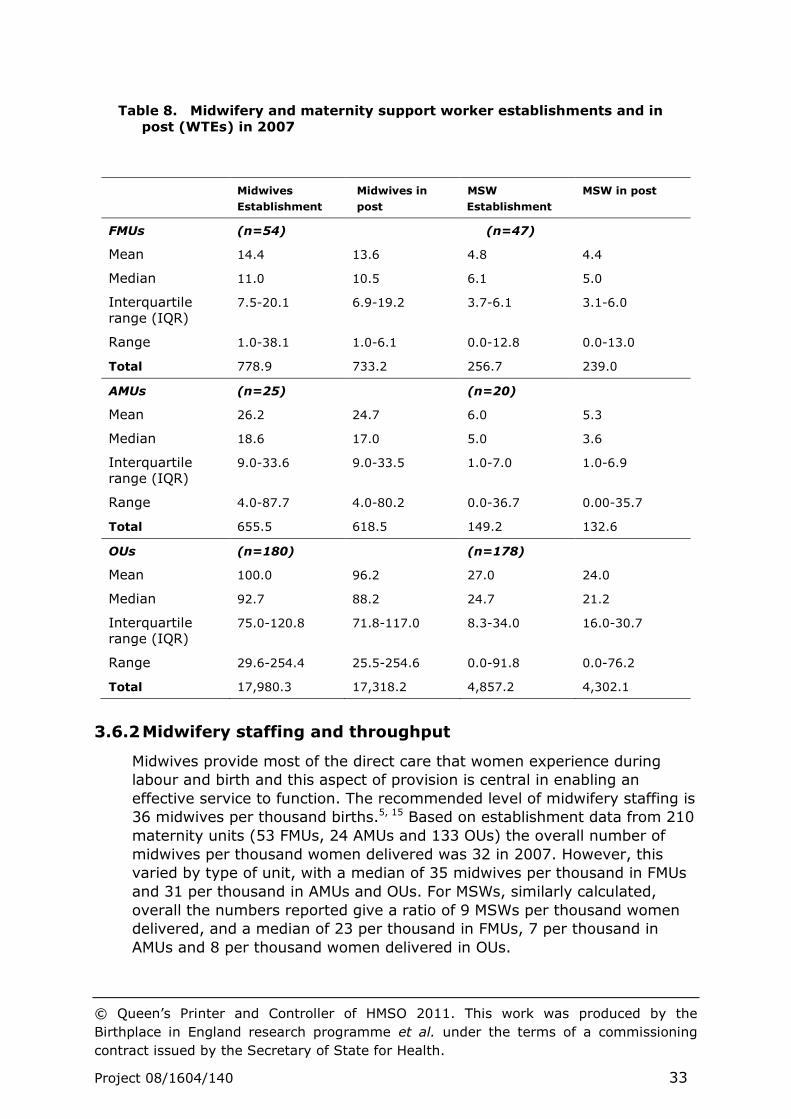
Table 8. Midwifery and maternity support worker establishments and in post
(WTEs) in 2007 ........................................................................................ 33
Table 9. Skill mix among midwives in 2007, using establishment data by unit
type ............................................................................................. 35
Table 10. Skill mix among maternity support workers in 2007, using
establishment data by unit type ................................................................. 36
Table 11. Midwives and maternity support workers (WTEs) in post on delivery
suite/labour ward (including theatre) at 31 March 2007 by type of maternity unit
............................................................................................. 37
Table 12. Medical staff (WTEs) in post working in OUs in 2007 .................... 39
Table 13. Availability of intrapartum related services in different types of
maternity unit in 2007 .............................................................................. 41
Table 14. Units employing midwives and maternity support workers from bank
and agency during March 2007. ................................................................. 42
Table 15. Vacancies and turnover details among midwives and MSWs by unit
type for 2007 ........................................................................................... 43
Table 16. Vacancies among maternity support workers by unit type at 31
March 2007 ............................................................................................. 44
Table 17. Number and proportion of midwives aged 50 years or over by unit
type ............................................................................................. 45
Table 18. A comparison of the numbers of maternity units in England in 2007
and 2010 ............................................................................................. 46
© Queen’s Printer and Controller of HMSO 2011. This work was produced by the
Birthplace in England research programme et al. under the terms of a commissioning
contract issued by the Secretary of State for Health.
Project 08/1604/140 6
Table 19. Number of maternity units in 2007 and 2010 in different geographical
regions of England .................................................................................... 47
Table 20. Future plans in 2007: numbers and proportions of trusts planning
changes ............................................................................................. 48
Table 21. Changes made in three years to December 2010: numbers and
proportions of trusts making these changes in maternity care ........................ 48
Table 22. Future changes: numbers and proportions of planned changes in
maternity care provision in the next three years from 2011 onwards .............. 49
Table 23. Summary of configuration of maternity care in Trusts in England from
2007 and 2010 surveys ............................................................................. 50
List of figures
Figure 1. Configuration of maternity units in 2007 within trusts by geographical
area (SHA) ............................................................................................. 20
Figure 2. Distribution of FMUs, AMUs and OUs in England by geographical
regions (SHA) in 2007 .............................................................................. 21
Figure 3. Distribution of types of unit by women delivered ......................... 23
Figure 4. Distribution of numbers of births in trusts by configuration in year to
31 March 2007 ......................................................................................... 23
Figure 5. The distribution of delivery beds in different types of unit in 2007 .. 25
Figure 6. The distribution of delivery beds by type of unit and geographical
area (SHA) ............................................................................................. 26
Figure 7. Delivery beds in relation to women delivered ............................. 27
Figure 8. Women delivered per bed by geographical area (SHA) in year to 31
March 2007 ............................................................................................. 28
Figure 9. Maternity workforce: proportions of midwives and maternity support
workers by band in 2007. .......................................................................... 34
Figure 10. Activities impacting on intrapartum care that MSWs undertake or
for which they provide assistance as reported in 2007 .................................. 37
Figure 11. Vacancy rates for maternity and neonatal units in different
geographical areas (SHAs) as of 31 March 2007 ........................................... 46
Figure 12. Configuration of maternity units in 2010 within trusts by
geographical area (SHA) ........................................................................... 51
© Queen’s Printer and Controller of HMSO 2011. This work was produced by the
Birthplace in England research programme et al. under the terms of a commissioning
contract issued by the Secretary of State for Health.
Project 08/1604/140 7
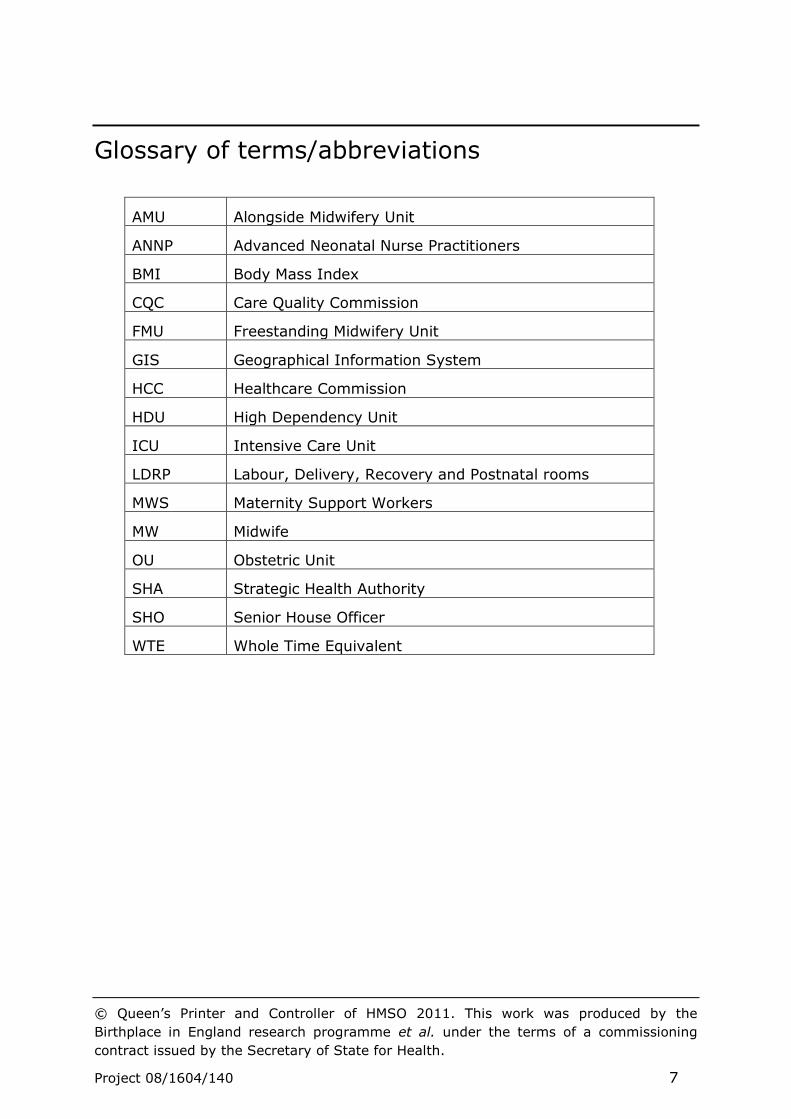
Glossary of terms/abbreviations
AMU Alongside Midwifery Unit
ANNP Advanced Neonatal Nurse Practitioners
BMI Body Mass Index
CQC Care Quality Commission
FMU Freestanding Midwifery Unit
GIS Geographical Information System
HCC Healthcare Commission
HDU High Dependency Unit
ICU Intensive Care Unit
LDRP Labour, Delivery, Recovery and Postnatal rooms
MWS Maternity Support Workers
MW Midwife
OU Obstetric Unit
SHA Strategic Health Authority
SHO Senior House Officer
WTE Whole Time Equivalent
© Queen’s Printer and Controller of HMSO 2011. This work was produced by the
Birthplace in England research programme et al. under the terms of a commissioning
contract issued by the Secretary of State for Health.
Project 08/1604/140 8
Acknowledgements
Mapping working group
Membership of the working group was as follows: Alison Macfarlane, Neil
Marlow, Chris McCourt, Mary Newburn, David Puddicombe, Maggie
Redshaw, Rachel Rowe, Jane Sandall, Liz Schroeder, Louise Silverton and
Julia Sonander.
Contributions
All the authors contributed to the design of the survey and provided critical
comments on the draft report. Maggie Redshaw was responsible for the
design and management of the 2010 survey, analysis of both data sets and
drafting the report on which the authors commented.
Julia Sonander and Bill Alexander were responsible for the overall design
and management of the 2007 survey on behalf of the Healthcare
Commission (now Care Quality Commission). David Puddicombe used GIS
for geographical mapping of the maternity units and Chris Hockley carried
out initial data cleaning.
© Queen’s Printer and Controller of HMSO 2011. This work was produced by the
Birthplace in England research programme et al. under the terms of a commissioning
contract issued by the Secretary of State for Health.
Project 08/1604/140 9
Executive Summary
Background
Contemporary maternity services in England aim to provide high quality,
individualised care for all women that is underpinned by effective
organisation. A wide range of policy and resource issues can affect the way
that services are planned, organised and delivered.
The Birthplace in England research programme has taken place in a context
marked by a rising birth rate, changing demographics of the child-bearing
population, shifting patterns of migration and organisational change. At the
time the Birthplace programme was initiated, there was little reliable
evidence about the nature, geographical location, distribution of midwifery
units and their relationship to obstetric and home birth services. Detailed
evidence was also lacking about staffing and capacity in all types of
maternity unit.
Aims
The primary research question for this component study was ‘How is
maternity care organised?’ In other words how is maternity care
configured, who provides the care and where is it provided? The descriptive
data collected and used in answering this question aimed to provide a
context for the Birthplace national prospective cohort study, to assist in site
selection for that study and for the case studies component, to contribute to
the economic analysis of the costs of maternity care and to describe
changes in configuration over time.
Methods
Two surveys of trusts and units providing maternity healthcare in England
were conducted.
Data on the organisation of maternity care in 2007 was collected as
part of the maternity care review conducted by the Healthcare
commission in 2007. This was a mandatory survey of all trusts
providing maternity care in England covering all aspects of provision.
Selected variables relating to aspects of intrapartum care services
were used in the present study to describe the configuration and
characteristics of intrapartum care services in 2007.
Selected data capturing changes in configuration of maternity care in
2010 were collected in a follow-up survey carried out by the
Birthplace study team in late 2010.

© Queen’s Printer and Controller of HMSO 2011. This work was produced by the
Birthplace in England research programme et al. under the terms of a commissioning
contract issued by the Secretary of State for Health.
Project 08/1604/140 10
Completion of the 2010 survey by trusts and units was not mandatory.
Results
Main findings were as follows.
Units and configuration
In 2007 data were returned from all 152 trusts providing maternity
care in England (100%). Fewer trusts responded to the 2010 survey
(63%) though these were representative in terms of configuration.
Basic data were available for all trusts in 2010(100%) on numbers
and types of unit and trust configuration.
The configuration of maternity care within trusts changed over the
course of the study: in 2007, two thirds of trusts (66%) contained
only one or more obstetric units and by 2010 the proportion had
decreased to half (49%); in 2007, less than a fifth of trusts contained
at least one AMU and by 2010 the proportion had increased to 35%;
in 2007, 18% of trusts contained an FMU and by 2010 the proportion
was 24%.
By 2010 the overall number of maternity units had increased by
11%, with twice as many AMUs as in 2007 (53 compared with 26).
Based on 2007 data the geographical distribution of maternity units,
particularly OUs and delivery beds reflects the centres of population.
There were marked differences in the numbers of midwife-led units
in different areas of England in 2007: FMUs were most common in
the South West and AMUs were more likely in London and South
Central SHA regions.
Workload
Intrapartum care in an OU was the most common form of provision,
with staff in OUs caring for more than 95% of women giving birth in
hospital in the year ending 31 March 2007 (1% in FMUs and 3% in
AMUs).
Each different type of unit provided intrapartum care for radically
different numbers of women: a median of 192 in FMUs, 613 in AMUs
and 3217 in OUs in 2007.
All types of unit varied in the numbers of women giving birth: over a
quarter of OUs (29%) reported having fewer than 2500 women giving
birth and a similar proportion (26%) delivered more than 4000
women.
© Queen’s Printer and Controller of HMSO 2011. This work was produced by the
Birthplace in England research programme et al. under the terms of a commissioning
contract issued by the Secretary of State for Health.
Project 08/1604/140 11
Based on the 2007 trust data the median proportion of births that
took place at home was 2.5%, including both planned and unplanned
home births.
Capacity, occupancy and eligibility
Data were returned from 262 units in 2007 with 2193 delivery beds
or bed spaces, 6.2% in FMUs, 6% in AMUs and most (88%) in OUs.
There was considerable variation in capacity for care during labour
and birth between and within the types of unit: the medium number
of delivery beds ranged from 2 in FMUs, 5 in AMUs to 10 in OUs.
There was substantial variability in ‘occupancy’ (women giving birth
per delivery bed) within and across all unit types and between
geographical regions.
Eligibility criteria for admission to FMUs and to AMUs were not
consistent for either type of unit.
Staffing
A total of 19,415 whole time equivalent (WTE) midwifery posts were
reported in March 2007 and 5263 WTE maternity support worker
posts.
A total of 3864 WTE medical staff working in obstetrics were reported
in March 2007, almost entirely in OUs: similar proportions were
senior house officers (31%), registrars (30%) and consultants (30%)
and 9% were staff grades or associate specialists.
General practitioner (GP) involvement in intrapartum care was widely
distributed, but at low density with only 12% of maternity units
reporting GP engagement with maternity care (2 FMUs and 30 OUs).
Paediatric or neonatal staff were on-call for the delivery suites or
theatres associated with AMUs and OUs and in 44% of OUs ANNPs
took on this role.
Overall the largest components of the midwifery maternity workforce
were midwives employed at Bands 6 (52%) and 7(21%), followed by
maternity support workers at Band 2 (14%); less than 3% of the
workforce were employed above this level.
Midwifery staffing levels (midwives per 1000 births) varied between
units of the same type and between the different types of unit: levels
were higher in FMUs (median of 35 midwives per 1000 women giving
birth compared with 31 per 1000 in AMUs and OUs); the number of
maternity support staff per 1000 births was also higher in FMUs (23
per thousand women delivered vs. 7 and 8 per 1000 in AMUs and
OUs respectively).
© Queen’s Printer and Controller of HMSO 2011. This work was produced by the
Birthplace in England research programme et al. under the terms of a commissioning
contract issued by the Secretary of State for Health.
Project 08/1604/140 12
Some units did not employ MSWs in 2007: 15% of FMUs, 35% of
AMUs and 2% of OUs did not do so. Of those that did, OUs were most
likely to use them in delivery suite (99%, compared with 79% of
AMUs and 46% of FMUs).
There was considerable variation between OUs in the ratio of
obstetric medical staff per 1000 women delivered per year (median
6.8 per 1000), obstetric consultants (median 2 per 1000) and
obstetric anaesthetist staff (2.5 per 1000).
Intrapartum related services
In 2007 almost all units provided a telephone triage system for early
labour assessment and half reported providing early labour
assessment by a midwife at home, a service most commonly
provided by FMUs (65%) and AMUs (58%) compared with 47% of
OUs.
A large proportion of maternity units of all types had fixed birthing
pools (79%).
Specialist medical services on site that included a 24 hour epidural
service, dedicated obstetric theatres, adult intensive care units and
neonatal units and obstetric high dependency beds were more likely
to be associated with OUs.
Where adult intensive care and neonatal care were not available on-
site, the distance to such a facility varied considerably (median
distance 17 miles).
Gaps in provision
Gaps in provision occur as a consequence of staffing, capacity and
other issues: 4% of midwifery posts and 11% of maternity support
worker posts were reported to be vacant on March 31 2007.
Midwifery vacancy rates varied with geographical area and were
highest in London and lowest in the Yorkshire and Humberside
region.
A total of 39% of maternity units reported closing to admissions on
one or more occasions in the year to 31 March 2007 (32% of FMUs,
35% of AMUs and 39% of OUs); while OUs were more likely to have
closed at all, AMUs and FMUs were more likely to have closed more
often or for longer.
The overall turnover rate of midwifery staff due to resignations and
retirements in the year to 31 March 2007 differed little across the
different types of unit (7% FMUs, 8% AMUs and 7% OUs); individual
unit turnover which varied from 0-40% was not related to size of OU
© Queen’s Printer and Controller of HMSO 2011. This work was produced by the
Birthplace in England research programme et al. under the terms of a commissioning
contract issued by the Secretary of State for Health.
Project 08/1604/140 13
or FMU unit as reflected in the numbers of women delivered, though
an association was indicated for AMUs.
In 2007 the proportion of midwives aged 50 years or more was 21%
(26% in FMUs, 22% in OUs and 19% in AMUs).
Recent and future changes in service provision
In comparison with 2007, by 2010 over three quarters of trusts had
increased their midwifery establishments (77%), increased the
numbers of consultant obstetricians (80%) and obstetric cover
(77%).
By 2010 a third or more of trusts had increased the overall number of
delivery units (36%), delivery bed capacity (44%) and paediatric
cover (32%).
In 2010 substantial proportions of trusts were planning yet further
increases in the number of delivery units (54%), delivery bed
capacity (57%), the midwifery establishments set (66%), the
numbers of consultant obstetricians (64%) and obstetric cover
(58%).
Conclusions
The current organisation of maternity care reflects a wide variety of
influences and it appears that trusts have to some extent developed
different solutions and strategies in providing maternity care. Population
density and complexity of need may have driven some of the specialist
services, especially those based in cities and centres of population.
However, it is unlikely that the care needs of mothers and babies vary to
the extent that services do, particularly those at low risk of complications.
The variation in all the aspects of maternity care service delivery and
organisation reported goes beyond such differences and appears to reflect
inequalities in provision.
Despite the multiple influences at work, there are some discernible patterns
in the shifting picture of provision. The changing nature of specialist medical
training has affected the way that maternity care is organised as a whole,
but particularly in OUs and AMUs. The rising birth rate and increased acuity
is making demands on the skill base of the health professionals involved
and on the capacity of all units as reflected in staffing levels, beds, rooms
and specialist facilities that include theatre and high dependency care. Many
trusts have responded to these pressures and they are continuing to try to
find solutions in the way that care is organised and configured that address
the needs of the populations they serve in the different areas of England.
While the evidence and findings presented create a national picture,
perhaps more significantly, the variations described can be used as drivers
for change and quality improvement both locally and nationally. Policy
© Queen’s Printer and Controller of HMSO 2011. This work was produced by the
Birthplace in England research programme et al. under the terms of a commissioning
contract issued by the Secretary of State for Health.
Project 08/1604/140 14
makers, commissioners, managers and maternity staff in trusts and units
have evidence with which to make comparisons and consider in reviewing
their own services while planning future maternity care provision.
Further research could include modelling of provision using the data set
employed for the mapping descriptive analyses and should include
exploration of the effects of impact of the changing demographic structure,
need and expectations of the child-bearing population.
Monitoring the changes that take place in services is critical in informing
future planning and evaluating what is currently in place. Thus the collection
of detailed information about outcomes for women and the way that trusts
and units provide maternity care is essential, particularly in the context of
the ways in which the Birthplace prospective component study research and
related findings may affect configuration and practice more broadly.
Specifically in the changing environment of maternity care, further research
is needed that is adequately evidence based on the development of
validated tools for matching both medical and midwifery staffing to need on
a shift by shift basis and overall.
© Queen’s Printer and Controller of HMSO 2011. This work was produced by the
Birthplace in England research programme et al. under the terms of a commissioning
contract issued by the Secretary of State for Health.
Project 08/1604/140 15
1 Introduction
Modern maternity services aim to provide high quality, individualised care,
underpinned by the way that care is organised nationally and locally.1, 2
Policy implementation and resource issues of diverse kinds may affect the
way that services are delivered for individual women and for different
populations.3 Resources, particularly staffing, are recognised as critical
aspects of maternity care provision.4-7
The Birthplace in England research programme has taken place against a
back drop that includes a rising birth rate, changing patterns of migration
and organisational change in terms of commissioning and the development
of maternity networks. Maternity care, like other areas of healthcare, has to
deliver services to women and babies who are at low risk of complications
and those about whom there may be long-lasting, developing or unexpected
concerns. It has to be provided in large centres of population and rural
environments and in areas with variable community and individual level
resources.
1.1 The research question
The primary research question for this part of the programme was ‘How is
maternity care organised?’ In other words, how is maternity care
configured, who provides the care, and where is it provided? The descriptive
data collected and used in answering this question aimed to provide a
context for the Birthplace national prospective cohort study, to assist in site
selection for that study and for the case studies component, to contribute to
the economic analysis of the costs of maternity care and to describe
changes in configuration over time.
© Queen’s Printer and Controller of HMSO 2011. This work was produced by the
Birthplace in England research programme et al. under the terms of a commissioning
contract issued by the Secretary of State for Health.
Project 08/1604/140 16
2 Methods
As a contextual component, it was planned to collect data on the
organisation of maternity care by surveying all trusts and units providing
maternity care in England in 2007. At the same time the Healthcare
Commission (HCC) (now Care Quality Commission) planned to undertake a
review of maternity care of which a similar organisational survey of trusts
was a key element.3 In order to avoid duplication of effort and to minimise
the burden of data collection on trusts it was decided to combine the
Birthplace and HCC surveys and run these as one. The survey instrument
was developed by a mapping working group involving Birthplace co-
investigators, researchers and HCC staff members. The HCC set up and
managed the 2007 survey. A follow-up postal survey was planned to take
place at the end of the Birthplace programme to document changes in
configuration and provision.
2.1 Data collection
2.1.1 2007 survey
Trusts and units were given information about the review in advance of the
2007 survey. A paper copy of the form was available to assist with data
collection prior to online entry and return with information about the joint
NPEU and HCC working. Online explanations about data items were
available and a helpline was provided to respond directly to queries from
trust and unit staff.
From May 2007 trust and unit data could be entered and saved.
Participation was mandatory for all trusts providing maternity care in
England with a completion date in October 2007 for final data return.
The survey was divided into two sections: one for the trust and the other to
be completed by each of the units in the trust. Leads within each trust were
responsible for passing on requests for information and enabling unit leads
to respond.
In the 2007 survey trust and unit statistics on most aspects of care were
requested for the year to 31 March 2007. Other numerical data, such as
those relating to staffing establishments, were requested as of 31 March
2007. The data items requested covered many aspects of organisation and
policy. Those of relevance to Birthplace included midwifery and medical
staffing, numbers of women delivered, numbers of births, planned and
unplanned home births, eligibility criteria for births planned out of obstetric
units, the rooms and beds available, and the location and provision of
specialist services such as high dependency or intensive care for mothers
and babies. Data were also collected on recent and planned changes to
© Queen’s Printer and Controller of HMSO 2011. This work was produced by the
Birthplace in England research programme et al. under the terms of a commissioning
contract issued by the Secretary of State for Health.
Project 08/1604/140 17
capacity and staffing and the numbers of the different types of units within
trusts. Staffing data were largely requested in Whole Time Equivalents
(WTEs) for which budgets and funding were in place. Minimal data cleaning
was carried out, with cross checks between trust and unit data on staffing
numbers and women delivered. The annual numerical data presented below
are based on the year to 31 March 2007 unless otherwise specified.
2.1.2 2010 follow-up survey
A second survey was carried out in November-December 2010 by the
Birthplace team at the end of the Birthplace in England research programme
in order to document any changes in configuration and the organisation of
maternity care since 2007.
Separate trust and unit postal questionnaires were sent to Heads of
Midwifery. Unlike the initial survey, participation was optional rather than
mandatory. The survey utilised a sub-set of the previous questions: it
included an overview of changes in maternity care during the previous three
years, further changes planned, staffing numbers and women delivered.
Two email reminders were sent and responses were logged, checked and
entered into a database at the NPEU.
Where questionnaires were not returned, data from the continuously
updated Birthplace in England database were used to provide information
on trust changes, numbers and type of unit.
2.2 Data analysis
The focus for the analysis is largely on data relating to intrapartum
maternity care and items relevant to intrapartum care as agreed by the
Mapping working group. However, data on staffing reflect all areas of
maternity care unless otherwise specified.
The data were collected and entered into an MS Access database and data
checks and analyses were carried out using STATA 10.1 SE and SPSS 15.0.
Frequencies and proportions were calculated. The location information was
used for geographical mapping (MapInfo) with a geographical information
system (GIS). Analysis was carried out by trust, configuration within trust,
type of unit and region as reflected by Strategic Health Authority (SHA).
The three possible types of unit, as defined in the first component of
Birthplace (OU, AMU and FMU, see final report part 2) were listed for
information on the unit section of the survey.
Trusts were asked to provide information about all the units providing
maternity care within the trust and for information to be returned
separately for each unit where intrapartum care was provided. Not all trusts
were able to provide data for all their units on some aspects of functioning
and thus the denominator varies as shown. In six trusts it was unclear the
extent to which AMUs were in operation because it was not possible to

© Queen’s Printer and Controller of HMSO 2011. This work was produced by the
Birthplace in England research programme et al. under the terms of a commissioning
contract issued by the Secretary of State for Health.
Project 08/1604/140 18
disaggregate AMU data from those of the OU on the same site. In these
trusts the data provided combined both OU and AMU women using the trust
services. Some data on staffing were not provided by two FMUs and one
AMU.
© Queen’s Printer and Controller of HMSO 2011. This work was produced by the
Birthplace in England research programme et al. under the terms of a commissioning
contract issued by the Secretary of State for Health.
Project 08/1604/140 19
3 Results
In 2007, data were returned from all 152 trusts providing maternity care in
England (150 acute trusts and 2 primary care trusts) and 262 maternity
units (56 FMUs, 26 AMUs and 180 OUs). By the end of 2010, following trust
mergers the number of trusts providing maternity care in England was 148;
responses were received from 93 trusts (63%). The proportion returned
from trusts within different Strategic Health Authorities (SHAs) was uneven,
with markedly fewer responses from the North East and South East Coast
and relatively greater numbers of responses from the South West and South
Central regions. By supplementing these data with data from the
continuously updated Birthplace in England database, information on
numbers and type of unit and configuration was available for all 148 trusts
in 2010.
3.1 How is intrapartum maternity care provided and where is care available?
Options for care for many women are reflected in the types of maternity
units available within a trust. Although some women move across trust
boundaries for different aspects of their care, most receive antenatal and
labour and birth care in one trust (83%) with little variation by region in this
proportion.8 In practical terms women’s choices may be limited to the local
services available unless they or their babies require more specialist care.
3.1.1 Configuration within trusts
In 2007 the configuration of care within trusts was limited to obstetric units
(OUs) in two thirds of trusts (66%) (Table 1). While many women will have
received intrapartum care led by midwives in these units, the options for
place of birth were either to receive maternity care in an obstetric unit or at
home. However, as previously noted some women’s actual choice may be
broader than this where they can easily access care across boundaries, for
example in big cities. Similar proportions of trusts had at least one FMU
(18%) and at least one AMU (17%). At the time of the initial survey the
number of FMUs in trusts ranged from one to six, but most trusts with an
FMU had just one unit of this kind; few (3%) had all three types of unit.
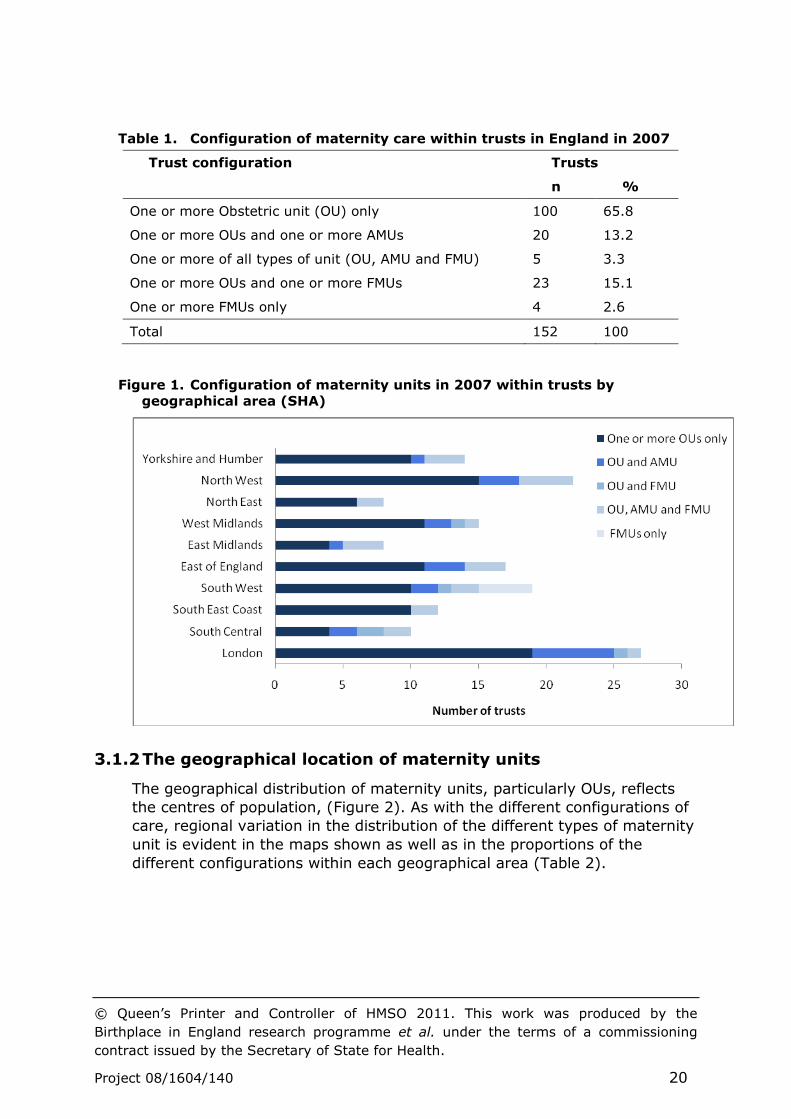
The distribution of trusts with different types of configuration (Figure 1)
indicates marked differences in the availability of midwife-led services
(midwifery units) between trusts in different areas of England (SHAs) in
2007. Trusts with FMUs were more common in the South West and trusts
with AMUs were more likely in London, the North West and the East of
England.
© Queen’s Printer and Controller of HMSO 2011. This work was produced by the
Birthplace in England research programme et al. under the terms of a commissioning
contract issued by the Secretary of State for Health.
Project 08/1604/140 20
Table 1. Configuration of maternity care within trusts in England in 2007
Trust configuration Trusts
n %
One or more Obstetric unit (OU) only 100 65.8
One or more OUs and one or more AMUs 20 13.2
One or more of all types of unit (OU, AMU and FMU) 5 3.3
One or more OUs and one or more FMUs 23 15.1
One or more FMUs only 4 2.6
Total 152 100
Figure 1. Configuration of maternity units in 2007 within trusts by
geographical area (SHA)
3.1.2 The geographical location of maternity units
The geographical distribution of maternity units, particularly OUs, reflects
the centres of population, (Figure 2). As with the different configurations of
care, regional variation in the distribution of the different types of maternity
unit is evident in the maps shown as well as in the proportions of the
different configurations within each geographical area (Table 2).

© Queen’s Printer and Controller of HMSO 2011. This work was produced by the
Birthplace in England research programme et al. under the terms of a commissioning
contract issued by the Secretary of State for Health.
Project 08/1604/140 21
Figure 2. Distribution of FMUs, AMUs and OUs in England by geographical
regions (SHA) in 2007
While obstetric units predominate in all parts of England, there was
variation in the extent to which AMUs and FMUs were part of the service:
AMUs were most common in London and South Central; FMUs were most
common in the South West and two regions apparently had no AMUs at this
time.
Table 2. Types of maternity unit by geographical area of England in 2007
(SHAs)
Area (SHA) Maternity Unit Type Total
OU AMU FMU
n % n % n % n
London 30 76.9 7 17.9 2 5.1 39
South Central 12 46.2 5 19.2 9 4.6 26
South East Coast 16 4.2 0 0.0 3 15.8 19
South West 16 45.7 3 8.6 16 45.7 35
East of England 18 69.2 3 11.5 5 19.2 26
East Midlands 11 73.3 1 6.7 3 20.0 15
West Midlands 18 69.2 3 11.5 5 19.2 26
North East 12 75.0 0 0.0 4 25.0 16
North West 28 80.0 3 8.6 4 11.4 35
Yorkshire and Humber 19 76.0 1 4.0 5 20.0 25
Total 180 68.7 26 9.9 56 21.4 262
© Queen’s Printer and Controller of HMSO 2011. This work was produced by the
Birthplace in England research programme et al. under the terms of a commissioning
contract issued by the Secretary of State for Health.
Project 08/1604/140 22
3.2 Births in maternity units
Units reported on a total of 621,312 women delivering in maternity units
(excluding births at home). Intrapartum maternity care in an OU was by far
the most common form of provision, with staff in OUs caring for more than
95% of the women giving birth in England in the year ending March 31
2007 (1.1% in FMUs and 3.1% in AMUs). However, it must be emphasised
that many of the women giving birth in an OU will have received most of
their care from midwives and more than half will have received midwife only
care during labour and birth.8, 9.
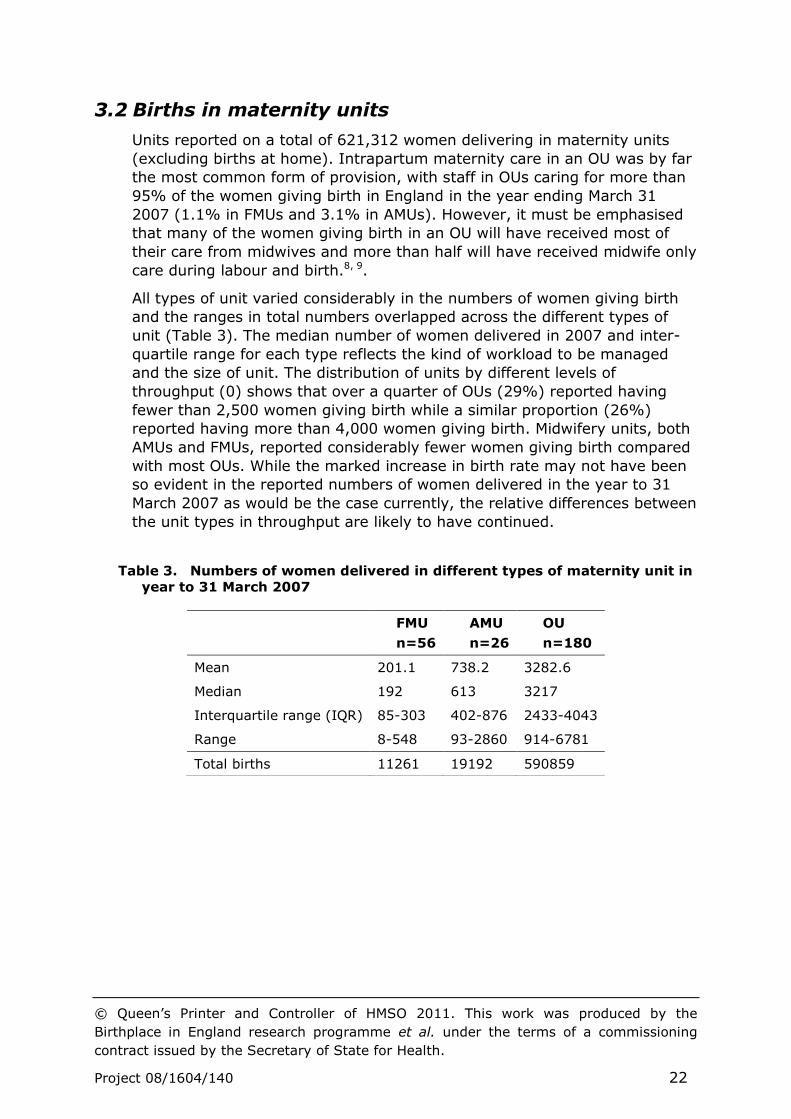
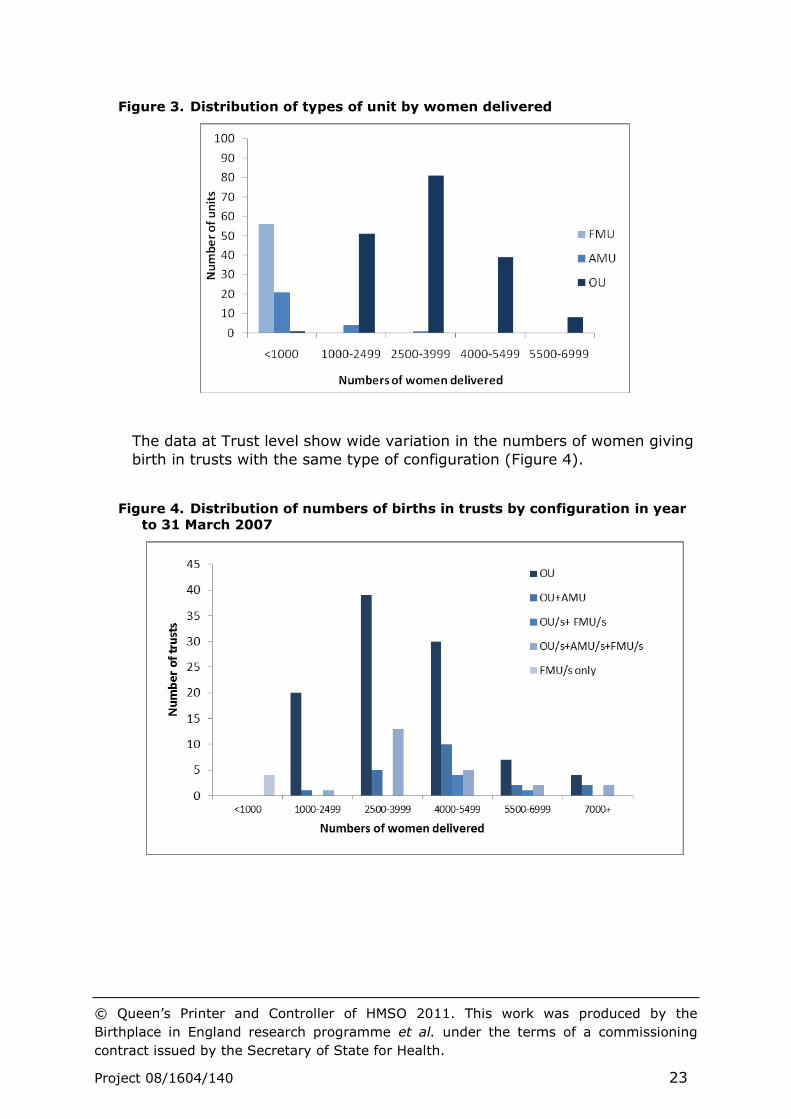
All types of unit varied considerably in the numbers of women giving birth
and the ranges in total numbers overlapped across the different types of
unit (Table 3). The median number of women delivered in 2007 and inter-
quartile range for each type reflects the kind of workload to be managed
and the size of unit. The distribution of units by different levels of
throughput (0) shows that over a quarter of OUs (29%) reported having
fewer than 2,500 women giving birth while a similar proportion (26%)
reported having more than 4,000 women giving birth. Midwifery units, both
AMUs and FMUs, reported considerably fewer women giving birth compared
with most OUs. While the marked increase in birth rate may not have been
so evident in the reported numbers of women delivered in the year to 31
March 2007 as would be the case currently, the relative differences between
the unit types in throughput are likely to have continued.
Table 3. Numbers of women delivered in different types of maternity unit in
year to 31 March 2007
FMU
n=56
AMU
n=26
OU
n=180
Mean 201.1 738.2 3282.6
Median 192 613 3217
Interquartile range (IQR) 85-303 402-876 2433-4043
Range 8-548 93-2860 914-6781
Total births 11261 19192 590859
© Queen’s Printer and Controller of HMSO 2011. This work was produced by the
Birthplace in England research programme et al. under the terms of a commissioning
contract issued by the Secretary of State for Health.
Project 08/1604/140 23
Figure 3. Distribution of types of unit by women delivered
The data at Trust level show wide variation in the numbers of women giving
birth in trusts with the same type of configuration (Figure 4).
Figure 4. Distribution of numbers of births in trusts by configuration in year
to 31 March 2007
© Queen’s Printer and Controller of HMSO 2011. This work was produced by the
Birthplace in England research programme et al. under the terms of a commissioning
contract issued by the Secretary of State for Health.
Project 08/1604/140 24
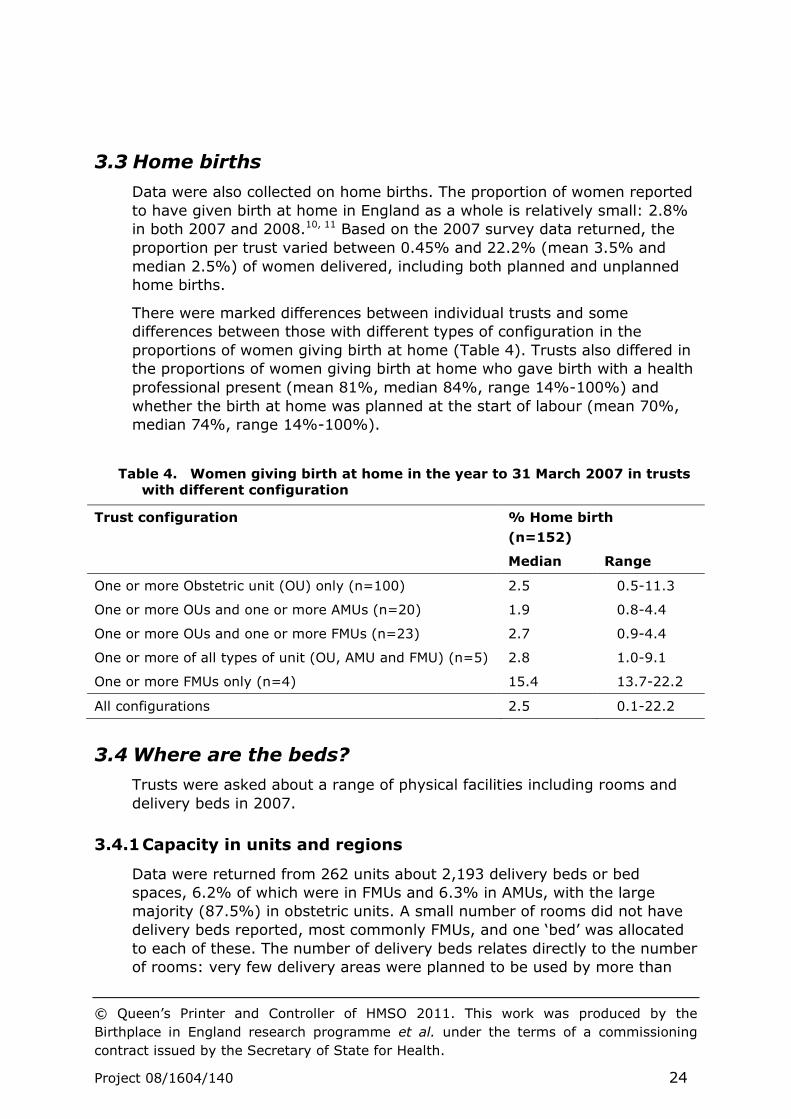
3.3 Home births
Data were also collected on home births. The proportion of women reported
to have given birth at home in England as a whole is relatively small: 2.8%
in both 2007 and 2008.10, 11 Based on the 2007 survey data returned, the
proportion per trust varied between 0.45% and 22.2% (mean 3.5% and
median 2.5%) of women delivered, including both planned and unplanned
home births.
There were marked differences between individual trusts and some
differences between those with different types of configuration in the
proportions of women giving birth at home (Table 4). Trusts also differed in
the proportions of women giving birth at home who gave birth with a health
professional present (mean 81%, median 84%, range 14%-100%) and
whether the birth at home was planned at the start of labour (mean 70%,
median 74%, range 14%-100%).
Table 4. Women giving birth at home in the year to 31 March 2007 in trusts
with different configuration
3.4 Where are the beds?
Trusts were asked about a range of physical facilities including rooms and
delivery beds in 2007.
3.4.1 Capacity in units and regions
Data were returned from 262 units about 2,193 delivery beds or bed
spaces, 6.2% of which were in FMUs and 6.3% in AMUs, with the large
majority (87.5%) in obstetric units. A small number of rooms did not have
delivery beds reported, most commonly FMUs, and one ‘bed’ was allocated
to each of these. The number of delivery beds relates directly to the number
of rooms: very few delivery areas were planned to be used by more than
Trust configuration % Home birth
(n=152)
Median Range
One or more Obstetric unit (OU) only (n=100) 2.5 0.5-11.3
One or more OUs and one or more AMUs (n=20) 1.9 0.8-4.4
One or more OUs and one or more FMUs (n=23) 2.7 0.9-4.4
One or more of all types of unit (OU, AMU and FMU) (n=5) 2.8 1.0-9.1
One or more FMUs only (n=4) 15.4 13.7-22.2
All configurations 2.5 0.1-22.2
© Queen’s Printer and Controller of HMSO 2011. This work was produced by the
Birthplace in England research programme et al. under the terms of a commissioning
contract issued by the Secretary of State for Health.
Project 08/1604/140 25
one woman at the same time. A total of 1.6% of delivery rooms had two
beds.
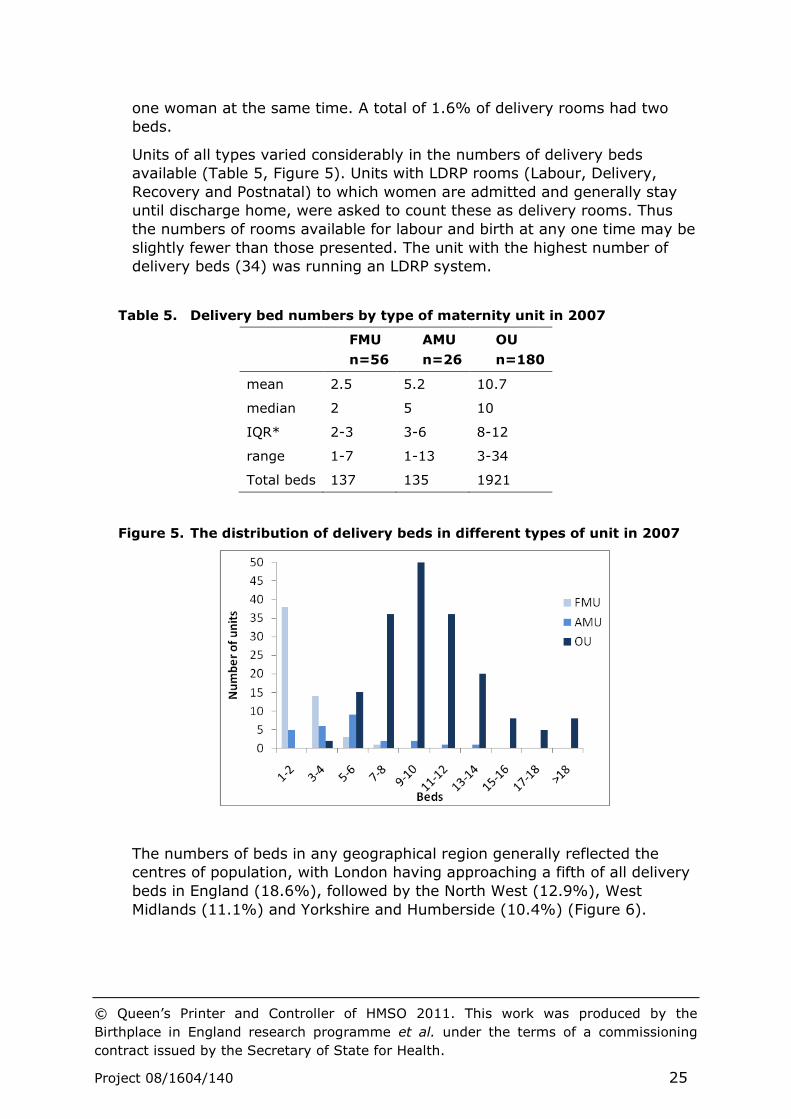
Units of all types varied considerably in the numbers of delivery beds
available (Table 5, Figure 5). Units with LDRP rooms (Labour, Delivery,
Recovery and Postnatal) to which women are admitted and generally stay
until discharge home, were asked to count these as delivery rooms. Thus
the numbers of rooms available for labour and birth at any one time may be
slightly fewer than those presented. The unit with the highest number of
delivery beds (34) was running an LDRP system.
Table 5. Delivery bed numbers by type of maternity unit in 2007
FMU
n=56
AMU
n=26
OU
n=180
mean 2.5 5.2 10.7
median 2 5 10
IQR* 2-3 3-6 8-12
range 1-7 1-13 3-34
Total beds 137 135 1921
Figure 5. The distribution of delivery beds in different types of unit in 2007
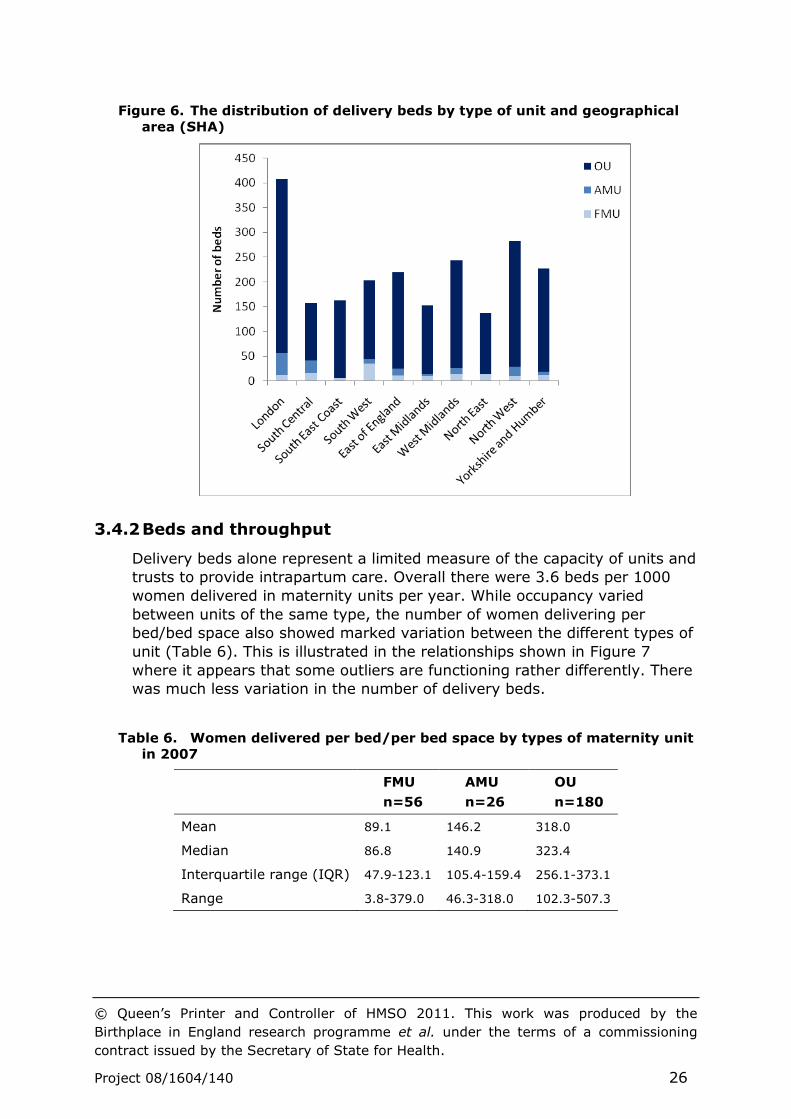
The numbers of beds in any geographical region generally reflected the
centres of population, with London having approaching a fifth of all delivery
beds in England (18.6%), followed by the North West (12.9%), West
Midlands (11.1%) and Yorkshire and Humberside (10.4%) (Figure 6).
© Queen’s Printer and Controller of HMSO 2011. This work was produced by the
Birthplace in England research programme et al. under the terms of a commissioning
contract issued by the Secretary of State for Health.
Project 08/1604/140 26
Figure 6. The distribution of delivery beds by type of unit and geographical
area (SHA)
3.4.2 Beds and throughput
Delivery beds alone represent a limited measure of the capacity of units and
trusts to provide intrapartum care. Overall there were 3.6 beds per 1000
women delivered in maternity units per year. While occupancy varied
between units of the same type, the number of women delivering per
bed/bed space also showed marked variation between the different types of
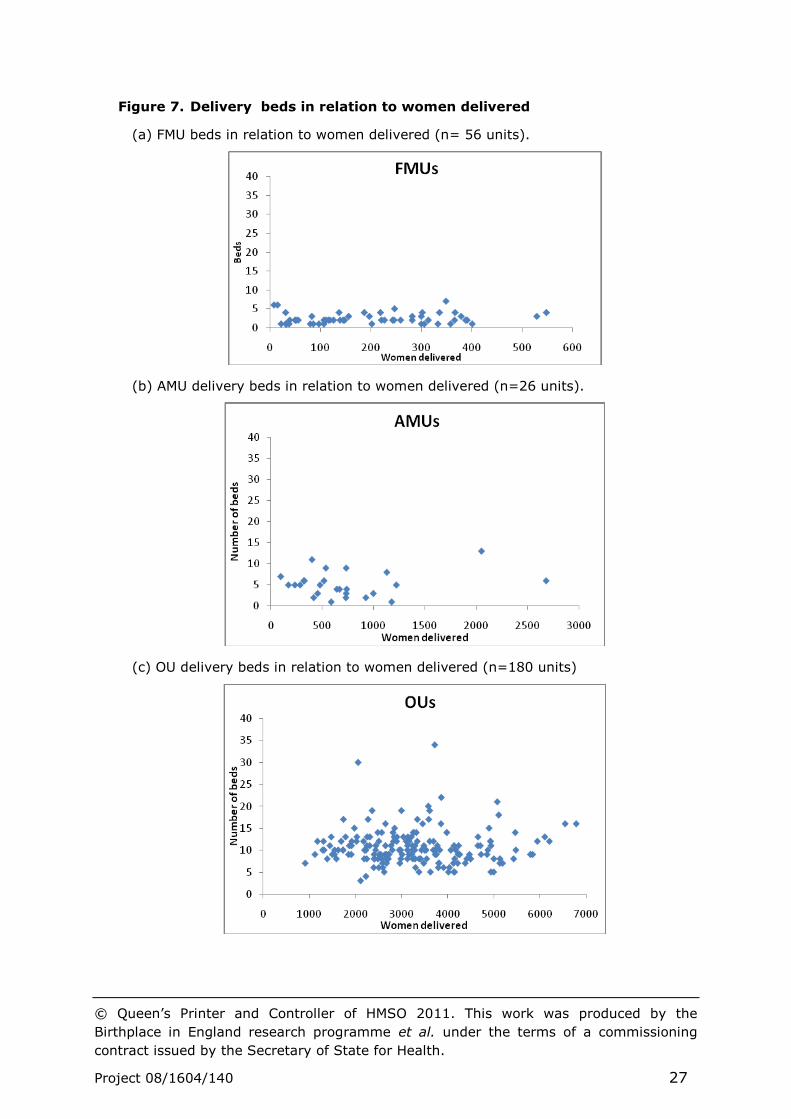
unit (Table 6). This is illustrated in the relationships shown in Figure 7
where it appears that some outliers are functioning rather differently. There
was much less variation in the number of delivery beds.
Table 6. Women delivered per bed/per bed space by types of maternity unit
in 2007
FMU
n=56
AMU
n=26
OU
n=180
Mean 89.1 146.2 318.0
Median 86.8 140.9 323.4
Interquartile range (IQR) 47.9-123.1 105.4-159.4 256.1-373.1
Range 3.8-379.0 46.3-318.0 102.3-507.3
© Queen’s Printer and Controller of HMSO 2011. This work was produced by the
Birthplace in England research programme et al. under the terms of a commissioning
contract issued by the Secretary of State for Health.
Project 08/1604/140 27
Figure 7. Delivery beds in relation to women delivered
(a) FMU beds in relation to women delivered (n= 56 units).
(b) AMU delivery beds in relation to women delivered (n=26 units).
(c) OU delivery beds in relation to women delivered (n=180 units)
© Queen’s Printer and Controller of HMSO 2011. This work was produced by the
Birthplace in England research programme et al. under the terms of a commissioning
contract issued by the Secretary of State for Health.
Project 08/1604/140 28
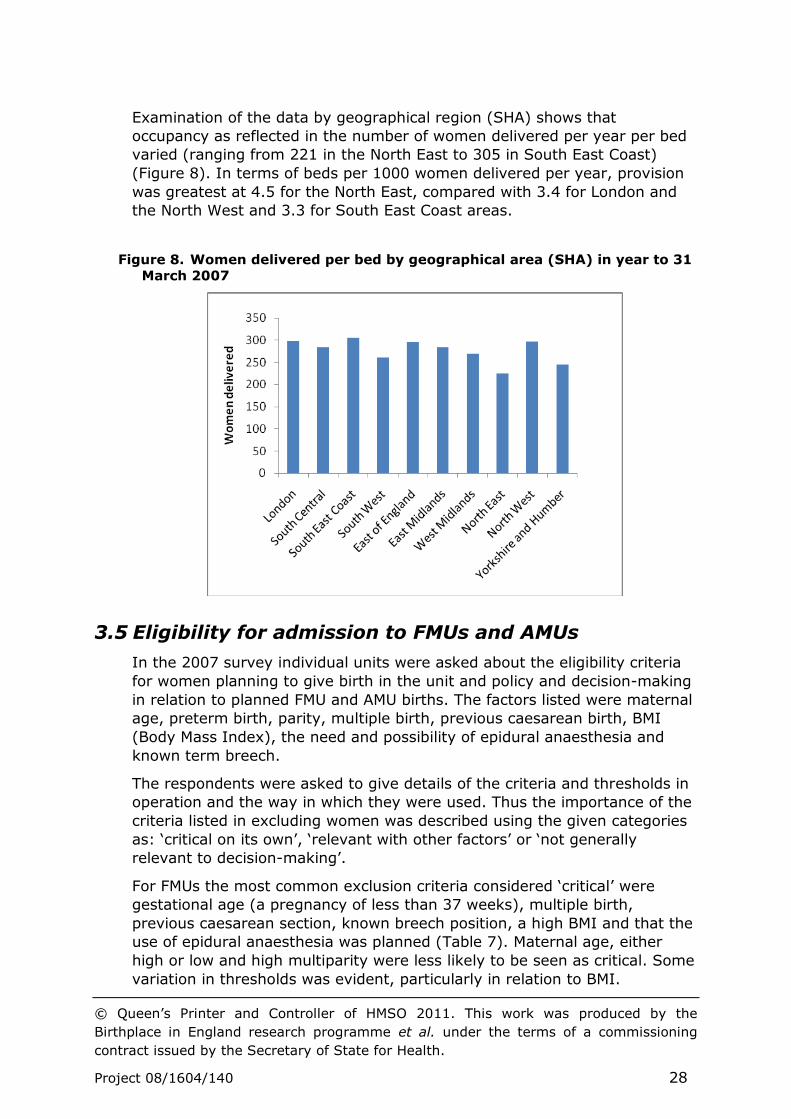
Examination of the data by geographical region (SHA) shows that
occupancy as reflected in the number of women delivered per year per bed
varied (ranging from 221 in the North East to 305 in South East Coast)
(Figure 8). In terms of beds per 1000 women delivered per year, provision
was greatest at 4.5 for the North East, compared with 3.4 for London and
the North West and 3.3 for South East Coast areas.
Figure 8. Women delivered per bed by geographical area (SHA) in year to 31
March 2007
3.5 Eligibility for admission to FMUs and AMUs
In the 2007 survey individual units were asked about the eligibility criteria
for women planning to give birth in the unit and policy and decision-making
in relation to planned FMU and AMU births. The factors listed were maternal
age, preterm birth, parity, multiple birth, previous caesarean birth, BMI
(Body Mass Index), the need and possibility of epidural anaesthesia and
known term breech.
The respondents were asked to give details of the criteria and thresholds in
operation and the way in which they were used. Thus the importance of the
criteria listed in excluding women was described using the given categories
as: ‘critical on its own’, ‘relevant with other factors’ or ‘not generally
relevant to decision-making’.
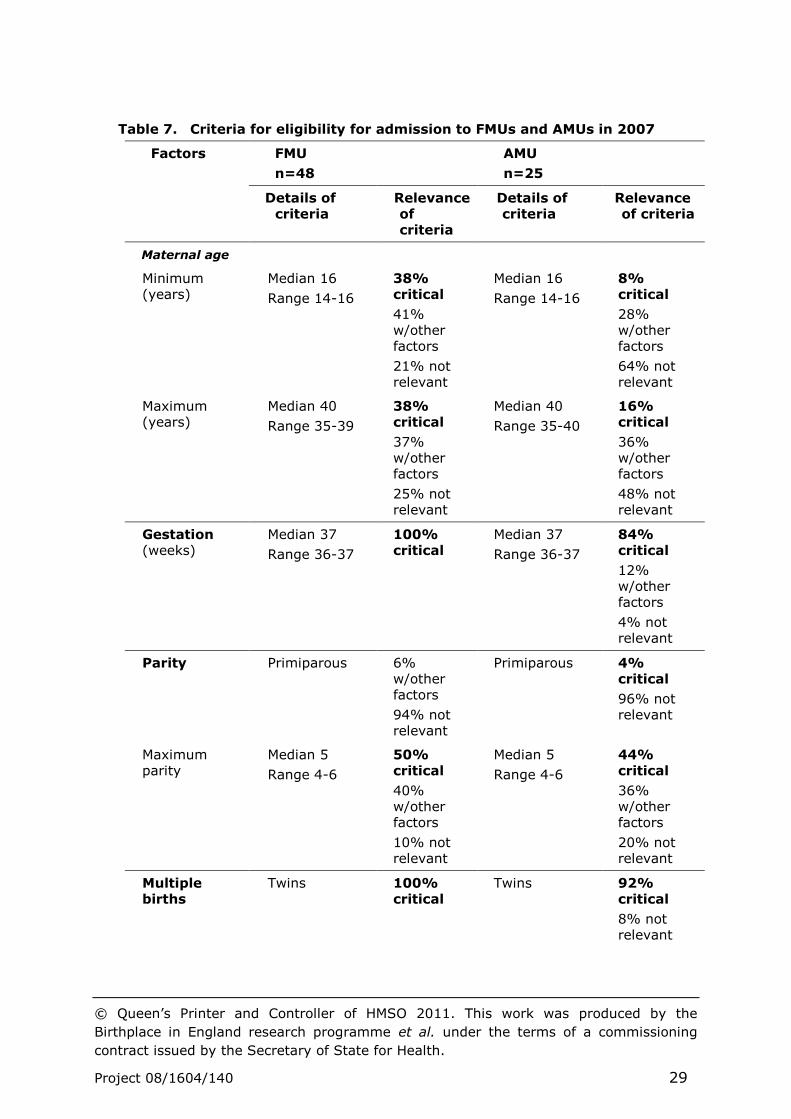
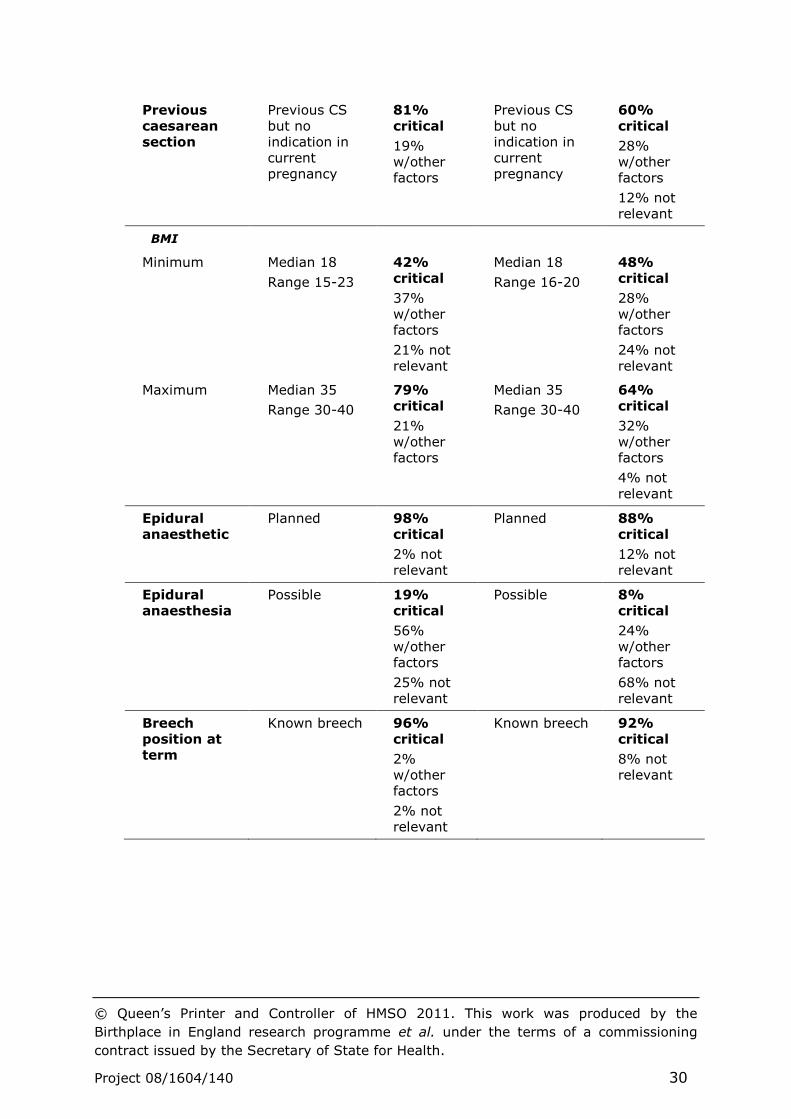
For FMUs the most common exclusion criteria considered ‘critical’ were
gestational age (a pregnancy of less than 37 weeks), multiple birth,
previous caesarean section, known breech position, a high BMI and that the
use of epidural anaesthesia was planned (Table 7). Maternal age, either
high or low and high multiparity were less likely to be seen as critical. Some
variation in thresholds was evident, particularly in relation to BMI.
© Queen’s Printer and Controller of HMSO 2011. This work was produced by the
Birthplace in England research programme et al. under the terms of a commissioning
contract issued by the Secretary of State for Health.
Project 08/1604/140 29
Table 7. Criteria for eligibility for admission to FMUs and AMUs in 2007
Factors FMU
n=48
AMU
n=25
Details of criteria
Relevance of criteria
Details of criteria
Relevance of criteria
Maternal age
Minimum (years)
Median 16
Range 14-16
38% critical
41% w/other factors
21% not relevant
Median 16
Range 14-16
8% critical
28% w/other factors
64% not relevant
Maximum (years)
Median 40
Range 35-39
38% critical
37% w/other factors
25% not relevant
Median 40
Range 35-40
16% critical
36% w/other factors
48% not relevant
Gestation (weeks)
Median 37
Range 36-37
100% critical
Median 37
Range 36-37
84% critical
12% w/other factors
4% not relevant
Parity Primiparous 6% w/other factors
94% not relevant
Primiparous 4% critical
96% not relevant
Maximum parity
Median 5
Range 4-6
50% critical
40% w/other factors
10% not relevant
Median 5
Range 4-6
44% critical
36% w/other factors
20% not relevant
Multiple births
Twins 100% critical
Twins 92% critical
8% not relevant
© Queen’s Printer and Controller of HMSO 2011. This work was produced by the
Birthplace in England research programme et al. under the terms of a commissioning
contract issued by the Secretary of State for Health.
Project 08/1604/140 30
Previous caesarean section
Previous CS but no indication in current pregnancy
81% critical
19% w/other factors
Previous CS but no indication in current pregnancy
60% critical
28% w/other factors
12% not relevant
BMI
Minimum Median 18
Range 15-23
42% critical
37% w/other factors
21% not relevant
Median 18
Range 16-20
48% critical
28% w/other factors
24% not relevant
Maximum Median 35
Range 30-40
79% critical
21% w/other factors
Median 35
Range 30-40
64% critical
32% w/other factors
4% not relevant
Epidural anaesthetic
Planned 98% critical
2% not relevant
Planned 88% critical
12% not relevant
Epidural anaesthesia
Possible 19% critical
56% w/other factors
25% not relevant
Possible 8% critical
24% w/other factors
68% not relevant
Breech position at term
Known breech 96% critical
2% w/other factors
2% not relevant
Known breech 92% critical
8% not relevant
© Queen’s Printer and Controller of HMSO 2011. This work was produced by the
Birthplace in England research programme et al. under the terms of a commissioning
contract issued by the Secretary of State for Health.
Project 08/1604/140 31
For AMUs the most common exclusion criteria were multiple birth,
anticipated preterm birth, the planned use of epidural anaesthesia and
known breech position. Similar variation in thresholds to those indicated as
in use for FMUs was evident. However, the factors listed were less likely to
be considered critical in the decision-making about place of birth, with a
larger proportion of units reporting that a specific factor would be
considered together with others or was not relevant.
The individual units were also asked how eligibility for giving birth in the
units was documented. Eight FMUs and one AMU, in trusts, of different
configurations did not provide any information about eligibility. Just under
half of FMUs (44%) reported that there was a written protocol and the
remainder (56%) had a written guideline. Less than a third of AMUs had a
written protocol (28%) and the majority (72%) reported having a written
guideline.
3.6 Staffing in maternity care
Maternity care is provided by midwives, and medical staff working in
obstetrics, supported by other staff groups that include anaesthetists,
maternity support workers (MSWs), general practitioners (GPs), managers
and administrators and data were requested from units on all these groups.
The titles for maternity support workers employed in maternity care about
whom trusts and units reported varied and could include ‘health care
support workers’, ‘health care assistants’, ‘midwifery assistants’,
‘auxiliaries’, ‘maternity assistants’, and ‘nursery nurses’ working in
postnatal care. 12
3.6.1 Midwifery and maternity support worker staff
A total of 19,415 whole time equivalent (WTE) midwifery staff
establishment posts and 18,670 WTE midwives in post were reported from
all the maternity units in England as of 31 March 2007 (excluding one trust
whose data were not returned following amalgamation after this date). Data
from the NHS national staffing survey for 2007 indicated 19,298 full-time
equivalent midwives working in the NHS 13 which compares well with the
establishment posts reported in the HCC/NPEU 2007 survey. A small
proportion of units (12%) employed staff above the establishment level,
totalling 83 WTE posts in addition, a median of 1.8 posts in those doing so.
This mapping report largely utilises data on WTEs working in all areas of
maternity care unless otherwise stated. As many midwives and maternity
support workers work part-time, many more individual staff from both
groups are employed in maternity care and this aspect is not reflected in
the data presented.
Over 90% of midwives and maternity support staff working in maternity
services in England provided care based in OUs. Only small proportions of
© Queen’s Printer and Controller of HMSO 2011. This work was produced by the
Birthplace in England research programme et al. under the terms of a commissioning
contract issued by the Secretary of State for Health.
Project 08/1604/140 32
midwives and MSWs worked in AMUs (3.3% and 2.8%) and FMUs (3.9%
and 5.0%).
Midwifery establishments varied considerably across all three types of unit
as did the numbers of WTE midwives in post. MSW establishments also
varied within and between types of unit (Table 8).
Trusts were asked about their use of the Birthrate+ planning tool .14 A total
of 65% of units had used this to calculate midwifery staffing requirements
(78% of OUs, 19% of AMUs and 41% of FMUs). While a total of 11% of OUs
had more midwifery staff than were estimated as required, more than half
the OUs (63%) were estimated to require 10 or more WTE staff in addition
to those for which they were currently funded. Any mismatch was less
marked for the other types of unit.
© Queen’s Printer and Controller of HMSO 2011. This work was produced by the
Birthplace in England research programme et al. under the terms of a commissioning
contract issued by the Secretary of State for Health.
Project 08/1604/140 33
Table 8. Midwifery and maternity support worker establishments and in
post (WTEs) in 2007
3.6.2 Midwifery staffing and throughput
Midwives provide most of the direct care that women experience during
labour and birth and this aspect of provision is central in enabling an
effective service to function. The recommended level of midwifery staffing is
36 midwives per thousand births.5, 15 Based on establishment data from 210
maternity units (53 FMUs, 24 AMUs and 133 OUs) the overall number of
midwives per thousand women delivered was 32 in 2007. However, this
varied by type of unit, with a median of 35 midwives per thousand in FMUs
and 31 per thousand in AMUs and OUs. For MSWs, similarly calculated,
overall the numbers reported give a ratio of 9 MSWs per thousand women
delivered, and a median of 23 per thousand in FMUs, 7 per thousand in
AMUs and 8 per thousand women delivered in OUs.
Midwives
Establishment
Midwives in
post
MSW
Establishment
MSW in post
FMUs (n=54) (n=47)
Mean 14.4 13.6 4.8 4.4
Median 11.0 10.5 6.1 5.0
Interquartile range (IQR)
7.5-20.1 6.9-19.2 3.7-6.1 3.1-6.0
Range 1.0-38.1 1.0-6.1 0.0-12.8 0.0-13.0
Total 778.9 733.2 256.7 239.0
AMUs (n=25) (n=20)
Mean 26.2 24.7 6.0 5.3
Median 18.6 17.0 5.0 3.6
Interquartile range (IQR)
9.0-33.6 9.0-33.5 1.0-7.0 1.0-6.9
Range 4.0-87.7 4.0-80.2 0.0-36.7 0.00-35.7
Total 655.5 618.5 149.2 132.6
OUs (n=180) (n=178)
Mean 100.0 96.2 27.0 24.0
Median 92.7 88.2 24.7 21.2
Interquartile range (IQR)
75.0-120.8 71.8-117.0 8.3-34.0 16.0-30.7
Range 29.6-254.4 25.5-254.6 0.0-91.8 0.0-76.2
Total 17,980.3 17,318.2 4,857.2 4,302.1
© Queen’s Printer and Controller of HMSO 2011. This work was produced by the
Birthplace in England research programme et al. under the terms of a commissioning
contract issued by the Secretary of State for Health.
Project 08/1604/140 34
3.6.3 Skill mix in midwifery staffing
Direct care can be provided by staff with midwifery qualifications and other
staff that are supervised, functioning as Maternity Support Workers
(MSWs), though they may be given a range of different titles. The
workforce in individual units varied with unit type: FMUs employed a
median of 11 midwives and 6 MSWs, AMUs a median of 19 midwives and 5
MSWs and OUs a median of 93 midwives and 25 MSWs (Table 8). While it
seems that the ratio of MWs to MSWs varies across the different types of
unit, with relatively higher numbers of MSWs in FMUs, examination of
individual unit data shows that a total of 13% of reporting units (31 out of
241) did not use MSWs at all (15% of FMUs, 25% of AMUs and 1% of OUs).
The skills, knowledge and experience required in running a maternity unit
and providing appropriate care are diverse and midwives and MSWs are
employed at a range of levels as reflected by the bands at which staff are
employed. A total of 23,954.4 WTE combined midwifery and MSW posts and
details of the bands at which they were employed were reported in the 2007
survey.
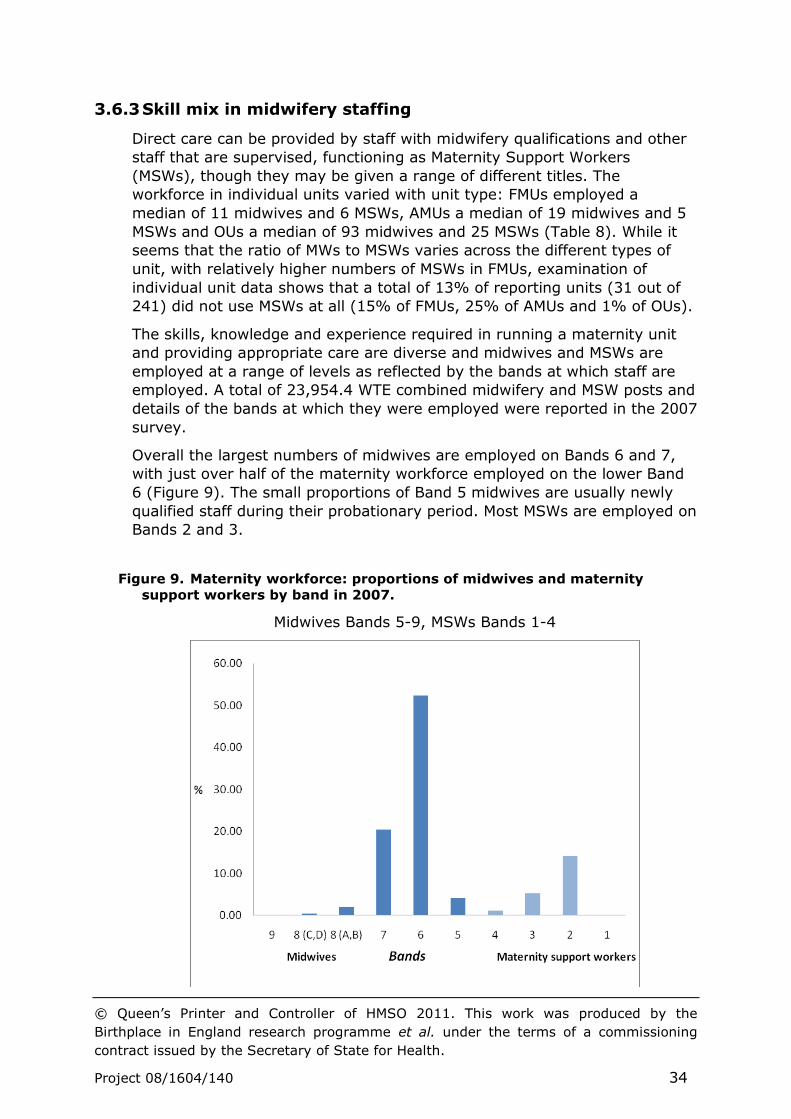
Overall the largest numbers of midwives are employed on Bands 6 and 7,
with just over half of the maternity workforce employed on the lower Band
6 (Figure 9). The small proportions of Band 5 midwives are usually newly
qualified staff during their probationary period. Most MSWs are employed on
Bands 2 and 3.
Figure 9. Maternity workforce: proportions of midwives and maternity
support workers by band in 2007.
Midwives Bands 5-9, MSWs Bands 1-4
© Queen’s Printer and Controller of HMSO 2011. This work was produced by the
Birthplace in England research programme et al. under the terms of a commissioning
contract issued by the Secretary of State for Health.
Project 08/1604/140 35
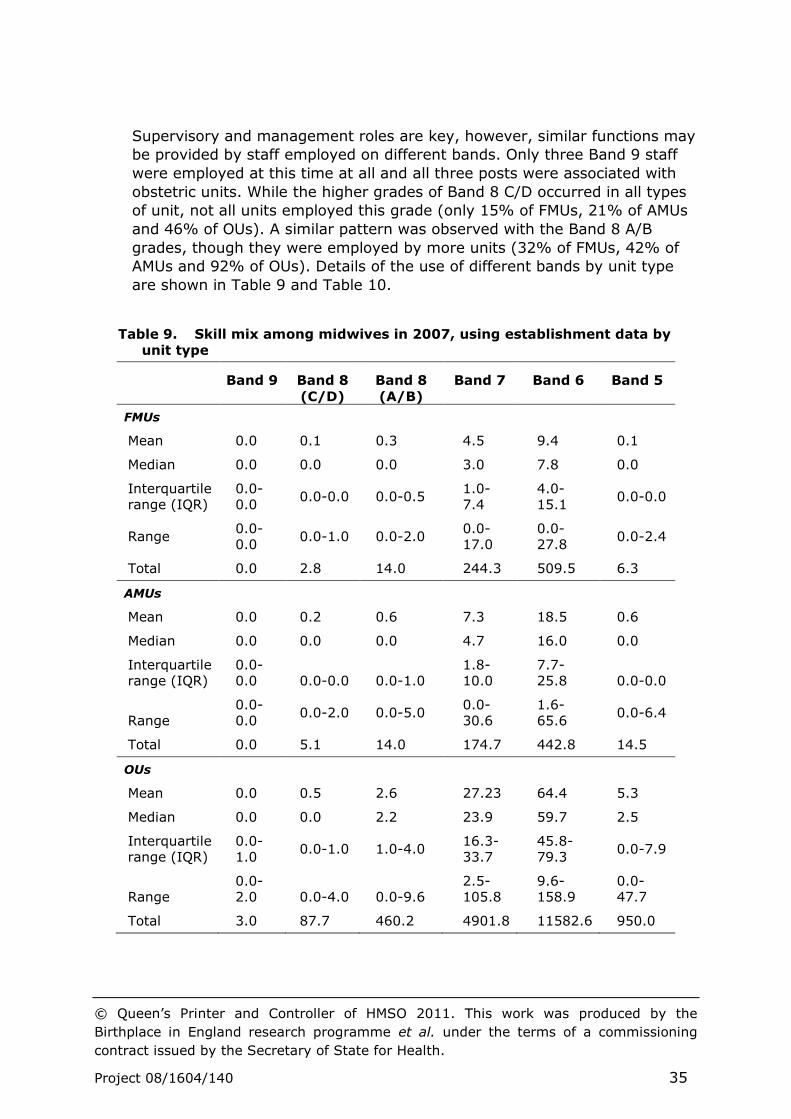
Supervisory and management roles are key, however, similar functions may
be provided by staff employed on different bands. Only three Band 9 staff
were employed at this time at all and all three posts were associated with
obstetric units. While the higher grades of Band 8 C/D occurred in all types
of unit, not all units employed this grade (only 15% of FMUs, 21% of AMUs
and 46% of OUs). A similar pattern was observed with the Band 8 A/B
grades, though they were employed by more units (32% of FMUs, 42% of
AMUs and 92% of OUs). Details of the use of different bands by unit type
are shown in Table 9 and Table 10.
Table 9. Skill mix among midwives in 2007, using establishment data by
unit type
Band 9 Band 8
(C/D)
Band 8
(A/B)
Band 7 Band 6 Band 5
FMUs
Mean 0.0 0.1 0.3 4.5 9.4 0.1
Median 0.0 0.0 0.0 3.0 7.8 0.0
Interquartile range (IQR)
0.0-0.0
0.0-0.0 0.0-0.5 1.0-7.4
4.0-15.1
0.0-0.0
Range 0.0-0.0
0.0-1.0 0.0-2.0 0.0-17.0
0.0-27.8
0.0-2.4
Total 0.0 2.8 14.0 244.3 509.5 6.3
AMUs
Mean 0.0 0.2 0.6 7.3 18.5 0.6
Median 0.0 0.0 0.0 4.7 16.0 0.0
Interquartile range (IQR)
0.0-0.0 0.0-0.0 0.0-1.0
1.8-10.0
7.7-25.8 0.0-0.0
Range 0.0-0.0
0.0-2.0 0.0-5.0 0.0-30.6
1.6-65.6
0.0-6.4
Total 0.0 5.1 14.0 174.7 442.8 14.5
OUs
Mean 0.0 0.5 2.6 27.23 64.4 5.3
Median 0.0 0.0 2.2 23.9 59.7 2.5
Interquartile range (IQR)
0.0-1.0
0.0-1.0 1.0-4.0 16.3-33.7
45.8-79.3
0.0-7.9
Range 0.0-2.0 0.0-4.0 0.0-9.6
2.5-105.8
9.6-158.9
0.0-47.7
Total 3.0 87.7 460.2 4901.8 11582.6 950.0

© Queen’s Printer and Controller of HMSO 2011. This work was produced by the
Birthplace in England research programme et al. under the terms of a commissioning
contract issued by the Secretary of State for Health.
Project 08/1604/140 36
Table 10. Skill mix among maternity support workers in 2007, using
establishment data by unit type
Band 4 Band 3 Band 2 Band 1
FMUs
Mean 0.0 2.1 2.6 0.0
Median 0.0 0.4 0.9 0.0
Interquartile range (IQR)
0.0-0.0 0.0-4.5 0.0-5.2 0.0
Range 0.0-0.8 0.0-6.9 0.0-12.8 0.0-0.0
Total 1.5 113.0 139.8 0.0
AMUs
Mean 0.3 1.2 3.9 0.0
Median 0.0 0.0 3.0 0.0
Interquartile range (IQR)
0.0-0.0 0.0-2.0 0.0-5.0 0.0-0.0
Range 0.00-4.6 0.0-6.0 0.0-18.1 0.0-0.0
Total 6.7 30.8 97.7 0.0
OUs
Mean 1.4 6.2 17.6 0.3
Median 0.0 3.0 17.1 0.0
Interquartile range (IQR)
0.00-1.1 0.0-8.5 11.9-22.8 0.0-0.0
Range 0.0-80.0 0.0-52.0 0.0-62.0 0.0-14.0
Total 251.2 1110.4 3164.6 44.3
Over two-thirds of maternity support workers were employed on Band 2
(69%) and a quarter (25%) at Band 3. Few were employed at Band 4 (5%)
and very small numbers at Band 1 (1%), though at these bands the
employment was almost entirely in OUs.
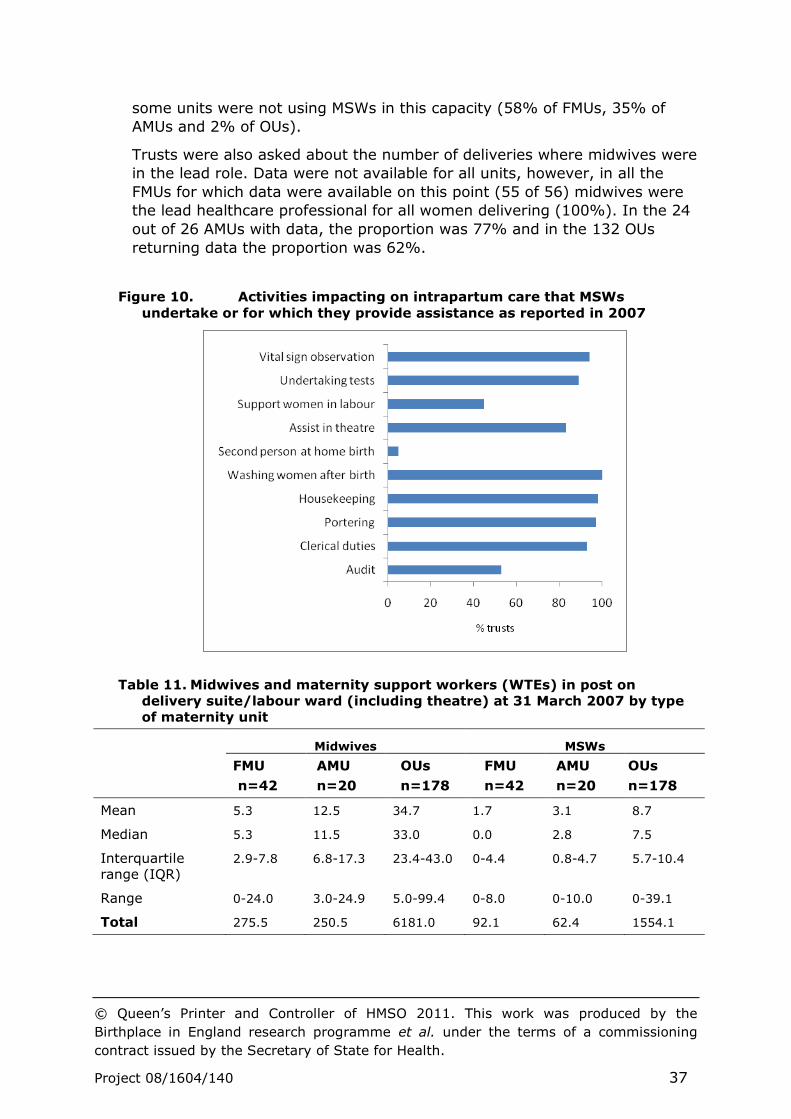
Trusts were asked about the role and about the activities of the maternity
support workers employed. Many trusts reported that MSWs were involved
in clerical and practical support and in some aspects of direct care, with
some assisting in theatre, helping to support women in labour and providing
personal care following birth (Figure 10).
Some data were specifically collected on the numbers of midwives and
MSWs working on delivery suite. A total of 6707 (WTEs) midwives and 1709
(WTEs) MSWs were reported to be currently employed (in post) and
working on delivery suite at the time of the data collection period in 2007
(Table 11). This was an overall ratio of one MSW to 3.9 midwives. However
© Queen’s Printer and Controller of HMSO 2011. This work was produced by the
Birthplace in England research programme et al. under the terms of a commissioning
contract issued by the Secretary of State for Health.
Project 08/1604/140 37
some units were not using MSWs in this capacity (58% of FMUs, 35% of
AMUs and 2% of OUs).
Trusts were also asked about the number of deliveries where midwives were
in the lead role. Data were not available for all units, however, in all the
FMUs for which data were available on this point (55 of 56) midwives were
the lead healthcare professional for all women delivering (100%). In the 24
out of 26 AMUs with data, the proportion was 77% and in the 132 OUs
returning data the proportion was 62%.
Figure 10. Activities impacting on intrapartum care that MSWs
undertake or for which they provide assistance as reported in 2007
Table 11. Midwives and maternity support workers (WTEs) in post on
delivery suite/labour ward (including theatre) at 31 March 2007 by type
of maternity unit
Midwives MSWs
FMU
n=42
AMU
n=20
OUs
n=178
FMU
n=42
AMU
n=20
OUs
n=178
Mean 5.3 12.5 34.7 1.7 3.1 8.7
Median 5.3 11.5 33.0 0.0 2.8 7.5
Interquartile range (IQR)
2.9-7.8 6.8-17.3 23.4-43.0 0-4.4 0.8-4.7 5.7-10.4
Range 0-24.0 3.0-24.9 5.0-99.4 0-8.0 0-10.0 0-39.1
Total 275.5 250.5 6181.0 92.1 62.4 1554.1
© Queen’s Printer and Controller of HMSO 2011. This work was produced by the
Birthplace in England research programme et al. under the terms of a commissioning
contract issued by the Secretary of State for Health.
Project 08/1604/140 38
3.6.4 Non-clinical staff
Units were asked to report on non-clinical management and administrative
or clerical support. All OUs reported administrative support and half of OUs
(54%) reported, in addition, non-clinical management posts. Few FMUs and
AMUs reported such posts, though approximately half (56% and 48%
respectively) reported administrative and clerical support posts.
3.6.5 Medical staff associated with AMUs and FMUs
Only one unit reported being an AMU and having a number of consultant
and other medical staff working in maternity care. All the other AMUs (bar
one which did not provide information) did not have medical staff employed
or working in maternity care. All but three FMUs reported no medical staff
working in maternity care. The three FMUs reporting the presence of
medical staff appeared to be units with minimal cover at consultant and
associate specialist grades and cover may have been provided by
gynaecology medical staff. No anaesthetic consultants or registrars were
reported as working in maternity care in either AMUs or FMUs.
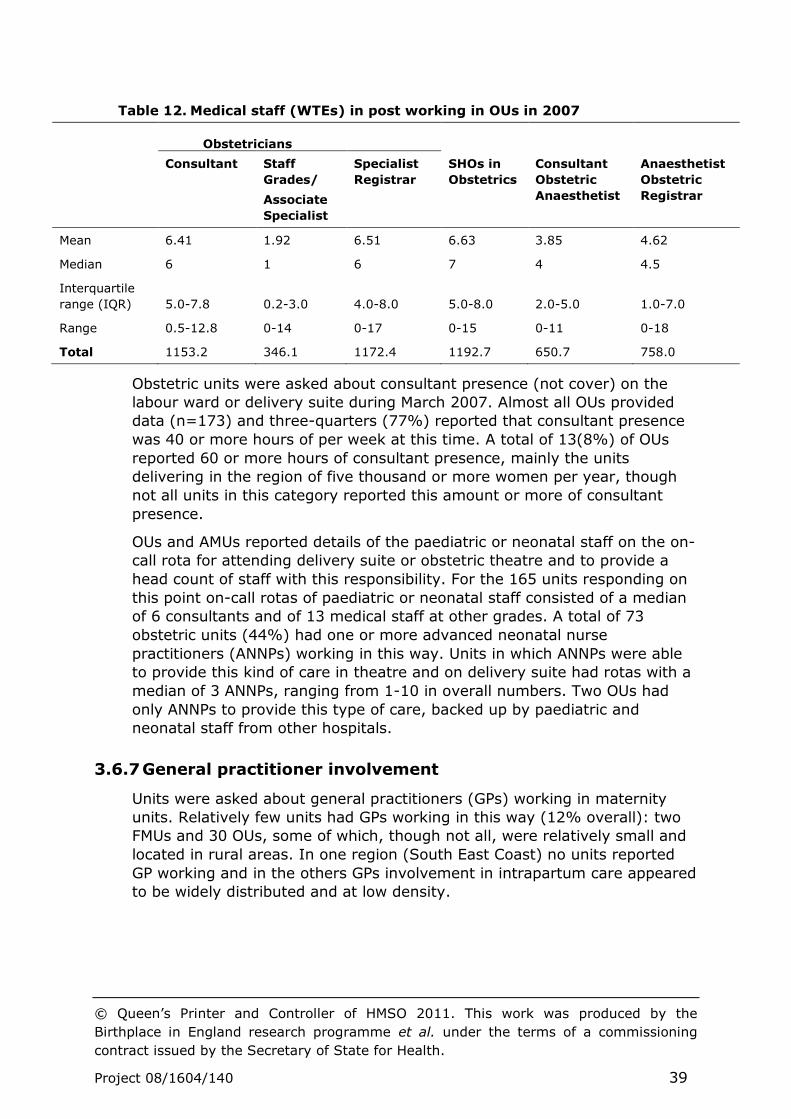
3.6.6 Medical staff employed in OUs
Because of the complex and cross-specialty way in which medical staffing is
organised and the way in which trainees contribute, obstetric units were
asked to return only limited data on medical staff working in maternity care.
Specifically, they reported on the numbers (WTEs) in the different obstetric
staff groups, apportioning when staff worked in both obstetrics and
gynaecology and including locums (Table 12). It was not possible to make
checks on data returned and effective apportioning for obstetrics, thus the
WTE numbers of medical staff may have been over-estimated. 5 Data were
returned on 3864 WTE obstetric medical staff. Establishment WTEs were not
requested. At the time of data collection, of the medical staff directly
involved in providing maternity care, including intrapartum care, just under
a third were junior staff in training (31% SHOs) and a similar proportion
(30%) registrars. Consultants provided just under a third of obstetric
staffing (30%), supported by a smaller proportion (9%) of Staff Grades or
Associate Specialists. Some minimal consultant cover was reported for a
small number of sites with only midwifery provision.
The numbers of obstetric medical staff working in OUs per thousand women
delivered per year ranged from 2.4 to 14.8 (median 6.8) and numbers of
obstetric consultants ranged from 0.5 to 4.6 (median 2.0). Obstetric
anaesthetics staff worked in maternity care (median of 2.5 per thousand
women delivered per year) in addition.
© Queen’s Printer and Controller of HMSO 2011. This work was produced by the
Birthplace in England research programme et al. under the terms of a commissioning
contract issued by the Secretary of State for Health.
Project 08/1604/140 39
Table 12. Medical staff (WTEs) in post working in OUs in 2007
Obstetricians
Consultant Staff
Grades/
Associate
Specialist
Specialist
Registrar
SHOs in
Obstetrics
Consultant
Obstetric
Anaesthetist
Anaesthetist
Obstetric
Registrar
Mean 6.41 1.92 6.51 6.63 3.85 4.62
Median 6 1 6 7 4 4.5
Interquartile
range (IQR) 5.0-7.8 0.2-3.0 4.0-8.0 5.0-8.0 2.0-5.0 1.0-7.0
Range 0.5-12.8 0-14 0-17 0-15 0-11 0-18
Total 1153.2 346.1 1172.4 1192.7 650.7 758.0
Obstetric units were asked about consultant presence (not cover) on the
labour ward or delivery suite during March 2007. Almost all OUs provided
data (n=173) and three-quarters (77%) reported that consultant presence
was 40 or more hours of per week at this time. A total of 13(8%) of OUs
reported 60 or more hours of consultant presence, mainly the units
delivering in the region of five thousand or more women per year, though
not all units in this category reported this amount or more of consultant
presence.
OUs and AMUs reported details of the paediatric or neonatal staff on the on-
call rota for attending delivery suite or obstetric theatre and to provide a
head count of staff with this responsibility. For the 165 units responding on
this point on-call rotas of paediatric or neonatal staff consisted of a median
of 6 consultants and of 13 medical staff at other grades. A total of 73
obstetric units (44%) had one or more advanced neonatal nurse
practitioners (ANNPs) working in this way. Units in which ANNPs were able
to provide this kind of care in theatre and on delivery suite had rotas with a
median of 3 ANNPs, ranging from 1-10 in overall numbers. Two OUs had
only ANNPs to provide this type of care, backed up by paediatric and
neonatal staff from other hospitals.
3.6.7 General practitioner involvement
Units were asked about general practitioners (GPs) working in maternity
units. Relatively few units had GPs working in this way (12% overall): two
FMUs and 30 OUs, some of which, though not all, were relatively small and
located in rural areas. In one region (South East Coast) no units reported
GP working and in the others GPs involvement in intrapartum care appeared
to be widely distributed and at low density.
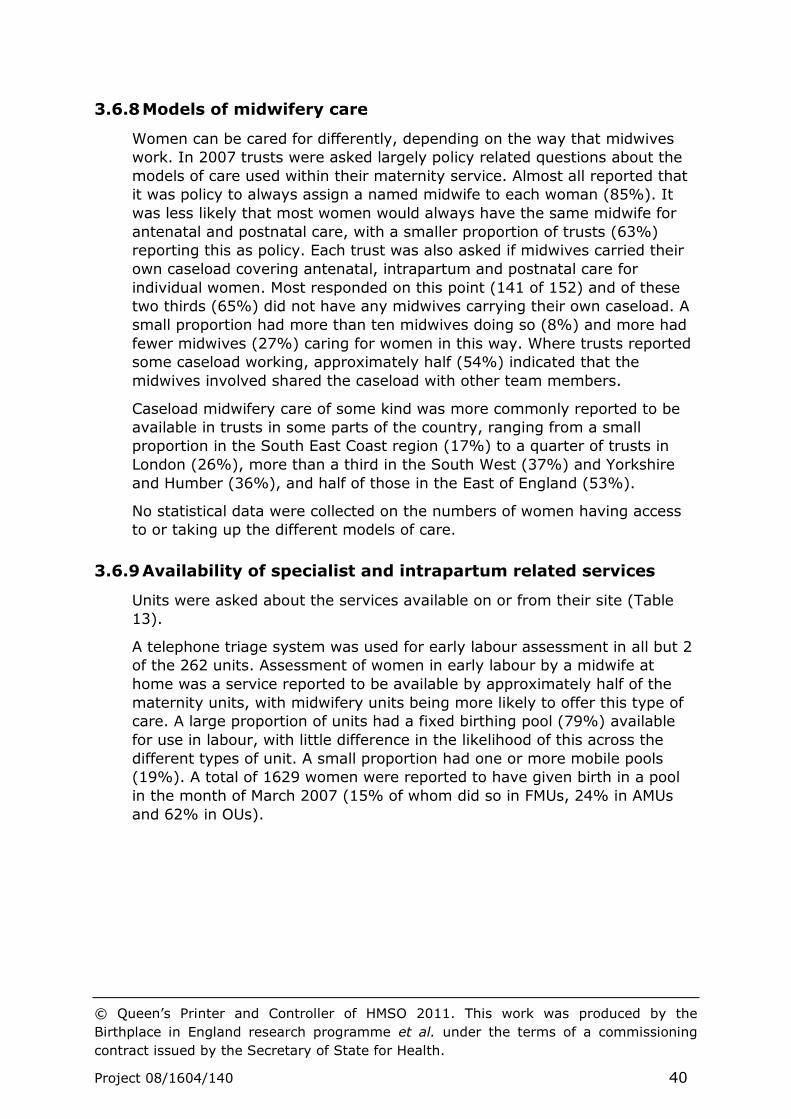
© Queen’s Printer and Controller of HMSO 2011. This work was produced by the
Birthplace in England research programme et al. under the terms of a commissioning
contract issued by the Secretary of State for Health.
Project 08/1604/140 40
3.6.8 Models of midwifery care
Women can be cared for differently, depending on the way that midwives
work. In 2007 trusts were asked largely policy related questions about the
models of care used within their maternity service. Almost all reported that
it was policy to always assign a named midwife to each woman (85%). It
was less likely that most women would always have the same midwife for
antenatal and postnatal care, with a smaller proportion of trusts (63%)
reporting this as policy. Each trust was also asked if midwives carried their
own caseload covering antenatal, intrapartum and postnatal care for
individual women. Most responded on this point (141 of 152) and of these
two thirds (65%) did not have any midwives carrying their own caseload. A
small proportion had more than ten midwives doing so (8%) and more had
fewer midwives (27%) caring for women in this way. Where trusts reported
some caseload working, approximately half (54%) indicated that the
midwives involved shared the caseload with other team members.
Caseload midwifery care of some kind was more commonly reported to be
available in trusts in some parts of the country, ranging from a small
proportion in the South East Coast region (17%) to a quarter of trusts in
London (26%), more than a third in the South West (37%) and Yorkshire
and Humber (36%), and half of those in the East of England (53%).
No statistical data were collected on the numbers of women having access
to or taking up the different models of care.
3.6.9 Availability of specialist and intrapartum related services
Units were asked about the services available on or from their site (Table
13).
A telephone triage system was used for early labour assessment in all but 2
of the 262 units. Assessment of women in early labour by a midwife at
home was a service reported to be available by approximately half of the
maternity units, with midwifery units being more likely to offer this type of
care. A large proportion of units had a fixed birthing pool (79%) available
for use in labour, with little difference in the likelihood of this across the
different types of unit. A small proportion had one or more mobile pools
(19%). A total of 1629 women were reported to have given birth in a pool
in the month of March 2007 (15% of whom did so in FMUs, 24% in AMUs
and 62% in OUs).
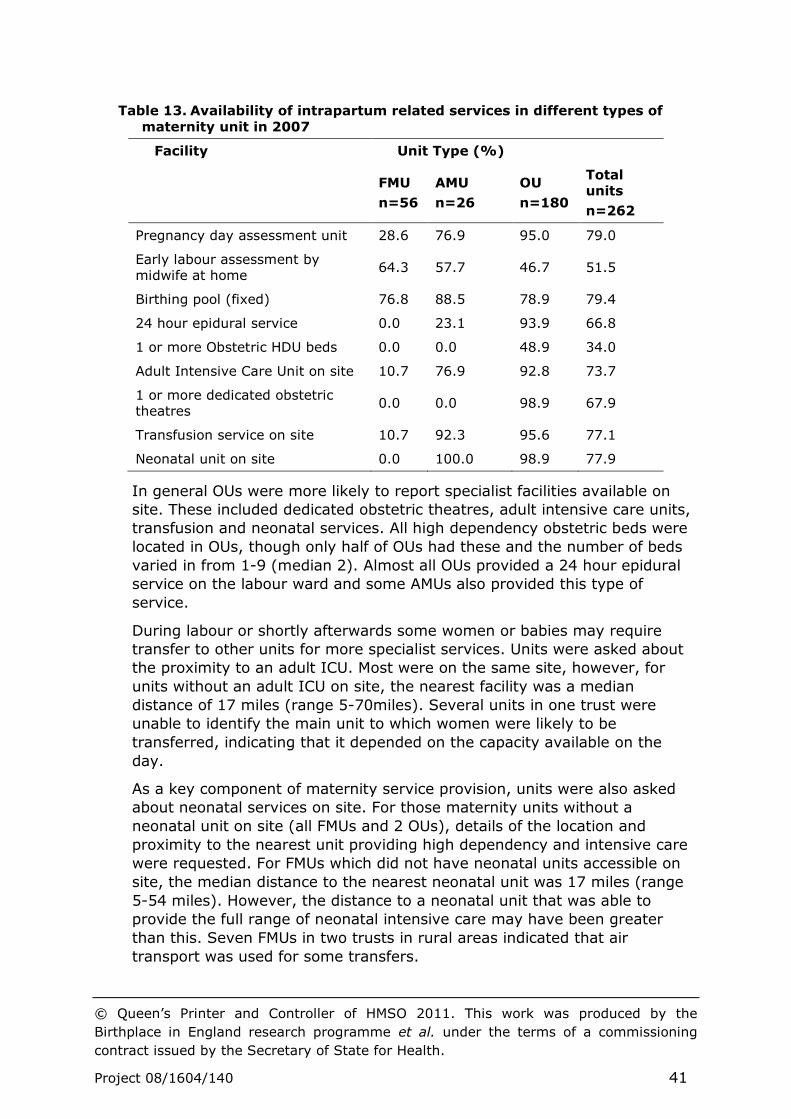
© Queen’s Printer and Controller of HMSO 2011. This work was produced by the
Birthplace in England research programme et al. under the terms of a commissioning
contract issued by the Secretary of State for Health.
Project 08/1604/140 41
Table 13. Availability of intrapartum related services in different types of
maternity unit in 2007
Facility Unit Type (%)
FMU
n=56
AMU
n=26
OU
n=180
Total units
n=262
Pregnancy day assessment unit 28.6 76.9 95.0 79.0
Early labour assessment by midwife at home
64.3 57.7 46.7 51.5
Birthing pool (fixed) 76.8 88.5 78.9 79.4
24 hour epidural service 0.0 23.1 93.9 66.8
1 or more Obstetric HDU beds 0.0 0.0 48.9 34.0
Adult Intensive Care Unit on site 10.7 76.9 92.8 73.7
1 or more dedicated obstetric theatres
0.0 0.0 98.9 67.9
Transfusion service on site 10.7 92.3 95.6 77.1
Neonatal unit on site 0.0 100.0 98.9 77.9
In general OUs were more likely to report specialist facilities available on
site. These included dedicated obstetric theatres, adult intensive care units,
transfusion and neonatal services. All high dependency obstetric beds were
located in OUs, though only half of OUs had these and the number of beds
varied in from 1-9 (median 2). Almost all OUs provided a 24 hour epidural
service on the labour ward and some AMUs also provided this type of
service.
During labour or shortly afterwards some women or babies may require
transfer to other units for more specialist services. Units were asked about
the proximity to an adult ICU. Most were on the same site, however, for
units without an adult ICU on site, the nearest facility was a median
distance of 17 miles (range 5-70miles). Several units in one trust were
unable to identify the main unit to which women were likely to be
transferred, indicating that it depended on the capacity available on the
day.
As a key component of maternity service provision, units were also asked
about neonatal services on site. For those maternity units without a
neonatal unit on site (all FMUs and 2 OUs), details of the location and
proximity to the nearest unit providing high dependency and intensive care
were requested. For FMUs which did not have neonatal units accessible on
site, the median distance to the nearest neonatal unit was 17 miles (range
5-54 miles). However, the distance to a neonatal unit that was able to
provide the full range of neonatal intensive care may have been greater
than this. Seven FMUs in two trusts in rural areas indicated that air
transport was used for some transfers.
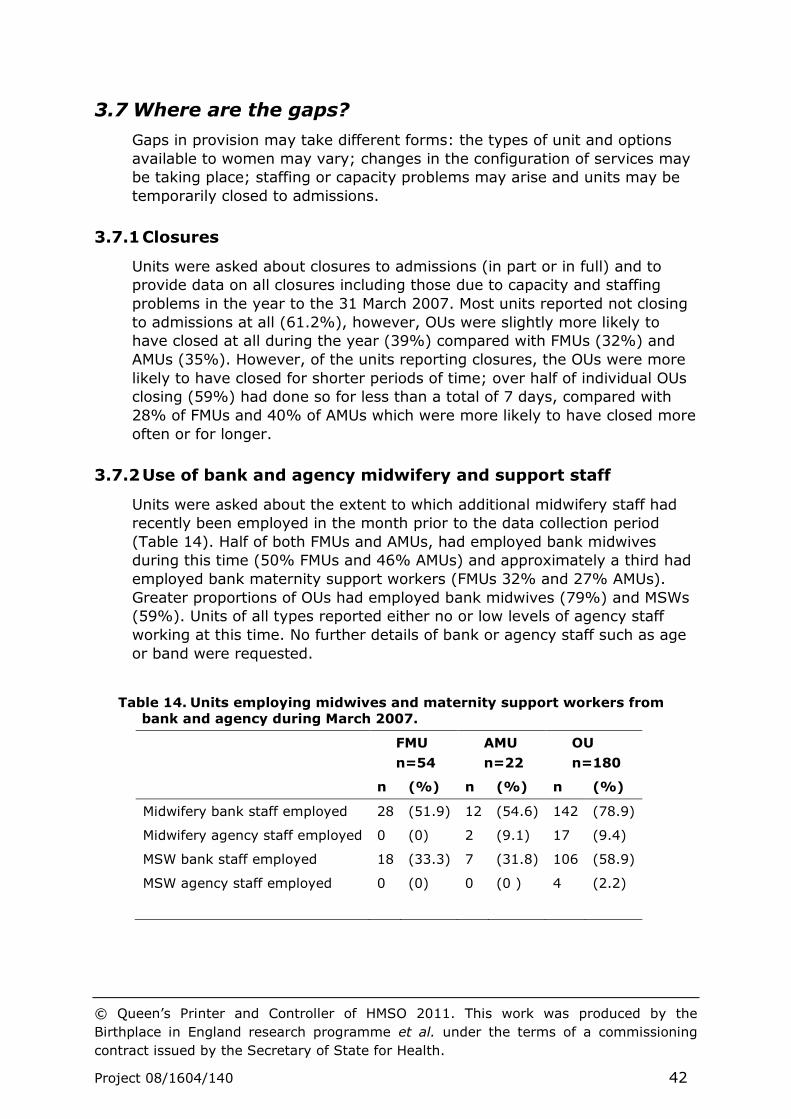
© Queen’s Printer and Controller of HMSO 2011. This work was produced by the
Birthplace in England research programme et al. under the terms of a commissioning
contract issued by the Secretary of State for Health.
Project 08/1604/140 42
3.7 Where are the gaps?
Gaps in provision may take different forms: the types of unit and options
available to women may vary; changes in the configuration of services may
be taking place; staffing or capacity problems may arise and units may be
temporarily closed to admissions.
3.7.1 Closures
Units were asked about closures to admissions (in part or in full) and to
provide data on all closures including those due to capacity and staffing
problems in the year to the 31 March 2007. Most units reported not closing
to admissions at all (61.2%), however, OUs were slightly more likely to
have closed at all during the year (39%) compared with FMUs (32%) and
AMUs (35%). However, of the units reporting closures, the OUs were more
likely to have closed for shorter periods of time; over half of individual OUs
closing (59%) had done so for less than a total of 7 days, compared with
28% of FMUs and 40% of AMUs which were more likely to have closed more
often or for longer.
3.7.2 Use of bank and agency midwifery and support staff
Units were asked about the extent to which additional midwifery staff had
recently been employed in the month prior to the data collection period
(Table 14). Half of both FMUs and AMUs, had employed bank midwives
during this time (50% FMUs and 46% AMUs) and approximately a third had
employed bank maternity support workers (FMUs 32% and 27% AMUs).
Greater proportions of OUs had employed bank midwives (79%) and MSWs
(59%). Units of all types reported either no or low levels of agency staff
working at this time. No further details of bank or agency staff such as age
or band were requested.
Table 14. Units employing midwives and maternity support workers from
bank and agency during March 2007.
FMU
n=54
AMU
n=22
OU
n=180
n (%) n (%) n (%)
Midwifery bank staff employed 28 (51.9) 12 (54.6) 142 (78.9)
Midwifery agency staff employed 0 (0) 2 (9.1) 17 (9.4)
MSW bank staff employed 18 (33.3) 7 (31.8) 106 (58.9)
MSW agency staff employed 0 (0) 0 (0 ) 4 (2.2)
© Queen’s Printer and Controller of HMSO 2011. This work was produced by the
Birthplace in England research programme et al. under the terms of a commissioning
contract issued by the Secretary of State for Health.
Project 08/1604/140 43
3.7.3 Vacancies and turnover
Vacancy rates were calculated as of 31st March 2007 and based on
establishment and WTE midwives or MSWs in post at that time, rather than
the conventional calculation with posts that had been unfilled for a period of
at least three months for which staff were actively being sought (Table 15).
Table 15. Vacancies and turnover details among midwives and MSWs by unit
type for 2007
Midwife vacancies Midwife turnover
WTEs % Numbers
resigning and retiring
% resigning and retiring
FMU (n=25)
Mean 0.9 6.0 1.4 6.3
Median 0.2 1.7 1.0 3.9
Interquartile range (IQR)
0.0-1.2 0.0-10.0 0.0-2.0 0.0-10.0
Range 0.0-9.9 0.0-38.8 0.0-15.0 0.0-40.0
AMU (n=54)
Mean 1.7 4.6 2.5 6.0
Median 0.8 3.1 1.0 4.1
Interquartile range (IQR)
0.0-2.3 0.0-8.7 0.0-3.0 0.0-10.7
Range 0.0-9.0 0.0-12.9 0.0-16.0 0.0-23.5
OU (n=180)
Mean 4.1 4.1 8.1 6.4
Median 2.8 3.1 7.0 6.1
Interquartile range (IQR)
0.2-6.1 0.3-6.4 4.0-11.0 3.19-9.0
Range 0.0-23.6 0.0-16.0 0.0-55.0 0.0-22.5
The overall proportion of WTE midwifery posts vacant at this time across all
types of unit providing data was 3.8%: the median proportion of vacant
posts was 1.7% in FMUs, 3.1% in AMUs and 3.1% in OUs. MSW vacancies
were higher than that of midwives at 11.8% overall, ranging from a median
of 0% in FMUs to 10% in AMUs and OUs, though some units had MSW
vacancy rates considerably higher than this (Table 16). For both groups it
must be emphasised that the vacancies calculated are simply based on the
agreed funded establishment which may not in fact reflect staffing
requirements for maternity care. Some units reported employing more staff
than were allowed for by their funded WTE establishment, an apparent
oversupply (9% of FMUs, 8% of AMUs and 14% of OUs), mostly on a small
scale, possibly associated with skill mix revisions. In presenting the vacancy
rate for the different types of unit this has not been taken into account.
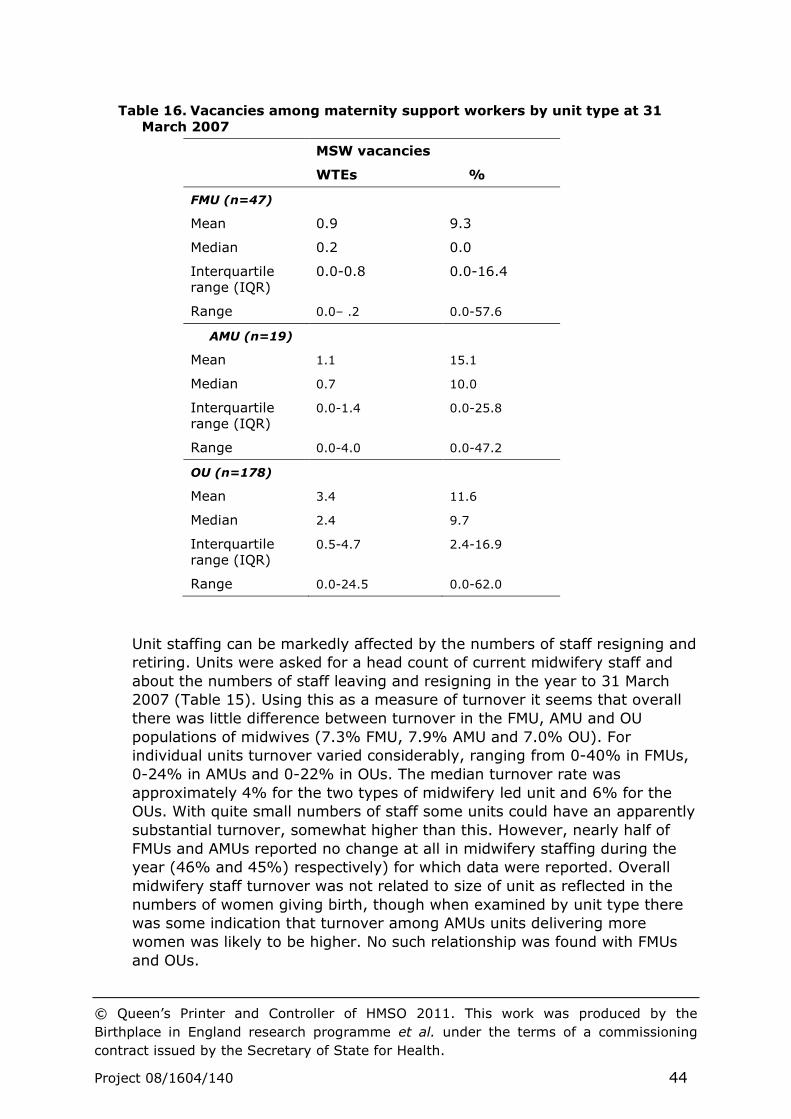
© Queen’s Printer and Controller of HMSO 2011. This work was produced by the
Birthplace in England research programme et al. under the terms of a commissioning
contract issued by the Secretary of State for Health.
Project 08/1604/140 44
Table 16. Vacancies among maternity support workers by unit type at 31
March 2007
MSW vacancies
WTEs %
FMU (n=47)
Mean 0.9 9.3
Median 0.2 0.0
Interquartile range (IQR)
0.0-0.8 0.0-16.4
Range 0.0– .2 0.0-57.6
AMU (n=19)
Mean 1.1 15.1
Median 0.7 10.0
Interquartile range (IQR)
0.0-1.4 0.0-25.8
Range 0.0-4.0 0.0-47.2
OU (n=178)
Mean 3.4 11.6
Median 2.4 9.7
Interquartile range (IQR)
0.5-4.7 2.4-16.9
Range 0.0-24.5 0.0-62.0
Unit staffing can be markedly affected by the numbers of staff resigning and
retiring. Units were asked for a head count of current midwifery staff and
about the numbers of staff leaving and resigning in the year to 31 March
2007 (Table 15). Using this as a measure of turnover it seems that overall
there was little difference between turnover in the FMU, AMU and OU
populations of midwives (7.3% FMU, 7.9% AMU and 7.0% OU). For
individual units turnover varied considerably, ranging from 0-40% in FMUs,
0-24% in AMUs and 0-22% in OUs. The median turnover rate was
approximately 4% for the two types of midwifery led unit and 6% for the
OUs. With quite small numbers of staff some units could have an apparently
substantial turnover, somewhat higher than this. However, nearly half of
FMUs and AMUs reported no change at all in midwifery staffing during the
year (46% and 45%) respectively) for which data were reported. Overall
midwifery staff turnover was not related to size of unit as reflected in the
numbers of women giving birth, though when examined by unit type there
was some indication that turnover among AMUs units delivering more
women was likely to be higher. No such relationship was found with FMUs
and OUs.

© Queen’s Printer and Controller of HMSO 2011. This work was produced by the
Birthplace in England research programme et al. under the terms of a commissioning
contract issued by the Secretary of State for Health.
Project 08/1604/140 45
There has been concern about the aging population of midwives working in
maternity care with regard to future planning and the provision of
supervision and support for midwives at all levels, especially those coming
into the profession. Units were simply asked about the midwifery staff aged
fifty years or more (Table 17).
Table 17. Number and proportion of midwives aged 50 years or over by unit
type
Midwives aged 50 or more years
WTEs %
FMU (n=49)
Mean 4.6 38.6
Median 4.0 33.4
Interquartile range (IQR) 2.7-7.0 23.9-54.1
Range 0.0-12.0 0.0-94.3
AMU (n=20)
Mean 5.3 16.5
Median 3.0 17.8
Interquartile range (IQR) 0.0-7.3 0.0-26.4
Range 0.0-30.0 0.0-56.6
OU (n=168)
Mean 26.3 28.0
Median 23.7 27.9
Interquartile range (IQR) 17.7-32.0 21.7-33.9
Range 3.3-72.0 4.7-56.7
The changing demographics of the midwifery population were reflected in
the overall proportion of WTE midwives employed aged 50 years or more,
representing 21% of midwives in 2007. Over all 1 in 5 staff were aged fifty
years or more. This was highest in the FMUs, where over a quarter (26%)
of midwives were aged 50 years or over, followed by the OUs (22%) and
then the AMUs (19%) The larger proportion of older staff in FMUs and to
some extent OUs may reflect the greater experience required in working in
that environment, both for clinical practice and in providing an effective
learning environment and supervised experience for midwifery students.
Data were also collected on nurse staffing and vacancies in neonatal care as
well as maternity units as part of the maternity review. Vacancy rates
varied by region for units providing midwifery and neonatal care, with
London having the greatest proportion of vacancies and the highest median
rates for the units at the time that data were collected (Figure 11).
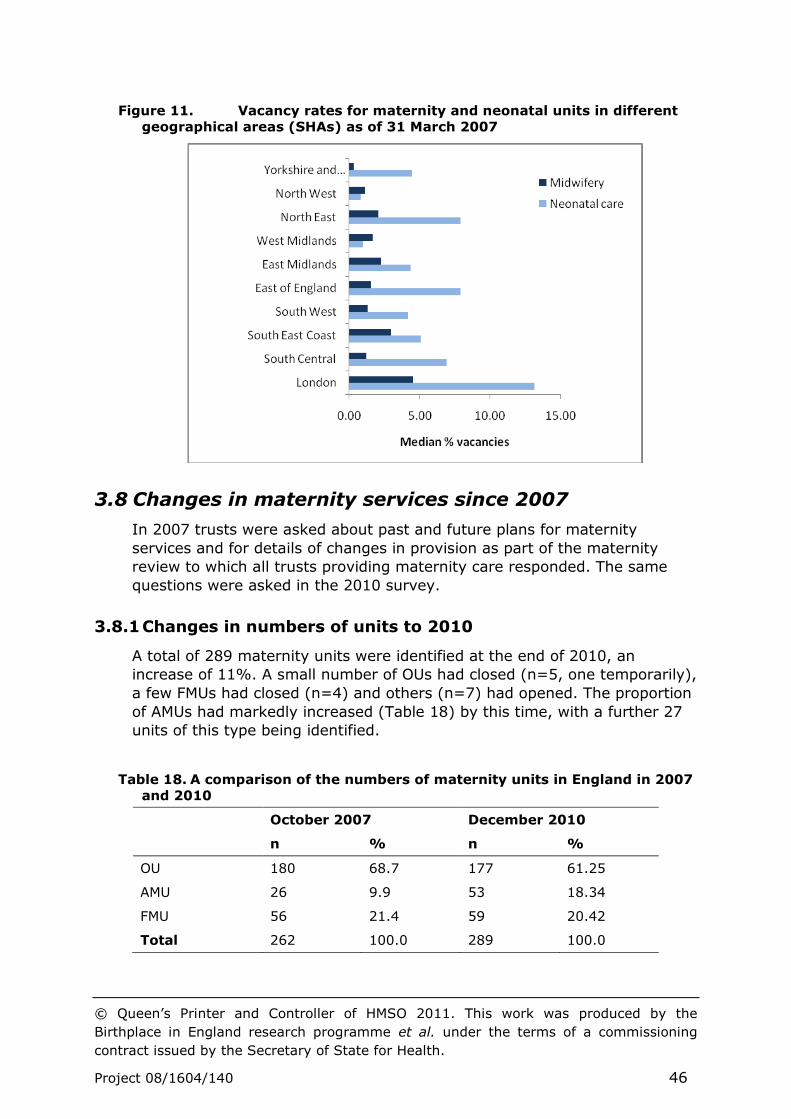
© Queen’s Printer and Controller of HMSO 2011. This work was produced by the
Birthplace in England research programme et al. under the terms of a commissioning
contract issued by the Secretary of State for Health.
Project 08/1604/140 46
Figure 11. Vacancy rates for maternity and neonatal units in different
geographical areas (SHAs) as of 31 March 2007
3.8 Changes in maternity services since 2007
In 2007 trusts were asked about past and future plans for maternity
services and for details of changes in provision as part of the maternity
review to which all trusts providing maternity care responded. The same
questions were asked in the 2010 survey.
3.8.1 Changes in numbers of units to 2010
A total of 289 maternity units were identified at the end of 2010, an
increase of 11%. A small number of OUs had closed (n=5, one temporarily),
a few FMUs had closed (n=4) and others (n=7) had opened. The proportion
of AMUs had markedly increased (Table 18) by this time, with a further 27
units of this type being identified.
Table 18. A comparison of the numbers of maternity units in England in 2007
and 2010
October 2007 December 2010
n % n %
OU 180 68.7 177 61.25
AMU 26 9.9 53 18.34
FMU 56 21.4 59 20.42
Total 262 100.0 289 100.0
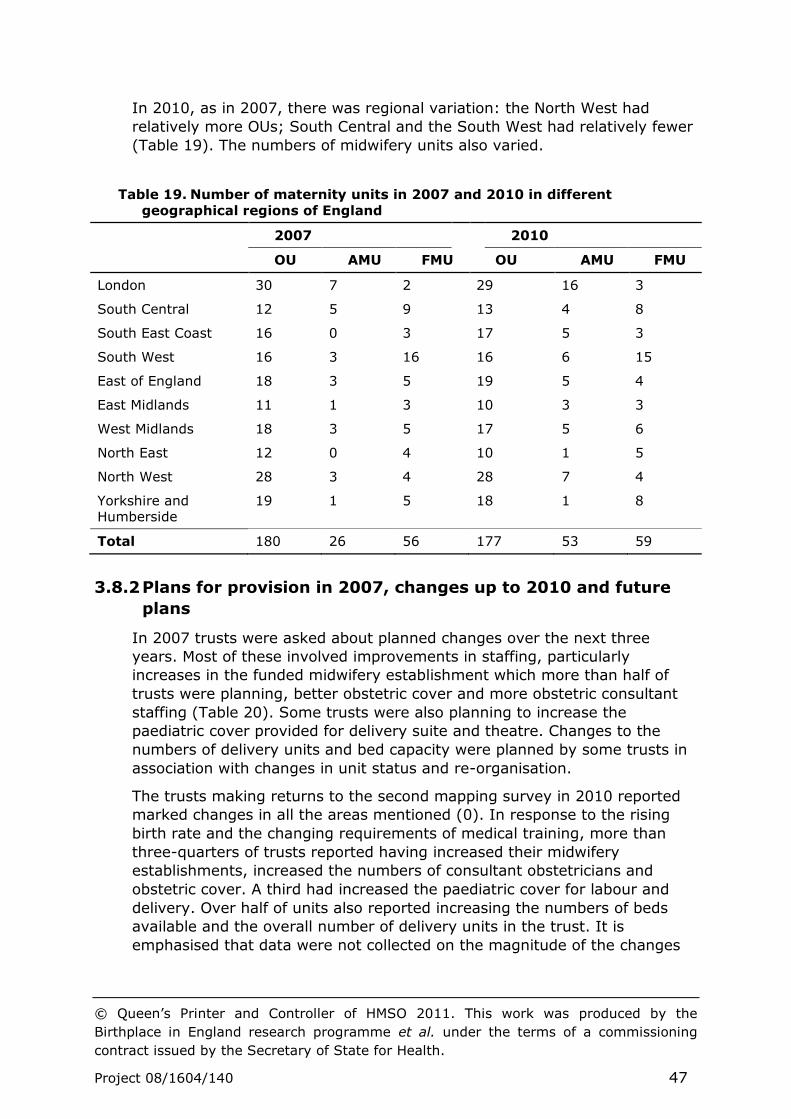
© Queen’s Printer and Controller of HMSO 2011. This work was produced by the
Birthplace in England research programme et al. under the terms of a commissioning
contract issued by the Secretary of State for Health.
Project 08/1604/140 47
In 2010, as in 2007, there was regional variation: the North West had
relatively more OUs; South Central and the South West had relatively fewer
(Table 19). The numbers of midwifery units also varied.
Table 19. Number of maternity units in 2007 and 2010 in different
geographical regions of England
2007 2010
OU AMU FMU OU AMU FMU
London 30 7 2 29 16 3
South Central 12 5 9 13 4 8
South East Coast 16 0 3 17 5 3
South West 16 3 16 16 6 15
East of England 18 3 5 19 5 4
East Midlands 11 1 3 10 3 3
West Midlands 18 3 5 17 5 6
North East 12 0 4 10 1 5
North West 28 3 4 28 7 4
Yorkshire and Humberside
19 1 5 18 1 8
Total 180 26 56 177 53 59
3.8.2 Plans for provision in 2007, changes up to 2010 and future
plans
In 2007 trusts were asked about planned changes over the next three
years. Most of these involved improvements in staffing, particularly
increases in the funded midwifery establishment which more than half of
trusts were planning, better obstetric cover and more obstetric consultant
staffing (Table 20). Some trusts were also planning to increase the
paediatric cover provided for delivery suite and theatre. Changes to the
numbers of delivery units and bed capacity were planned by some trusts in
association with changes in unit status and re-organisation.
The trusts making returns to the second mapping survey in 2010 reported
marked changes in all the areas mentioned (0). In response to the rising
birth rate and the changing requirements of medical training, more than
three-quarters of trusts reported having increased their midwifery
establishments, increased the numbers of consultant obstetricians and
obstetric cover. A third had increased the paediatric cover for labour and
delivery. Over half of units also reported increasing the numbers of beds
available and the overall number of delivery units in the trust. It is
emphasised that data were not collected on the magnitude of the changes

© Queen’s Printer and Controller of HMSO 2011. This work was produced by the
Birthplace in England research programme et al. under the terms of a commissioning
contract issued by the Secretary of State for Health.
Project 08/1604/140 48
made and the lower return rate means that the data presented on these
aspects of provision do not represent the whole population of trusts.
Table 20. Future plans in 2007: numbers and proportions of trusts planning
changes
Trust changes in: Next three years
Increase Same Decrease
n % n % n %
Overall number of delivery units (n=152) 26 17% 114 76% 11 7%
Delivery bed capacity (n=152) 45 30% 92 62% 12 8%
Obstetric cover (n=148) 71 48% 76 51% 2 1%
Paediatric cover for delivery suite and theatre (n=148)
24 16% 122 82% 2 1%
Obstetric consultant staffing (n=150) 67 45% 79 53% 3 2%
Funded midwife establishment (n=152) 81 54% 60 40% 9 6%
As part of the second mapping survey in 2010 Trusts were also asked to
look forward and indicate which aspects of maternity care provision were
likely to change over the next three years. More planned increases in the
numbers of maternity units, beds, medical and midwifery staffing in the
near future were reported, though a small proportion of trusts are planning
reductions in these (0).
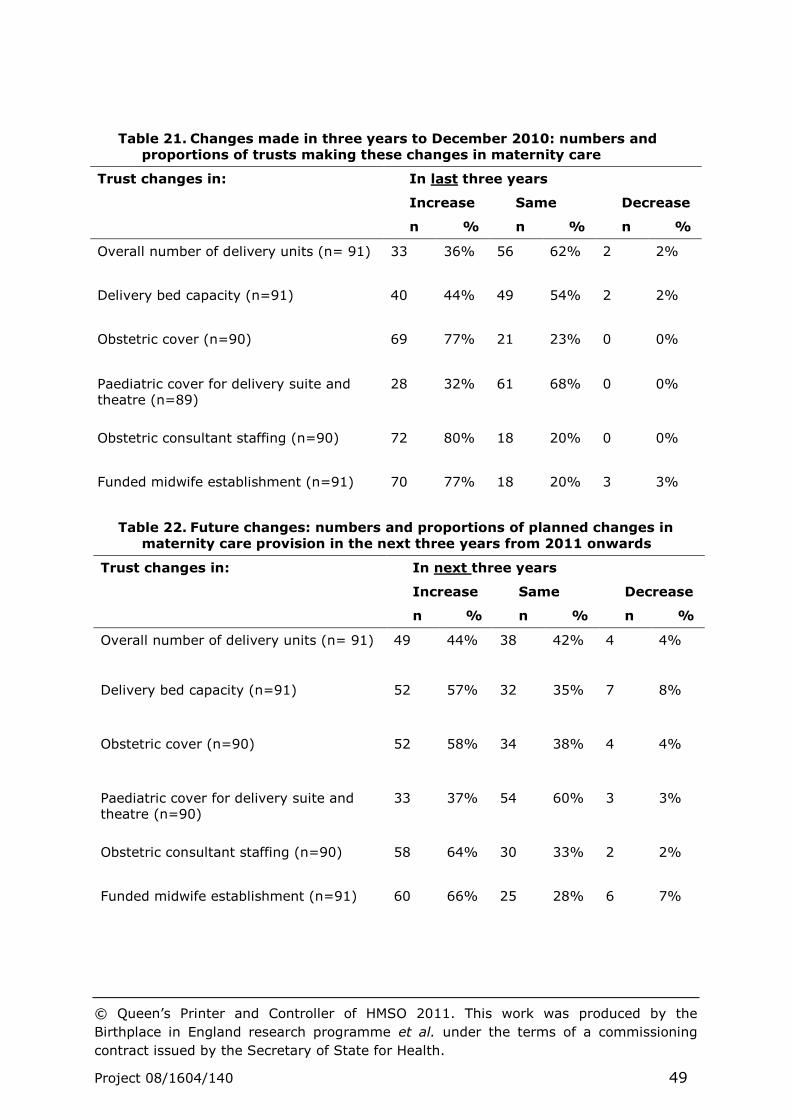
© Queen’s Printer and Controller of HMSO 2011. This work was produced by the
Birthplace in England research programme et al. under the terms of a commissioning
contract issued by the Secretary of State for Health.
Project 08/1604/140 49
Table 21. Changes made in three years to December 2010: numbers and
proportions of trusts making these changes in maternity care
Trust changes in: In last three years
Increase Same Decrease
n % n % n %
Overall number of delivery units (n= 91) 33 36% 56 62% 2 2%
Delivery bed capacity (n=91) 40 44% 49 54% 2 2%
Obstetric cover (n=90) 69 77% 21 23% 0 0%
Paediatric cover for delivery suite and theatre (n=89)
28 32% 61 68% 0 0%
Obstetric consultant staffing (n=90)
72 80% 18 20% 0 0%
Funded midwife establishment (n=91) 70 77% 18 20% 3 3%
Table 22. Future changes: numbers and proportions of planned changes in
maternity care provision in the next three years from 2011 onwards
Trust changes in: In next three years
Increase Same Decrease
n % n % n %
Overall number of delivery units (n= 91) 49 44% 38 42% 4 4%
Delivery bed capacity (n=91) 52 57% 32 35% 7 8%
Obstetric cover (n=90) 52 58% 34 38% 4 4%
Paediatric cover for delivery suite and theatre (n=90)
33 37% 54 60% 3 3%
Obstetric consultant staffing (n=90)
58 64% 30 33% 2 2%
Funded midwife establishment (n=91) 60 66% 25 28% 6 7%
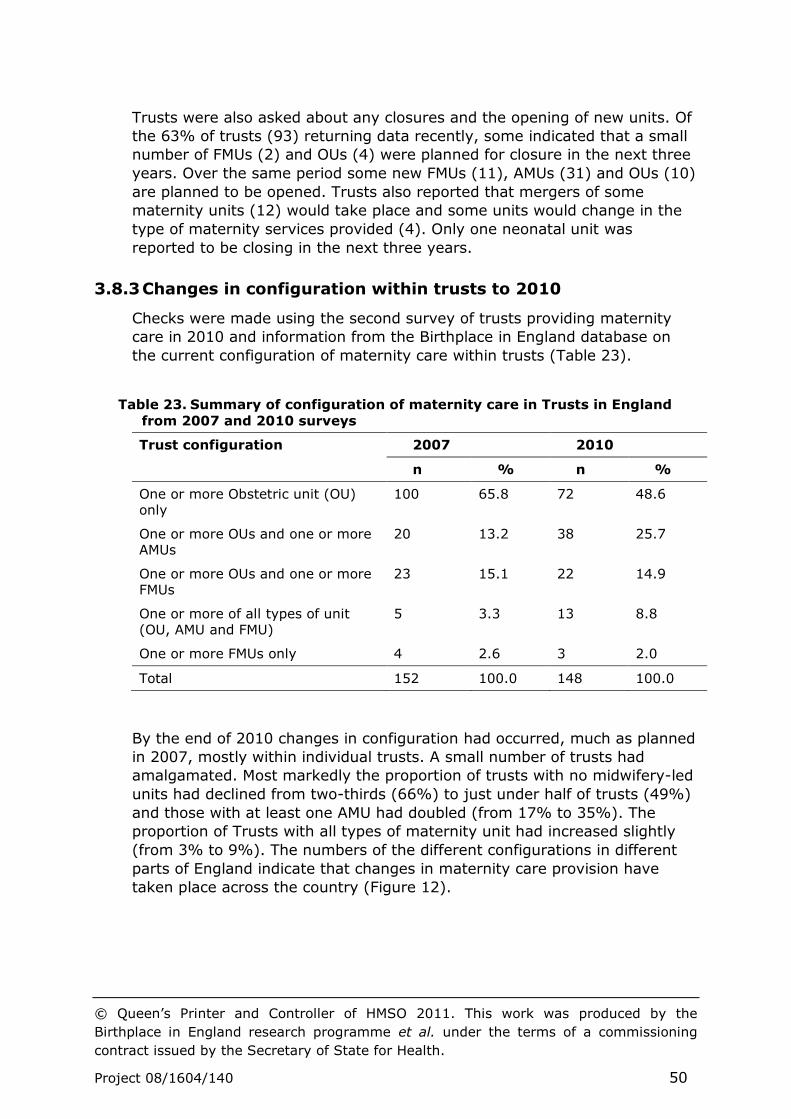
© Queen’s Printer and Controller of HMSO 2011. This work was produced by the
Birthplace in England research programme et al. under the terms of a commissioning
contract issued by the Secretary of State for Health.
Project 08/1604/140 50
Trusts were also asked about any closures and the opening of new units. Of
the 63% of trusts (93) returning data recently, some indicated that a small
number of FMUs (2) and OUs (4) were planned for closure in the next three
years. Over the same period some new FMUs (11), AMUs (31) and OUs (10)
are planned to be opened. Trusts also reported that mergers of some
maternity units (12) would take place and some units would change in the
type of maternity services provided (4). Only one neonatal unit was
reported to be closing in the next three years.
3.8.3 Changes in configuration within trusts to 2010
Checks were made using the second survey of trusts providing maternity
care in 2010 and information from the Birthplace in England database on
the current configuration of maternity care within trusts (Table 23).
Table 23. Summary of configuration of maternity care in Trusts in England
from 2007 and 2010 surveys
Trust configuration 2007 2010
n % n %
One or more Obstetric unit (OU) only
100 65.8 72 48.6
One or more OUs and one or more AMUs
20 13.2 38 25.7
One or more OUs and one or more FMUs
23 15.1 22 14.9
One or more of all types of unit (OU, AMU and FMU)
5 3.3 13 8.8
One or more FMUs only 4 2.6 3 2.0
Total 152 100.0 148 100.0
By the end of 2010 changes in configuration had occurred, much as planned
in 2007, mostly within individual trusts. A small number of trusts had
amalgamated. Most markedly the proportion of trusts with no midwifery-led
units had declined from two-thirds (66%) to just under half of trusts (49%)
and those with at least one AMU had doubled (from 17% to 35%). The
proportion of Trusts with all types of maternity unit had increased slightly
(from 3% to 9%). The numbers of the different configurations in different
parts of England indicate that changes in maternity care provision have
taken place across the country (Figure 12).
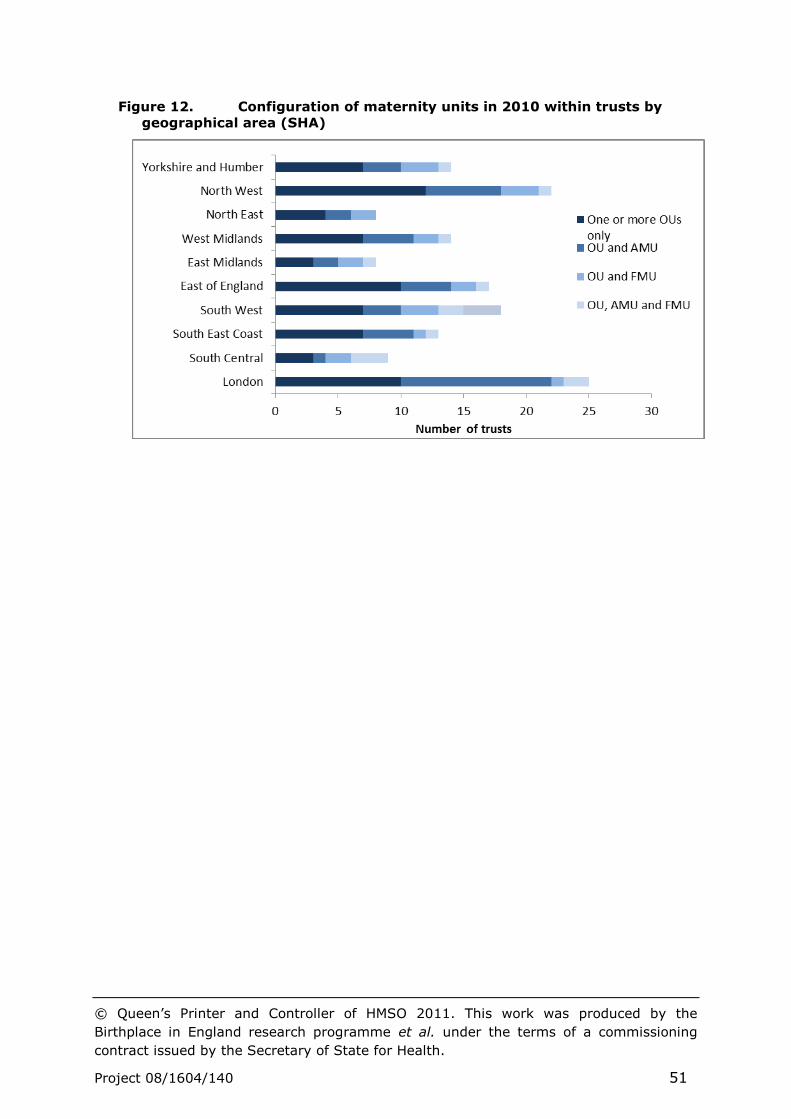
© Queen’s Printer and Controller of HMSO 2011. This work was produced by the
Birthplace in England research programme et al. under the terms of a commissioning
contract issued by the Secretary of State for Health.
Project 08/1604/140 51
Figure 12. Configuration of maternity units in 2010 within trusts by
geographical area (SHA)
© Queen’s Printer and Controller of HMSO 2011. This work was produced by the
Birthplace in England research programme et al. under the terms of a commissioning
contract issued by the Secretary of State for Health.
Project 08/1604/140 52
4 Discussion and conclusions
The current organisation of maternity care is likely to reflect the local
population and historical developments and changes within the NHS, as well
as proximity to other maternity units. It appears that trusts have to some
extent developed different solutions and strategies in providing maternity
care. Population density and complexity of need may drive the development
and location of specialist services based in cities and centres of population.
However, it is difficult to argue that the care needs of mothers and babies
vary, particularly those at low risk of complications. The considerable
variation in all the aspects of maternity care service delivery and
organisation that we have examined seems to go beyond such differences.
The variation described may simply reflect differences in investment in
maternity care or it may to some degree provide evidence about the
different solutions currently in place. Which ever interpretation is
appropriate, the evidence on variation can be used as a driver for quality
improvement both locally and nationally.
It is difficult to know what is acceptable variation in relation to, for example,
staffing structure and organisation. Staffing levels and skill mix
requirements may be addressed in different ways and while overall
individual midwifery and medical establishments may appear satisfactory,
the cover on a shift-by-shift basis may not be acceptable or appropriate for
the numbers of women for whom care is required or for the complexity of
their needs. Some standards have been put forward, but the evidence base
for these is for the most part limited and they do not cover many of the
aspects of organisation described in the report,5, 6 nor is there adequate
evidence in relation to outcomes for women and their babies associated
with such factors.
It may be helpful to examine individual trusts and units which appear to be
outliers, with a view to understanding specific issues and the ways in which
the organisations providing intrapartum maternity care and commissioners
have aimed to address these. The Case Studies component of the Birthplace
in England research programme provides some examples of how
intrapartum maternity care is organised on an individual trust basis.
Despite the variation, at the same time there are some discernible patterns
in the shifting picture of provision. The changing nature of specialist medical
training and input to maternity care following on from the European
Working Time Directive has impacted and will continue to affect the way
that maternity care is provided. At the same time the rising birthrate and
increased acuity is making demands on the skill base of the health
professionals and others involved 4, 6 and on the physical capacity of units to
cope in terms of beds, rooms and specialist facilities that include theatre
and high dependency care.
© Queen’s Printer and Controller of HMSO 2011. This work was produced by the
Birthplace in England research programme et al. under the terms of a commissioning
contract issued by the Secretary of State for Health.
Project 08/1604/140 53
The report on the mapping component of the Birthplace in England research
programme provides evidence about the configuration of maternity in
England in 2007 and in 2010. Appreciating the variations in service
provision, especially those associated with intrapartum care, differences in
capacity and throughput is essential in planning future services and care.
Information of this kind can enable trusts and units to place themselves in
context and allows commissioners to ask key questions about the way that
care is provided.
Detailed information is presented on the maternity workforce and midwifery
and maternity support worker staffing, vacancies and turnover. Thus the
mapping study findings, though essentially ‘top down’, may contribute to
the debate on the need to measure staffing requirements in maternity
care.14 This is with a view to using similar parameters to those utilised in
mapping to support more authentic modelling, prediction of staffing
requirements and prediction of the need for future professional training and
development in the area of maternity care.
A tool to allow maternity care providers to appropriately calculate staffing
requirements overall and on a day-to-day basis would enable more effective
planning and facilitate comparisons across trusts and units. The Birthrate+
tool has been used extensively (Ball et al, 2003a, 2003b), however, as has
been pointed out (Sandall et al, 2011) validation is required in supporting
its further development and use. Outcome data of the kind collected in the
Birthplace prospective cohort study have the potential to contribute in this
area.
The findings described relate well to the policies embodied in the choice
agenda (Department of Health, 2007; Department of Health, 2010).
Together with data directly collected from women on their experience of
maternity care, the choices offered and those taken up 3, 8, 16 and the
outcomes that have been measured in the prospective cohort study
component of the Birthplace programme, the mapping study findings
provide a comprehensive point of comparison for trusts and units to use. At
the same time the data have allowed some measurement of change over
time and can continue to provide a baseline for future comparisons.
Some of the aspects of organisation described relate to features of
maternity services that are critical to safety,17 ranging from staffing levels
to availability and proximity to specialist services. The data collected reflect
both policy, configuration of services and unit and trust statistics about the
population served and the care provided. All are essential elements in
creating a picture of how maternity services are currently organised and
informing future developments, including the development of maternity
networks.
© Queen’s Printer and Controller of HMSO 2011. This work was produced by the
Birthplace in England research programme et al. under the terms of a commissioning
contract issued by the Secretary of State for Health.
Project 08/1604/140 54
4.1 Key messages
The needs of women and babies are likely to vary little in terms of
maternity care, yet marked variation is evident in many aspects of
provision at trust and unit level and between geographical regions.
This includes variations in the types of unit available, beds, staffing
and specialist and other services, even when taking into account the
numbers of women for whom care is provided. Such differences
which may reflect inequalities in provision require further
examination.
Options for place of birth in trusts have improved since 2007.
However, the data on configuration of care suggest that some women
are still unlikely to have a full range of choices available locally within
each trust.
Recent and planned changes include more AMUs, greater numbers of
beds, more funded midwifery posts and more extensive consultant
cover and staffing.
The evidence on recent and planned future changes is significant in
the broader national context of maternity care provision and reflects
the efforts being made to address the policy agenda and population
changes.
Specialist services are of necessity more sparsely distributed and
changes in these may function as drivers for some aspects of
configuration.
Some ‘task-shifting’ is evident in the midwifery staffing and skill mix
data.
The difficulties of calculating staffing and facility requirements and in
defining appropriate standards were evident in the variation
described among trusts and units.
The description of maternity services in 2007 with details about
recent changes in configuration to 2010, in conjunction with future
plans, suggest that this area of healthcare is currently an active area
for change.
There is a continuing need to routinely document service
configuration, organisational change and evolution, especially in the
context of pressures for re-organisation, centralisation and
diversification.
4.2 Recommendations for further research
The mapping study provides an initial baseline on configuration of maternity
care in 2007, and more recently in 2010, for comparison with future
changes and developments. Monitoring of change over time will require
© Queen’s Printer and Controller of HMSO 2011. This work was produced by the
Birthplace in England research programme et al. under the terms of a commissioning
contract issued by the Secretary of State for Health.
Project 08/1604/140 55
further systematic data collection and specific questions, for example in
relation to medical staffing in maternity care.
Further research could usefully include modelling of provision using the data
set employed for the mapping descriptive analyses. This should include
exploring the impact of the changing demographics, locations of the child-
bearing population and re-configuring maternity care provision in relation to
place of birth.
© Queen’s Printer and Controller of HMSO 2011. This work was produced by the
Birthplace in England research programme et al. under the terms of a commissioning
contract issued by the Secretary of State for Health.
Project 08/1604/140 56
References
1. Department of Health. National Service Framework for Children, Young
People and Maternity Services: Core standards. London: Department of Health;
2004.
2. Department of Health/Partnerships for Children Families and Maternity.
Maternity Matters: Choice, access and continuity of care in a safe service.
London: ; 2007.
3. Healthcare Commission. Towards better births: A review of maternity
services in England. London: Commission for Healthcare Audit and Inspection: ;
2008.
4. Royal College of Obstetricians and Gynaecologists, Royal College of
Midwives, Royal College of Anaesthetists, Royal College of Paediatrics and Child
Health. Standards for Maternity Care: Report of a Working Party. London: RCOG
Press; 2008.
5. Royal College of Obstetricians and Gynaecologists. The Future Workforce
in Obstetrics and Gynaecology: England and Wales. Full report. London: Royal
College of Obstetricians and Gynaecologists; 2009.
6. Royal College of Midwives. Guidance paper. Staffing Standard in Midwifery
Services. London: Royal College of Midwives; 2009.
7. Sandall J, Homer C, Sadler E, Rudisill C, Bourgeault I, Bewley S, et al.
Staffing in maternity units. London: The King's Fund; 2011.
8. Redshaw M, Hiikkila K. Delivered with care: a national survey of women's
experience of maternity care 2010. Oxford: National Perinatal Epidemiolgy Unit;
2010.
9. Redshaw M, Rowe R, Hockley C, Brocklehurst P. Recorded delivery: a
national survey of women's experience of maternity care 2006. Oxford: National
Perinatal Epidemiology Unit; 2007.
10. Office for National Statistics. Birth statistics. Newport: Office for National
Statistics; 2006.
11. Office for National Statistics. Birth statistics: Births and patterns of family
building England and Wales (Series FM1, No. 36 ); 2008.
12. Sandall J, Manthorpe J, Mansfield A, Spencer L. Support Workers in
Maternity Services: A National Scoping Study of NHS Trusts Providing Maternity
Care in England 2006. Final Report. London: King's College London; 2007.
13. The Information Centre. NHS Hospital and Community Health Services
Non-Medical staff, England, 1997-2007. 2008. Available from:
http://www.ic.nhs.uk/webfiles/publications/nhsstaff2007/non%20med/Non-
Medical%20Staff%20Bulletin%201997-2007.pdf.
© Queen’s Printer and Controller of HMSO 2011. This work was produced by the
Birthplace in England research programme et al. under the terms of a commissioning
contract issued by the Secretary of State for Health.
Project 08/1604/140 57
14. Ball J, Washbrook M. Birthrate plus : a framework for workforce planning
and decision making for midwifery services. Hale, Cheshire: Books for Midwives
Press; 1996.
15. Royal College of Obstetricians and Gynaecologists, Royal College of
Midwives, Royal College of Anaesthetists, Royal College of Paediatrics and Child
Health. Safer childbirth: Minimum standards for the organisation and delivery of
care in labour. London: RCOG Press; 2007.
16. Care Quality Commission. Women's experiences of maternity care in
England: Key findings from the 2010 NHS trust survey. Briefing note. London:
Care Quality Commisssion.
17. King's Fund. Safe Births: Everybody's Business. An independent inquiry
into the safety of maternity services in England. London: King's Fund; 2008.
© Queen’s Printer and Controller of HMSO 2011. This work was produced by the
Birthplace in England research programme et al. under the terms of a commissioning
contract issued by the Secretary of State for Health.
Project 08/1604/140 58
Addendum
The Birthplace in England Research Programme combines the Evaluation of
Maternity Units in England (EMU) study funded in 2006 by the National
Institute for Health Research Service Delivery and Organisation (NIHR SDO)
programme, and the Birth at Home study in England, funded in 2007 by the
Department of Health Policy Research Programme (DH PRP). This
document is part of a suite of reports representing the combined output
from this jointly funded research. Should you have any queries please
contact [email protected]