Embed Size (px)
Citation preview
Mapping Manukau
Recent Statistics and data
Professor Charles Crothers
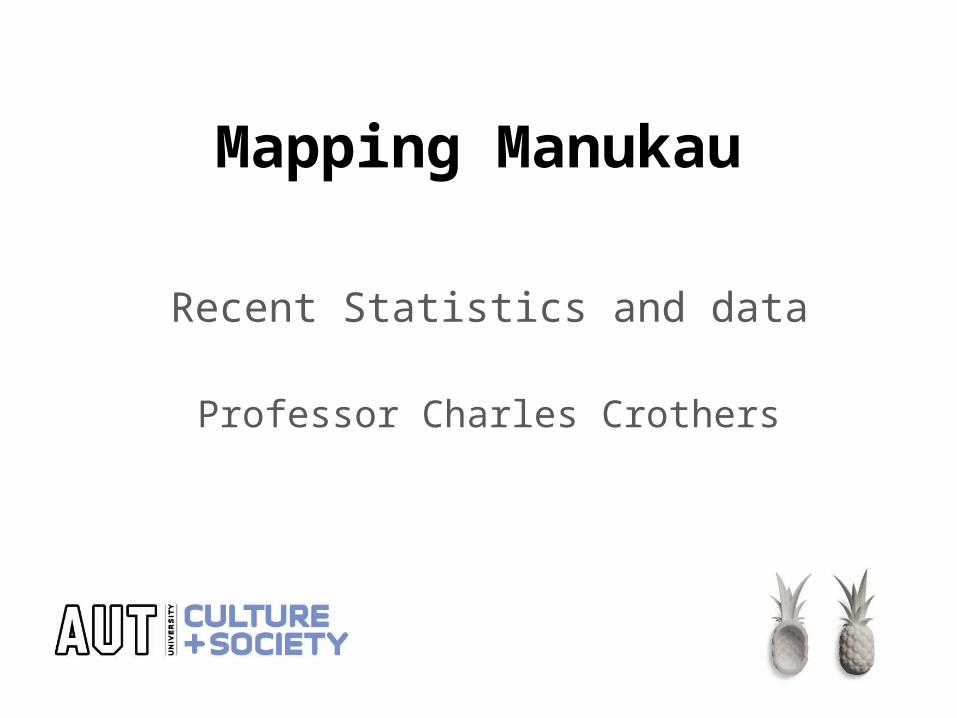
• Content Analysis of NZ Herald articles on ‘South Auckland’
Rank Most frequently cited ‘problems’ in sampled articles
1 Crime 62.2%
2 Political/Social/Economic 27.2%
3 Real estate/housing 3.5%
4 Education 2.8%
5 Environment 2.1%
6 Health 1.4%
7 Infrastructure 0.7%
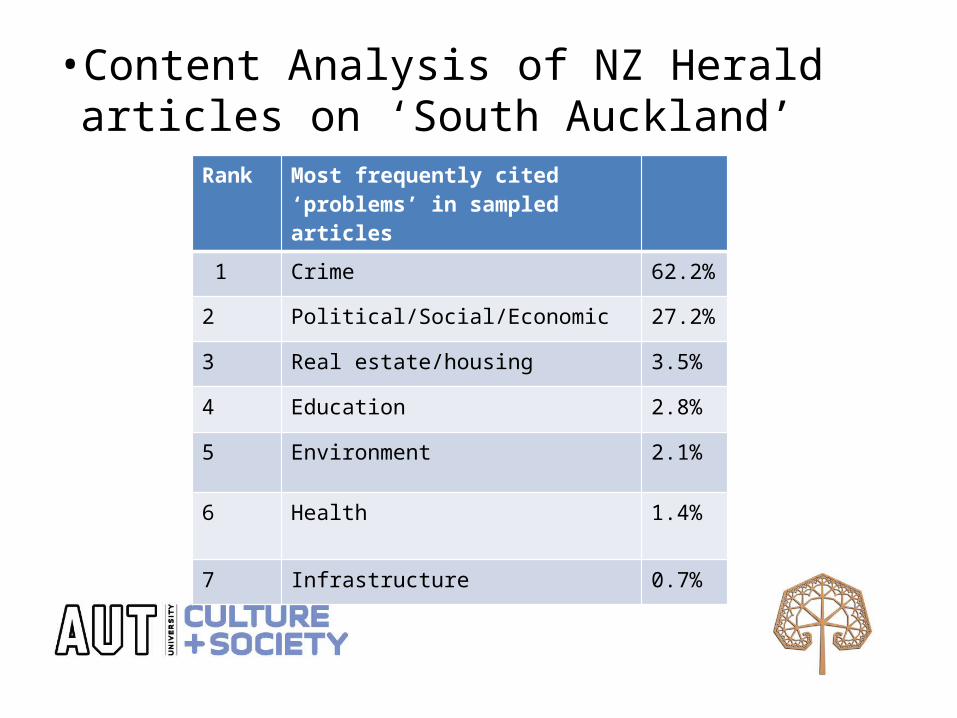
Most frequently cited assets %
No assets mentioned 37.2
Council 11.1
Businesses 5.8
Real estate 4.8
Parks/beaches 1.5
Schools/Education 4.8
Community Groups 9.2
Residents Association 1.4
Sports Club 3.4
Cultural organisation 7.3
Religious Group 1.4
Youth 1.9
Volunteers 2.9
Elderly -
Other 7.2
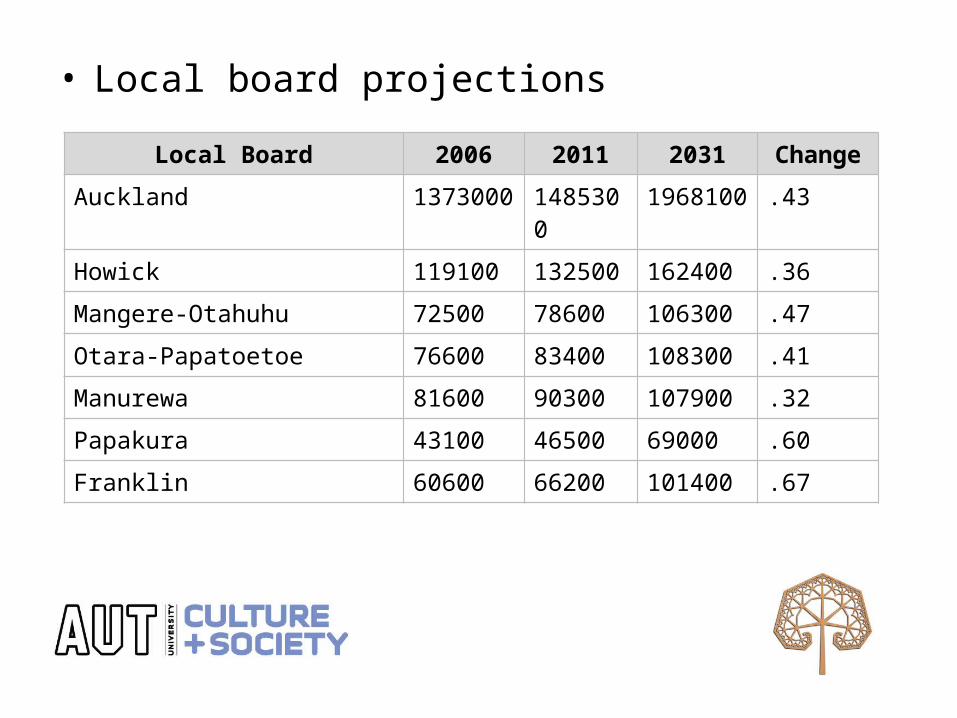
• Local board projections
Local Board 2006 2011 2031 Change
Auckland 1373000 1485300 1968100 .43
Howick 119100 132500 162400 .36
Mangere-Otahuhu 72500 78600 106300 .47
Otara-Papatoetoe 76600 83400 108300 .41
Manurewa 81600 90300 107900 .32
Papakura 43100 46500 69000 .60
Franklin 60600 66200 101400 .67
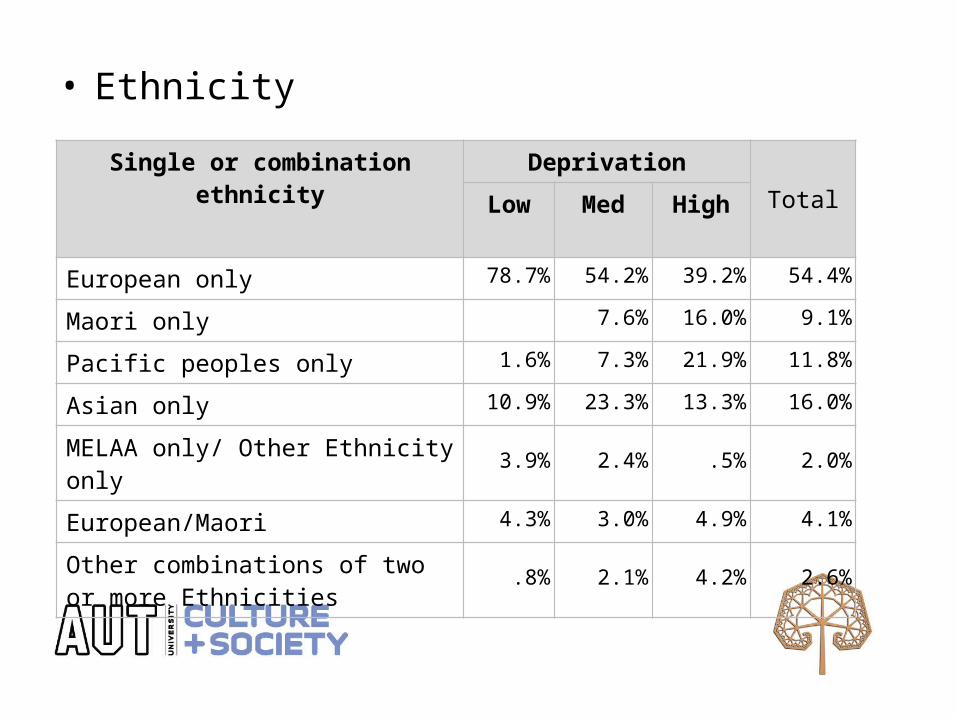
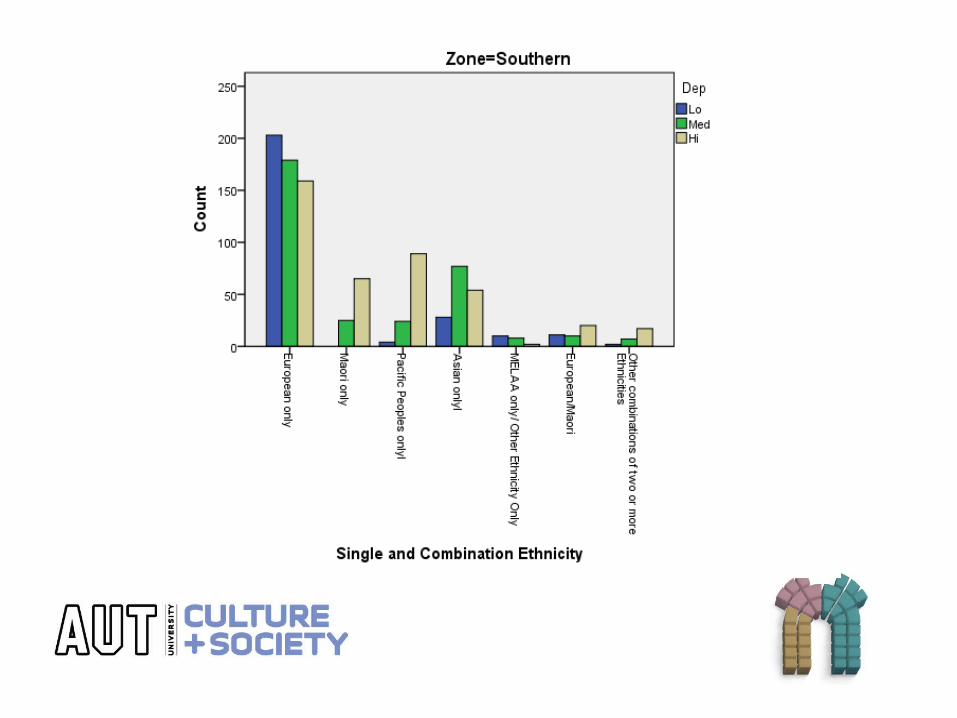
• Ethnicity
Single or combination ethnicity DeprivationTotal
Low Med High
European only 78.7% 54.2% 39.2% 54.4%
Maori only 7.6% 16.0% 9.1%
Pacific peoples only 1.6% 7.3% 21.9% 11.8%
Asian only 10.9% 23.3% 13.3% 16.0%
MELAA only/ Other Ethnicity only 3.9% 2.4% .5% 2.0%
European/Maori 4.3% 3.0% 4.9% 4.1%
Other combinations of two or more Ethnicities .8% 2.1% 4.2% 2.6%

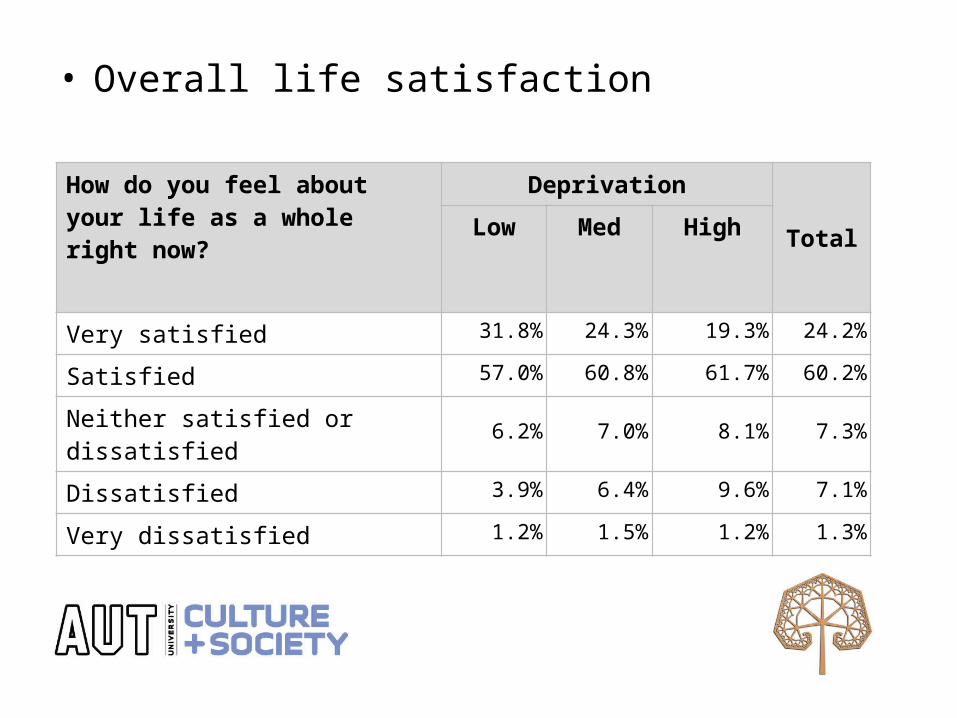
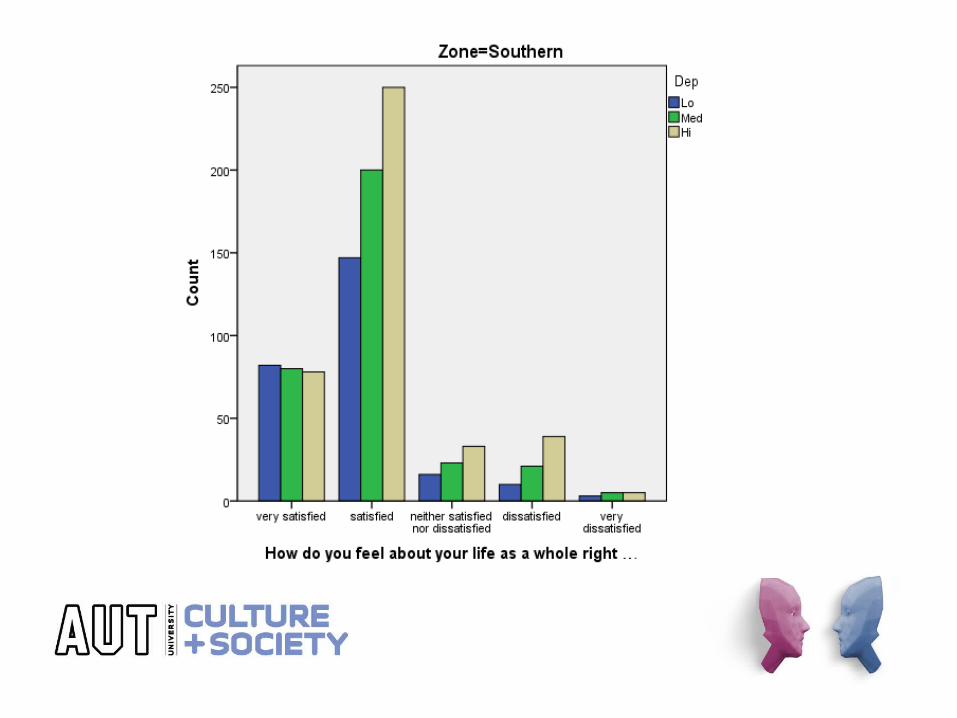
• Overall life satisfaction
How do you feel about your life as a whole right now?
DeprivationTotalLow Med High
Very satisfied 31.8% 24.3% 19.3% 24.2%
Satisfied 57.0% 60.8% 61.7% 60.2%
Neither satisfied or dissatisfied 6.2% 7.0% 8.1% 7.3%
Dissatisfied 3.9% 6.4% 9.6% 7.1%
Very dissatisfied 1.2% 1.5% 1.2% 1.3%
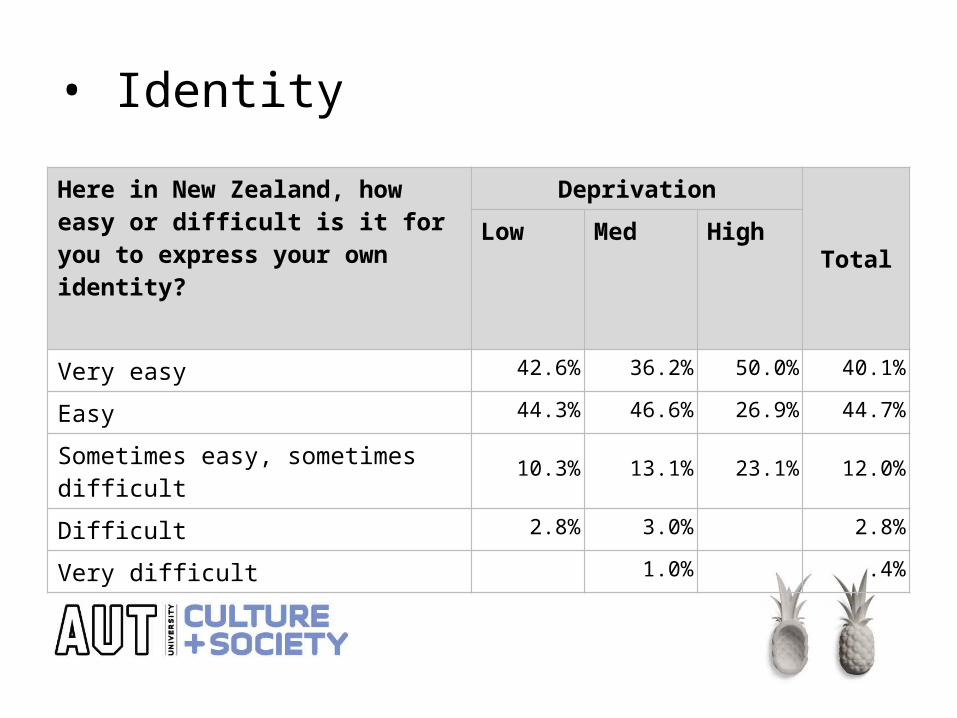
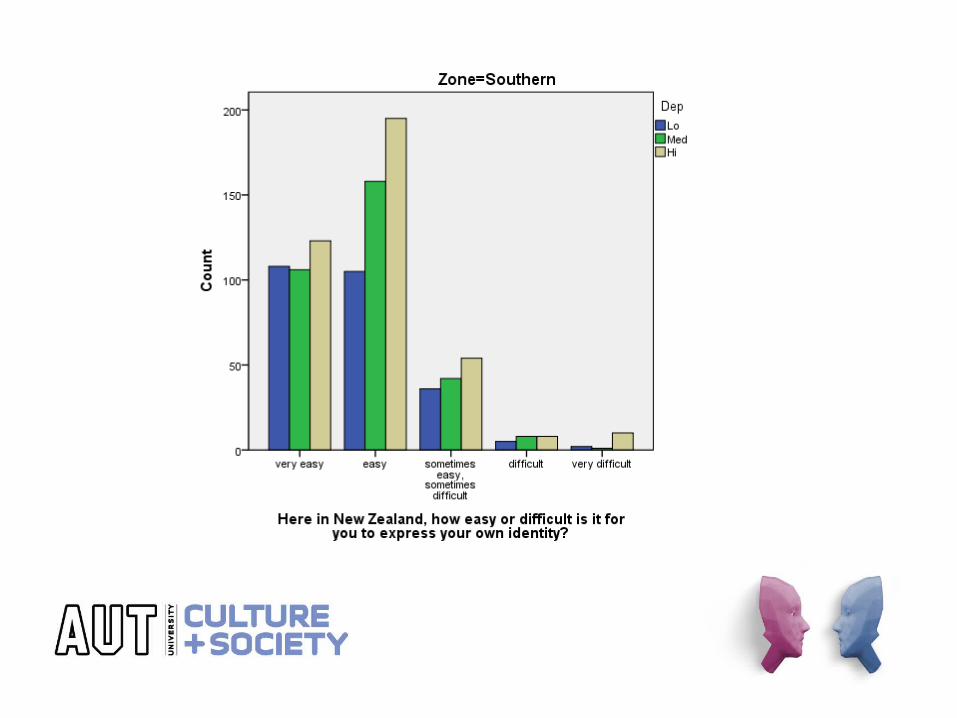
• Identity
Here in New Zealand, how easy or difficult is it for you to express your own identity?
Deprivation
TotalLow Med High
Very easy 42.6% 36.2% 50.0% 40.1%
Easy 44.3% 46.6% 26.9% 44.7%
Sometimes easy, sometimes difficult 10.3% 13.1% 23.1% 12.0%
Difficult 2.8% 3.0% 2.8%
Very difficult 1.0% .4%
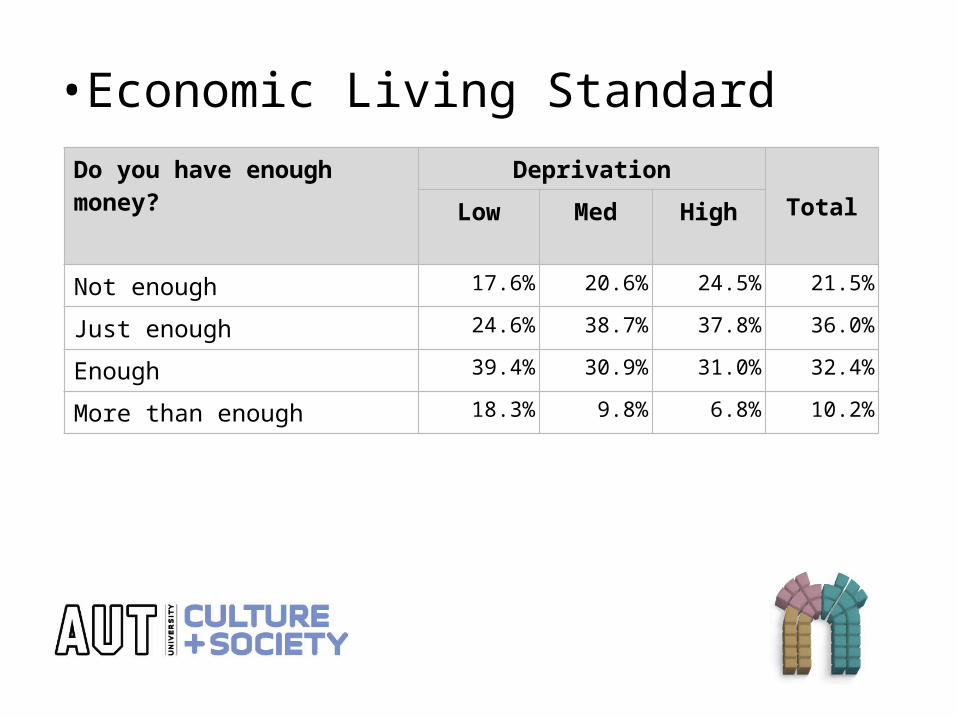
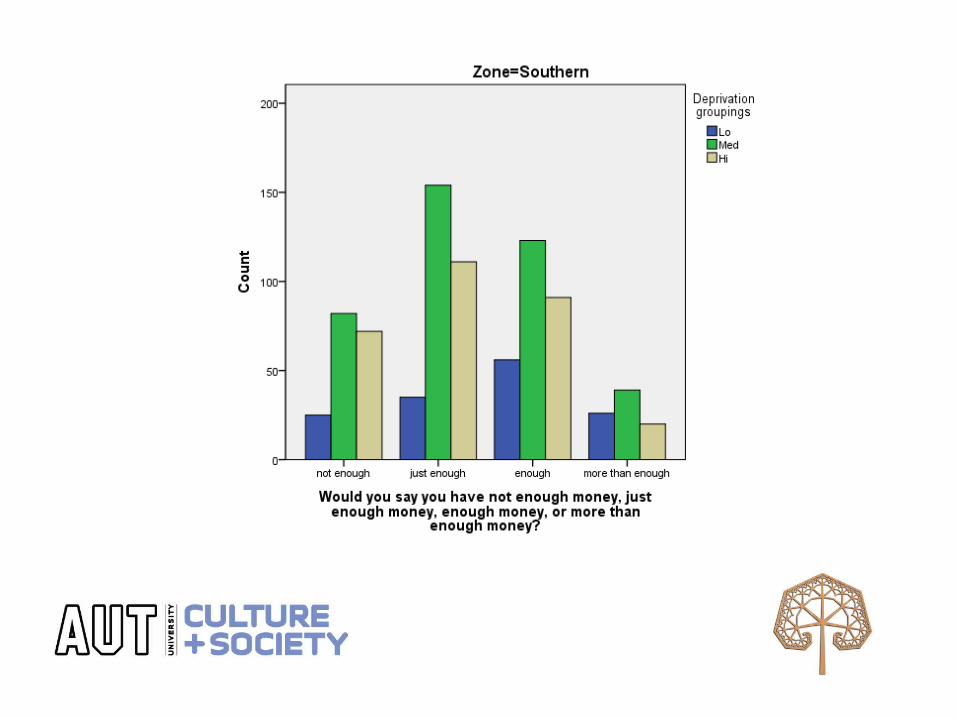
•Economic Living StandardDo you have enough money? Deprivation
TotalLow Med High
Not enough 17.6% 20.6% 24.5% 21.5%
Just enough 24.6% 38.7% 37.8% 36.0%
Enough 39.4% 30.9% 31.0% 32.4%
More than enough 18.3% 9.8% 6.8% 10.2%
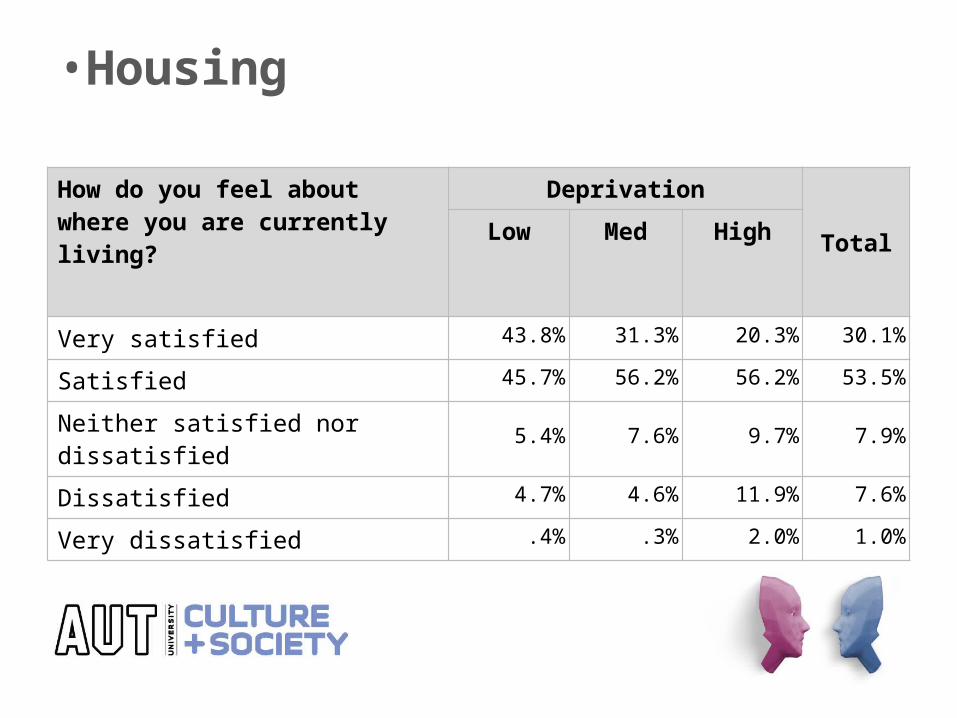
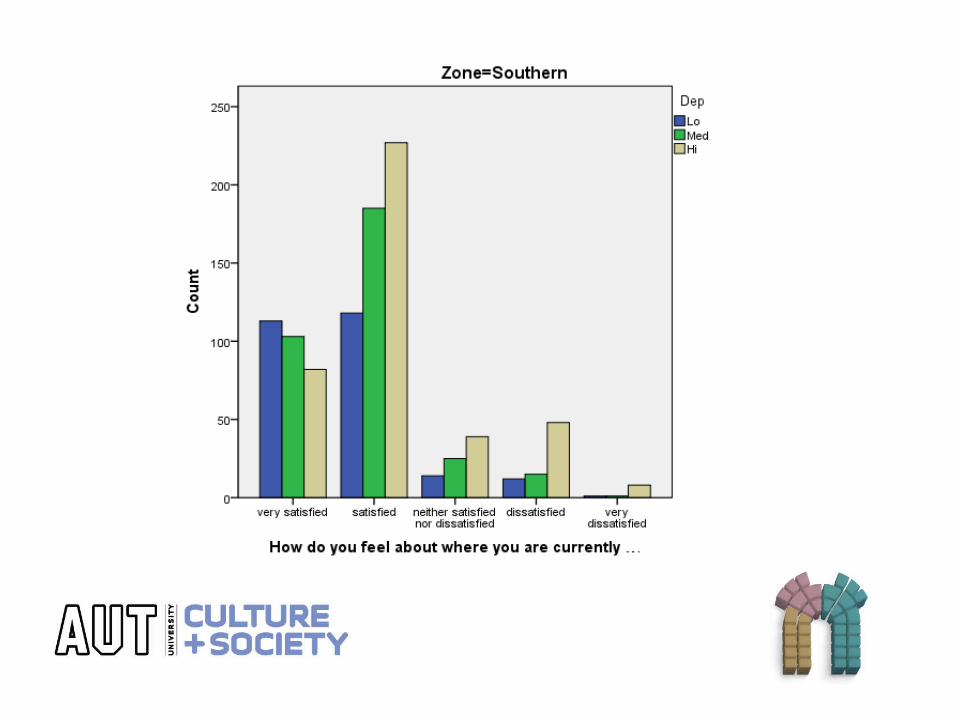
•Housing
How do you feel about where you are currently living?
DeprivationTotalLow Med High
Very satisfied 43.8% 31.3% 20.3% 30.1%
Satisfied 45.7% 56.2% 56.2% 53.5%
Neither satisfied nor dissatisfied 5.4% 7.6% 9.7% 7.9%
Dissatisfied 4.7% 4.6% 11.9% 7.6%
Very dissatisfied .4% .3% 2.0% 1.0%
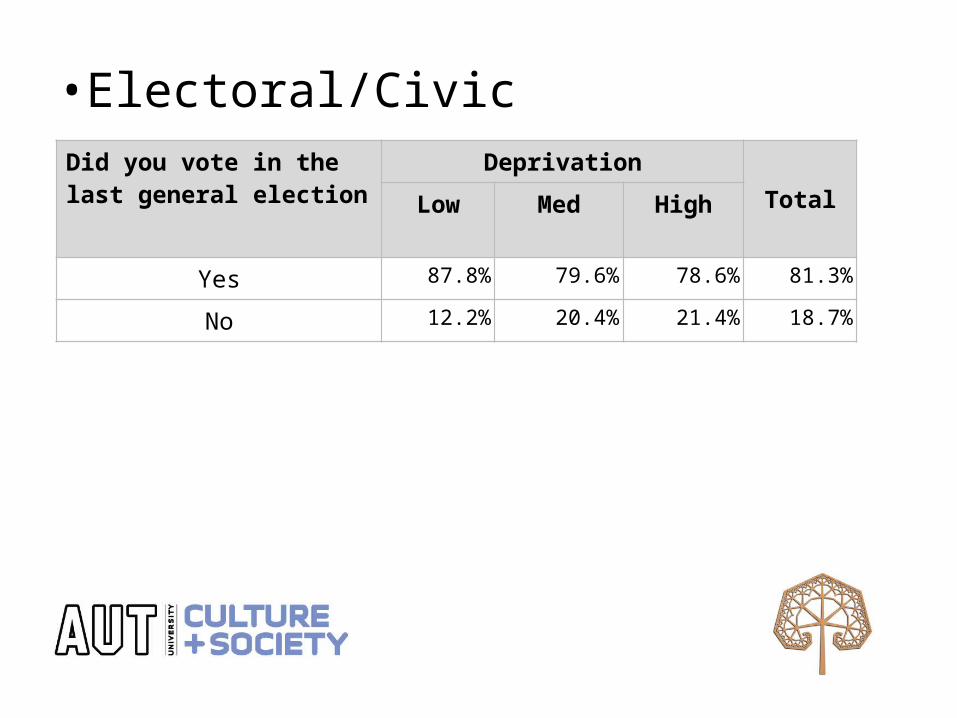
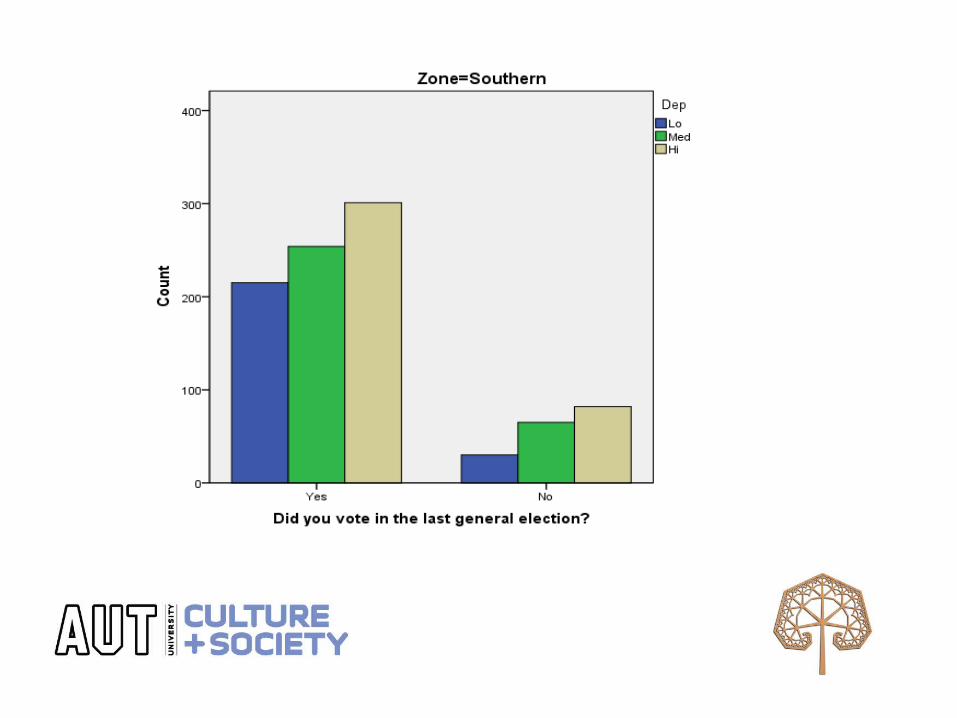
•Electoral/CivicDid you vote in the last general election
DeprivationTotalLow Med High
Yes 87.8% 79.6% 78.6% 81.3%
No 12.2% 20.4% 21.4% 18.7%
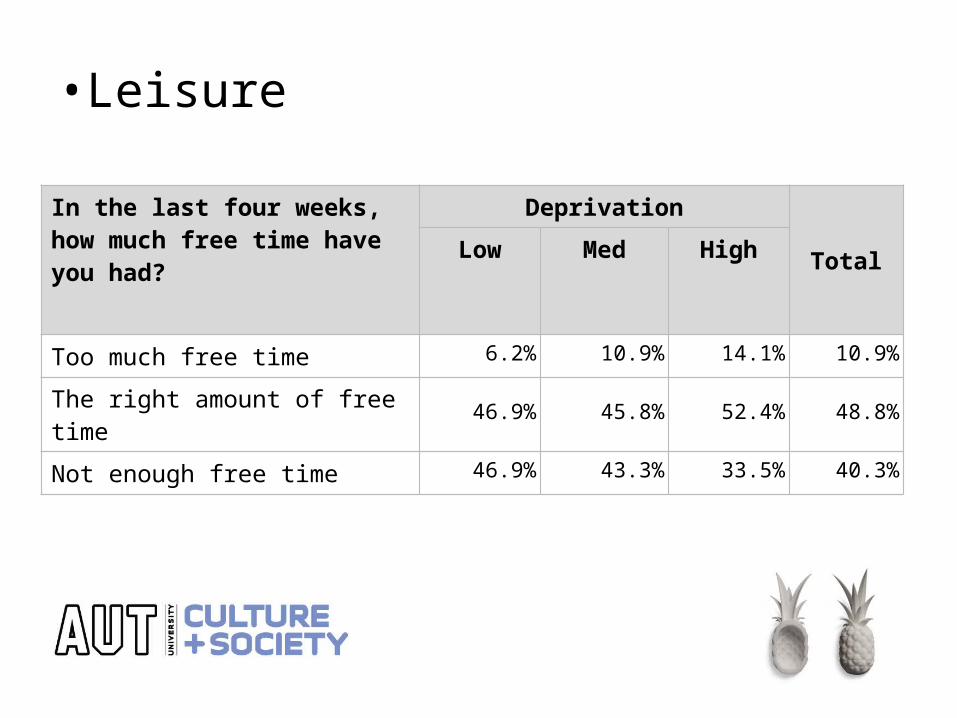
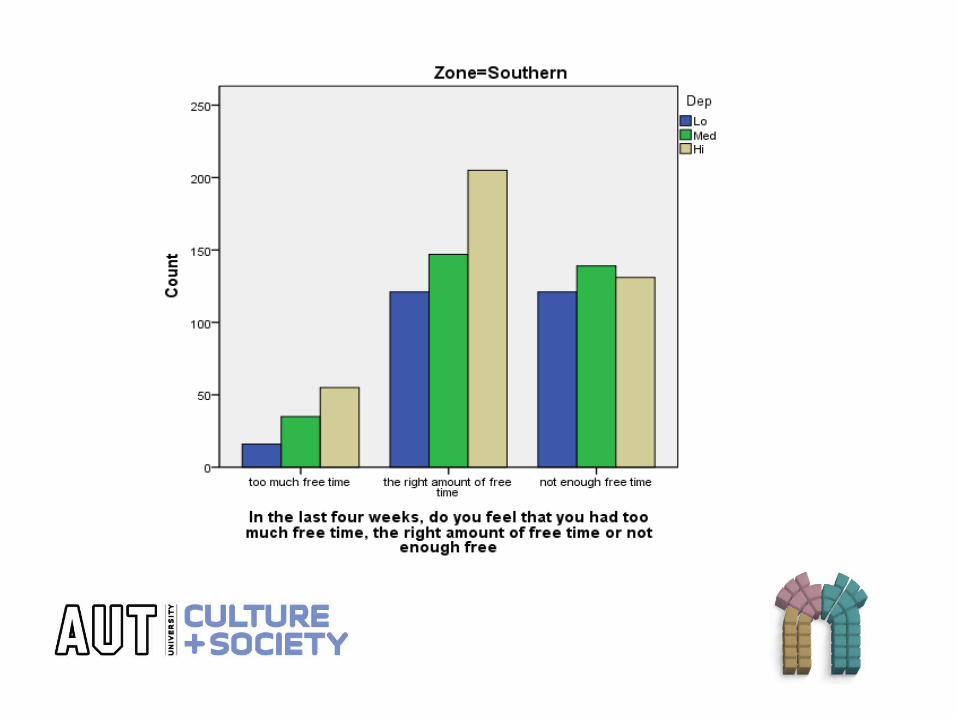
•Leisure
In the last four weeks, how much free time have you had?
DeprivationTotalLow Med High
Too much free time 6.2% 10.9% 14.1% 10.9%
The right amount of free time 46.9% 45.8% 52.4% 48.8%
Not enough free time 46.9% 43.3% 33.5% 40.3%
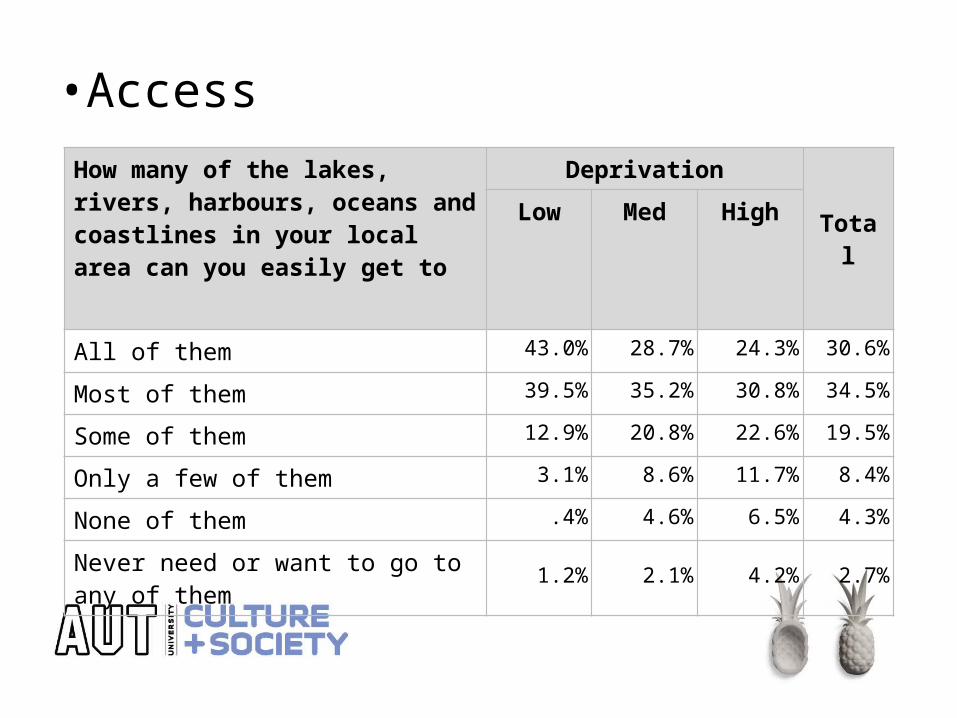
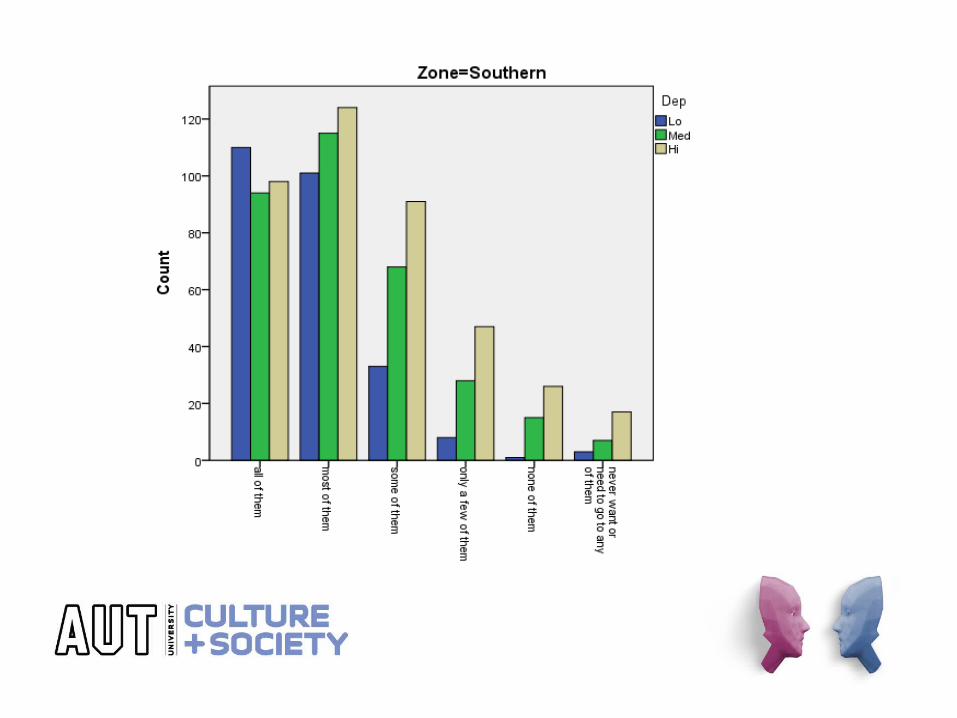
•AccessHow many of the lakes, rivers, harbours, oceans and coastlines in your local area can you easily get to
Deprivation
TotalLow Med High
All of them 43.0% 28.7% 24.3% 30.6%
Most of them 39.5% 35.2% 30.8% 34.5%
Some of them 12.9% 20.8% 22.6% 19.5%
Only a few of them 3.1% 8.6% 11.7% 8.4%
None of them .4% 4.6% 6.5% 4.3%
Never need or want to go to any of them 1.2% 2.1% 4.2% 2.7%
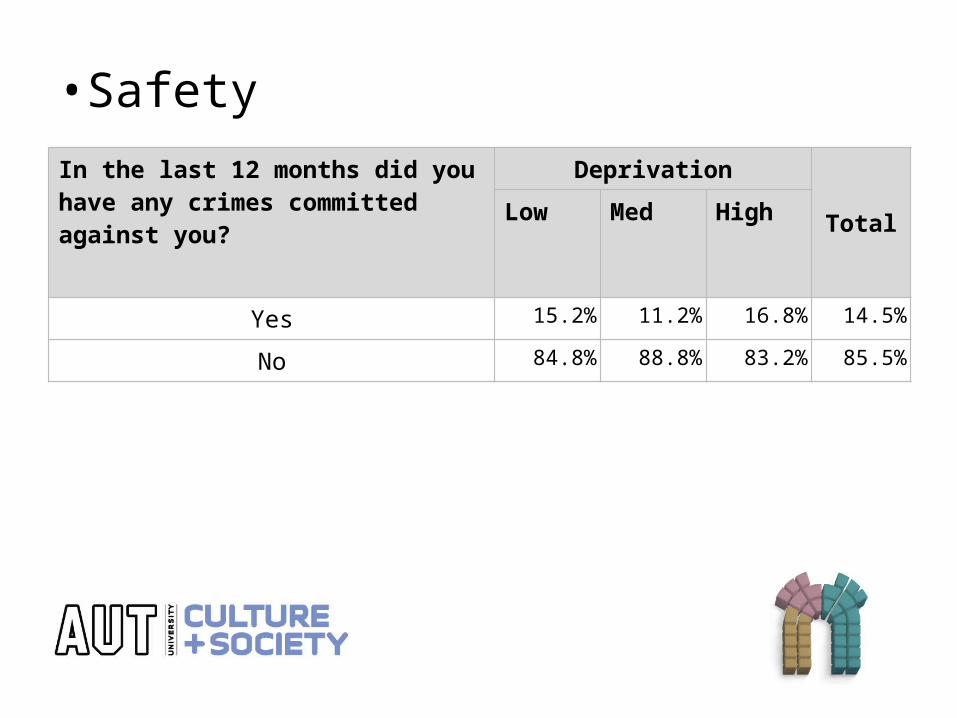
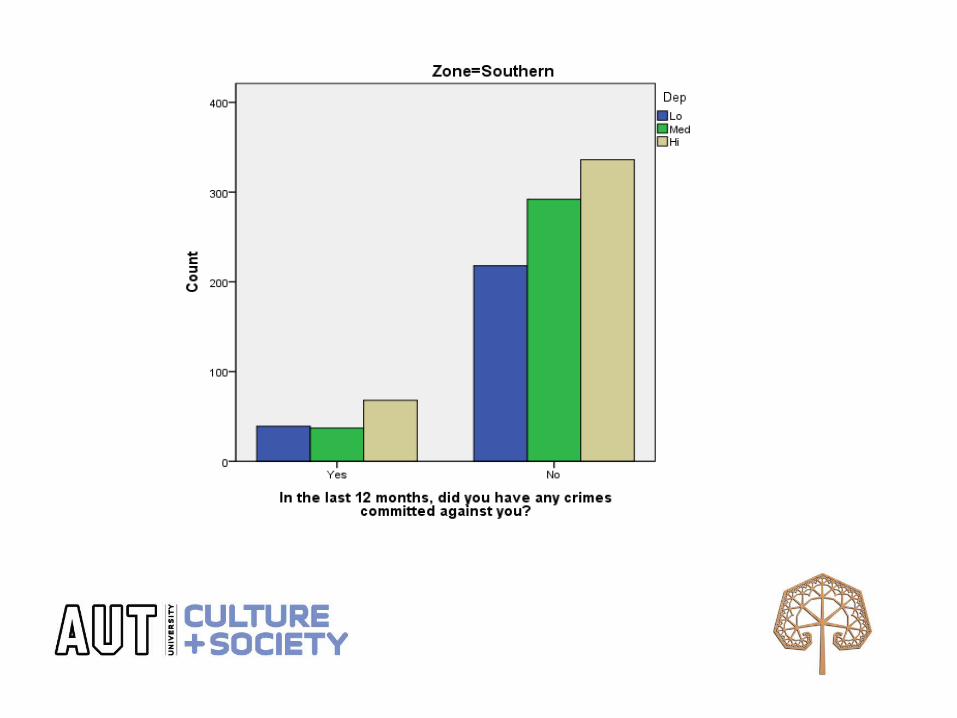
•SafetyIn the last 12 months did you have any crimes committed against you?
DeprivationTotalLow Med High
Yes 15.2% 11.2% 16.8% 14.5%
No 84.8% 88.8% 83.2% 85.5%
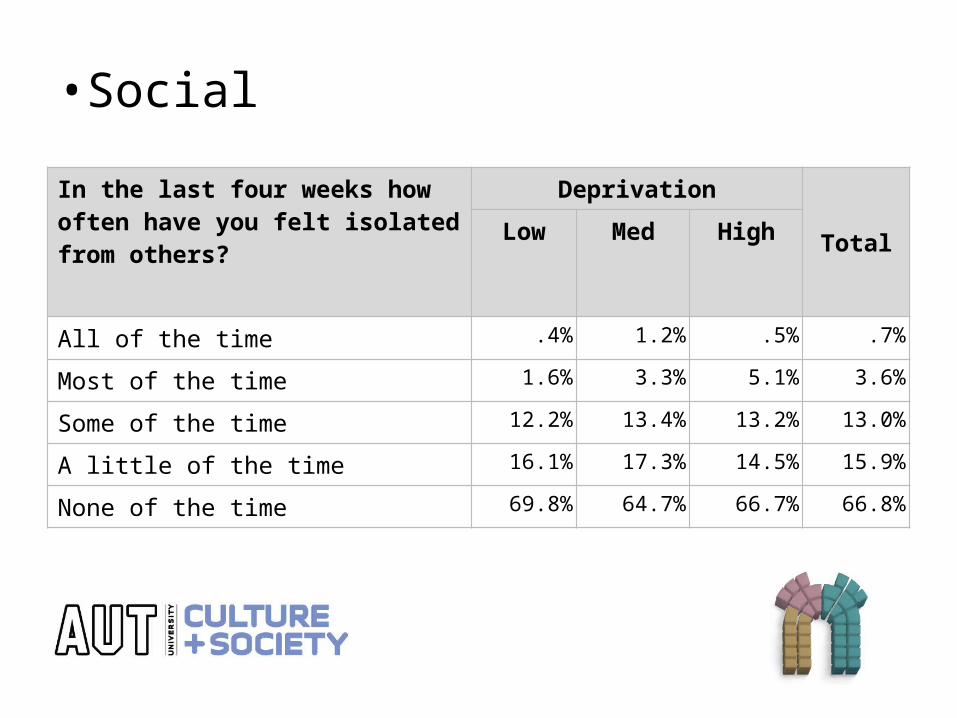
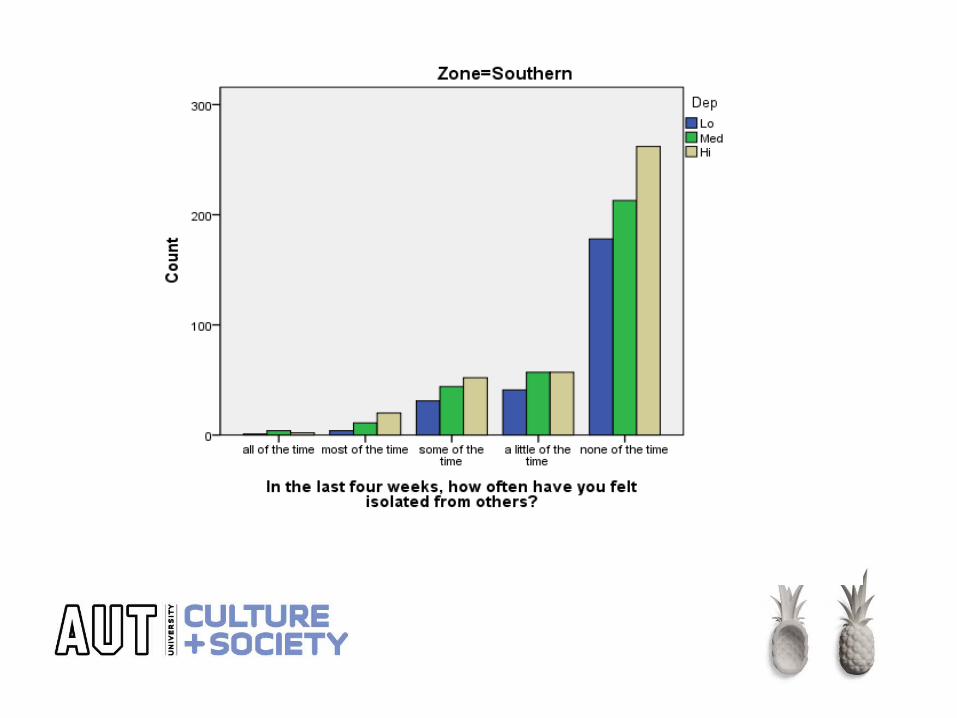
•Social
In the last four weeks how often have you felt isolated from others?
DeprivationTotalLow Med High
All of the time .4% 1.2% .5% .7%
Most of the time 1.6% 3.3% 5.1% 3.6%
Some of the time 12.2% 13.4% 13.2% 13.0%
A little of the time 16.1% 17.3% 14.5% 15.9%
None of the time 69.8% 64.7% 66.7% 66.8%
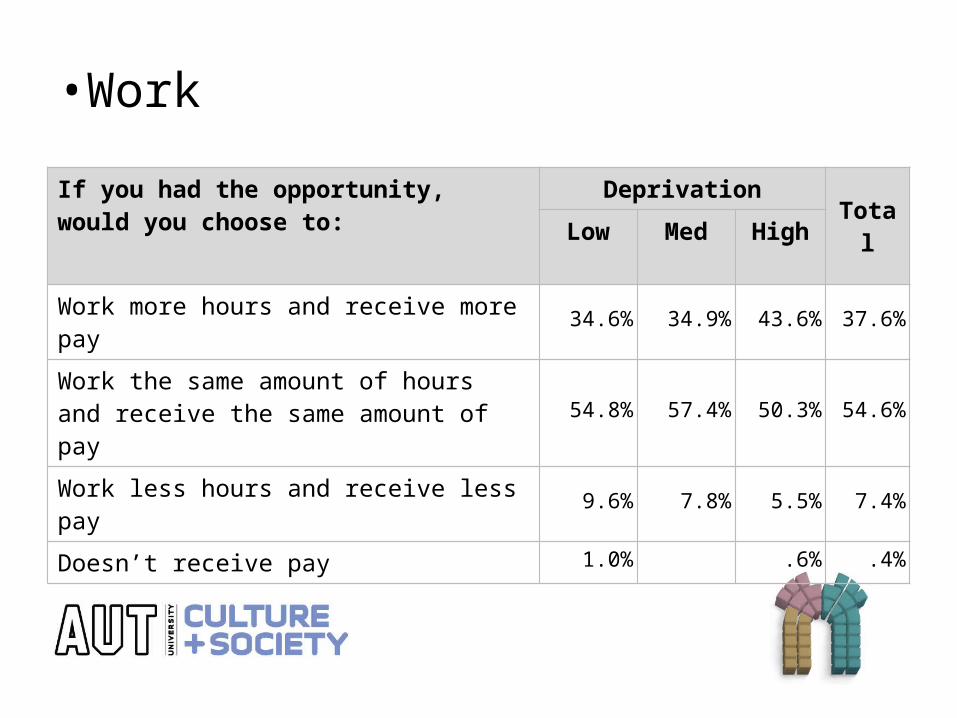
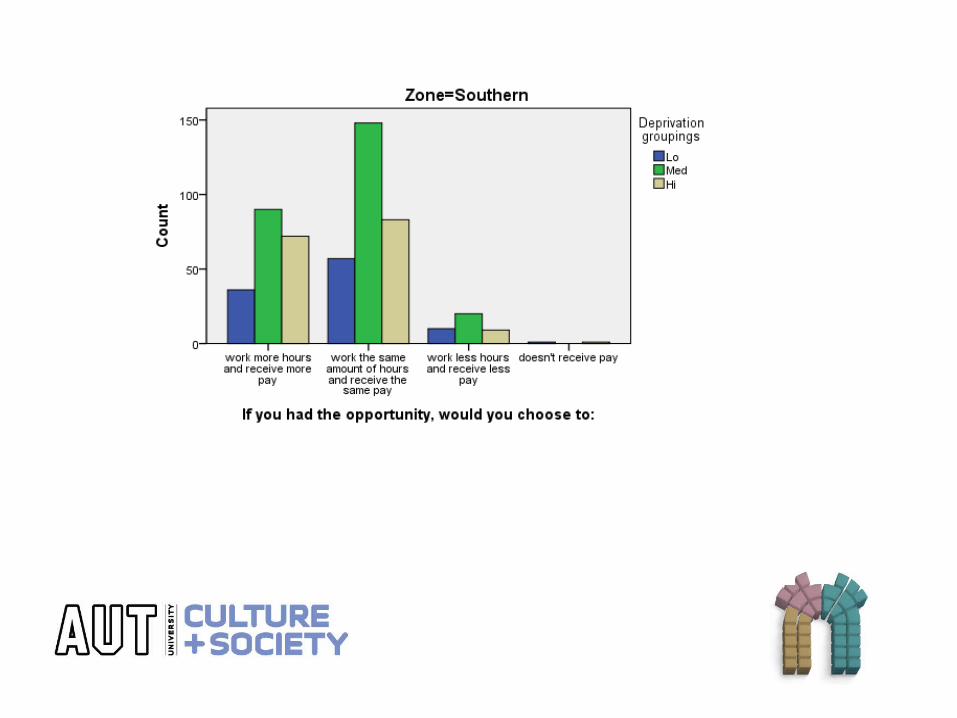
•Work
If you had the opportunity, would you choose to:
DeprivationTotalLow Med High
Work more hours and receive more pay 34.6% 34.9% 43.6% 37.6%
Work the same amount of hours and receive the same amount of pay 54.8% 57.4% 50.3% 54.6%
Work less hours and receive less pay 9.6% 7.8% 5.5% 7.4%
Doesn’t receive pay 1.0% .6% .4%
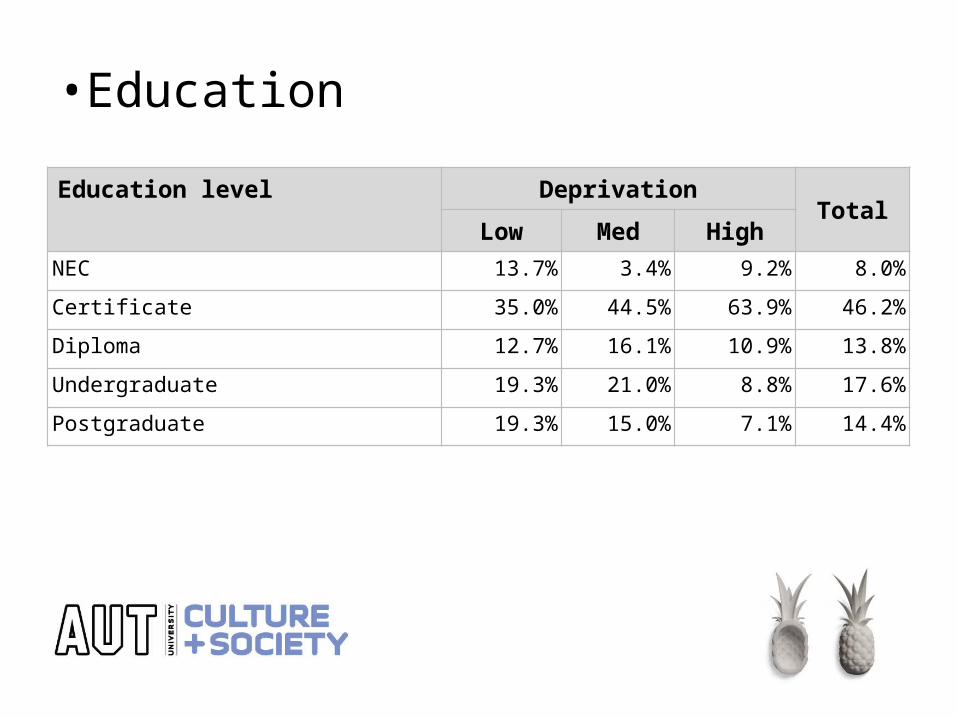
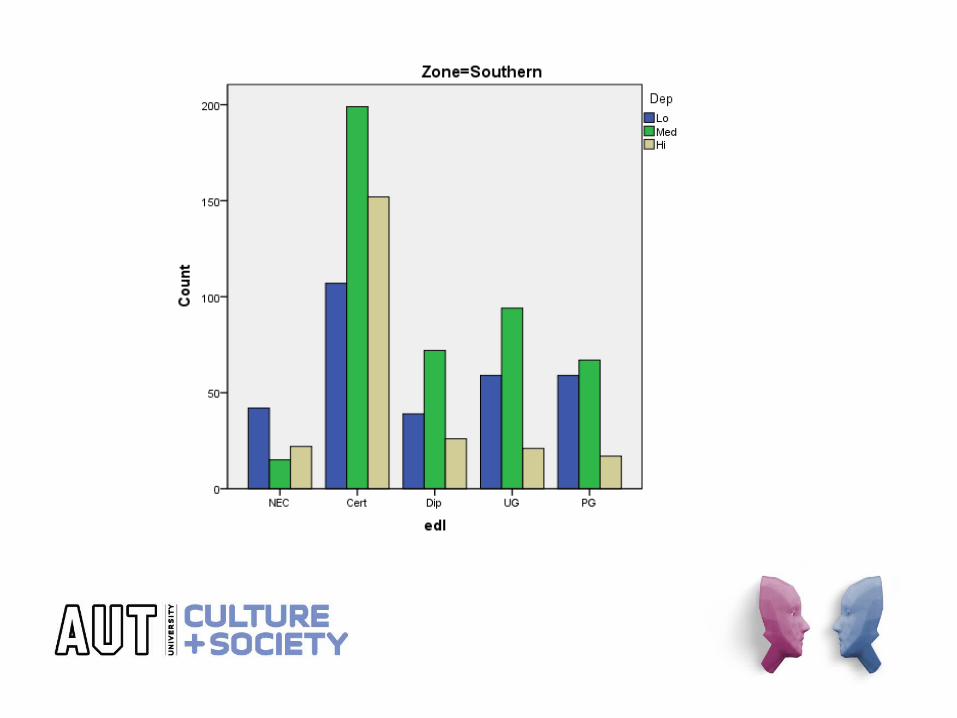
•Education
Education level DeprivationTotal
Low Med High
NEC 13.7% 3.4% 9.2% 8.0%
Certificate 35.0% 44.5% 63.9% 46.2%
Diploma 12.7% 16.1% 10.9% 13.8%
Undergraduate 19.3% 21.0% 8.8% 17.6%
Postgraduate 19.3% 15.0% 7.1% 14.4%