Embed Size (px)
Citation preview
Mapping Industrial Forests in Tropical Monsoon Asia
Jinwei Dong
University of Oklahoma
NASA LCLUC Science Team Meeting, April 18-19, 2016, Maryland
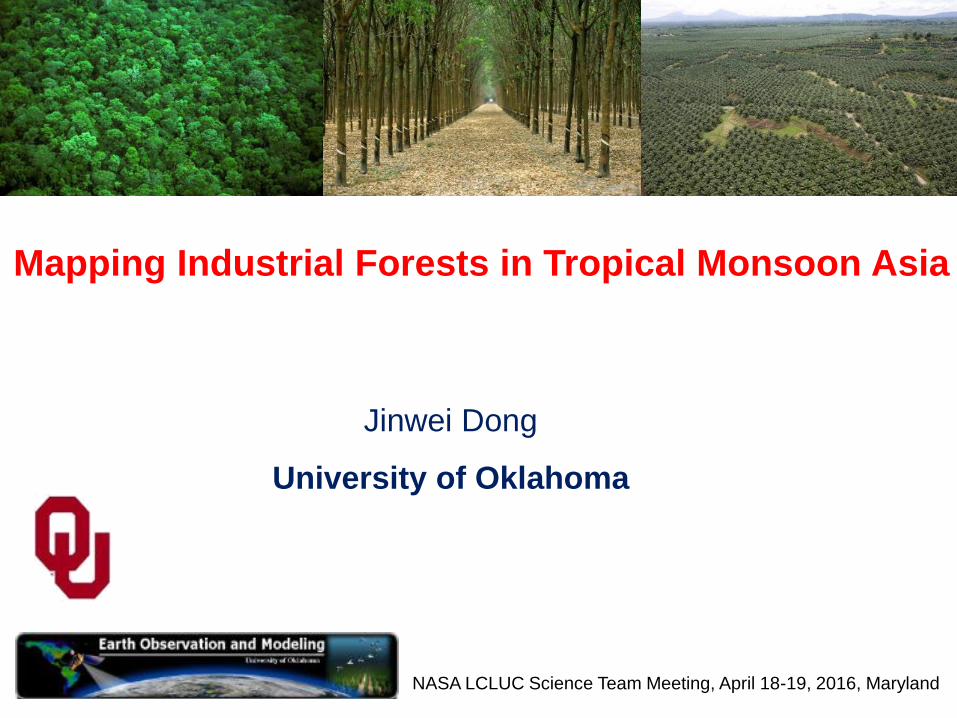
Acknowledgement :
A network of international collaborators for studying in tropical monsoon Asia
USA: Jinwei Dong, Xiangming Xiao, Yuanwei Qin, University of Oklahoma;
Williams Salas, Nathan Torbick, Applied Geosolutions, Inc.
Indonesia: Ketut Wikantika, Institute of Technology Bandung;
David Gaveau, Centre for International Forestry Research;
Laos: Thongmanivong Sithong, National University of Laos;
Malaysia: Khali Aziz, Forest Research Institute Malaysia;
Myanmar: Aung Lwin, Mandalay Technological Univ., Mandalay;
Philippine: Remedios Evangelista, Forest Management Bureau, Philippines;
Thailand: Manzul Hazarika, Asian Institute of Technology, Bangkok;
Vietnam: Nguyen Dinh Duong, Inst. of Geography, Hanoi;
China: Yong Pang, CAF;Bangqian Chen, Jun Ma, Fudan U; Weili Kou, SWFU
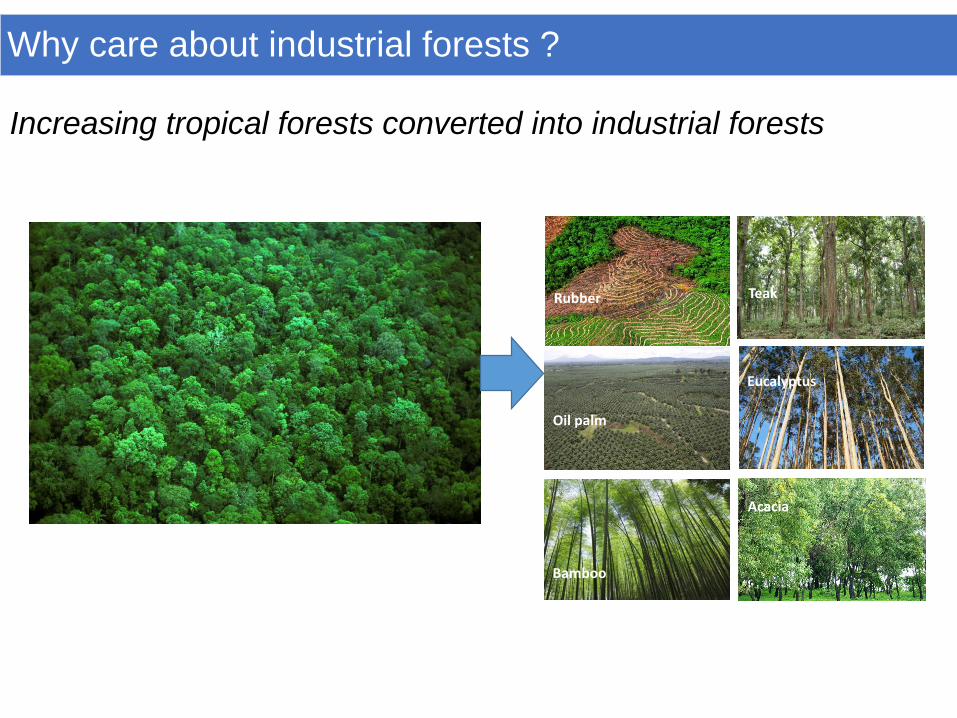
Rubber
Acacia
Eucalyptus
Teak
Bamboo
Oil palm
Increasing tropical forests converted into industrial forests
Why care about industrial forests ?
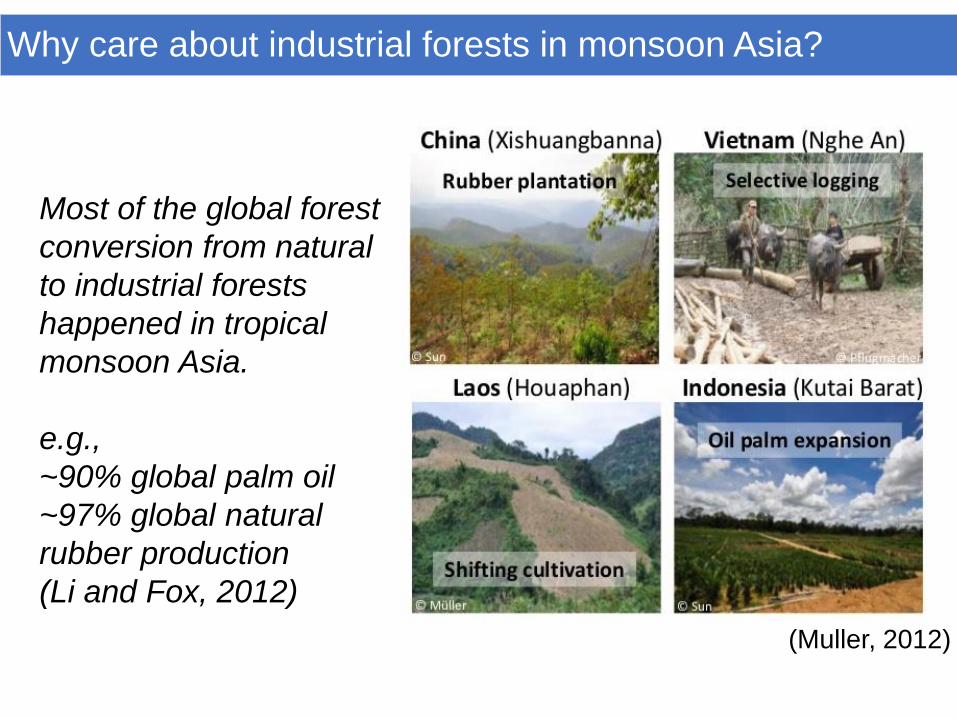
Most of the global forest
conversion from natural
to industrial forests
happened in tropical
monsoon Asia.
e.g.,
~90% global palm oil
~97% global natural
rubber production
(Li and Fox, 2012)
(Muller, 2012)
Why care about industrial forests in monsoon Asia?
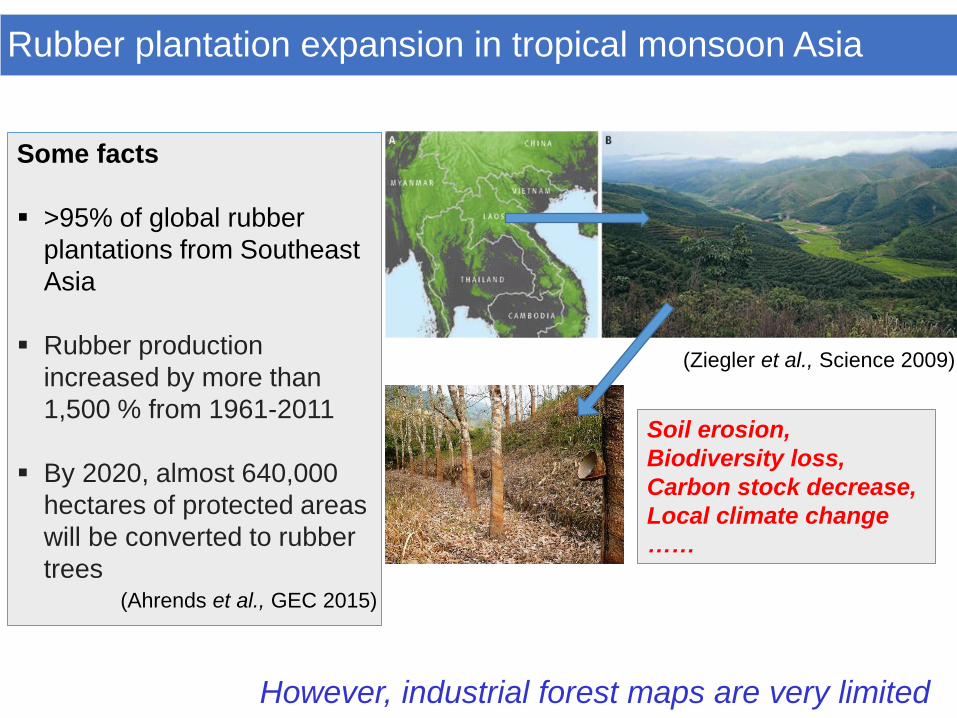
(Ziegler et al., Science 2009)
Soil erosion,
Biodiversity loss,
Carbon stock decrease,
Local climate change
……
Some facts
>95% of global rubber
plantations from Southeast
Asia
Rubber production
increased by more than
1,500 % from 1961-2011
By 2020, almost 640,000
hectares of protected areas
will be converted to rubber
trees(Ahrends et al., GEC 2015)
However, industrial forest maps are very limited
Rubber plantation expansion in tropical monsoon Asia
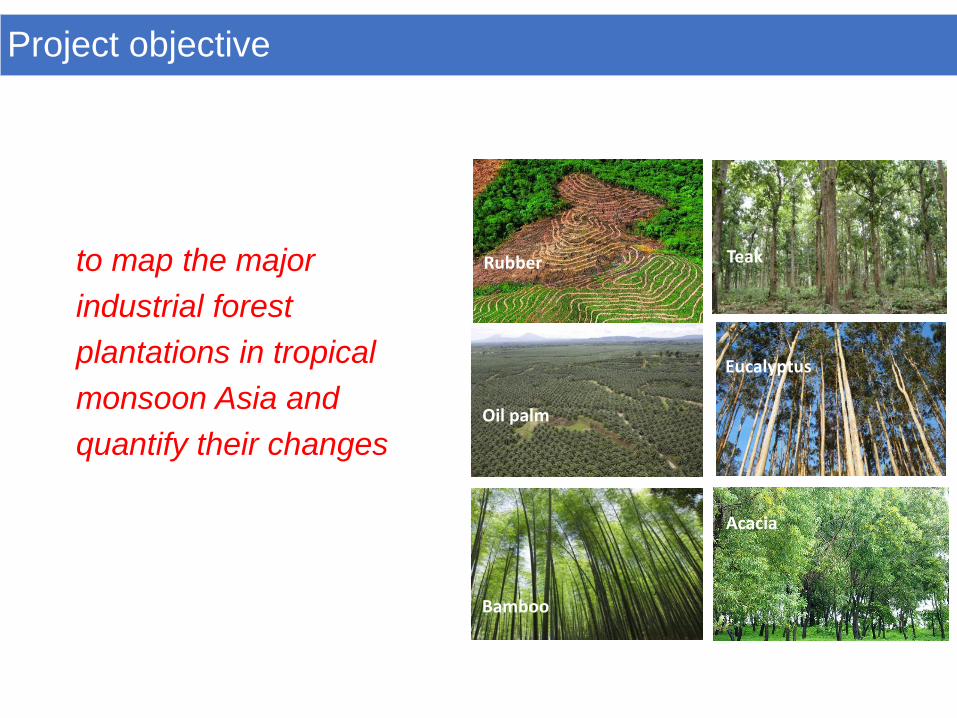
to map the major
industrial forest
plantations in tropical
monsoon Asia and
quantify their changes
Rubber
Acacia
Eucalyptus
Teak
Bamboo
Oil palm
Project objective
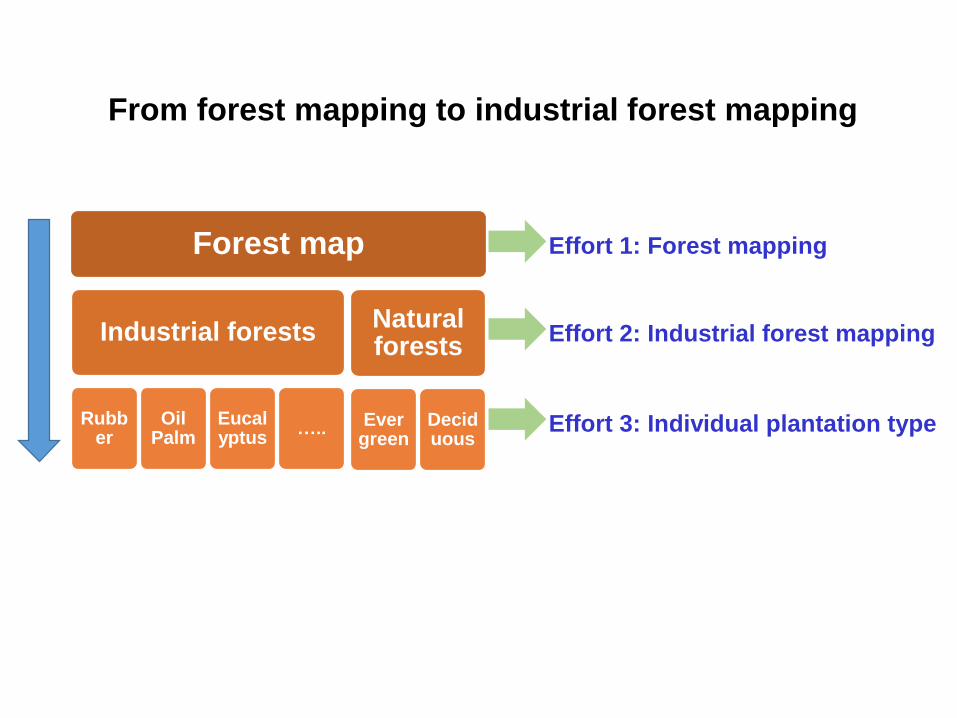
Forest map
Industrial forests
Rubber
Oil Palm
Eucalyptus
…..
Natural forests
Evergreen
Deciduous
Effort 1: Forest mapping
Effort 2: Industrial forest mapping
Effort 3: Individual plantation type
From forest mapping to industrial forest mapping
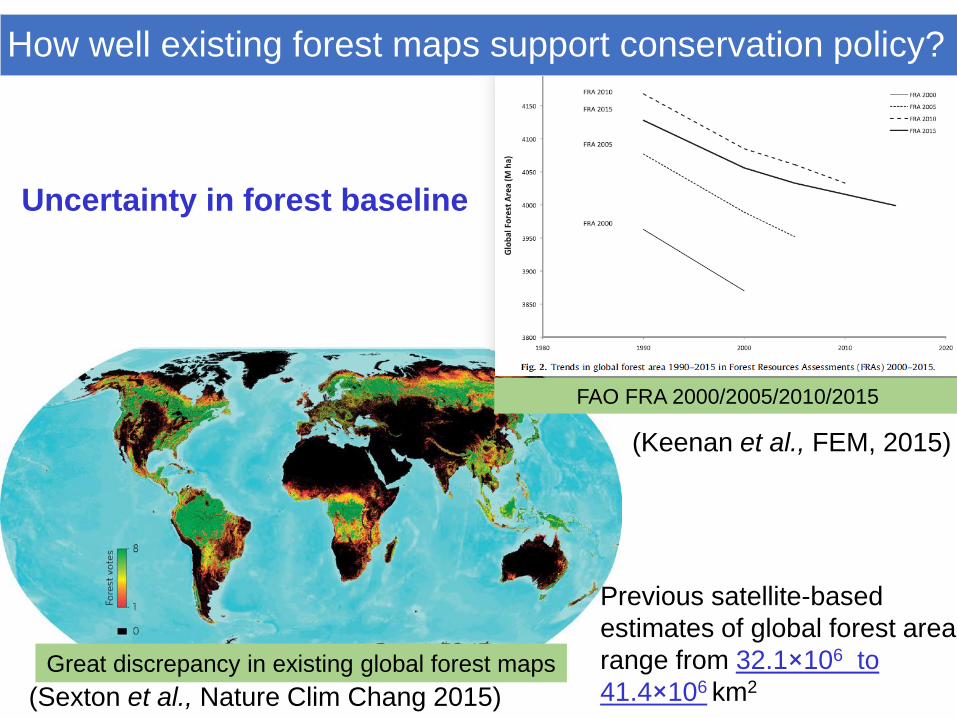
(Sexton et al., Nature Clim Chang 2015)
Great discrepancy in existing global forest maps
(Keenan et al., FEM, 2015)
FAO FRA 2000/2005/2010/2015
Uncertainty in forest baseline
Previous satellite-based
estimates of global forest area
range from 32.1×10⁶ to
41.4×10⁶ km2
How well existing forest maps support conservation policy?
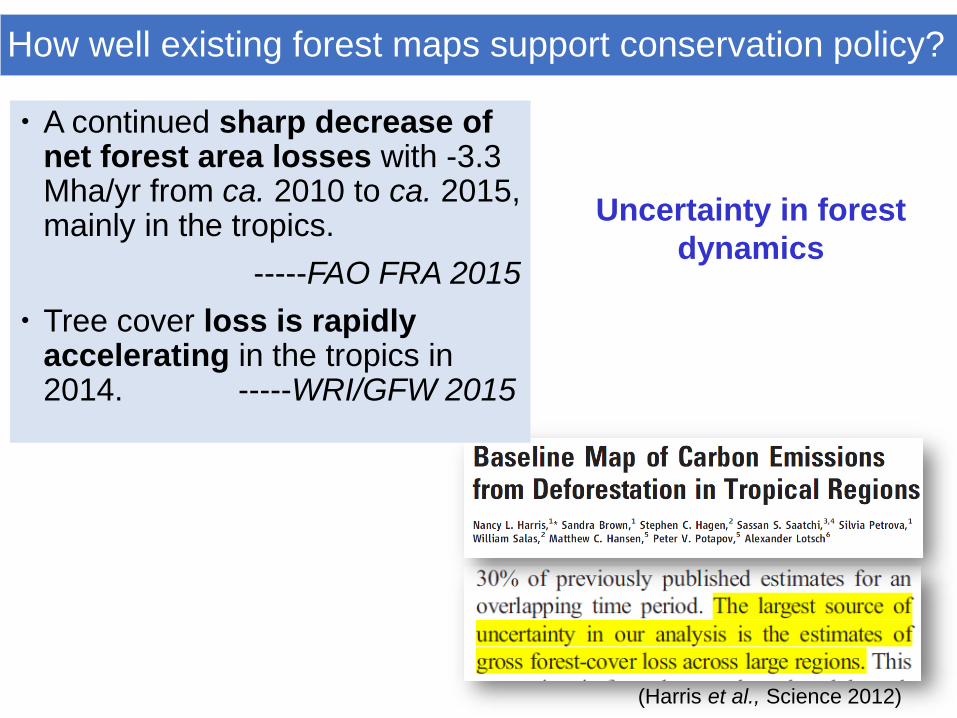
(Harris et al., Science 2012)
A continued sharp decrease of net forest area losses with -3.3 Mha/yr from ca. 2010 to ca. 2015, mainly in the tropics.
-----FAO FRA 2015
Tree cover loss is rapidly accelerating in the tropics in 2014. -----WRI/GFW 2015
Uncertainty in forest
dynamics
How well existing forest maps support conservation policy?
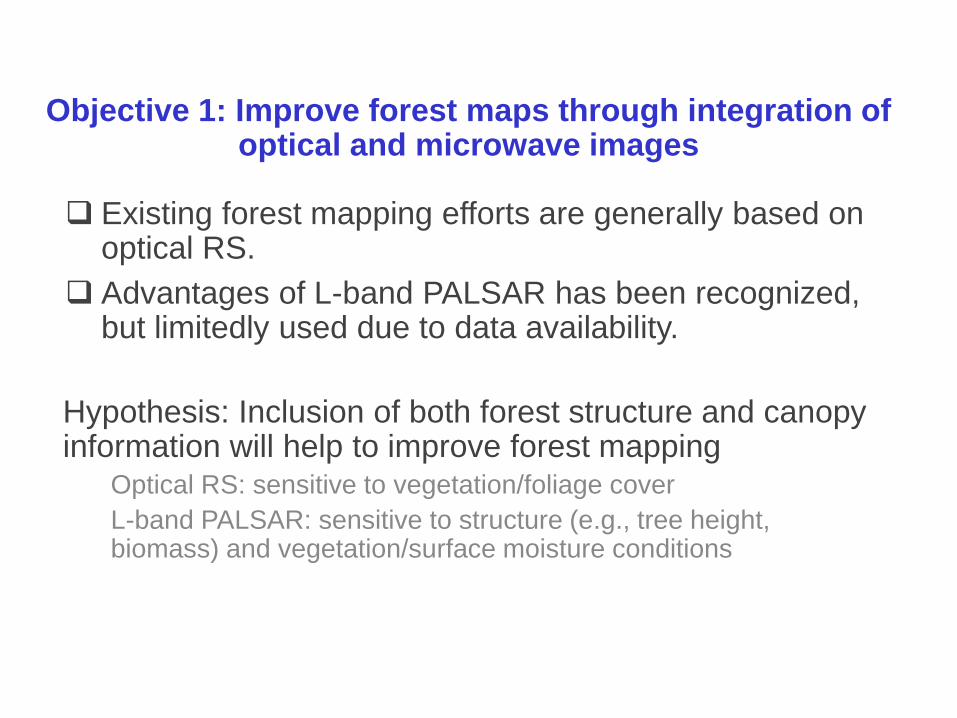
Objective 1: Improve forest maps through integration of optical and microwave images
Existing forest mapping efforts are generally based on optical RS.
Advantages of L-band PALSAR has been recognized, but limitedly used due to data availability.
Hypothesis: Inclusion of both forest structure and canopy information will help to improve forest mapping
Optical RS: sensitive to vegetation/foliage cover
L-band PALSAR: sensitive to structure (e.g., tree height, biomass) and vegetation/surface moisture conditions
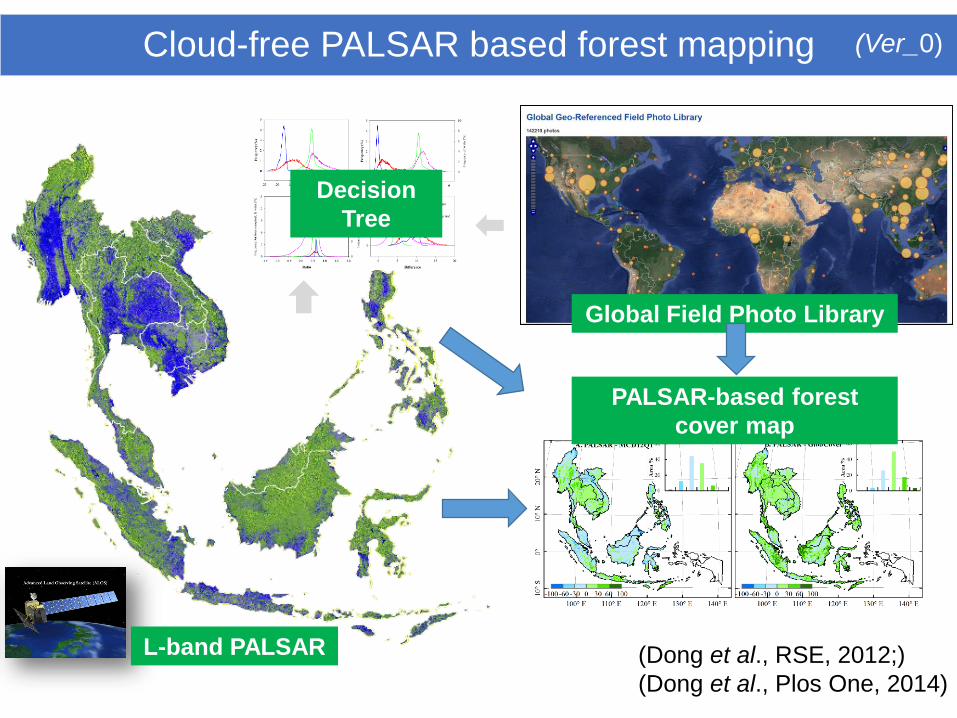
L-band PALSAR
Decision
Tree
Global Field Photo Library
PALSAR-based forest
cover map
(Dong et al., RSE, 2012;)
(Dong et al., Plos One, 2014)
Cloud-free PALSAR based forest mapping (Ver_0)
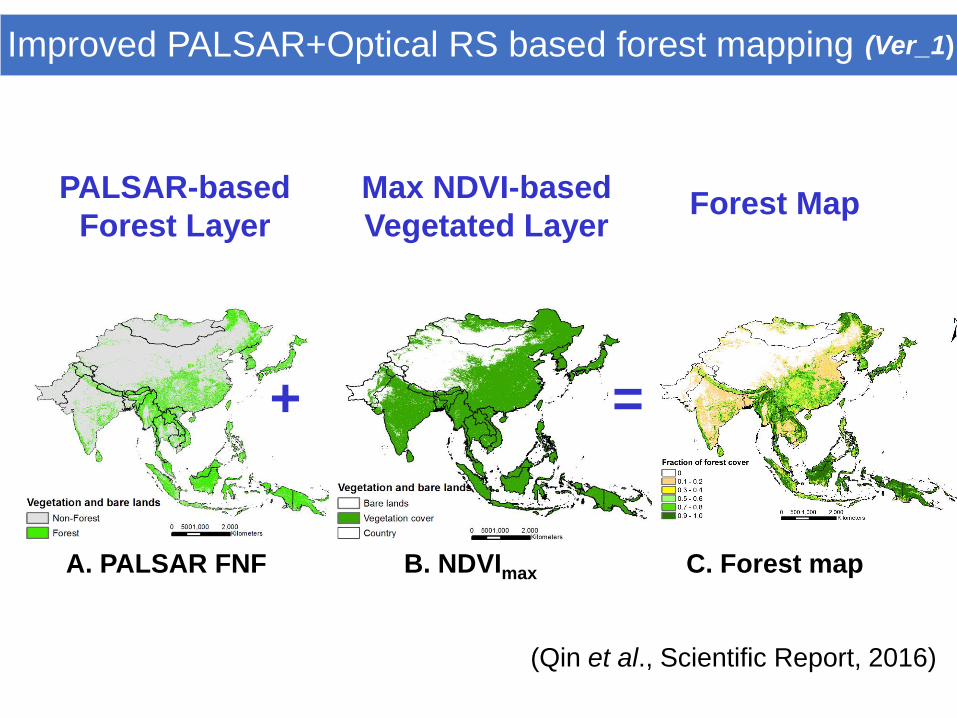
Improved PALSAR+Optical RS based forest mapping (Ver_1)
(Qin et al., Scientific Report, 2016)
PALSAR-based
Forest Layer
Max NDVI-based
Vegetated LayerForest Map
B. NDVImax
+ =
A. PALSAR FNF C. Forest map
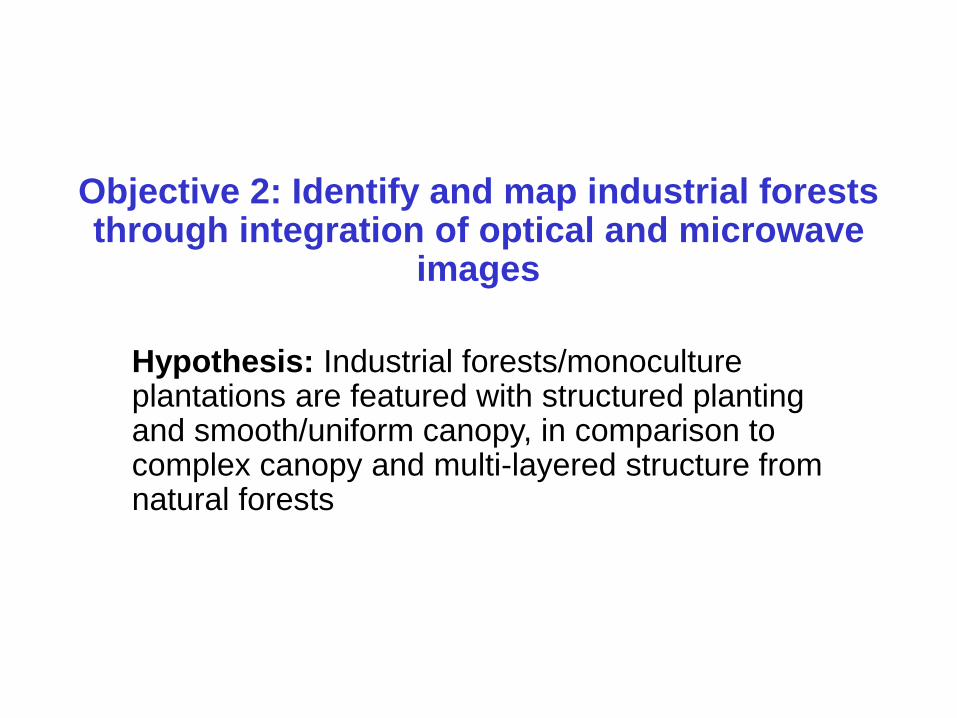
Objective 2: Identify and map industrial forests through integration of optical and microwave
images
Hypothesis: Industrial forests/monoculture plantations are featured with structured planting and smooth/uniform canopy, in comparison to complex canopy and multi-layered structure from natural forests
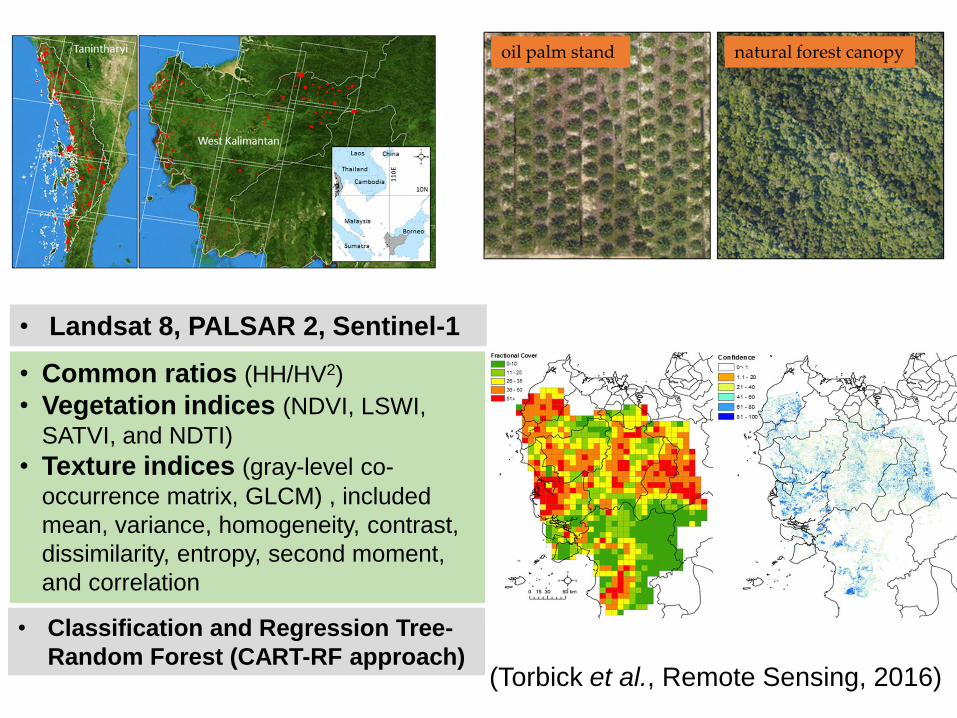
• Common ratios (HH/HV2)
• Vegetation indices (NDVI, LSWI,
SATVI, and NDTI)
• Texture indices (gray-level co-
occurrence matrix, GLCM) , included
mean, variance, homogeneity, contrast,
dissimilarity, entropy, second moment,
and correlation
• Classification and Regression Tree-
Random Forest (CART-RF approach)
oil palm stand natural forest canopy
(Torbick et al., Remote Sensing, 2016)
• Landsat 8, PALSAR 2, Sentinel-1
Objective 3: Identify and map individual industrial forest types through integration of
optical and microwave images
Hypothesis: Deciduous rubber plantations have unique phenology feature in its canopy, which can be tracked by time series optical images.
ND
VI
0.2
0.4
0.6
0.8
1.0
EV
I
0.2
0.4
0.6
0.8
LS
WI
-0.2
0.0
0.2
0.4
0.6
DOY
0 50 100 150 200 250 300 350
NIR
0.1
0.2
0.3
0.4
0.5
0.6
DOY
0 50 100 150 200 250 300 350
a) Rubber b) Natural forest
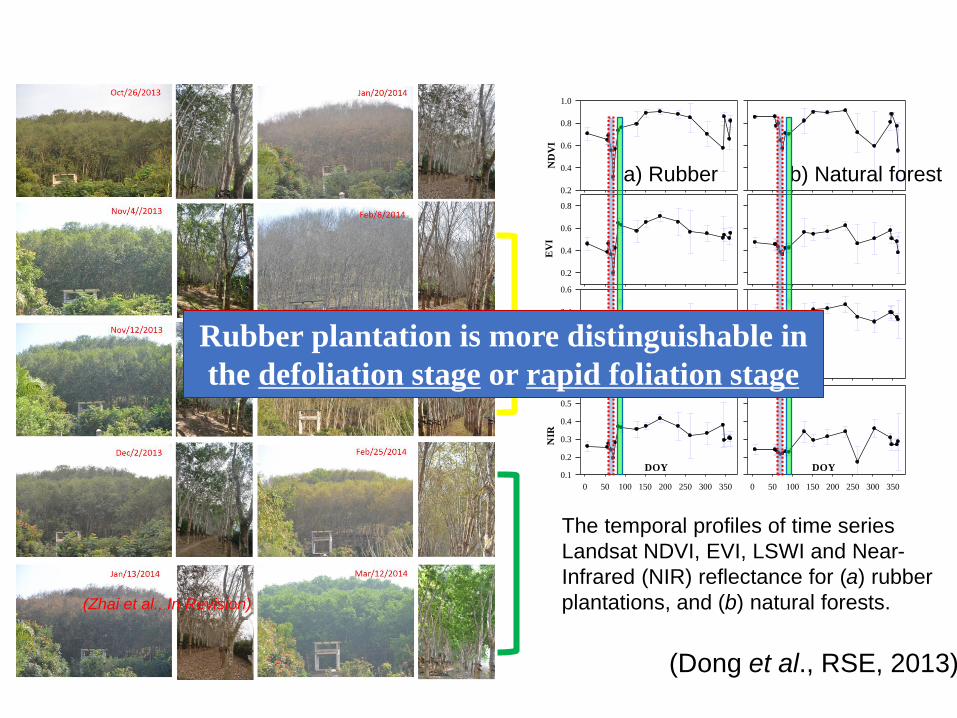
The temporal profiles of time series
Landsat NDVI, EVI, LSWI and Near-
Infrared (NIR) reflectance for (a) rubber
plantations, and (b) natural forests.
(Dong et al., RSE, 2013)
Rubber plantation is more distinguishable in
the defoliation stage or rapid foliation stage
(Zhai et al., In Revision)
Sep.
Nov.
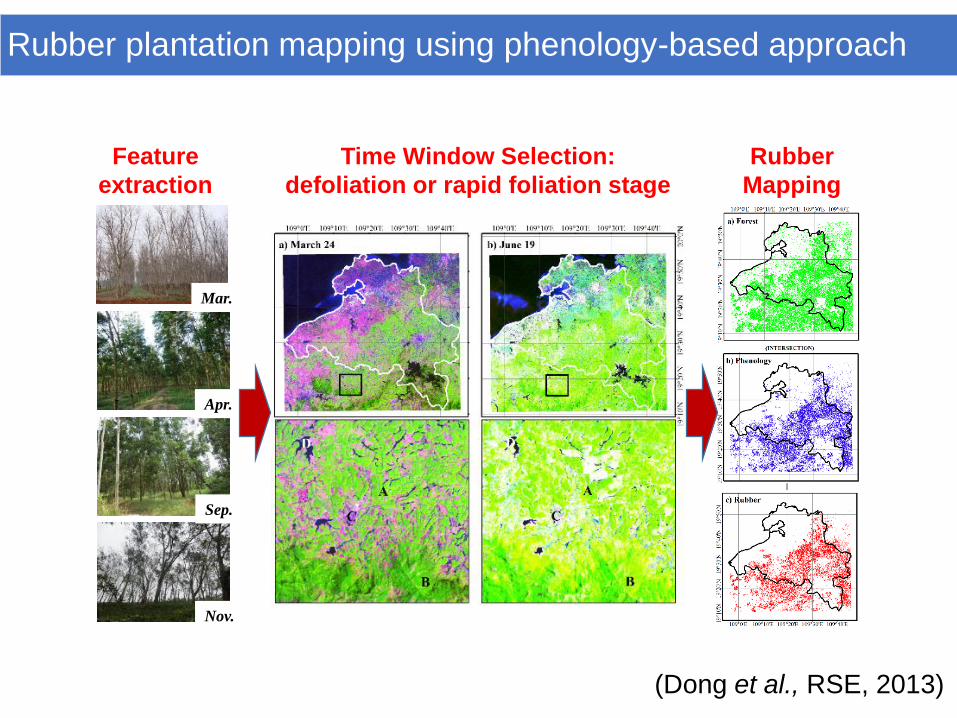
Mar.
Apr.
Time Window Selection:
defoliation or rapid foliation stage
Feature
extraction
Rubber
Mapping
(Dong et al., RSE, 2013)
Rubber plantation mapping using phenology-based approach
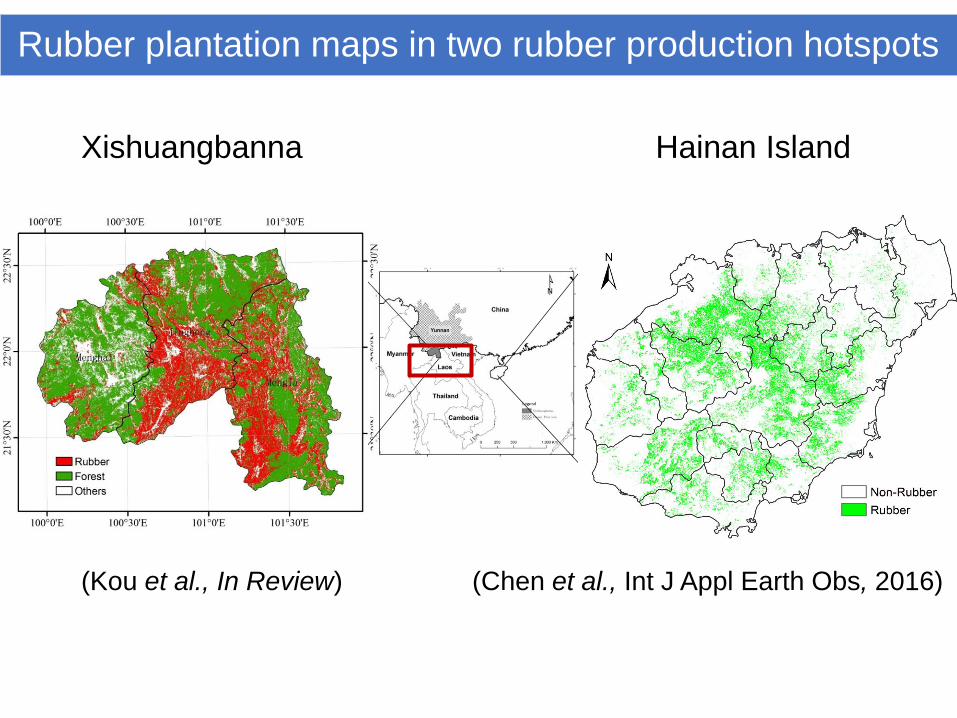
(Chen et al., Int J Appl Earth Obs, 2016)(Kou et al., In Review)
Xishuangbanna Hainan Island
Rubber plantation maps in two rubber production hotspots
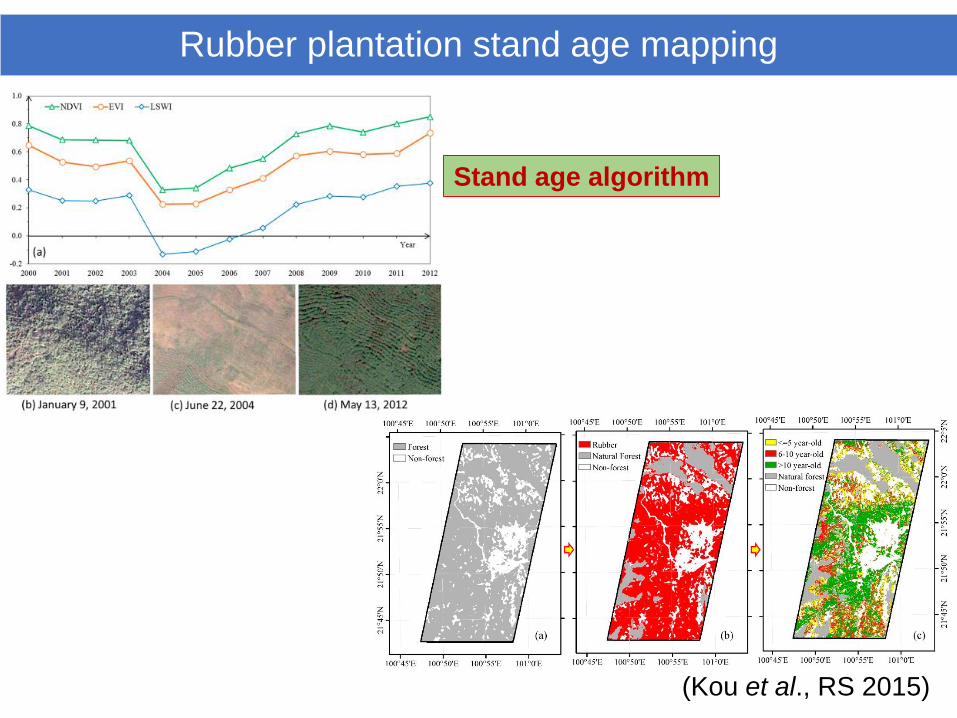
(Kou et al., RS 2015)
Stand age algorithm
Rubber plantation stand age mapping
Multi-SensorsLandsat/PALSAR
Multi-VariablesSpectral/Structure/
Phenology
Multi-temporal
DataAll good
observations
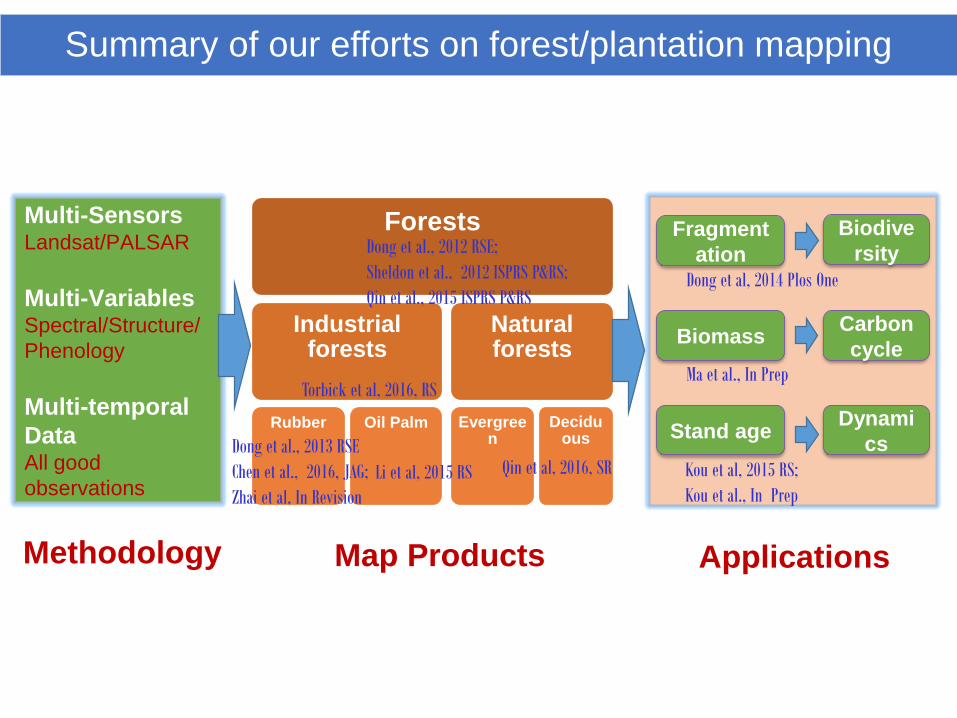
Methodology
Forests
Industrial forests
Rubber Oil Palm
Natural forests
Evergreen
Deciduous
Map Products
Fragment
ation
Biomass
Stand age
Biodive
rsity
Carbon
cycle
Dynami
cs
Applications
Li et al, 2015 RS
Dong et al., 2012 RSE;
Sheldon et al., 2012 ISPRS P&RS;
Qin et al., 2015 ISPRS P&RS
Dong et al., 2013 RSE
Chen et al., 2016, JAG;
Zhai et al, In Revision
Dong et al, 2014 Plos One
Qin et al, 2016, SR
Ma et al., In Prep
Kou et al, 2015 RS;
Kou et al., In Prep
Torbick et al, 2016, RS
Summary of our efforts on forest/plantation mapping
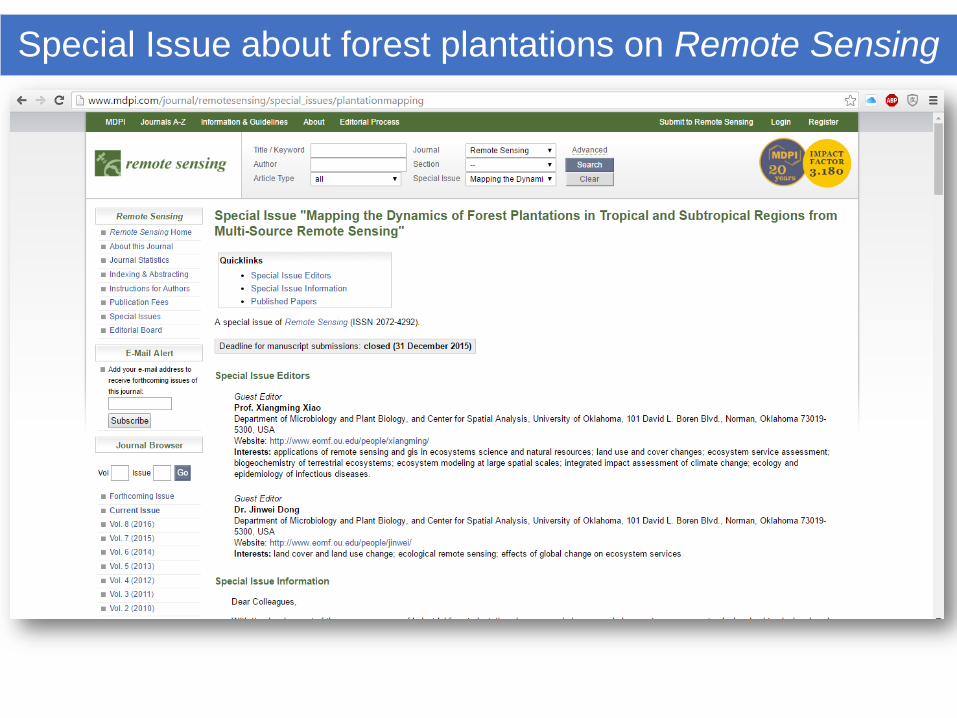
Special Issue about forest plantations on Remote Sensing
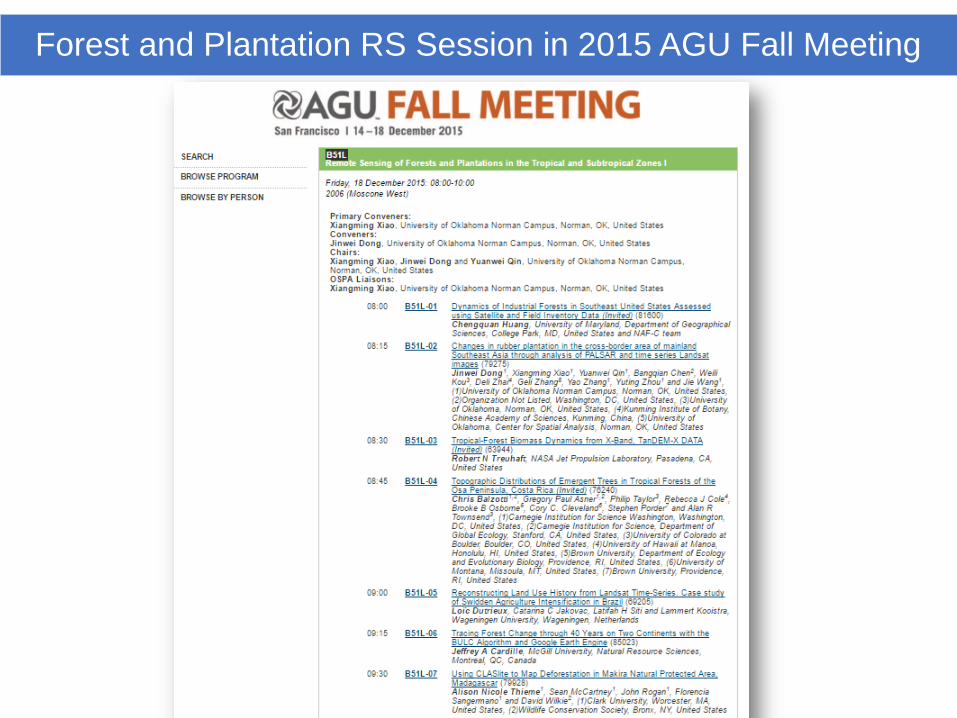
Forest and Plantation RS Session in 2015 AGU Fall Meeting
Looking
East
Looking
South
Looking
West
Looking
North
Field West
North
East
Down
South
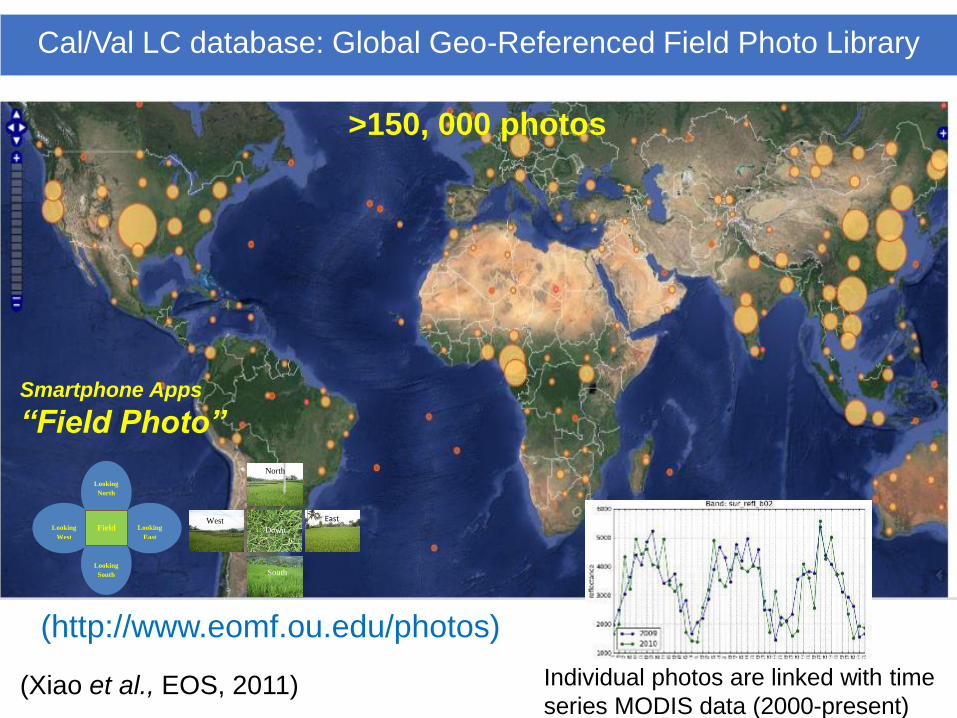
(http://www.eomf.ou.edu/photos)
Individual photos are linked with time
series MODIS data (2000-present)
>150, 000 photos
(Xiao et al., EOS, 2011)
Smartphone Apps
“Field Photo”
Cal/Val LC database: Global Geo-Referenced Field Photo Library
1. Cloud-free PALSAR data can effectively contribute to the existing forest mapping efforts. For example, the combined Landsat/PALSAR-based forest mapping approach is more robust.
2. Unique phenology signature makes rubber plantation identification possible in a simple way; however, its extensive application in other regions and other species should consider different factors.
3. Emerging data sources (e.g., Landsat 8, Sentinel-1, Sentinel-2, and PALSAR-1/2) provide unprecedented opportunities for industrial forest mapping; however, new algorithms and computing technologies (e.g., cloud computing) are needed to make full use of these big data.
Summary
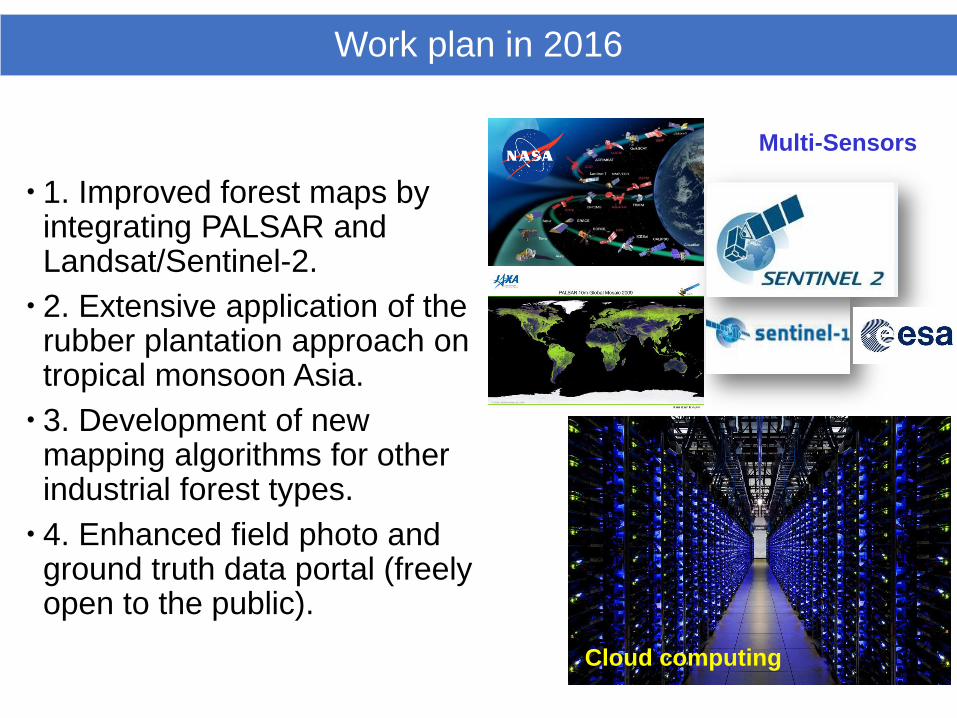
1. Improved forest maps by integrating PALSAR and Landsat/Sentinel-2.
2. Extensive application of the rubber plantation approach on tropical monsoon Asia.
3. Development of new mapping algorithms for other industrial forest types.
4. Enhanced field photo and ground truth data portal (freely open to the public).
Multi-Sensors
Cloud computing
Work plan in 2016
Questions?
http://eomf.ou.edu