Embed Size (px)
Citation preview
Data bank
Mapping global, di�use and beam solarradiation over Zimbabwe
T. Hovea, J. GoÈ ttscheb,*aDepartment of Rural and Urban Planning, University of Zimbabwe, PO Box MP 167, Mt. Pleasant,
Harare, ZimbabwebDepartment of Mechanical Engineering, University of Zimbabwe, PO Box MP167, Mt. Pleasant,
Harare, Zimbabwe
Received 10 September 1998; accepted 2 October 1998
Abstract
A database for long-term monthly radiation over Zimbabwe is developed. Themeteorological raw data inputs are long-term monthly average records of pyranometer-measured hemispherical radiation, monthly average sunshine records, and satellite-measuredhemispherical records over a 2-year period. The sunshine records are incorporated into the
database by use of Angstrom-type correlations developed for Zimbabwe, and the short-term satellite data are `cultured to long-term ground-measurement basis by means of anempirically derived correlation' and a `time series factor'. Di�use radiation values are
generated from the resulting hemispherical radiation database by a locally developedcorrelation of the monthly average di�use fraction of hemispherical radiation with monthlyaverage clearness index. Normal beam radiation is computed from the hemispherical and
di�use radiation using two di�erent methods. The two methods are found to agreegenerally to within 7%. The results are presented as country-border-contained isolines ofradiation. The sensitivity of beam radiation to the accuracy of estimating di�use radiationis inspected. The sensitivity is quite high, about 1:1 for months and locations with very low
clearness. This translates to an almost equal sensitivity of insolation available to trackingtilted apertures, underscoring the importance of developing a local di�use fraction-clearnessindex correlation rather than relying on a correlation developed elsewhere. # 1999 Elsevier
Science Ltd. All rights reserved.
0960-1481/99/$ - see front matter # 1999 Elsevier Science Ltd. All rights reserved.
PII: S0960 -1481 (98)00782 -4
Renewable Energy 18 (1999) 535±556
www.elsevier.com/locate/renene
* Corresponding author. Tel.: +263-4-303 211; fax: +263-4-303 280.
E-mail address: [email protected] (J. GoÈ ttsche)
Nomenclature
a, b coe�cients in the empirical correlation (Angstrom) ofclearness index with relative sunshine duration
f shadow-band correction factor for di�use radiationassuming a two-component sky radiance model
fi shadow-band correction factor for di�use radiationassuming isotropic sky di�use radiance
H irradiation (or total insolation) [J/m2]Hd long-term monthly average di�use irradiation on a
horizontal surface (daily total) [MJ/m2]Hh long-term monthly average hemispherical irradiation on a
horizontal surface (daily total) [MJ/m2]Ho monthly average extraterrestrial irradiation on a horizontal
surface (daily total) [MJ/m2]Hground,1985/86 monthly average daily hemispherical radiation as would be
measured by ground-based pyranometers for 1985 and 1986(derived from correlation of measured ground and satellitedata for 1985 and 1986)
Hground,long-term predicted long-term monthly average daily hemisphericalradiation at locations with given 1985/86 satellite data(=TSF � Hground,1985/86)
Hsat,1985/86 monthly average daily hemispherical radiation as measuredby satellite for 1985 and 1986
I hourly insolation [J/m2]�Ibn long-term monthly average hourly beam irradiation at
normal incidence [MJ/m2]�Id long-term monthly average hourly di�use irradiation on a
horizontal surface [MJ/m2]�Ih long-term monthly average hourly hemispherical irradiation
on a horizontal surface [MJ/m2]Kh Hh/Ho=long-term monthly average clearness indexrd �Id= �H d=ratio of the monthly average hourly to the monthly
average daily di�use irradiation on a horizontal planerh �Ih= �H h=ratio of the monthly average hourly to the monthly
average daily hemispherical irradiation on a horizontal planeTSF a country-universal time series factor relating the ratio
between long-term and 1985/86 hemispherical irradiationlong-term averages
Subscriptsbn normal beamd di�useh hemispherical radiation
T. Hove, J. GoÈttsche / Renewable Energy 18 (1999) 535±556536
1. Introduction
In research problems attempting to verify the detailed performance of a
particular solar energy system, instantaneous ¯uxes of hemispherical (also called
global), di�use and/or beam solar radiation may be required. However, for the
purpose of engineering design and the basic assessment of the economics of solar
energy systems, only the monthly averages of the above quantities are required.
The objective of this paper is to present the distribution of the intensity of
monthly average hemispherical, di�use and normal beam solar radiation over
Zimbabwe.
In Zimbabwe hemispherical radiation is measured by pyranometers at 20
stations monitored by the Meteorological Department (Met. Dept)1 These stations
also record sunshine duration. Another nine stations record sunshine duration
only. The sunshine data can be converted into hemispherical radiation data using
Angstrom-type correlations, which were developed using sunshine and radiation
data for nearby stations [1]. In addition, Raschke et al. reported values of
satellite-measured hemispherical radiation for Africa, for the years 1985 and 1986,
at latitude±longitude grid points with a spatial resolution of 2.5 � 2.5 degrees [2].
These three data sources, pyranometer-measured radiation records, sunshine
duration records and satellite-measured radiation records, are blended, after some
adjustments as described in section 2, to build a consolidated hemispherical
radiation database.
In order to compute the insolation available to inclined planes, one needs, in
addition to hemispherical radiation, the corresponding di�use component. Di�use
radiation is recorded at only two locations in Zimbabwe. To determine the di�use
component of radiation when only the hemispherical radiation is known, the
correlation of the ratio, Hd/Hh, of monthly average di�use to hemispherical
radiation, with monthly average clearness index, Kh must be determined.
Several correlations between these quantities have been developed in the
literature using data for speci®c locations [3±6]. However, the general validity of
these correlations for applicability to locations situated very di�erently from the
locations for which they were derived is not known. Therefore, in this study a
region-speci®c correlation, based on the local data is developed, to be used in
generating di�use radiation values from hemispherical values for all locations in
Zimbabwe. An important step in the development of this correlation is the
appropriate correction of the measured di�use radiation for the e�ect that by
obscuring part of the sky dome from the pyranometer, the shade-ring cuts o� not
only the beam radiation but also a signi®cant proportion of the di�use radiation.
Without local measurements of true di�use radiation, the approach chosen here is
to select from the literature a correction model which returns the highest
1 The Meteorological Department is a government organisation responsible for recording and inter-
preting weather statistics.
T. Hove, J. GoÈttsche / Renewable Energy 18 (1999) 535±556 537
correction factors, in order to make conservative estimates of available beamradiation.
The hemispherical radiation database is built in section 2 using all the availabledata. The development of the correlation of Hd/Hh with Kh as outlined above isthe subject of section 3. In section 4, values of beam radiation at normalincidence, are calculated from the results of sections 2 and 3. The results of thestudy are presented in section 5.
2. Building the hemispherical radiation database
For the determination of the monthly average hemispherical radiation, Hh,three data sources were used.
1. Records of pyranometer-measurements of daily hemispherical radiation fromthe Department of Meteorological Services of Zimbabwe (elsewhere called theMet. Dept).
2. Records of monthly average sunshine hours per day from the Met. Dept.3. Hemispherical radiation data derived from imaging data of the geostationary
satellite METEOSAT2, for 1985 and 1986 [2].
2.1. Pyranometer-measured data
Measured data of monthly average daily radiation on a horizontal plane for 20stations in Zimbabwe was provided by the Met. Dept. The records containedmonthly average data for periods ranging from 12 to 23 years. Before adoptingthese data some consistency checks were made. Global radiation data whichexceeded calculated extra-terrestrial radiation on a horizontal plane, for thelocation, for the month, were discarded. In addition, data records which deviatedby more than 20% from the long-term monthly average were discarded. Wheretwo or more stations located very near to each other recorded substantiallydi�erent monthly values, the lower (conservative) record was adopted. Threepercent of the data records were discarded through this screening criteria. Theremaining clean data were averaged over the period of recording. The coe�cientof variation, year-to-year of monthly means, for the data varied from 4 to 9%.These ground-measured radiation data were adopted as the most reliable of thethree data sources, and were used to derive or correct the other two data sources.(They are marked `Pyranometer' in Table 2).
2.2. Incorporating sunshine data
All the 20 ground stations in section 2.1 also record sunshine data. Howevernine other stations record sunshine data but not radiation data. The correlationdeveloped by Angstrom [1] and later modi®ed by Page [4], (see also [7]) relatingthe monthly average number of sunshine hours and monthly average clearness
T. Hove, J. GoÈttsche / Renewable Energy 18 (1999) 535±556538
index can be applied to generate hemispherical radiation from sunshine data. Therelationship is commonly expressed in the following form:
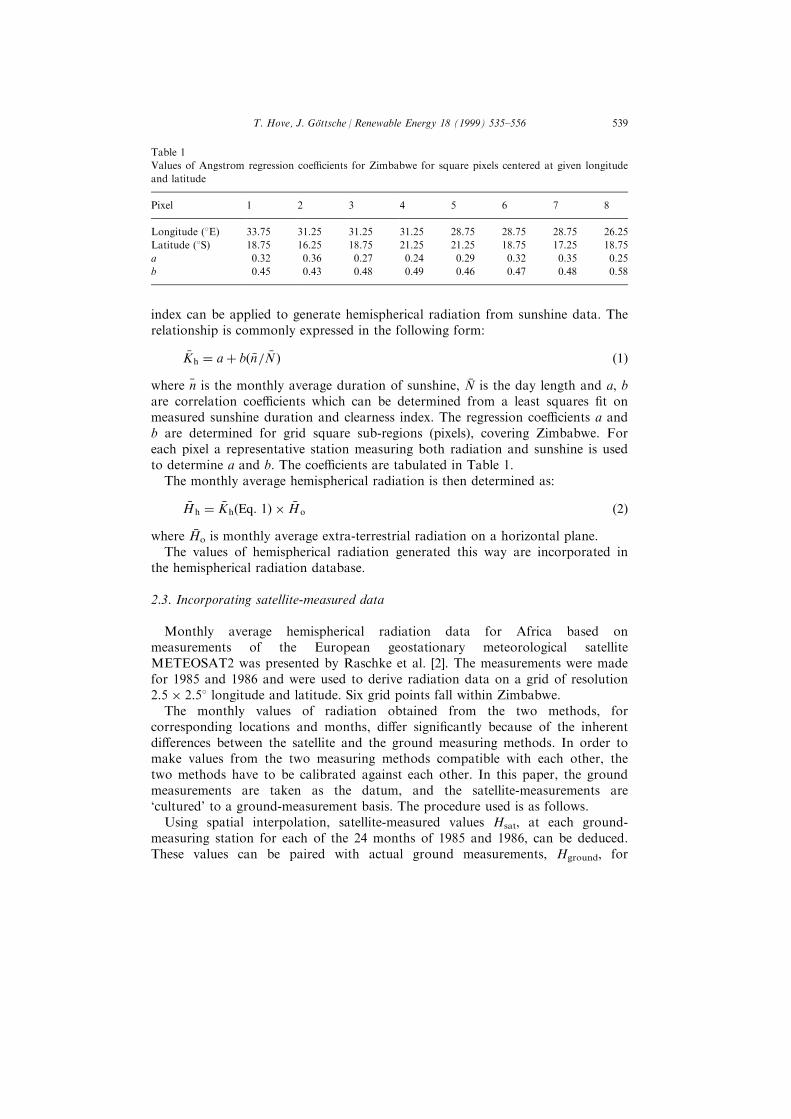
�Kh � a� b� �n= �N � �1�where n is the monthly average duration of sunshine, N is the day length and a, bare correlation coe�cients which can be determined from a least squares ®t onmeasured sunshine duration and clearness index. The regression coe�cients a andb are determined for grid square sub-regions (pixels), covering Zimbabwe. Foreach pixel a representative station measuring both radiation and sunshine is usedto determine a and b. The coe�cients are tabulated in Table 1.
The monthly average hemispherical radiation is then determined as:
�H h � �Kh�Eq: 1� � �Ho �2�where Ho is monthly average extra-terrestrial radiation on a horizontal plane.
The values of hemispherical radiation generated this way are incorporated inthe hemispherical radiation database.
2.3. Incorporating satellite-measured data
Monthly average hemispherical radiation data for Africa based onmeasurements of the European geostationary meteorological satelliteMETEOSAT2 was presented by Raschke et al. [2]. The measurements were madefor 1985 and 1986 and were used to derive radiation data on a grid of resolution2.5 � 2.58 longitude and latitude. Six grid points fall within Zimbabwe.
The monthly values of radiation obtained from the two methods, forcorresponding locations and months, di�er signi®cantly because of the inherentdi�erences between the satellite and the ground measuring methods. In order tomake values from the two measuring methods compatible with each other, thetwo methods have to be calibrated against each other. In this paper, the groundmeasurements are taken as the datum, and the satellite-measurements are`cultured' to a ground-measurement basis. The procedure used is as follows.
Using spatial interpolation, satellite-measured values Hsat, at each ground-measuring station for each of the 24 months of 1985 and 1986, can be deduced.These values can be paired with actual ground measurements, Hground, for
Table 1
Values of Angstrom regression coe�cients for Zimbabwe for square pixels centered at given longitude
and latitude
Pixel 1 2 3 4 5 6 7 8
Longitude (8E) 33.75 31.25 31.25 31.25 28.75 28.75 28.75 26.25
Latitude (8S) 18.75 16.25 18.75 21.25 21.25 18.75 17.25 18.75
a 0.32 0.36 0.27 0.24 0.29 0.32 0.35 0.25
b 0.45 0.43 0.48 0.49 0.46 0.47 0.48 0.58
T. Hove, J. GoÈttsche / Renewable Energy 18 (1999) 535±556 539
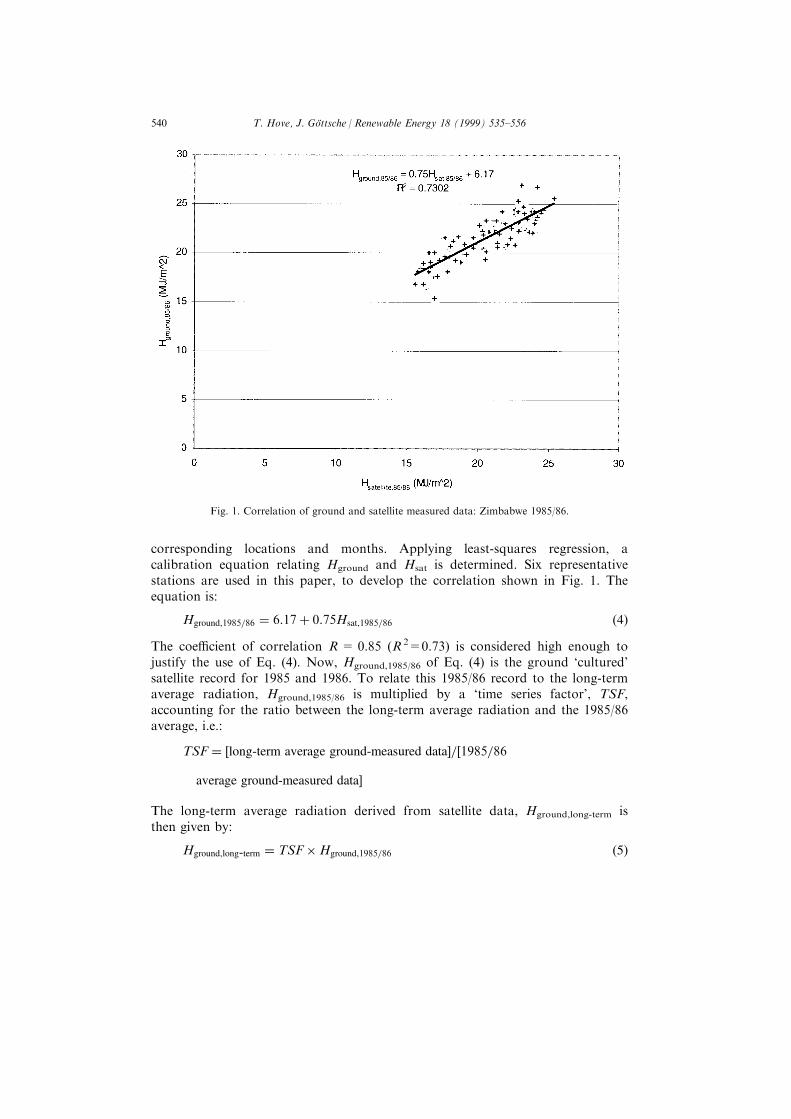
corresponding locations and months. Applying least-squares regression, acalibration equation relating Hground and Hsat is determined. Six representativestations are used in this paper, to develop the correlation shown in Fig. 1. Theequation is:
Hground,1985=86 � 6:17� 0:75Hsat,1985=86 �4�The coe�cient of correlation R= 0.85 (R 2=0.73) is considered high enough tojustify the use of Eq. (4). Now, Hground,1985/86 of Eq. (4) is the ground `cultured'satellite record for 1985 and 1986. To relate this 1985/86 record to the long-termaverage radiation, Hground,1985/86 is multiplied by a `time series factor', TSF,accounting for the ratio between the long-term average radiation and the 1985/86average, i.e.:
TSF � �long-term average ground-measured data�=�1985=86
average ground-measured data�
The long-term average radiation derived from satellite data, Hground,long-term isthen given by:
Hground,long-term � TSF�Hground,1985=86 �5�
Fig. 1. Correlation of ground and satellite measured data: Zimbabwe 1985/86.
T. Hove, J. GoÈttsche / Renewable Energy 18 (1999) 535±556540
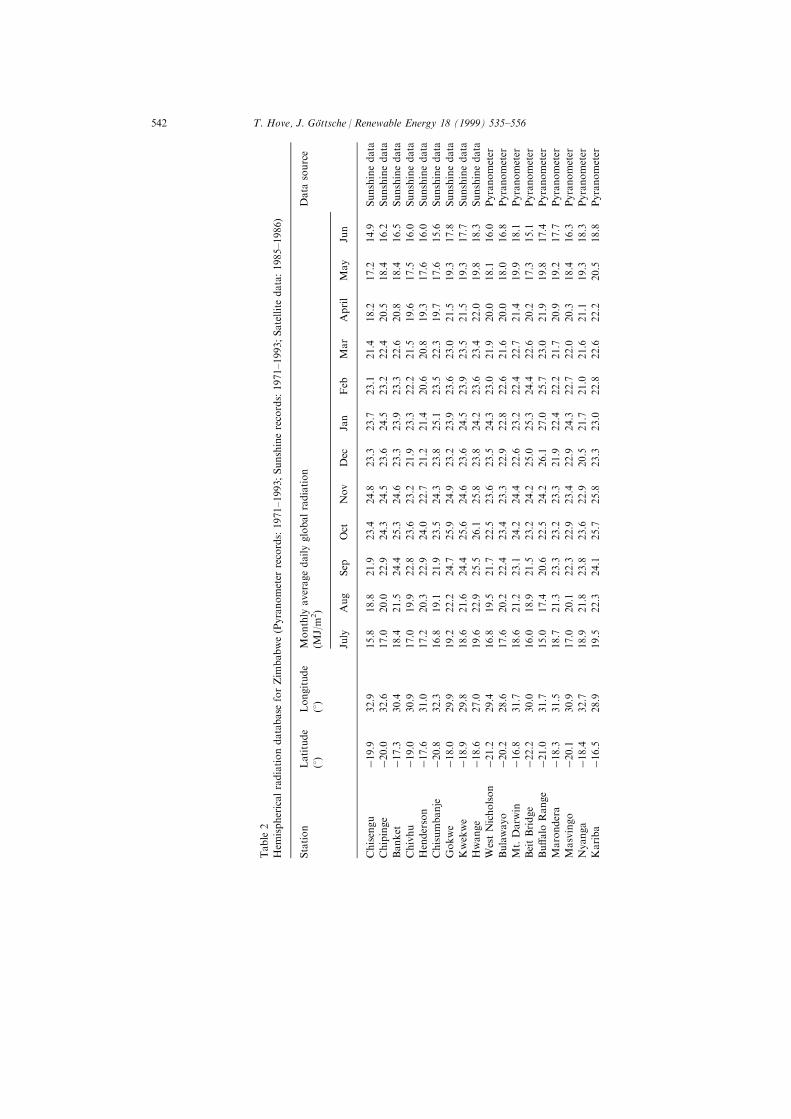
TSF for a station is obtained by averaging all the 1985/86 monthly radiationvalues for the station and dividing this into the long-term annual average for thatstation. TSF for the country is then obtained as the average of TSFs for a numberof representative stations (seven were used in this study). For the set of stationsused, TSF is incidentally equal to 1.0 with a coe�cient of variation of 2%.
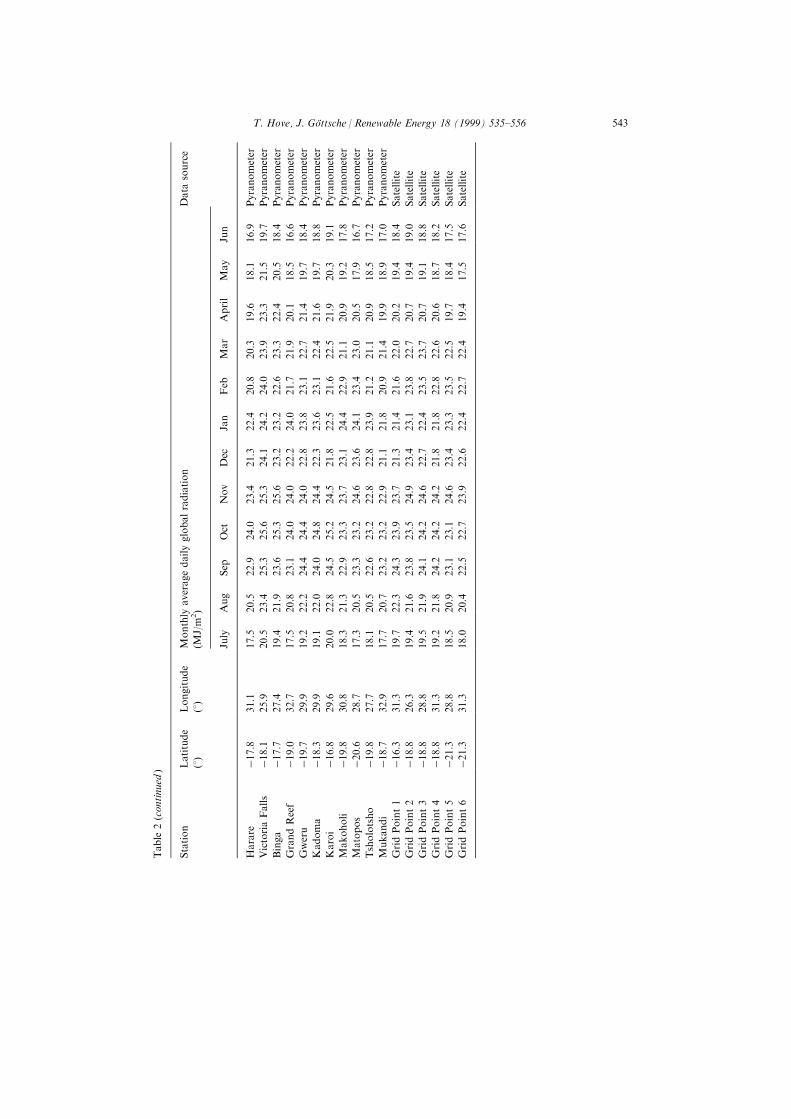
Eq. (5) is used to calibrate satellite-measured data at each grid point, for eachmonth and the resulting values are incorporated into the hemispherical databasewhich will now comprise of records for 35 stations.
The consolidated global radiation database is shown in Table 2.
3. Deriving monthly average di�use radiation from hemispherical radiation
In Zimbabwe, hourly di�use radiation is recorded at two stations, Harare andBulawayo, using the common instrument set-up of a pyranometer shaded with ashadow band. In this study, only the Bulawayo records are used. The datasourced comprise monthly average hourly records of hemispherical and di�useradiation for 13 years. The di�use radiation data have already been corrected forthe shade ring e�ectÐthe e�ect that the shade ring, by obstructing part of the skydome from the pyranometer, not only cuts o� beam radiation (for which it isintended), but also a signi®cant part of di�use radiation. In this study the lowcorrection factors used by the Met. Dept are replaced by a more conservativecorrection method [8]. The Met. Dept's corrected data is therefore ®rst`uncorrected' and then re-corrected.
3.1. Determining measured di�use radiation data from corrected data
The correlation factors used by the Met. Dept to obtain true di�use radiationfrom measured data are shown in columns 3, 5 and 7 in Table 3. The correctionfactors are based on Drummond's isotropic correction factor [9] (see also Ref.[10]) which is multiplied by anisotropic factors of 1.03, 1.05 and 1.07 if the day'ssunshine duration n is n < 4.1 h, 4.1 h < n < 8 h or n>8 h, respectively. Thereare, however a number of short-comings in the correction factors of Table 3.
First, there should be at least two di�erent correction factors between n = 0and n = 4.1 h (0 < Kh < 0.45) since the onset of isotropic sky conditions occursat a Kh value greater than 0; at about Kh=0.26 [8]. Second, the application of justa single correction factor for all hours of the day cannot be justi®ed since anin®nite number of combinations of diurnal cloudiness can result in a particularnumber of sunshine hours per day. Certainly a di�erent correction factor shouldapply for each of the combinations. Third, the shade-ring correction factor wasalso shown to be dependent on the sun's position in the sky (as represented by thesun's altitude angle) [8,11]. This suggests an hourly variation of the correctionfactor, which is not taken into account by the Met. Dept's correction method.
In order to determine the average correction factors used by the Met. Dept overthe whole 13-year period, it is necessary to determine the frequency of occurrence
T. Hove, J. GoÈttsche / Renewable Energy 18 (1999) 535±556 541
Table
2
Hem
isphericalradiationdatabase
forZim
babwe(Pyranometer
records:1971±1993;Sunshinerecords:1971±1993;Satellitedata:1985±1986)
Station
Latitude
(8)
Longitude
(8)
Monthly
averagedailyglobalradiation
(MJ/m
2)
Data
source
July
Aug
Sep
Oct
Nov
Dec
Jan
Feb
Mar
April
May
Jun
Chisengu
ÿ19.9
32.9
15.8
18.8
21.9
23.4
24.8
23.3
23.7
23.1
21.4
18.2
17.2
14.9
Sunshinedata
Chipinge
ÿ20.0
32.6
17.0
20.0
22.9
24.3
24.5
23.6
24.5
23.2
22.4
20.5
18.4
16.2
Sunshinedata
Banket
ÿ17.3
30.4
18.4
21.5
24.4
25.3
24.6
23.3
23.9
23.3
22.6
20.8
18.4
16.5
Sunshinedata
Chivhu
ÿ19.0
30.9
17.0
19.9
22.8
23.6
23.2
21.9
23.3
22.2
21.5
19.6
17.5
16.0
Sunshinedata
Henderson
ÿ17.6
31.0
17.2
20.3
22.9
24.0
22.7
21.2
21.4
20.6
20.8
19.3
17.6
16.0
Sunshinedata
Chisumbanje
ÿ20.8
32.3
16.8
19.1
21.9
23.5
24.3
23.8
25.1
23.5
22.3
19.7
17.6
15.6
Sunshinedata
Gokwe
ÿ18.0
29.9
19.2
22.2
24.7
25.9
24.9
23.2
23.9
23.6
23.0
21.5
19.3
17.8
Sunshinedata
Kwekwe
ÿ18.9
29.8
18.6
21.6
24.4
25.6
24.6
23.6
24.5
23.9
23.5
21.5
19.3
17.7
Sunshinedata
Hwange
ÿ18.6
27.0
19.6
22.9
25.5
26.1
25.8
23.8
24.2
23.6
23.4
22.0
19.8
18.3
Sunshinedata
WestNicholsonÿ2
1.2
29.4
16.8
19.5
21.7
22.5
23.6
23.5
24.3
23.0
21.9
20.0
18.1
16.0
Pyranometer
Bulawayo
ÿ20.2
28.6
17.6
20.2
22.4
23.4
23.3
22.9
22.8
22.6
21.6
20.0
18.0
16.8
Pyranometer
Mt.Darw
inÿ1
6.8
31.7
18.6
21.2
23.1
24.2
24.4
22.6
23.2
22.4
22.7
21.4
19.9
18.1
Pyranometer
BeitBridge
ÿ22.2
30.0
16.0
18.9
21.5
23.2
24.2
25.0
25.3
24.4
22.6
20.2
17.3
15.1
Pyranometer
Bu�alo
Range
ÿ21.0
31.7
15.0
17.4
20.6
22.5
24.2
26.1
27.0
25.7
23.0
21.9
19.8
17.4
Pyranometer
Marondera
ÿ18.3
31.5
18.7
21.3
23.3
23.2
23.3
21.9
22.4
22.2
21.7
20.9
19.2
17.7
Pyranometer
Masvingo
ÿ20.1
30.9
17.0
20.1
22.3
22.9
23.4
22.9
24.3
22.7
22.0
20.3
18.4
16.3
Pyranometer
Nyanga
ÿ18.4
32.7
18.9
21.8
23.8
23.6
22.9
20.5
21.7
21.0
21.6
21.1
19.3
18.3
Pyranometer
Kariba
ÿ16.5
28.9
19.5
22.3
24.1
25.7
25.8
23.3
23.0
22.8
22.6
22.2
20.5
18.8
Pyranometer
T. Hove, J. GoÈttsche / Renewable Energy 18 (1999) 535±556542
Table
2(continued
)
Station
Latitude
(8)
Longitude
(8)
Monthly
averagedailyglobalradiation
(MJ/m
2)
Data
source
July
Aug
Sep
Oct
Nov
Dec
Jan
Feb
Mar
April
May
Jun
Harare
ÿ17.8
31.1
17.5
20.5
22.9
24.0
23.4
21.3
22.4
20.8
20.3
19.6
18.1
16.9
Pyranometer
VictoriaFalls
ÿ18.1
25.9
20.5
23.4
25.3
25.6
25.3
24.1
24.2
24.0
23.9
23.3
21.5
19.7
Pyranometer
Binga
ÿ17.7
27.4
19.4
21.9
23.6
25.3
25.6
23.2
23.2
22.6
23.3
22.4
20.5
18.4
Pyranometer
GrandReef
ÿ19.0
32.7
17.5
20.8
23.1
24.0
24.0
22.2
24.0
21.7
21.9
20.1
18.5
16.6
Pyranometer
Gweru
ÿ19.7
29.9
19.2
22.2
24.4
24.4
24.0
22.8
23.8
23.1
22.7
21.4
19.7
18.4
Pyranometer
Kadoma
ÿ18.3
29.9
19.1
22.0
24.0
24.8
24.4
22.3
23.6
23.1
22.4
21.6
19.7
18.8
Pyranometer
Karoi
ÿ16.8
29.6
20.0
22.8
24.5
25.2
24.5
21.8
22.5
21.6
22.5
21.9
20.3
19.1
Pyranometer
Makoholi
ÿ19.8
30.8
18.3
21.3
22.9
23.3
23.7
23.1
24.4
22.9
21.1
20.9
19.2
17.8
Pyranometer
Matopos
ÿ20.6
28.7
17.3
20.5
23.3
23.2
24.6
23.6
24.1
23.4
23.0
20.5
17.9
16.7
Pyranometer
Tsholotsho
ÿ19.8
27.7
18.1
20.5
22.6
23.2
22.8
22.8
23.9
21.2
21.1
20.9
18.5
17.2
Pyranometer
Mukandi
ÿ18.7
32.9
17.7
20.7
23.2
23.2
22.9
21.1
21.8
20.9
21.4
19.9
18.9
17.0
Pyranometer
GridPoint1
ÿ16.3
31.3
19.7
22.3
24.3
23.9
23.7
21.3
21.4
21.6
22.0
20.2
19.4
18.4
Satellite
GridPoint2
ÿ18.8
26.3
19.4
21.6
23.8
23.5
24.9
23.4
23.1
23.8
22.7
20.7
19.4
19.0
Satellite
GridPoint3
ÿ18.8
28.8
19.5
21.9
24.1
24.2
24.6
22.7
22.4
23.5
23.7
20.7
19.1
18.8
Satellite
GridPoint4
ÿ18.8
31.3
19.2
21.8
24.2
24.2
24.2
21.8
21.8
22.8
22.6
20.6
18.7
18.2
Satellite
GridPoint5
ÿ21.3
28.8
18.5
20.9
23.1
23.1
24.6
23.4
23.3
23.5
22.5
19.7
18.4
17.5
Satellite
GridPoint6
ÿ21.3
31.3
18.0
20.4
22.5
22.7
23.9
22.6
22.4
22.7
22.4
19.4
17.5
17.6
Satellite
T. Hove, J. GoÈttsche / Renewable Energy 18 (1999) 535±556 543
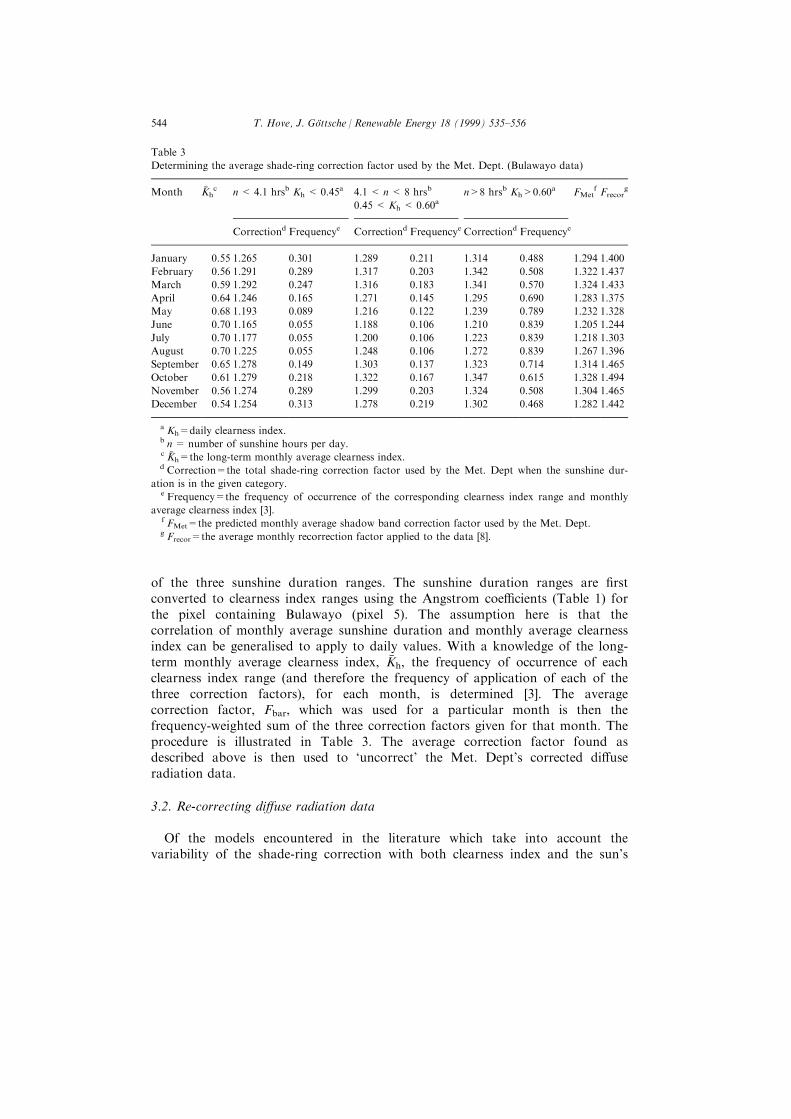
of the three sunshine duration ranges. The sunshine duration ranges are ®rstconverted to clearness index ranges using the Angstrom coe�cients (Table 1) forthe pixel containing Bulawayo (pixel 5). The assumption here is that thecorrelation of monthly average sunshine duration and monthly average clearnessindex can be generalised to apply to daily values. With a knowledge of the long-term monthly average clearness index, Kh, the frequency of occurrence of eachclearness index range (and therefore the frequency of application of each of thethree correction factors), for each month, is determined [3]. The averagecorrection factor, Fbar, which was used for a particular month is then thefrequency-weighted sum of the three correction factors given for that month. Theprocedure is illustrated in Table 3. The average correction factor found asdescribed above is then used to `uncorrect' the Met. Dept's corrected di�useradiation data.
3.2. Re-correcting di�use radiation data
Of the models encountered in the literature which take into account thevariability of the shade-ring correction with both clearness index and the sun's
Table 3
Determining the average shade-ring correction factor used by the Met. Dept. (Bulawayo data)
Month Khc n< 4.1 hrsb Kh < 0.45a 4.1 < n< 8 hrsb
0.45 < Kh < 0.60an>8 hrsb Kh>0.60a FMet
f Frecorg
Correctiond Frequencye Correctiond Frequencye Correctiond Frequencye
January 0.55 1.265 0.301 1.289 0.211 1.314 0.488 1.294 1.400
February 0.56 1.291 0.289 1.317 0.203 1.342 0.508 1.322 1.437
March 0.59 1.292 0.247 1.316 0.183 1.341 0.570 1.324 1.433
April 0.64 1.246 0.165 1.271 0.145 1.295 0.690 1.283 1.375
May 0.68 1.193 0.089 1.216 0.122 1.239 0.789 1.232 1.328
June 0.70 1.165 0.055 1.188 0.106 1.210 0.839 1.205 1.244
July 0.70 1.177 0.055 1.200 0.106 1.223 0.839 1.218 1.303
August 0.70 1.225 0.055 1.248 0.106 1.272 0.839 1.267 1.396
September 0.65 1.278 0.149 1.303 0.137 1.323 0.714 1.314 1.465
October 0.61 1.279 0.218 1.322 0.167 1.347 0.615 1.328 1.494
November 0.56 1.274 0.289 1.299 0.203 1.324 0.508 1.304 1.465
December 0.54 1.254 0.313 1.278 0.219 1.302 0.468 1.282 1.442
a Kh=daily clearness index.b n= number of sunshine hours per day.c Kh=the long-term monthly average clearness index.d Correction=the total shade-ring correction factor used by the Met. Dept when the sunshine dur-
ation is in the given category.e Frequency=the frequency of occurrence of the corresponding clearness index range and monthly
average clearness index [3].f FMet=the predicted monthly average shadow band correction factor used by the Met. Dept.g Frecor=the average monthly recorrection factor applied to the data [8].
T. Hove, J. GoÈttsche / Renewable Energy 18 (1999) 535±556544
altitude, Siren's model was adopted because it yields the most conservativecorrection factors from the point of view of designers of solar energy systems [8].
The correction factor of Siren is presented as a family of curves plotting theratio of the correction factor to be applied, f, to the isotropic [9] correction factor,fi, against clearness index, kh, for di�erent values of the sun's altitude angle.However, there are no analytical expressions, given in Siren's paper, representingthe curves. For convenience in correcting a large amount of data, analyticalexpressions which closely approximate the correction factor are derived in thisstudy. For a shade ring with width-to-radius ratio, b/r, of 0.175Ðthese are thedimension for the Bulawayo instrumentÐthe expression for the ratio of theanisotropic to the isotropic factor, f/fi, is:
f=fi � 1� �0:225 sin a� 0:043� sin�p�kh ÿ 0:26�=0:72� �6�where: a is the sun's altitude angle and kh is the hourly clearness index.
Monthly averaged hourly clearness index data was obtained for Bulawayo froma 13-year database (Met. Dept). The isotropic correction factor is determinedfrom Drummond's equation. The correction factor determined this way was usedto re-correct monthly average hourly data for Bulawayo before its use in thefollowing section.
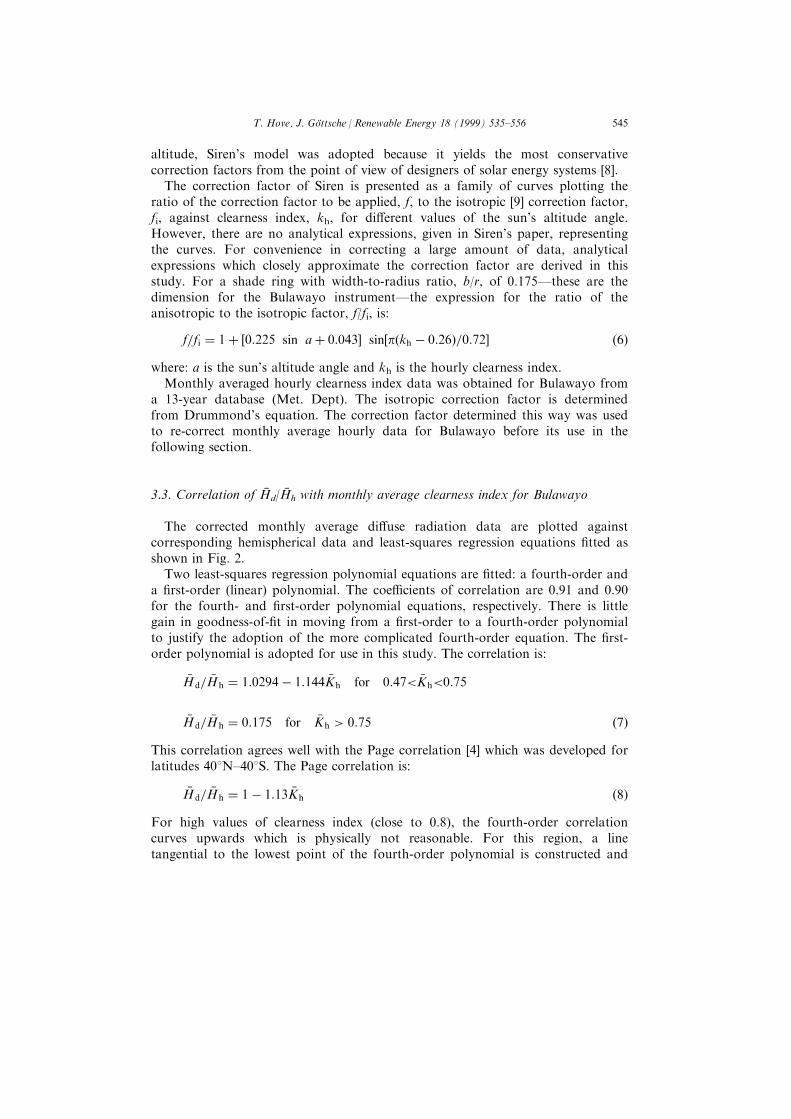
3.3. Correlation of Hd/Hh with monthly average clearness index for Bulawayo
The corrected monthly average di�use radiation data are plotted againstcorresponding hemispherical data and least-squares regression equations ®tted asshown in Fig. 2.
Two least-squares regression polynomial equations are ®tted: a fourth-order anda ®rst-order (linear) polynomial. The coe�cients of correlation are 0.91 and 0.90for the fourth- and ®rst-order polynomial equations, respectively. There is littlegain in goodness-of-®t in moving from a ®rst-order to a fourth-order polynomialto justify the adoption of the more complicated fourth-order equation. The ®rst-order polynomial is adopted for use in this study. The correlation is:
�H d= �H h � 1:0294ÿ 1:144 �Kh for 0:47< �Kh<0:75
�H d= �H h � 0:175 for �Kh > 0:75 �7�This correlation agrees well with the Page correlation [4] which was developed forlatitudes 408N±408S. The Page correlation is:
�H d= �H h � 1ÿ 1:13 �Kh �8�For high values of clearness index (close to 0.8), the fourth-order correlationcurves upwards which is physically not reasonable. For this region, a linetangential to the lowest point of the fourth-order polynomial is constructed and
T. Hove, J. GoÈttsche / Renewable Energy 18 (1999) 535±556 545
found to intersect the ®rst-order polynomial curve at Kh=0.75 and Hd/Hh=0.175;thus the appearance of these limits in Eq. (7). There was no data for Bulawayoyielding Kh values lower than 0.47. However, the linear correlation equation isextrapolated in the few cases that Kh values less than 0.47 are encountered in thecountry's database.
When di�use radiation values generated from global radiation values using thiscorrelation are compared with those calculated from the Erbs et al. correlation [6],for all stations and months, the maximum deviation is found to be close to 20%.For predicting the insolation available to solar energy devices which use asigni®cant proportion of di�use radiation, for example ¯at-plate collectors, thisderivation translates to a deviation in energy available to the collector of only 1±2%. However, for predicting the radiation available to collectors which acceptonly beam radiation, e.g. tracking concentrating collectors, the deviation resultingfrom using the di�erent di�use-fraction correlation is quite high; up to about 20%for a 20% deviation in di�use radiation (see section 4). This fact underscores theimportance of developing a local correlation rather than relying on correlationsdeveloped elsewhere.
The spatial and temporal average of the deviation between di�use radiationgenerated in this study and those of the Erbs et al. correlation [6] is con®ned towithin 10%. This is considered to be the margin of error that can be expected ofthe di�use radiation values generated in this study.
Fig. 2. Monthly average Hd/Hh vs monthly average clearness index: from Bulawayo data 1980±92.
T. Hove, J. GoÈttsche / Renewable Energy 18 (1999) 535±556546
4. Estimating normal beam radiation
In this section beam radiation is calculated using two di�erent methods and theresults are compared.
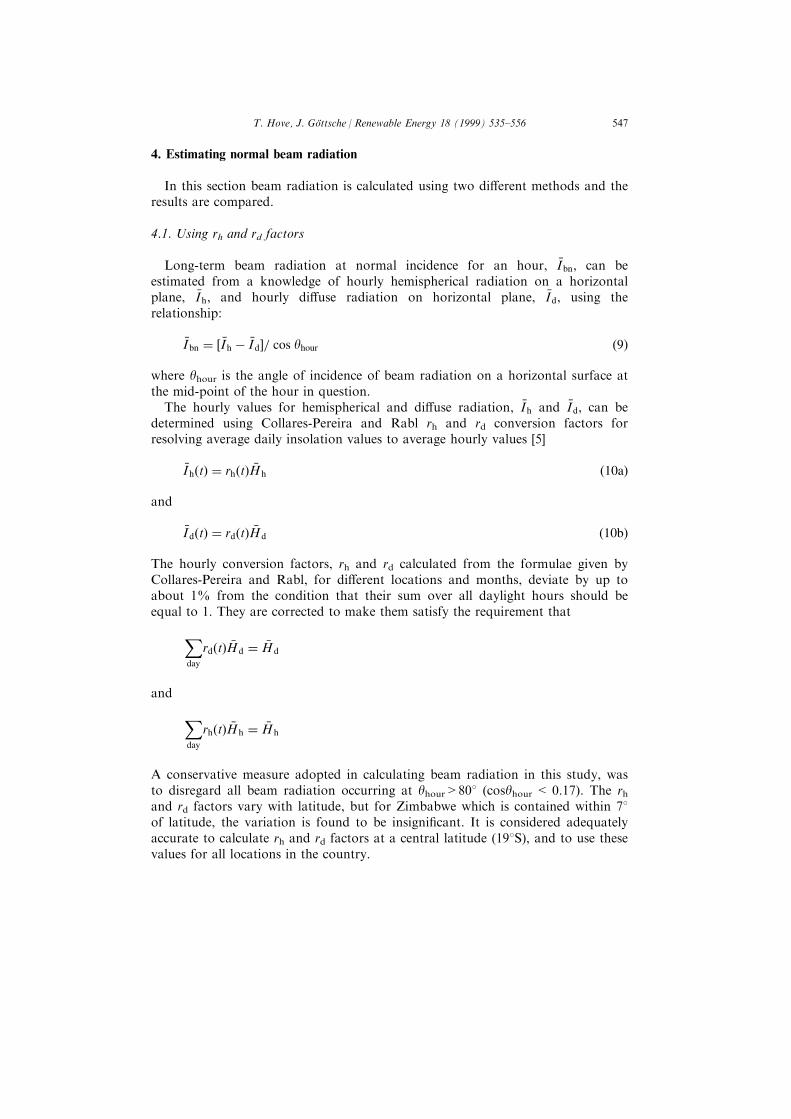
4.1. Using rh and rd factors
Long-term beam radiation at normal incidence for an hour, �Ibn, can beestimated from a knowledge of hourly hemispherical radiation on a horizontalplane, �Ih, and hourly di�use radiation on horizontal plane, �Id, using therelationship:
�I bn � � �Ih ÿ �Id�= cos yhour �9�
where yhour is the angle of incidence of beam radiation on a horizontal surface atthe mid-point of the hour in question.
The hourly values for hemispherical and di�use radiation, �Ih and �Id, can bedetermined using Collares-Pereira and Rabl rh and rd conversion factors forresolving average daily insolation values to average hourly values [5]
�I h�t� � rh�t� �Hh �10a�
and
�I d�t� � rd�t� �Hd �10b�
The hourly conversion factors, rh and rd calculated from the formulae given byCollares-Pereira and Rabl, for di�erent locations and months, deviate by up toabout 1% from the condition that their sum over all daylight hours should beequal to 1. They are corrected to make them satisfy the requirement thatX
day
rd�t� �Hd � �H d
and Xday
rh�t� �Hh � �H h
A conservative measure adopted in calculating beam radiation in this study, wasto disregard all beam radiation occurring at yhour>808 (cosyhour < 0.17). The rhand rd factors vary with latitude, but for Zimbabwe which is contained within 78of latitude, the variation is found to be insigni®cant. It is considered adequatelyaccurate to calculate rh and rd factors at a central latitude (198S), and to use thesevalues for all locations in the country.
T. Hove, J. GoÈttsche / Renewable Energy 18 (1999) 535±556 547
4.2. Comparative study using INSEL
For comparison with beam data generated as described above, and forconsistency checking, the software tool INSEL [12], was used to estimate beamradiation on a two-axis tracked surface on the basis of generated time-series data.
The INSEL tool allows the generation of realistic hourly global radiation dataIh from monthly averages [13]. The INSEL data generator is based on theprocedure proposed by Gordon and Reddy that generates hourly clearness indexdata with a given autocorrelation [14].
In this study, monthly mean global radiation data of six stations is used togenerate a set of hourly data Ih which sums up exactly to the given monthly®gure. The INSEL standard autocorrelation coe�cients of r (1 day)=0.3 and r (2days)=0.17 are used in this study.
The correlation of Erbs et al. is used to generate hourly data Id of di�useradiation [6]. This data is corrected with a monthly correction factor so that themonthly average of generated data coincides with the monthly average of di�usedata as obtained earlier in this study. In general, the di�use radiation data has tobe corrected down to about 10% lower values in order to obtain the prescribedmonthly averages.
With the given hourly global and di�use radiation data, hourly direct normalbeam radiation data Ibn are generated by applying Eq. (9) with I replacing �I ,whereby hours with Id>Ih are discarded and only hours with cos(yhour)>0.17(yhour < 808) are considered.
Results for six stations in Zimbabwe are shown in Table 4 together with datafrom section 4.1.
Deviations of monthly average normal beam radiation as derived by the twodi�erent methods are given in %. Generally, the INSEL method results in slightlylower beam radiation data. The deviation of annual averages is con®ned to lessthan 3% for all stations whereas monthly mean values may deviate in extremecases by up to 13.8%. However, generally the deviation is less than 7% which isconsidered to be the margin of error of the monthly beam radiation ®gures asgenerated with the method of section 4.1, which is adopted here for generatingbeam radiation values for the attached maps.
5. Results
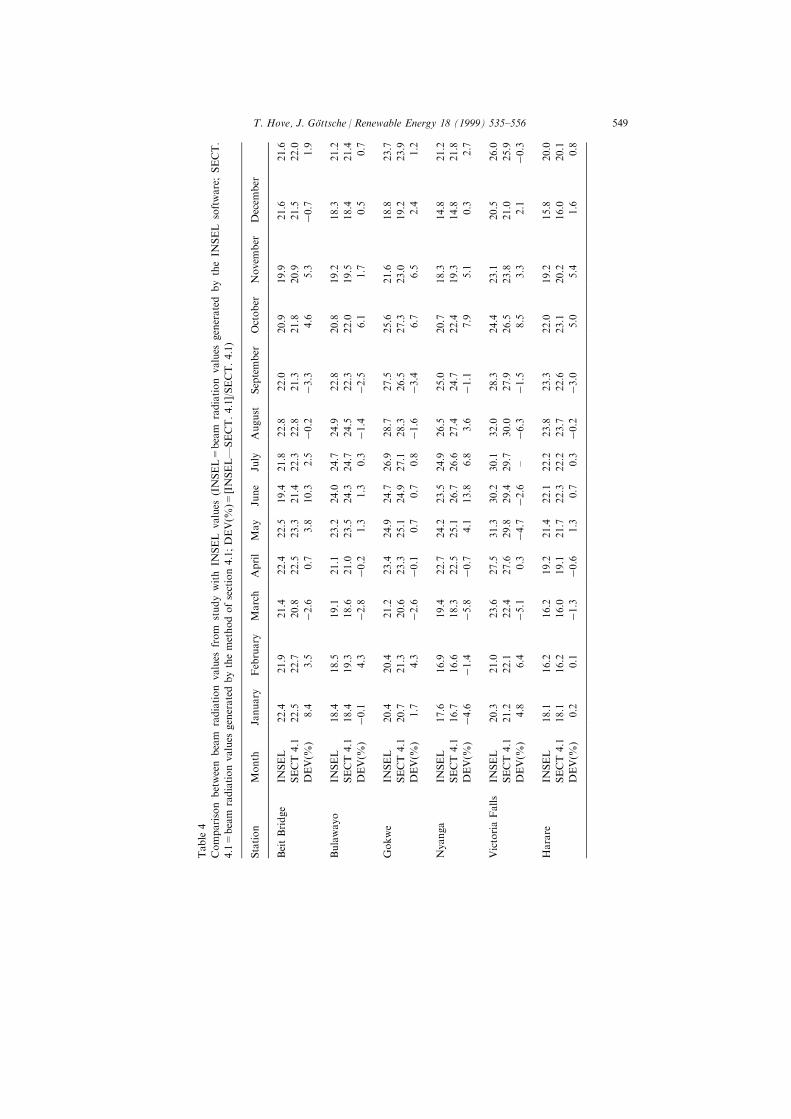
The results of this study are presented as a set of isoline maps of long-termaverage radiation. A sample of the maps is shown in Figs. 4±12. This gives avisual picture of the spatial distribution of radiation over Zimbabwe which can beconveniently read by potential users.
For the estimation of radiation available to tilted apertures which accept bothbeam and di�use radiation the monthly averages of both hemispherical (global)and di�use radiation are necessary inputs [15]. However, for estimating radiation
T. Hove, J. GoÈttsche / Renewable Energy 18 (1999) 535±556548
Table
4
Comparison
between
beam
radiation
values
from
studywith
INSEL
values
(INSEL=beam
radiation
values
generated
bytheIN
SEL
software;SECT.
4.1=
beam
radiationvalues
generatedbythemethodofsection4.1;DEV(%
)=[INSELÐ
SECT.4.1]/SECT.4.1)
Station
Month
January
February
March
April
May
June
July
August
September
October
Novem
ber
Decem
ber
BeitBridge
INSEL
22.4
21.9
21.4
22.4
22.5
19.4
21.8
22.8
22.0
20.9
19.9
21.6
21.6
SECT4.1
22.5
22.7
20.8
22.5
23.3
21.4
22.3
22.8
21.3
21.8
20.9
21.5
22.0
DEV(%
)8.4
3.5
ÿ2.6
0.7
3.8
10.3
2.5ÿ0
.2ÿ3
.34.6
5.3
ÿ0.7
1.9
Bulawayo
INSEL
18.4
18.5
19.1
21.1
23.2
24.0
24.7
24.9
22.8
20.8
19.2
18.3
21.2
SECT4.1
18.4
19.3
18.6
21.0
23.5
24.3
24.7
24.5
22.3
22.0
19.5
18.4
21.4
DEV(%
)ÿ0
.14.3
ÿ2.8
ÿ0.2
1.3
1.3
0.3ÿ1
.4ÿ2
.56.1
1.7
0.5
0.7
Gokwe
INSEL
20.4
20.4
21.2
23.4
24.9
24.7
26.9
28.7
27.5
25.6
21.6
18.8
23.7
SECT4.1
20.7
21.3
20.6
23.3
25.1
24.9
27.1
28.3
26.5
27.3
23.0
19.2
23.9
DEV(%
)1.7
4.3
ÿ2.6
ÿ0.1
0.7
0.7
0.8ÿ1
.6ÿ3
.46.7
6.5
2.4
1.2
Nyanga
INSEL
17.6
16.9
19.4
22.7
24.2
23.5
24.9
26.5
25.0
20.7
18.3
14.8
21.2
SECT4.1
16.7
16.6
18.3
22.5
25.1
26.7
26.6
27.4
24.7
22.4
19.3
14.8
21.8
DEV(%
)ÿ4
.6ÿ1
.4ÿ5
.8ÿ0
.74.1
13.8
6.8
3.6
ÿ1.1
7.9
5.1
0.3
2.7
VictoriaFalls
INSEL
20.3
21.0
23.6
27.5
31.3
30.2
30.1
32.0
28.3
24.4
23.1
20.5
26.0
SECT4.1
21.2
22.1
22.4
27.6
29.8
29.4
29.7
30.0
27.9
26.5
23.8
21.0
25.9
DEV(%
)4.8
6.4
ÿ5.1
0.3
ÿ4.7ÿ2
.6±
ÿ6.3
ÿ1.5
8.5
3.3
2.1
ÿ0.3
Harare
INSEL
18.1
16.2
16.2
19.2
21.4
22.1
22.2
23.8
23.3
22.0
19.2
15.8
20.0
SECT4.1
18.1
16.2
16.0
19.1
21.7
22.3
22.2
23.7
22.6
23.1
20.2
16.0
20.1
DEV(%
)0.2
0.1
ÿ1.3
ÿ0.6
1.3
0.7
0.3ÿ0
.2ÿ3
.05.0
5.4
1.6
0.8
T. Hove, J. GoÈttsche / Renewable Energy 18 (1999) 535±556 549
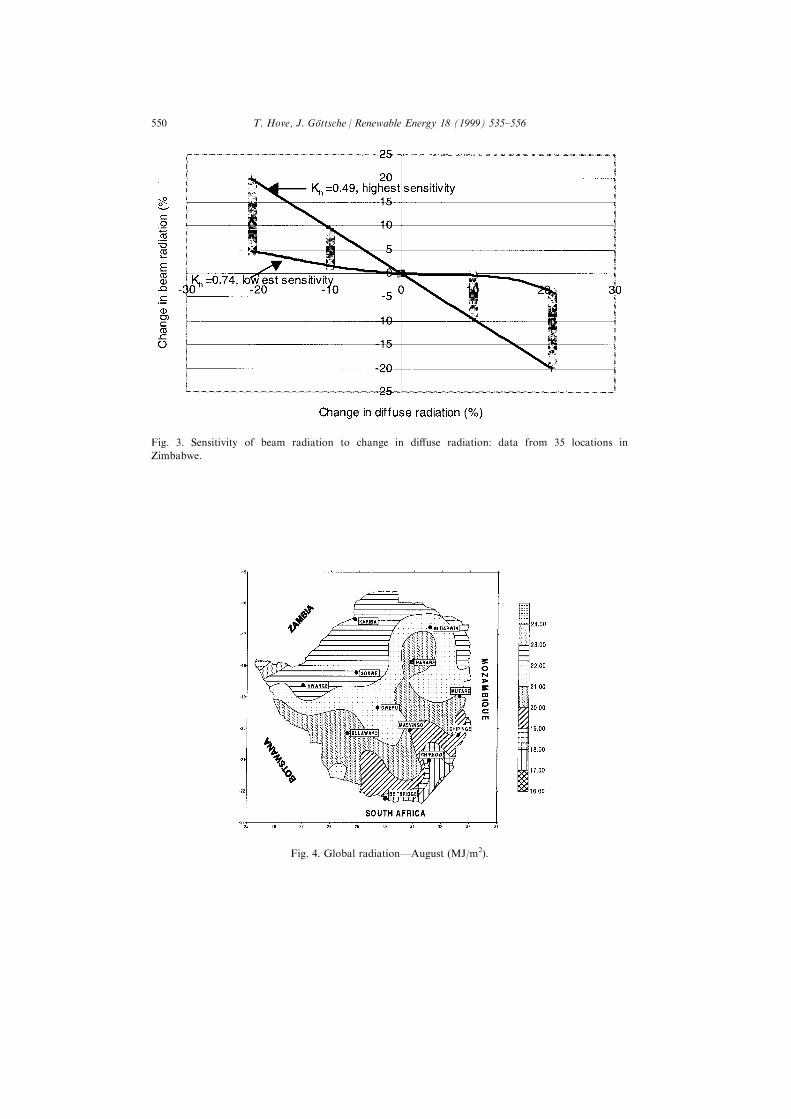
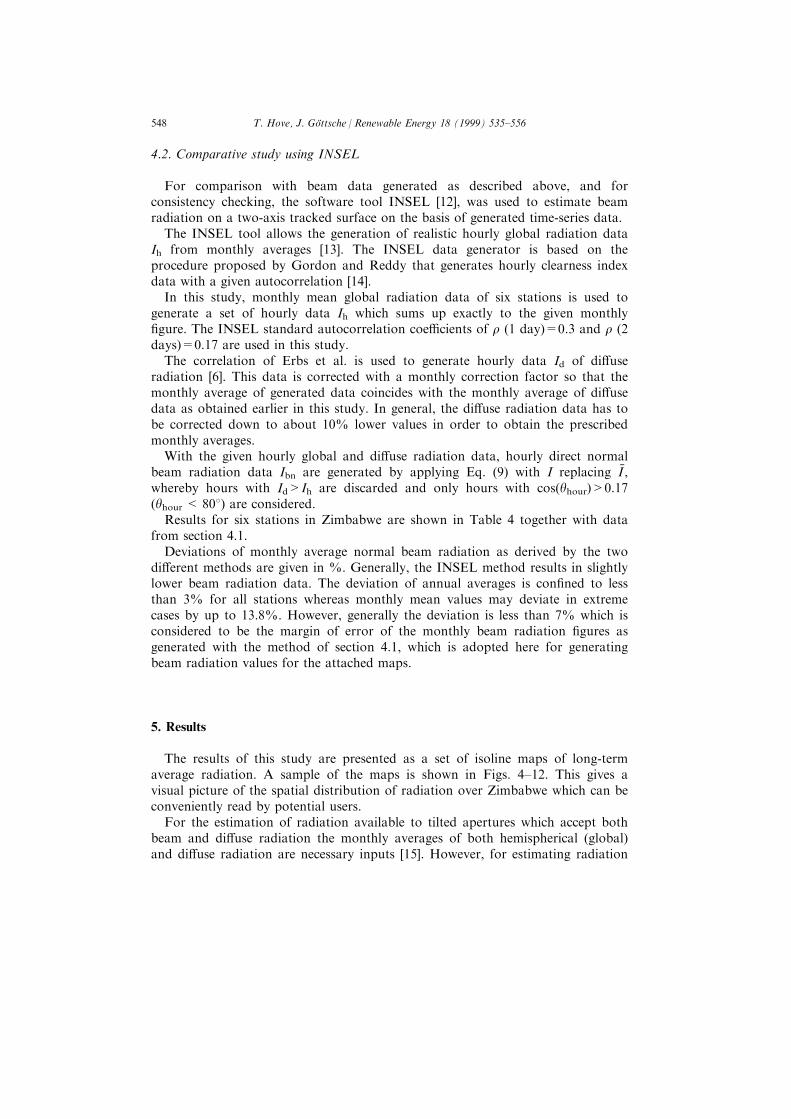
Fig. 3. Sensitivity of beam radiation to change in di�use radiation: data from 35 locations in
Zimbabwe.
Fig. 4. Global radiationÐAugust (MJ/m2).
T. Hove, J. GoÈttsche / Renewable Energy 18 (1999) 535±556550
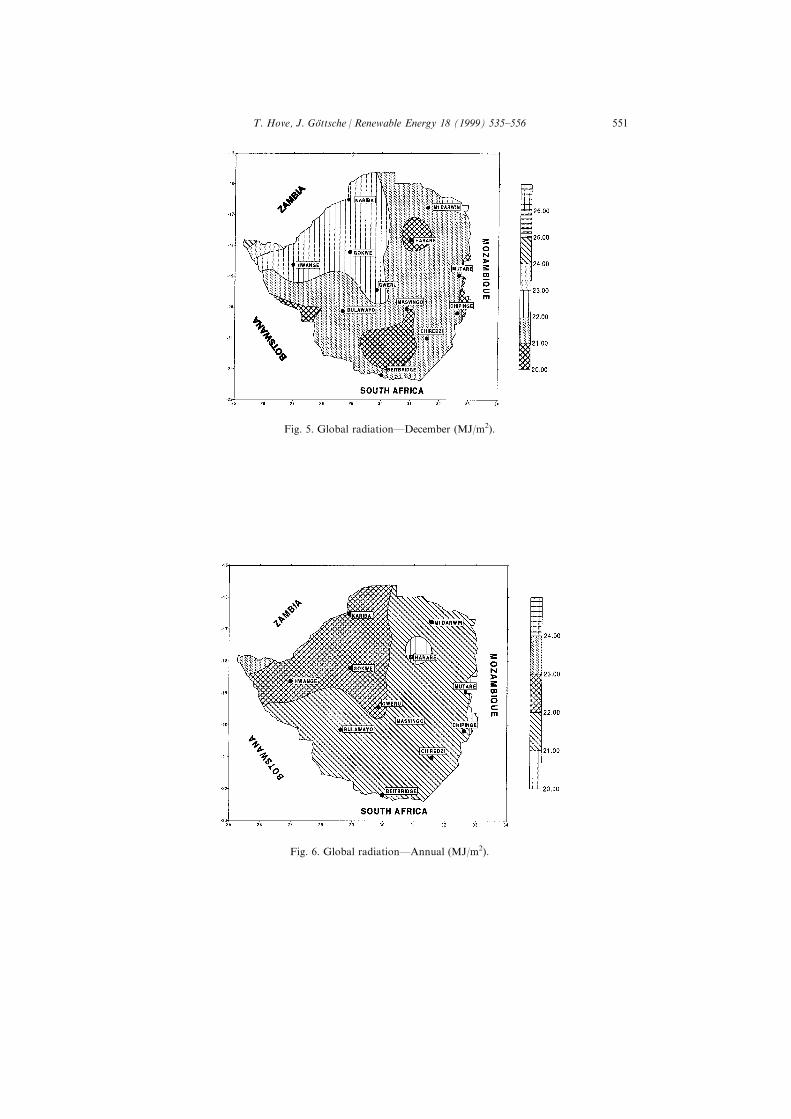
Fig. 6. Global radiationÐAnnual (MJ/m2).
Fig. 5. Global radiationÐDecember (MJ/m2).
T. Hove, J. GoÈttsche / Renewable Energy 18 (1999) 535±556 551
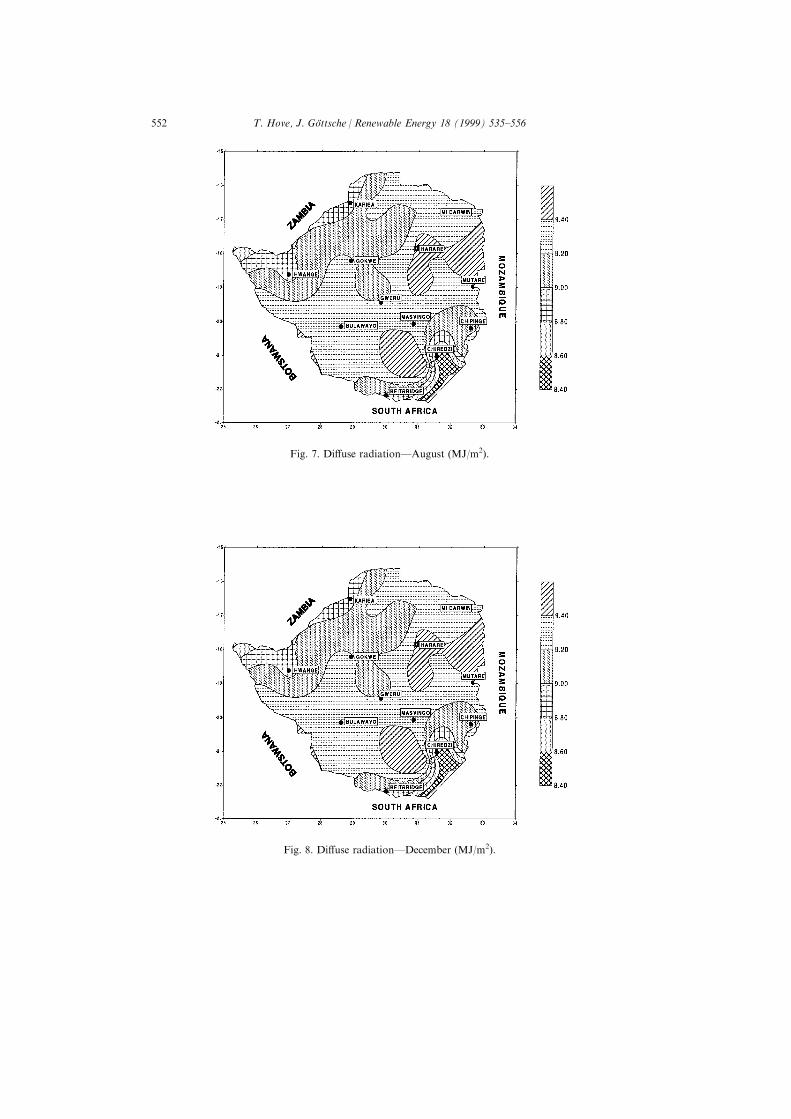
Fig. 8. Di�use radiationÐDecember (MJ/m2).
Fig. 7. Di�use radiationÐAugust (MJ/m2).
T. Hove, J. GoÈttsche / Renewable Energy 18 (1999) 535±556552
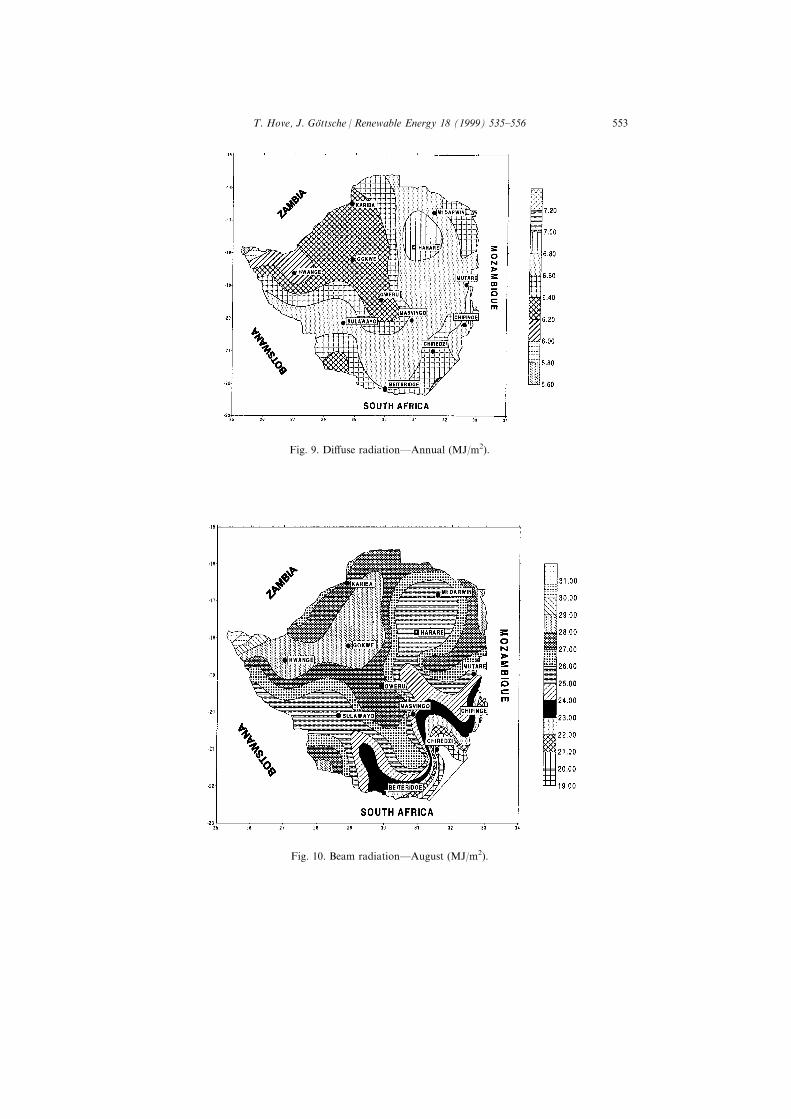
Fig. 10. Beam radiationÐAugust (MJ/m2).
Fig. 9. Di�use radiationÐAnnual (MJ/m2).
T. Hove, J. GoÈttsche / Renewable Energy 18 (1999) 535±556 553
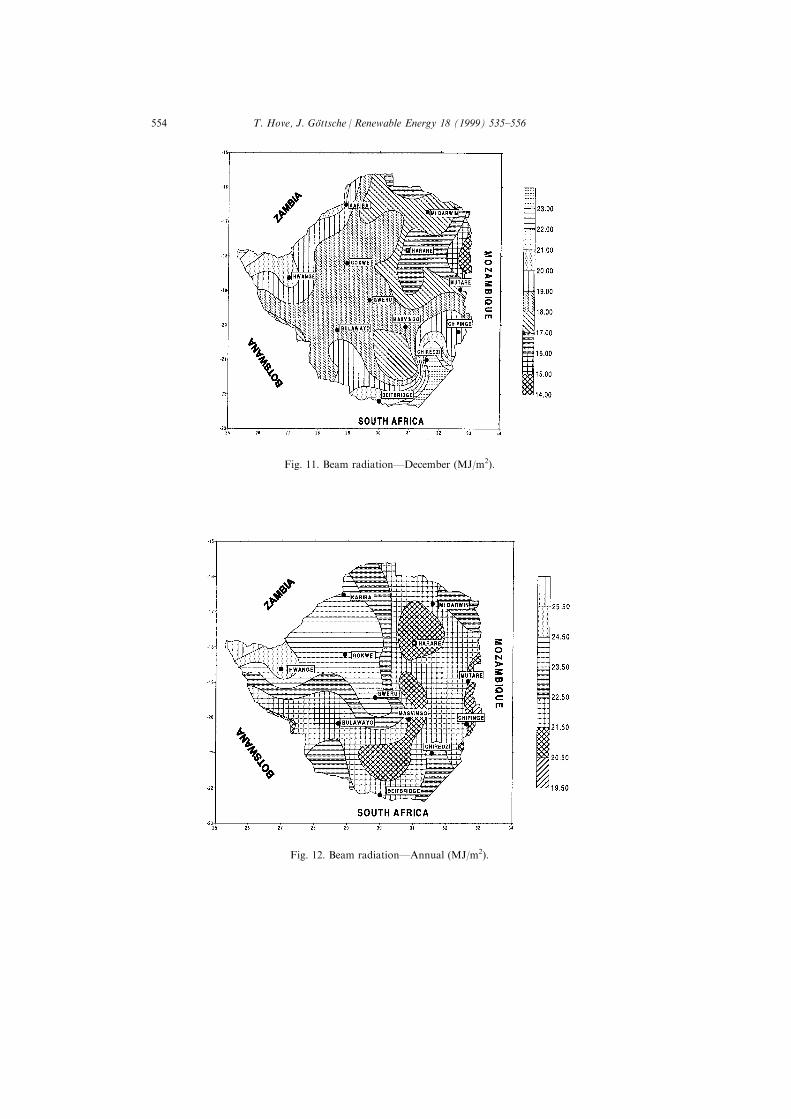
Fig. 12. Beam radiationÐAnnual (MJ/m2).
Fig. 11. Beam radiationÐDecember (MJ/m2).
T. Hove, J. GoÈttsche / Renewable Energy 18 (1999) 535±556554
available to apertures which accept only beam radiation the only necessary inputis the annual average of normal beam radiation.
5.1. Sensitivity of beam radiation to change in di�use radiation
The accuracy of beam radiation values calculated using the method outlinedabove depends to some extent on the quality of the correlation of di�use fractionto clearness index used. The sensitivity of beam radiation to the deviation indi�use radiation from the di�use radiation ®gures used in this study is shown inFig. 3. The points in Fig. 3 are based on data for all the 35 stations shown inTable 2 and the curves are the envelopes for the highest and lowest sensitivityover the year. Although a number of factors, e.g. the latitude of the location, thesun's declination and the diurnal variation in radiation (as represented by the rhand rd factors), all a�ect sensitivity, the monthly average clearness index, Kh hasthe strongest in¯uence. As shown by the sensitivity envelopes in Fig. 3 there is aclear decrease of sensitivity with increase in clearness index.
6. Conclusion
In this study, ®gures for annual normal beam radiation for Zimbabwe areobtained using all data on global and di�use radiation presently available.
Two independent methods are applied to obtain monthly beam radiationaverages from monthly global and di�use radiation data. Results for monthlyaverages di�er by typically less than 7%. Results for annual averages di�er by lessthan 3% for all stations.
A sensitivity analysis reveals that uncertainties in monthly di�use data mayresult in up to equal relative uncertainties of the estimated normal beam radiation,depending on clearness index.
Given the 10% uncertainty of the used di�use radiation data, the ®gures forannual beam radiation data presented here should be considered with an errormargin of up to210%.
Generally the beam radiation in Zimbabwe can be expected to average about 20MJ/m2 (2000 kWh/m2/year) with a peak of 26 MJ/m2 (2600 kWh/m2/year) aroundVictoria Falls. The upward gradient towards the western end of the country isbased on observations from one station only (Victoria Falls). More extendedmeasurements should be carried out to con®rm or correct this.
Acknowledgements
The authors are indebted to Mr T.C. Temba from the Department ofMeteorological Services of the Government of Zimbabwe who provided the rawdata for this study.
T. Hove, J. GoÈttsche / Renewable Energy 18 (1999) 535±556 555
References
[1] Angstrom AK. Solar and atmospheric radiation. QJMRS 1924;20:121±6 cited by Iqbal (1979).
[2] Raschke E, Stuhlmann W, Palz, Steemers TC. Solar radiation atlas of Africa. Commission of
European Communities. A.A. Balkema, Rotterdam, 1991.
[3] Liu BYH, Jordan RC. The interrelationship and characteristic distribution of direct, di�use and
total radiation. Solar Energy 1960;4:1±19.
[4] Page JK. The estimation of monthly mean values of daily total shortwave radiation on vertical
and inclined surfaces from sunshine records for latitudes 408N±408S. In: Proceedings of the U.N.
Conf. on New Sources of Energy, New York, 1961.
[5] Collares-Pereira M, Rabl A. Derivation of method for predicting longterm average energy delivery
of solar collectors. Solar Energy 1979;23:223±33.
[6] Erbs DG, Klein SA, Du�e JA. Estimation of the di�use radiation fraction for hourly, daily, and
monthly averaged global radiation. Solar Energy 1982;28:155±64.
[7] Iqbal M. Correlation of di�use and beam radiation with hours of bright sunshine. Solar Energy
1979;23:169±73.
[8] Siren KE. The shadow band correction for di�use irradiation based on a two-component sky radi-
ance model. Solar Energy 1987;39:433±8.
[9] Drummond AJ. On the measurement of sky radiation. Arch Meteor Geophys & Bioklim
1956;7:413±36 cited by LeBaron et al. (1980).
[10] LeBaron BA, Peterson WA, Dirmhirn I. Corrections for di�use irradiance measured with shadow-
bands. Solar Energy 1980;24:1±13.
[11] LeBaron BA, Michalsky JJ, Perez R. A simple procedure for correcting shadowband data for all
sky conditions. Solar Energy 1990;44:249±55.
[12] Schumacher J. INSEL manual. Carl von Ossietzky University, Oldenberg, Germany, 1997.
[13] Beyer HG, Bohlen M, Schumacher J. GENG. A radiation data generator for the simulation sys-
tem INSEL. In: Proceedings of the 10th European Photovoltaic Solar Energy Conference, Nice,
1995. p. 1030±3.
[14] Gordon JM, Reddy TA. Time series of daily horizontal solar radiation. Solar Energy 1988;40:269±
79.
[15] Collares-Pereira M, Rabl A. Simple procedure for predicting longterm average performance of
nonconcentrating and concentrating solar collectors. Solar Energy 1979;23:235±53.
T. Hove, J. GoÈttsche / Renewable Energy 18 (1999) 535±556556