Embed Size (px)
Citation preview
MAPPING ENERGY INVESTMENT POTENTIAL AROUND THE WORLDJune 2013
CONTENTS
1. Introduction to PA’s Energy Investment Map – June 2013
2. Methodology and data analysis
3. PA’s country rankings for renewable and conventional energy
4. Country-by-country insight
5. About PA’s global energy team
4-5
6-8
9-12
13-28
29-31
3PACONSULTING.COM
INTRODUCTION TO PA’S ENERGY INVESTMENT MAPJune 2013
Around the world, utilities, power producers, policymakers and investors are struggling to assess investment options in energy technology. Our experience of working with these organisations shows us that uncertainty and complex market and regulatory conditions along the entire value chain, together with the rapid advance of technology, are bringing a new level of challenge to effective decision-making.
To succeed in this fast-evolving environment, decision-makers will have to place far greater emphasis on understanding the regulatory and economic factors that will affect their projects and investments. This is why, in November 2012, we embarked on a comprehensive programme to map the expected risk and return for an investment ‘today’ in new power generation facilities – and to make our findings available through an interactive online tool, PA’s Energy Investment Map.
Since then, we have updated and expanded our analysis from 14 countries to 30, and created a tool that offers global insight. Our Energy Investment Map aims to provide businesses and investors with the information they need to begin to identify the right investment opportunities globally. We also hope to give policymakers an understanding of how their countries compare with others in terms of promoting different technologies and encouraging investment.
Our recent work brings together data on the changing energy landscape in 30 countries across Europe, Asia Pacific, the Gulf, BRICS and the US. It assesses the factors that affect the outlook for 11 different renewable and conventional generation sources, and compares the potential rates of return and risks across technologies and
countries. It does not provide investment advice, but gives investors a picture of how opportunities vary across countries and technologies.
Find out moreThis report and our online Energy Investment Map provide a high-level view of our findings.
To explore the tool, please visit: www.paconsulting.com/energyinvestmentmap
For more on our energy market and regulatory expertise, or for more-detailed analysis of the thinking presented in our Energy Investment Map, please arrange a meeting with one of our experts:
Email: [email protected]
Phone +44 (0) 20 7333 6112 (Europe) or +1 212 973 5977 (US).
“Uncertainty, complex market and regulatory conditions and the rapid advance of renewable technologies all mean decision-makers must place far greater emphasis on understanding the regulatory and economic factors that will affect their projects and investments.” Olaf Remmler PA energy expert
4 MAPPING ENERGY INVESTMENT POTENTIAL AROUND THE WORLD
Media contactsAmericas
United States of America Latin America & Caribbean
Carrie Gray
The Chrysler Building 405 Lexington Avenue 45th Floor New York, NY 10174 United States of America Tel: +1 212 973 5954 Email: [email protected]
Asia-Pacific
India New Zealand
Shivani Joshi
123 Buckingham Palace Road London SW1W 9SR United Kingdom Tel: +44 20 7333 5017 Email: [email protected]
Europe
Denmark
Pernille Larsen
Tuborg Boulevard 5 DK-2900 Hellerup Tel: +45 39 25 52 09 Email: [email protected]
Germany
Karsten Gross
Eschersheimer Landstraße 223 60320 Frankfurt am Main Germany Tel: +49 69 71 70 22 93 Email: [email protected]
Ireland
Shivani Joshi
123 Buckingham Palace Road London SW1W 9SR United Kingdom Tel: +44 20 7333 5017 Email: [email protected]
The Netherlands
Maaike Starrenburg
Orteliuslaan 1001 Utrecht 3528BE Netherlands Tel: +31 30 28 29 701 Email: [email protected]
Norway
Tone Lill Wilsbeck
Lysaker Torg 25 NO-1324 Lysaker Norway Tel: +47 95 94 03 99 Email: [email protected]
Sweden
Pia Kullander
Norrmalmstorg 14 SE-111 46 Stockholm Sweden Tel: +46 8 454 19 80 Email: [email protected]
United Kingdom
Shivani Joshi
123 Buckingham Palace Road London SW1W 9SR United Kingdom Tel: +44 20 7333 5017 Email: [email protected]
Middle East/Africa
Dubai
Nada ElSaadi
The H Hotel Office Tower Level 09 Office Dubai 333840 United Arab Emirates Tel: +971 4 372 1161 Email: [email protected]
5PACONSULTING.COM
METHODOLOGY AND DATA ANALYSIS
Our analysis for this report took place between March and May 2013. We plan to update our analysis twice a year, with interim adjustments for individual countries to capture changes in the regulatory, financial and political environment as they happen.
Which countries?PA’s Energy Investment Map currently covers the following countries:
European countries: Austria, Czech Republic, Denmark, Finland, France, Germany, Ireland, Italy, Netherlands, Norway, Poland, Spain, Sweden, Switzerland, Turkey, UK
Gulf: Dubai, Qatar, United Arab Emirates
Asia Pacific: Australia, Malaysia, New Zealand, Philippines, Singapore
The BRICS: Brazil, China, India, Russia, South Africa
North America: United States (not including Alaska).
Which technologies?Our analysis includes seven renewable technologies: solar PV (photovoltaic), solar CSP (concentrated solar power), onshore wind, offshore wind, hydro, geothermal and biomass.
We also look at four conventional technologies: nuclear1, combined cycle gas turbine (CCGT), gas turbine (GT) and coal.
Business case calculationsOur review considers investments ‘today’ in new power generating plants2. Our business case calculations award a maximum score of 90 points, which is calculated based on the expected internal rate of return (IRR). The higher the IRR, the more points are awarded, up to a maximum of 90 points for each technology. The IRR takes into account the factors that influence the financial performance of an energy project.
These are:
• initial investment costs
• operation and maintenance (O&M) costs
• revenues – capacity factors, incentives, subsidies, market price forecasts and revenues from combined heat and power (CHP)
• fuel costs – heat rates (ie efficiencies) and fuel price forecasts
• CO2 emissions – emissions per MWh and CO2 price forecasts.
1. In our online tool, we have shaded Scotland differently as a result of the Scottish Government’s no-nuclear policy.
2. The analysis does not consider expected risks and returns associated with investments in existing generating plants.
6 MAPPING ENERGY INVESTMENT POTENTIAL AROUND THE WORLD
Risk assessmentOur risk assessment is also based on a score of a maximum 90 points, which is weighted across all risk factors for each technology.
These are:
• country risk – specifically, credit default and financing risk
• market risk – revenue risk and market potential
• project risk – technology availability and grid access
• operational risk – sourcing and fuel risk, labour availability and O&M expertise.
Interpreting the resultsTogether, the business case and risk assessment scores give a total score out of a potential 180 points for each technology in each country. We interpret the score as follows:
• 150–180 points: Relatively high IRR due to excellent market, regulatory and infrastructure conditions, high demand for new capacities and very low levels of country, financing, project, technology and operational risk
• 120–150 points: Moderate to relatively high IRR due to good market, regulatory and infrastructure conditions, moderate to high demand for new capacities and low levels of country, financing, project, technology and operational risk
• 90–120 points: Relatively low to moderate IRR due to poor to moderate market, regulatory and infrastructure conditions, low to moderate demand for new capacities, and moderate levels of country, financing, project, technology and operational risk
• 90 points: Comparatively low or negative IRR due to poor current market conditions, regulatory and infrastructure conditions, relatively low demand for new capacities and high levels of country, financing, project, technology and operational risk.
7PACONSULTING.COM
Sources PA would like to thank and attribute the sources whose publically available data helped inform our Energy Investment Map. Along with calculations and assumptions based on PA proprietary databases gathered in numerous projects, PA used data from:
National and international statistical offices: US Energy Information Administration, Eurostat and Destatis.
National energy departments: South Africa Ministry of Energy; Energiekamer van de Nederlandse Mededingsautoriteit, Netherlands; New Zealand Ministry of Business, Innovation and Employment; Operador Nacional do Sistema Electrico, Brazil; Ministry of Energy and Mining, Brazil; Energy Market Regulatory Authority, Turkey; Ministry of Energy, Russia; Department of Energy and Climate Change, UK; Federal Ministry for Environment, Nature Conservation and Nuclear Safety, Germany; Department of Energy, Communications and Natural Resources, Ireland; Ministry of Ecology, Sustainable Development and Energy, France; Ministry for Climate and Energy, Denmark; Ministry of Economy, Poland; Ministry of the Environment, Czech Republic; Federal Ministry of Economy, Family and Youth, Energy and Mining, Austria; Ministry of the Environment, and Ministry of Enterprise, Energy and Communications, Sweden; Ministry of Employment and the Economy, Finland.
Authorities, operators or agencies: New Zealand Electricity Authority; Database of State Incentives for Renewable & Efficiency, US; National Renewable Energy Laboratory, US; Singapore Energy Market Authority; Australian Stock Exchange; Energy Regulator of Australia; Philippines Energy Regulatory Commission; Suruhanjaya tenaga, Malaysia; South Africa Energy Regulator; India Energy Exchange; Central Electricity Authority, India; Tennet TSO für Netzinformationen, Netherlands; Agentschap nl für alle feed ins, Netherlands; Brazilian Intercontinental Exchange; BOTAS; National Energy Commission, China Electricity Council; Oxford Energy Institute; European Commission; RES-Legal.com; German Energy Agency; Danish Energy Agency; Danish Energy Regulatory Authority; Agency for Renewable Energy and Energy Efficiency of Switzerland; Swedish Energy Agency; Stattnet; Energinet; Energy market regulator of Spain; Gestore Servizi Energetici of Italy.
Please contact us if you require further clarification on PA’s methodology or the sources we used to create our Energy Investment Map.
E-mail: [email protected]
Phone: +44 (0) 20 7333 6112 (Europe) or +1 212 973 5977 (US).
8 MAPPING ENERGY INVESTMENT POTENTIAL AROUND THE WORLD
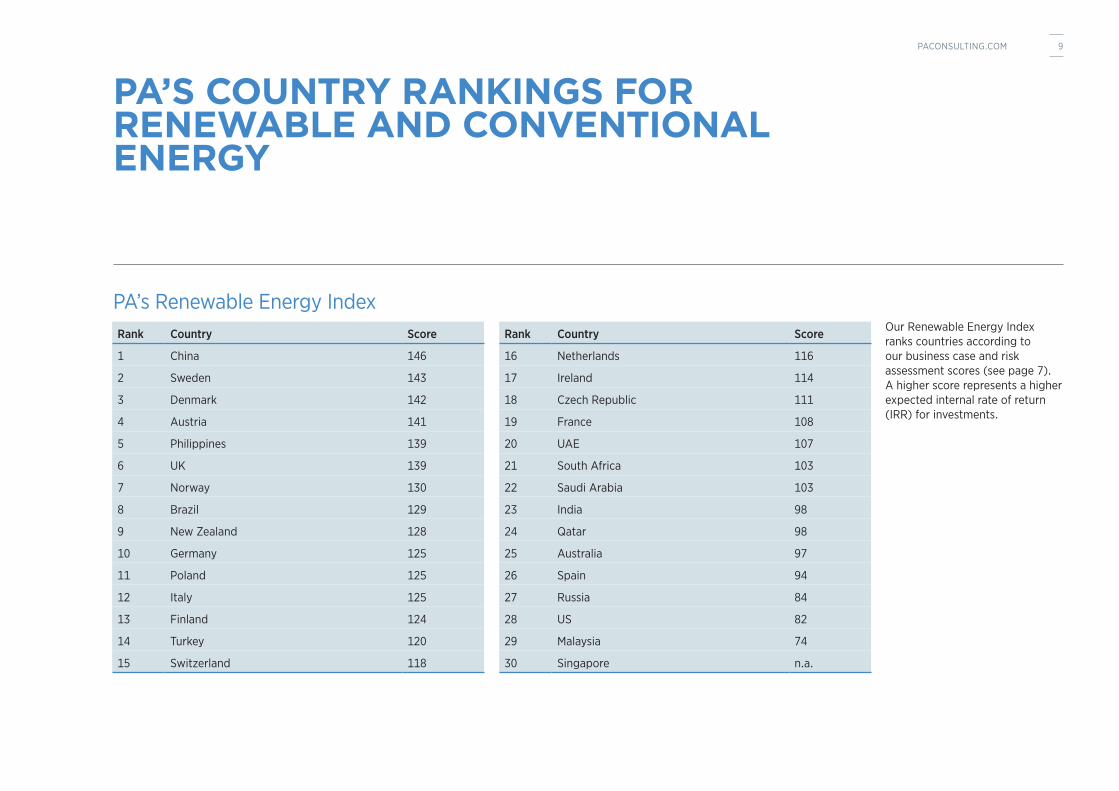
PA’s Renewable Energy IndexOur Renewable Energy Index ranks countries according to our business case and risk assessment scores (see page 7). A higher score represents a higher expected internal rate of return (IRR) for investments.
PA’S COUNTRY RANKINGS FOR RENEWABLE AND CONVENTIONAL ENERGY
Rank Country Score
1 China 146
2 Sweden 143
3 Denmark 142
4 Austria 141
5 Philippines 139
6 UK 139
7 Norway 130
8 Brazil 129
9 New Zealand 128
10 Germany 125
11 Poland 125
12 Italy 125
13 Finland 124
14 Turkey 120
15 Switzerland 118
Rank Country Score
16 Netherlands 116
17 Ireland 114
18 Czech Republic 111
19 France 108
20 UAE 107
21 South Africa 103
22 Saudi Arabia 103
23 India 98
24 Qatar 98
25 Australia 97
26 Spain 94
27 Russia 84
28 US 82
29 Malaysia 74
30 Singapore n.a.
9PACONSULTING.COM
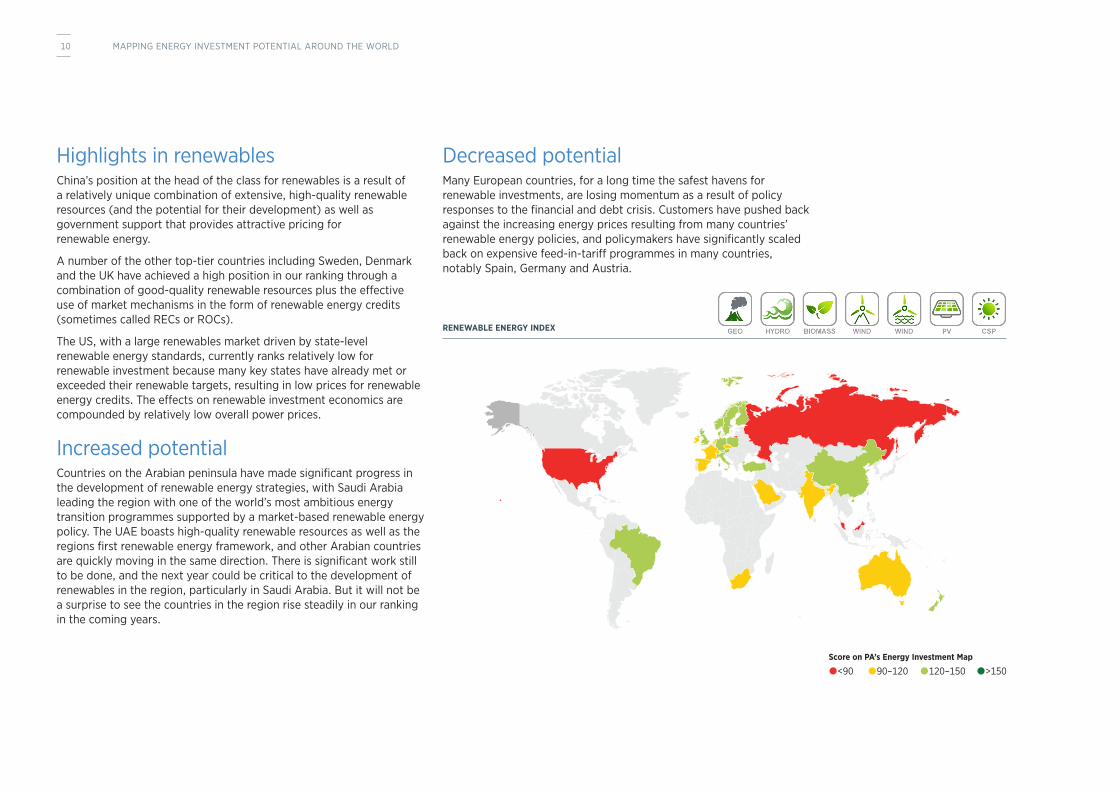
Highlights in renewables China’s position at the head of the class for renewables is a result of a relatively unique combination of extensive, high-quality renewable resources (and the potential for their development) as well as government support that provides attractive pricing for renewable energy.
A number of the other top-tier countries including Sweden, Denmark and the UK have achieved a high position in our ranking through a combination of good-quality renewable resources plus the effective use of market mechanisms in the form of renewable energy credits (sometimes called RECs or ROCs).
The US, with a large renewables market driven by state-level renewable energy standards, currently ranks relatively low for renewable investment because many key states have already met or exceeded their renewable targets, resulting in low prices for renewable energy credits. The effects on renewable investment economics are compounded by relatively low overall power prices.
Increased potentialCountries on the Arabian peninsula have made significant progress in the development of renewable energy strategies, with Saudi Arabia leading the region with one of the world’s most ambitious energy transition programmes supported by a market-based renewable energy policy. The UAE boasts high-quality renewable resources as well as the regions first renewable energy framework, and other Arabian countries are quickly moving in the same direction. There is significant work still to be done, and the next year could be critical to the development of renewables in the region, particularly in Saudi Arabia. But it will not be a surprise to see the countries in the region rise steadily in our ranking in the coming years.
Decreased potentialMany European countries, for a long time the safest havens for renewable investments, are losing momentum as a result of policy responses to the financial and debt crisis. Customers have pushed back against the increasing energy prices resulting from many countries’ renewable energy policies, and policymakers have significantly scaled back on expensive feed-in-tariff programmes in many countries, notably Spain, Germany and Austria.
RENEWABLE ENERGY INDEX
<90 90–120 120–150 >150Score on PA’s Energy Investment Map
10 MAPPING ENERGY INVESTMENT POTENTIAL AROUND THE WORLD
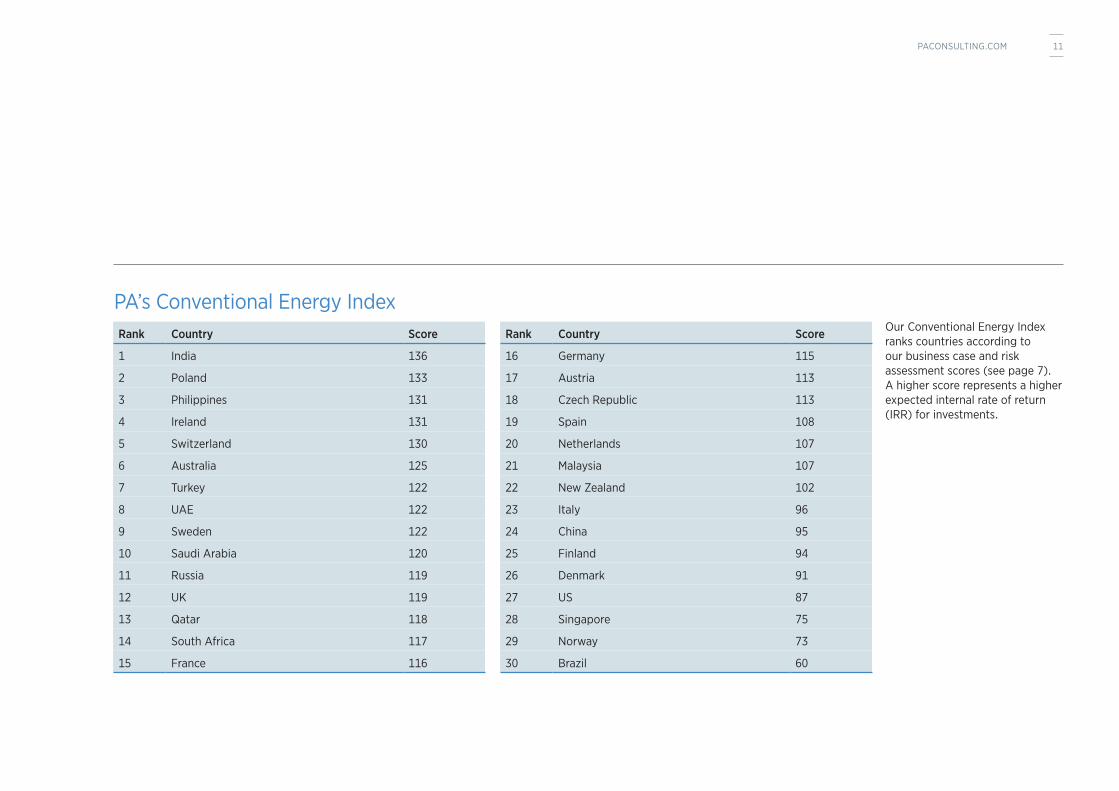
PA’s Conventional Energy IndexRank Country Score
1 India 136
2 Poland 133
3 Philippines 131
4 Ireland 131
5 Switzerland 130
6 Australia 125
7 Turkey 122
8 UAE 122
9 Sweden 122
10 Saudi Arabia 120
11 Russia 119
12 UK 119
13 Qatar 118
14 South Africa 117
15 France 116
Rank Country Score
16 Germany 115
17 Austria 113
18 Czech Republic 113
19 Spain 108
20 Netherlands 107
21 Malaysia 107
22 New Zealand 102
23 Italy 96
24 China 95
25 Finland 94
26 Denmark 91
27 US 87
28 Singapore 75
29 Norway 73
30 Brazil 60
Our Conventional Energy Index ranks countries according to our business case and risk assessment scores (see page 7). A higher score represents a higher expected internal rate of return (IRR) for investments.
11PACONSULTING.COM
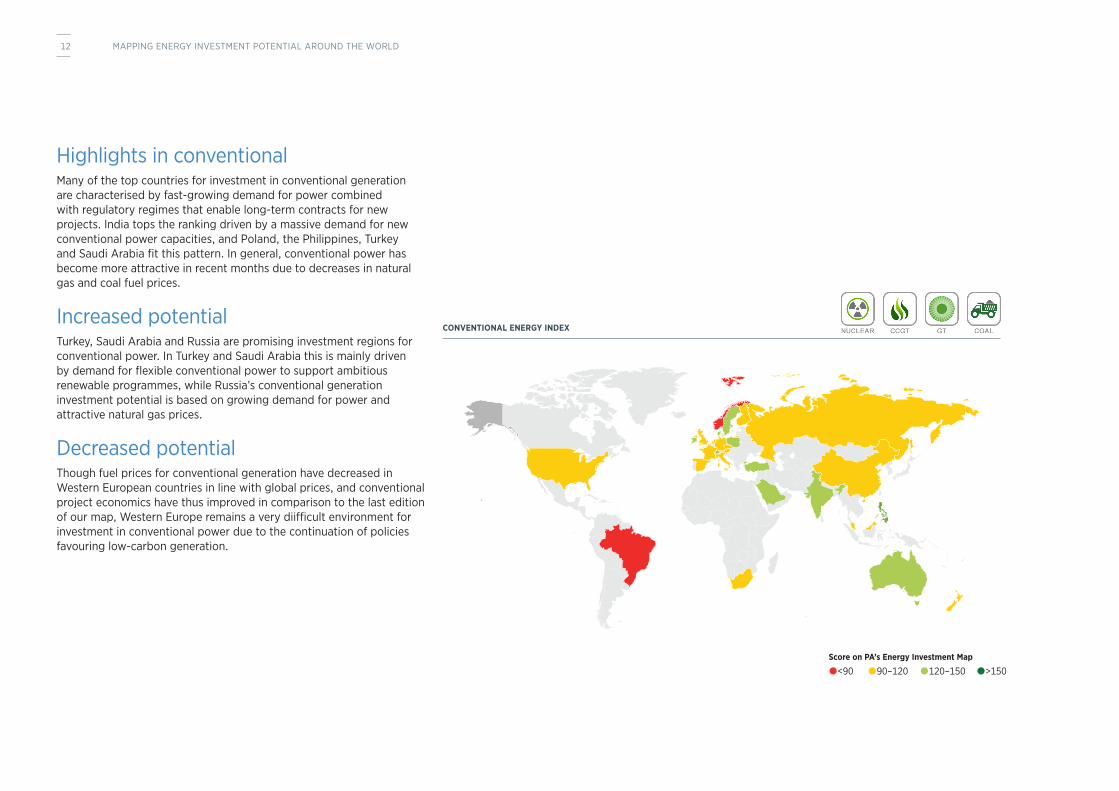
Highlights in conventionalMany of the top countries for investment in conventional generation are characterised by fast-growing demand for power combined with regulatory regimes that enable long-term contracts for new projects. India tops the ranking driven by a massive demand for new conventional power capacities, and Poland, the Philippines, Turkey and Saudi Arabia fit this pattern. In general, conventional power has become more attractive in recent months due to decreases in natural gas and coal fuel prices.
Increased potentialTurkey, Saudi Arabia and Russia are promising investment regions for conventional power. In Turkey and Saudi Arabia this is mainly driven by demand for flexible conventional power to support ambitious renewable programmes, while Russia’s conventional generation investment potential is based on growing demand for power and attractive natural gas prices.
Decreased potentialThough fuel prices for conventional generation have decreased in Western European countries in line with global prices, and conventional project economics have thus improved in comparison to the last edition of our map, Western Europe remains a very diifficult environment for investment in conventional power due to the continuation of policies favouring low-carbon generation.
CONVENTIONAL ENERGY INDEX
<90 90–120 120–150 >150Score on PA’s Energy Investment Map
12 MAPPING ENERGY INVESTMENT POTENTIAL AROUND THE WORLD
COUNTRY-BY-COUNTRY INSIGHT
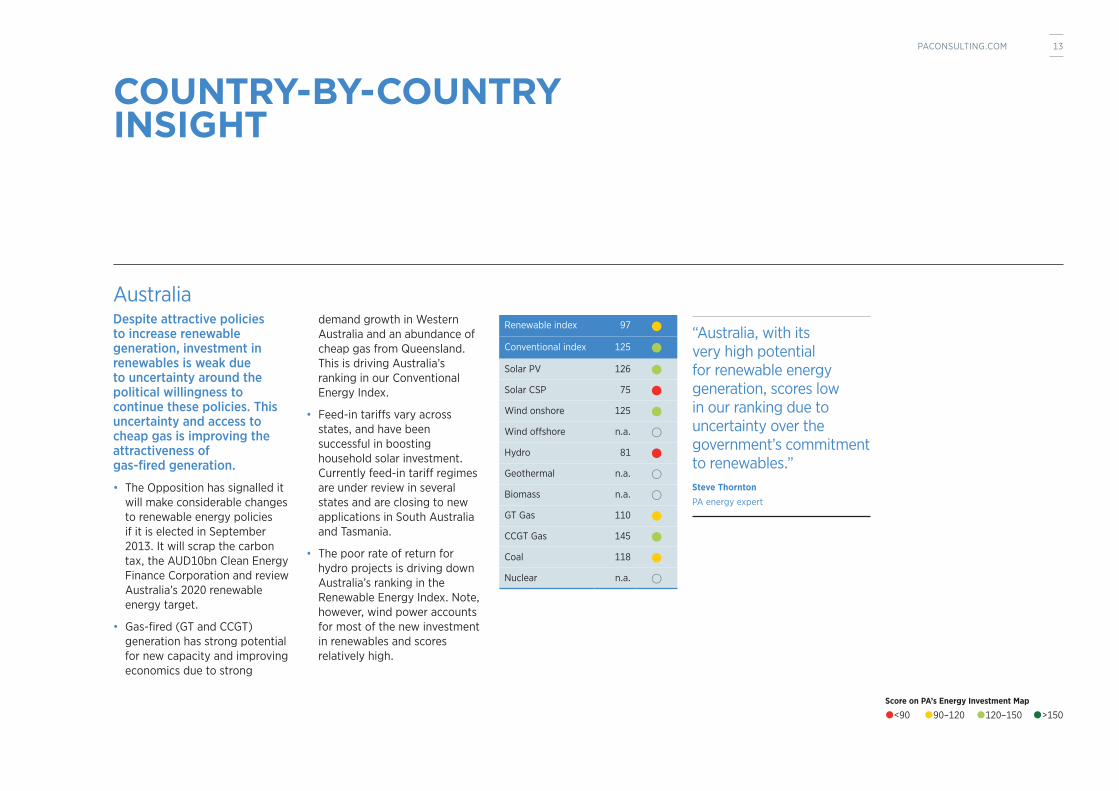
AustraliaDespite attractive policies to increase renewable generation, investment in renewables is weak due to uncertainty around the political willingness to continue these policies. This uncertainty and access to cheap gas is improving the attractiveness of gas-fired generation.
• The Opposition has signalled it will make considerable changes to renewable energy policies if it is elected in September 2013. It will scrap the carbon tax, the AUD10bn Clean Energy Finance Corporation and review Australia’s 2020 renewable energy target.
• Gas-fired (GT and CCGT) generation has strong potential for new capacity and improving economics due to strong
demand growth in Western Australia and an abundance of cheap gas from Queensland. This is driving Australia’s ranking in our Conventional Energy Index.
• Feed-in tariffs vary across states, and have been successful in boosting household solar investment. Currently feed-in tariff regimes are under review in several states and are closing to new applications in South Australia and Tasmania.
• The poor rate of return for hydro projects is driving down Australia’s ranking in the Renewable Energy Index. Note, however, wind power accounts for most of the new investment in renewables and scores relatively high.
Renewable index 97
Conventional index 125
Solar PV 126
Solar CSP 75
Wind onshore 125
Wind offshore n.a.
Hydro 81
Geothermal n.a.
Biomass n.a.
GT Gas 110
CCGT Gas 145
Coal 118
Nuclear n.a.
“Australia, with its very high potential for renewable energy generation, scores low in our ranking due to uncertainty over the government’s commitment to renewables.” Steve Thornton PA energy expert
<90 90–120 120–150 >150Score on PA’s Energy Investment Map
13PACONSULTING.COM
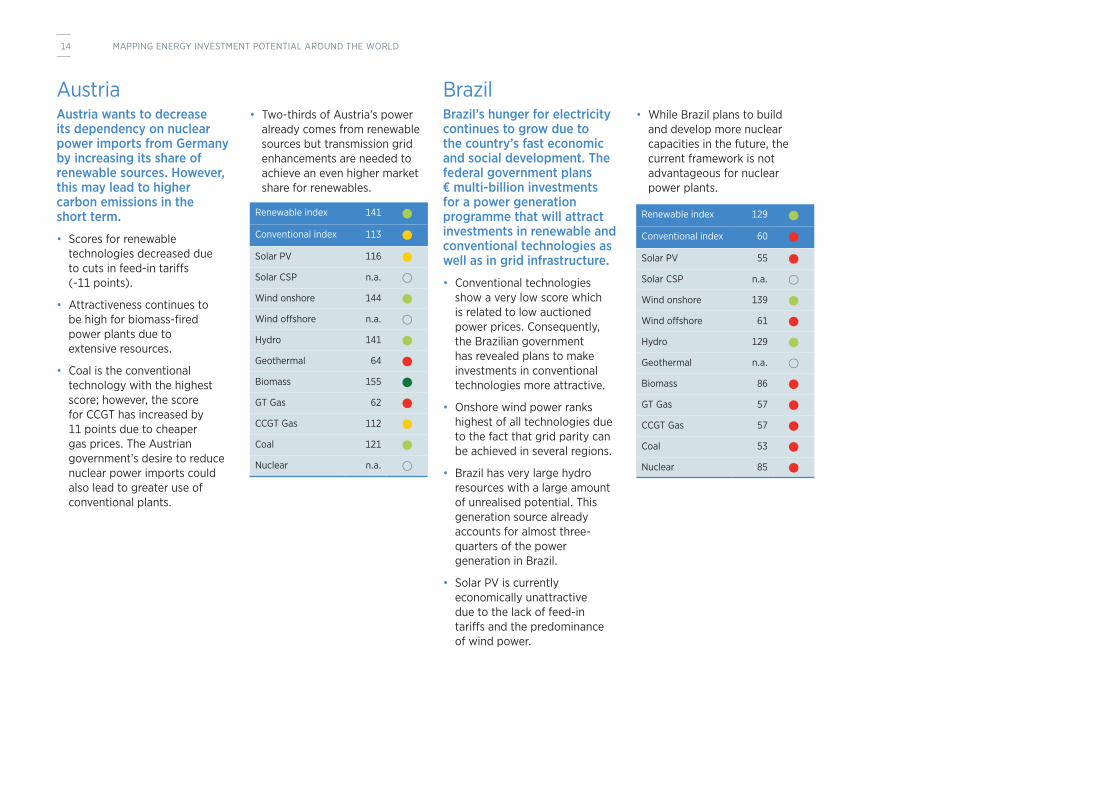
AustriaAustria wants to decrease its dependency on nuclear power imports from Germany by increasing its share of renewable sources. However, this may lead to higher carbon emissions in the short term.
• Scores for renewable technologies decreased due to cuts in feed-in tariffs (-11 points).
• Attractiveness continues to be high for biomass-fired power plants due to extensive resources.
• Coal is the conventional technology with the highest score; however, the score for CCGT has increased by 11 points due to cheaper gas prices. The Austrian government’s desire to reduce nuclear power imports could also lead to greater use of conventional plants.
• Two-thirds of Austria’s power already comes from renewable sources but transmission grid enhancements are needed to achieve an even higher market share for renewables.
Renewable index 141
Conventional index 113
Solar PV 116
Solar CSP n.a.
Wind onshore 144
Wind offshore n.a.
Hydro 141
Geothermal 64
Biomass 155
GT Gas 62
CCGT Gas 112
Coal 121
Nuclear n.a.
BrazilBrazil’s hunger for electricity continues to grow due to the country’s fast economic and social development. The federal government plans € multi-billion investments for a power generation programme that will attract investments in renewable and conventional technologies as well as in grid infrastructure.
• Conventional technologies show a very low score which is related to low auctioned power prices. Consequently, the Brazilian government has revealed plans to make investments in conventional technologies more attractive.
• Onshore wind power ranks highest of all technologies due to the fact that grid parity can be achieved in several regions.
• Brazil has very large hydro resources with a large amount of unrealised potential. This generation source already accounts for almost three-quarters of the power generation in Brazil.
• Solar PV is currently economically unattractive due to the lack of feed-in tariffs and the predominance of wind power.
• While Brazil plans to build and develop more nuclear capacities in the future, the current framework is not advantageous for nuclear power plants.
Renewable index 129
Conventional index 60
Solar PV 55
Solar CSP n.a.
Wind onshore 139
Wind offshore 61
Hydro 129
Geothermal n.a.
Biomass 86
GT Gas 57
CCGT Gas 57
Coal 53
Nuclear 85
14 MAPPING ENERGY INVESTMENT POTENTIAL AROUND THE WORLD
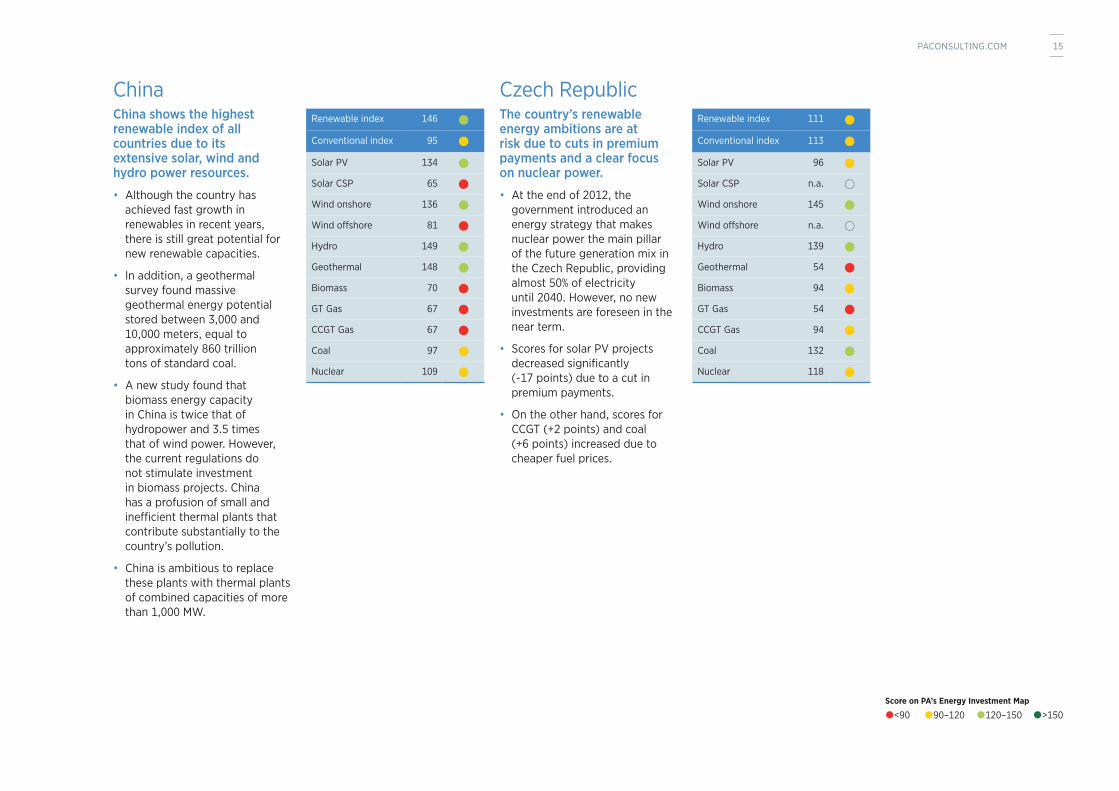
ChinaChina shows the highest renewable index of all countries due to its extensive solar, wind and hydro power resources.
• Although the country has achieved fast growth in renewables in recent years, there is still great potential for new renewable capacities.
• In addition, a geothermal survey found massive geothermal energy potential stored between 3,000 and 10,000 meters, equal to approximately 860 trillion tons of standard coal.
• A new study found that biomass energy capacity in China is twice that of hydropower and 3.5 times that of wind power. However, the current regulations do not stimulate investment in biomass projects. China has a profusion of small and inefficient thermal plants that contribute substantially to the country’s pollution.
• China is ambitious to replace these plants with thermal plants of combined capacities of more than 1,000 MW.
Czech Republic The country’s renewable energy ambitions are at risk due to cuts in premium payments and a clear focus on nuclear power.
• At the end of 2012, the government introduced an energy strategy that makes nuclear power the main pillar of the future generation mix in the Czech Republic, providing almost 50% of electricity until 2040. However, no new investments are foreseen in the near term.
• Scores for solar PV projects decreased significantly (-17 points) due to a cut in premium payments.
• On the other hand, scores for CCGT (+2 points) and coal (+6 points) increased due to cheaper fuel prices.
Renewable index 146
Conventional index 95
Solar PV 134
Solar CSP 65
Wind onshore 136
Wind offshore 81
Hydro 149
Geothermal 148
Biomass 70
GT Gas 67
CCGT Gas 67
Coal 97
Nuclear 109
Renewable index 111
Conventional index 113
Solar PV 96
Solar CSP n.a.
Wind onshore 145
Wind offshore n.a.
Hydro 139
Geothermal 54
Biomass 94
GT Gas 54
CCGT Gas 94
Coal 132
Nuclear 118
<90 90–120 120–150 >150Score on PA’s Energy Investment Map
15PACONSULTING.COM
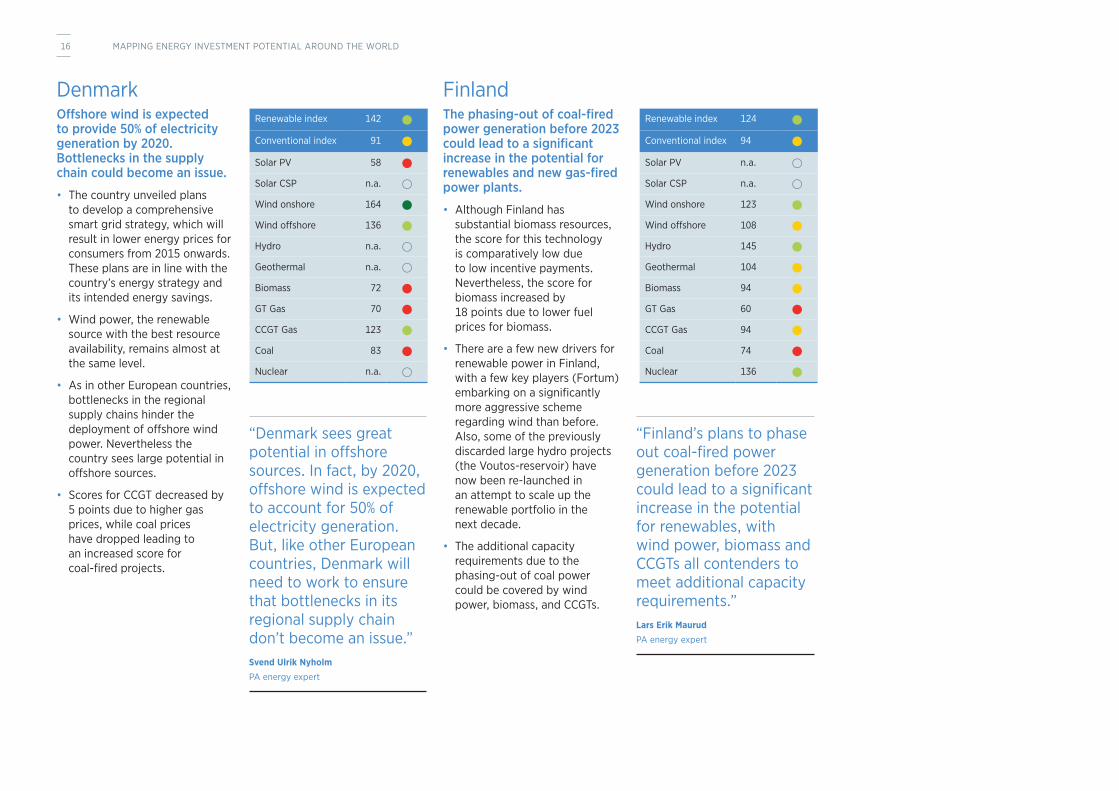
DenmarkOffshore wind is expected to provide 50% of electricity generation by 2020. Bottlenecks in the supply chain could become an issue.
• The country unveiled plans to develop a comprehensive smart grid strategy, which will result in lower energy prices for consumers from 2015 onwards. These plans are in line with the country’s energy strategy and its intended energy savings.
• Wind power, the renewable source with the best resource availability, remains almost at the same level.
• As in other European countries, bottlenecks in the regional supply chains hinder the deployment of offshore wind power. Nevertheless the country sees large potential in offshore sources.
• Scores for CCGT decreased by 5 points due to higher gas prices, while coal prices have dropped leading to an increased score for coal-fired projects.
FinlandThe phasing-out of coal-fired power generation before 2023 could lead to a significant increase in the potential for renewables and new gas-fired power plants.
• Although Finland has substantial biomass resources, the score for this technology is comparatively low due to low incentive payments. Nevertheless, the score for biomass increased by 18 points due to lower fuel prices for biomass.
• There are a few new drivers for renewable power in Finland, with a few key players (Fortum) embarking on a significantly more aggressive scheme regarding wind than before. Also, some of the previously discarded large hydro projects (the Voutos-reservoir) have now been re-launched in an attempt to scale up the renewable portfolio in the next decade.
• The additional capacity requirements due to the phasing-out of coal power could be covered by wind power, biomass, and CCGTs.
Renewable index 142
Conventional index 91
Solar PV 58
Solar CSP n.a.
Wind onshore 164
Wind offshore 136
Hydro n.a.
Geothermal n.a.
Biomass 72
GT Gas 70
CCGT Gas 123
Coal 83
Nuclear n.a.
Renewable index 124
Conventional index 94
Solar PV n.a.
Solar CSP n.a.
Wind onshore 123
Wind offshore 108
Hydro 145
Geothermal 104
Biomass 94
GT Gas 60
CCGT Gas 94
Coal 74
Nuclear 136
“Denmark sees great potential in offshore sources. In fact, by 2020, offshore wind is expected to account for 50% of electricity generation. But, like other European countries, Denmark will need to work to ensure that bottlenecks in its regional supply chain don’t become an issue.”Svend Ulrik Nyholm PA energy expert
“Finland’s plans to phase out coal-fired power generation before 2023 could lead to a significant increase in the potential for renewables, with wind power, biomass and CCGTs all contenders to meet additional capacity requirements.” Lars Erik Maurud PA energy expert
16 MAPPING ENERGY INVESTMENT POTENTIAL AROUND THE WORLD
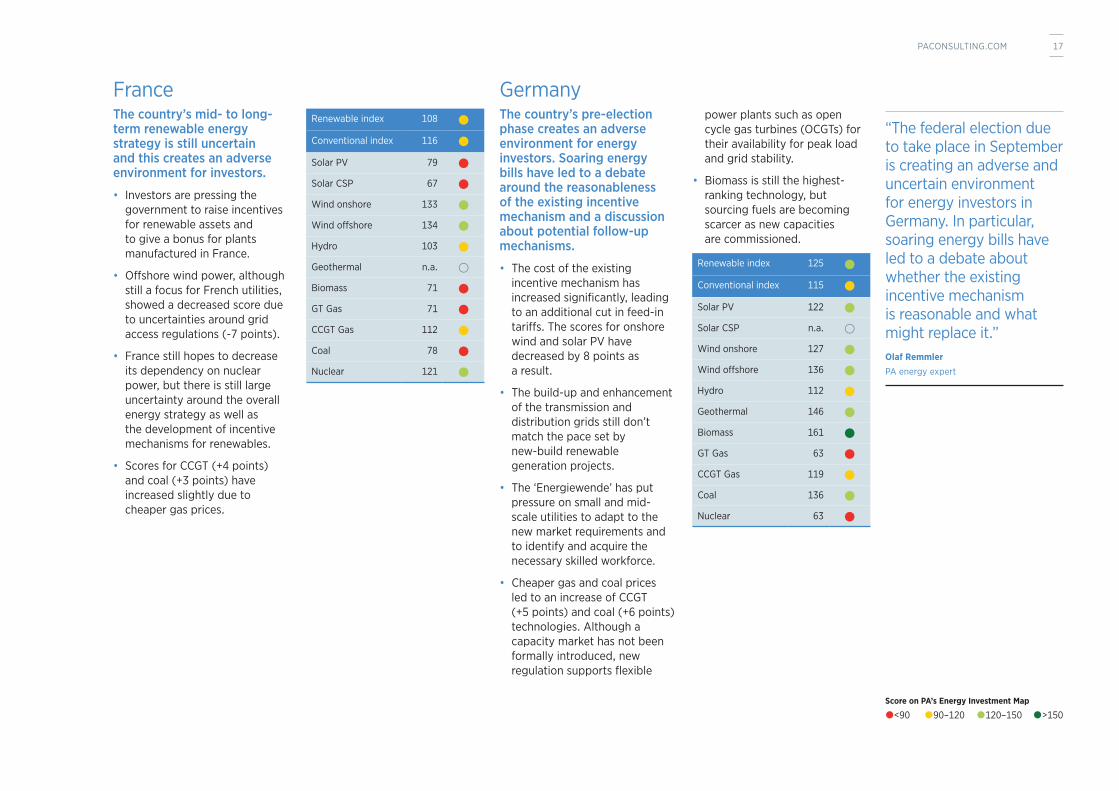
FranceThe country’s mid- to long-term renewable energy strategy is still uncertain and this creates an adverse environment for investors.
• Investors are pressing the government to raise incentives for renewable assets and to give a bonus for plants manufactured in France.
• Offshore wind power, although still a focus for French utilities, showed a decreased score due to uncertainties around grid access regulations (-7 points).
• France still hopes to decrease its dependency on nuclear power, but there is still large uncertainty around the overall energy strategy as well as the development of incentive mechanisms for renewables.
• Scores for CCGT (+4 points) and coal (+3 points) have increased slightly due to cheaper gas prices.
GermanyThe country’s pre-election phase creates an adverse environment for energy investors. Soaring energy bills have led to a debate around the reasonableness of the existing incentive mechanism and a discussion about potential follow-up mechanisms.
• The cost of the existing incentive mechanism has increased significantly, leading to an additional cut in feed-in tariffs. The scores for onshore wind and solar PV have decreased by 8 points as a result.
• The build-up and enhancement of the transmission and distribution grids still don’t match the pace set by new-build renewable generation projects.
• The ‘Energiewende’ has put pressure on small and mid-scale utilities to adapt to the new market requirements and to identify and acquire the necessary skilled workforce.
• Cheaper gas and coal prices led to an increase of CCGT (+5 points) and coal (+6 points) technologies. Although a capacity market has not been formally introduced, new regulation supports flexible
power plants such as open cycle gas turbines (OCGTs) for their availability for peak load and grid stability.
• Biomass is still the highest-ranking technology, but sourcing fuels are becoming scarcer as new capacities are commissioned.
Renewable index 108
Conventional index 116
Solar PV 79
Solar CSP 67
Wind onshore 133
Wind offshore 134
Hydro 103
Geothermal n.a.
Biomass 71
GT Gas 71
CCGT Gas 112
Coal 78
Nuclear 121
Renewable index 125
Conventional index 115
Solar PV 122
Solar CSP n.a.
Wind onshore 127
Wind offshore 136
Hydro 112
Geothermal 146
Biomass 161
GT Gas 63
CCGT Gas 119
Coal 136
Nuclear 63
<90 90–120 120–150 >150Score on PA’s Energy Investment Map
“The federal election due to take place in September is creating an adverse and uncertain environment for energy investors in Germany. In particular, soaring energy bills have led to a debate about whether the existing incentive mechanism is reasonable and what might replace it.” Olaf Remmler PA energy expert
17PACONSULTING.COM
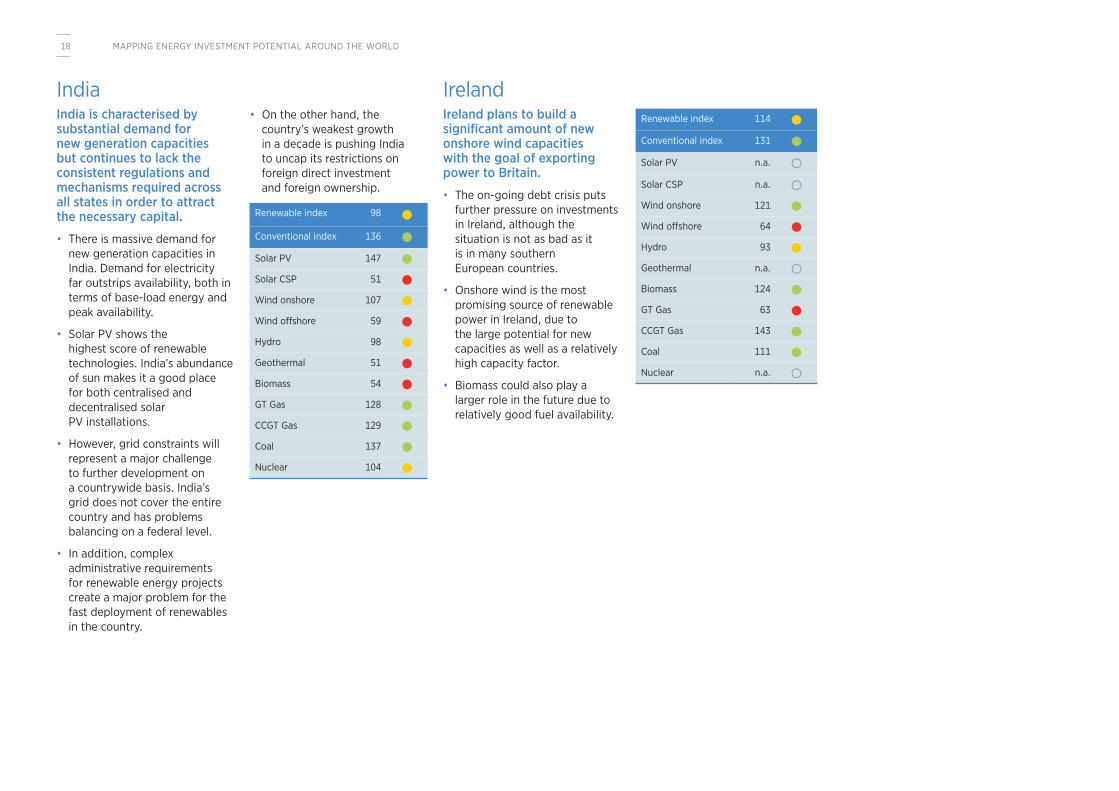
IndiaIndia is characterised by substantial demand for new generation capacities but continues to lack the consistent regulations and mechanisms required across all states in order to attract the necessary capital.
• There is massive demand for new generation capacities in India. Demand for electricity far outstrips availability, both in terms of base-load energy and peak availability.
• Solar PV shows the highest score of renewable technologies. India’s abundance of sun makes it a good place for both centralised and decentralised solar PV installations.
• However, grid constraints will represent a major challenge to further development on a countrywide basis. India’s grid does not cover the entire country and has problems balancing on a federal level.
• In addition, complex administrative requirements for renewable energy projects create a major problem for the fast deployment of renewables in the country.
• On the other hand, the country’s weakest growth in a decade is pushing India to uncap its restrictions on foreign direct investment and foreign ownership.
IrelandIreland plans to build a significant amount of new onshore wind capacities with the goal of exporting power to Britain.
• The on-going debt crisis puts further pressure on investments in Ireland, although the situation is not as bad as it is in many southern European countries.
• Onshore wind is the most promising source of renewable power in Ireland, due to the large potential for new capacities as well as a relatively high capacity factor.
• Biomass could also play a larger role in the future due to relatively good fuel availability.
Renewable index 98
Conventional index 136
Solar PV 147
Solar CSP 51
Wind onshore 107
Wind offshore 59
Hydro 98
Geothermal 51
Biomass 54
GT Gas 128
CCGT Gas 129
Coal 137
Nuclear 104
Renewable index 114
Conventional index 131
Solar PV n.a.
Solar CSP n.a.
Wind onshore 121
Wind offshore 64
Hydro 93
Geothermal n.a.
Biomass 124
GT Gas 63
CCGT Gas 143
Coal 111
Nuclear n.a.
18 MAPPING ENERGY INVESTMENT POTENTIAL AROUND THE WORLD
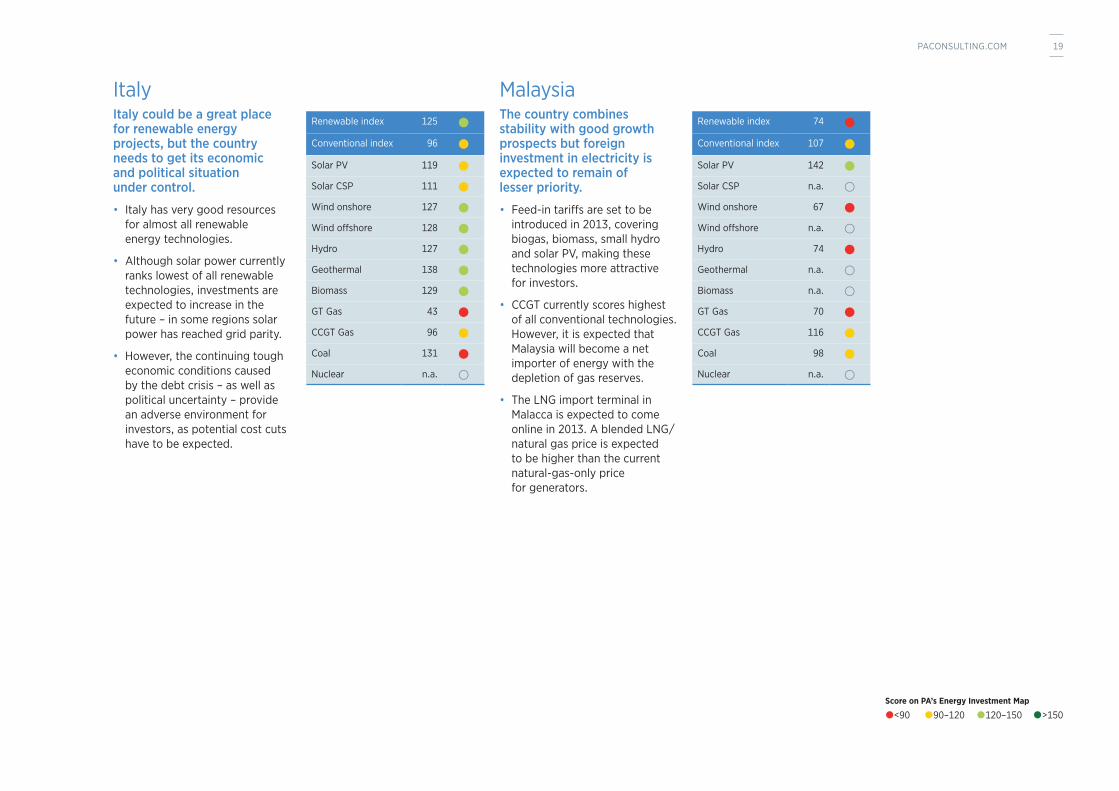
Italy Italy could be a great place for renewable energy projects, but the country needs to get its economic and political situation under control.
• Italy has very good resources for almost all renewable energy technologies.
• Although solar power currently ranks lowest of all renewable technologies, investments are expected to increase in the future – in some regions solar power has reached grid parity.
• However, the continuing tough economic conditions caused by the debt crisis – as well as political uncertainty – provide an adverse environment for investors, as potential cost cuts have to be expected.
MalaysiaThe country combines stability with good growth prospects but foreign investment in electricity is expected to remain of lesser priority.
• Feed-in tariffs are set to be introduced in 2013, covering biogas, biomass, small hydro and solar PV, making these technologies more attractive for investors.
• CCGT currently scores highest of all conventional technologies. However, it is expected that Malaysia will become a net importer of energy with the depletion of gas reserves.
• The LNG import terminal in Malacca is expected to come online in 2013. A blended LNG/natural gas price is expected to be higher than the current natural-gas-only price for generators.
Renewable index 125
Conventional index 96
Solar PV 119
Solar CSP 111
Wind onshore 127
Wind offshore 128
Hydro 127
Geothermal 138
Biomass 129
GT Gas 43
CCGT Gas 96
Coal 131
Nuclear n.a.
Renewable index 74
Conventional index 107
Solar PV 142
Solar CSP n.a.
Wind onshore 67
Wind offshore n.a.
Hydro 74
Geothermal n.a.
Biomass n.a.
GT Gas 70
CCGT Gas 116
Coal 98
Nuclear n.a.
<90 90–120 120–150 >150Score on PA’s Energy Investment Map
19PACONSULTING.COM
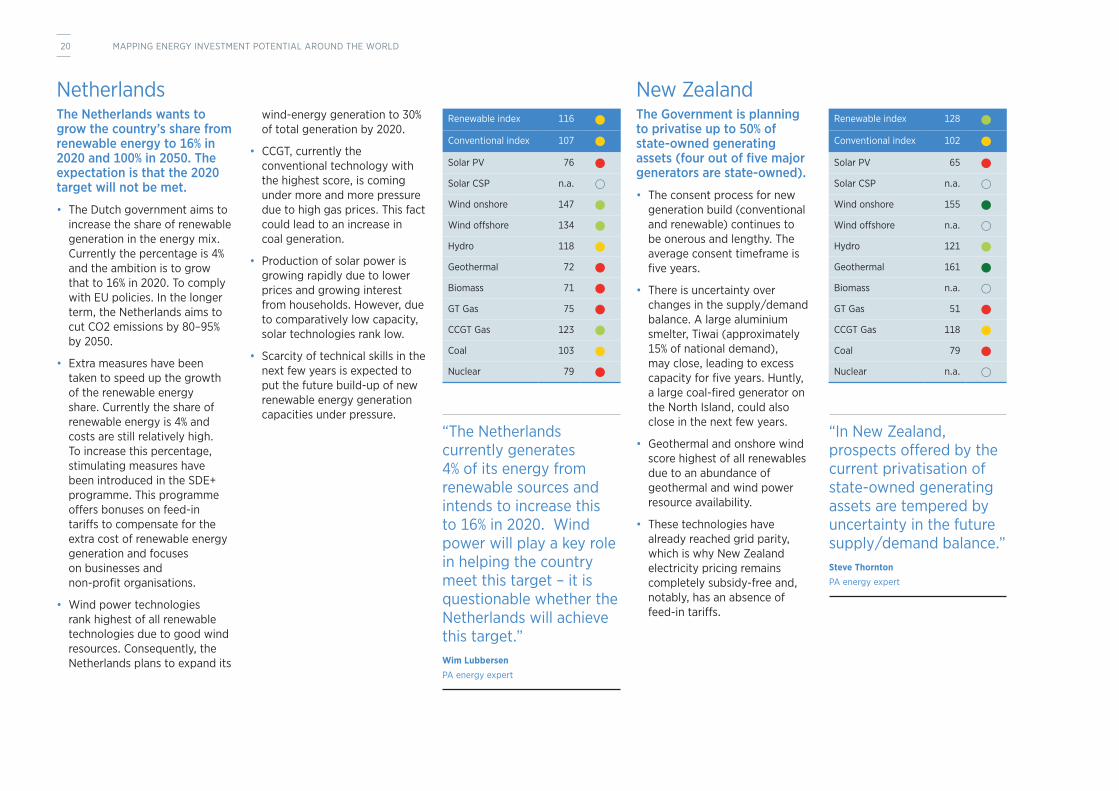
NetherlandsThe Netherlands wants to grow the country’s share from renewable energy to 16% in 2020 and 100% in 2050. The expectation is that the 2020 target will not be met.
• The Dutch government aims to increase the share of renewable generation in the energy mix. Currently the percentage is 4% and the ambition is to grow that to 16% in 2020. To comply with EU policies. In the longer term, the Netherlands aims to cut CO2 emissions by 80–95% by 2050.
• Extra measures have been taken to speed up the growth of the renewable energy share. Currently the share of renewable energy is 4% and costs are still relatively high. To increase this percentage, stimulating measures have been introduced in the SDE+ programme. This programme offers bonuses on feed-in tariffs to compensate for the extra cost of renewable energy generation and focuses on businesses and non-profit organisations.
• Wind power technologies rank highest of all renewable technologies due to good wind resources. Consequently, the Netherlands plans to expand its
wind-energy generation to 30% of total generation by 2020.
• CCGT, currently the conventional technology with the highest score, is coming under more and more pressure due to high gas prices. This fact could lead to an increase in coal generation.
• Production of solar power is growing rapidly due to lower prices and growing interest from households. However, due to comparatively low capacity, solar technologies rank low.
• Scarcity of technical skills in the next few years is expected to put the future build-up of new renewable energy generation capacities under pressure.
New ZealandThe Government is planning to privatise up to 50% of state-owned generating assets (four out of five major generators are state-owned).
• The consent process for new generation build (conventional and renewable) continues to be onerous and lengthy. The average consent timeframe is five years.
• There is uncertainty over changes in the supply/demand balance. A large aluminium smelter, Tiwai (approximately 15% of national demand), may close, leading to excess capacity for five years. Huntly, a large coal-fired generator on the North Island, could also close in the next few years.
• Geothermal and onshore wind score highest of all renewables due to an abundance of geothermal and wind power resource availability.
• These technologies have already reached grid parity, which is why New Zealand electricity pricing remains completely subsidy-free and, notably, has an absence of feed-in tariffs.
Renewable index 116
Conventional index 107
Solar PV 76
Solar CSP n.a.
Wind onshore 147
Wind offshore 134
Hydro 118
Geothermal 72
Biomass 71
GT Gas 75
CCGT Gas 123
Coal 103
Nuclear 79
Renewable index 128
Conventional index 102
Solar PV 65
Solar CSP n.a.
Wind onshore 155
Wind offshore n.a.
Hydro 121
Geothermal 161
Biomass n.a.
GT Gas 51
CCGT Gas 118
Coal 79
Nuclear n.a.
“The Netherlands currently generates 4% of its energy from renewable sources and intends to increase this to 16% in 2020. Wind power will play a key role in helping the country meet this target – it is questionable whether the Netherlands will achieve this target.”Wim Lubbersen PA energy expert
“In New Zealand, prospects offered by the current privatisation of state-owned generating assets are tempered by uncertainty in the future supply/demand balance.”Steve Thornton PA energy expert
20 MAPPING ENERGY INVESTMENT POTENTIAL AROUND THE WORLD
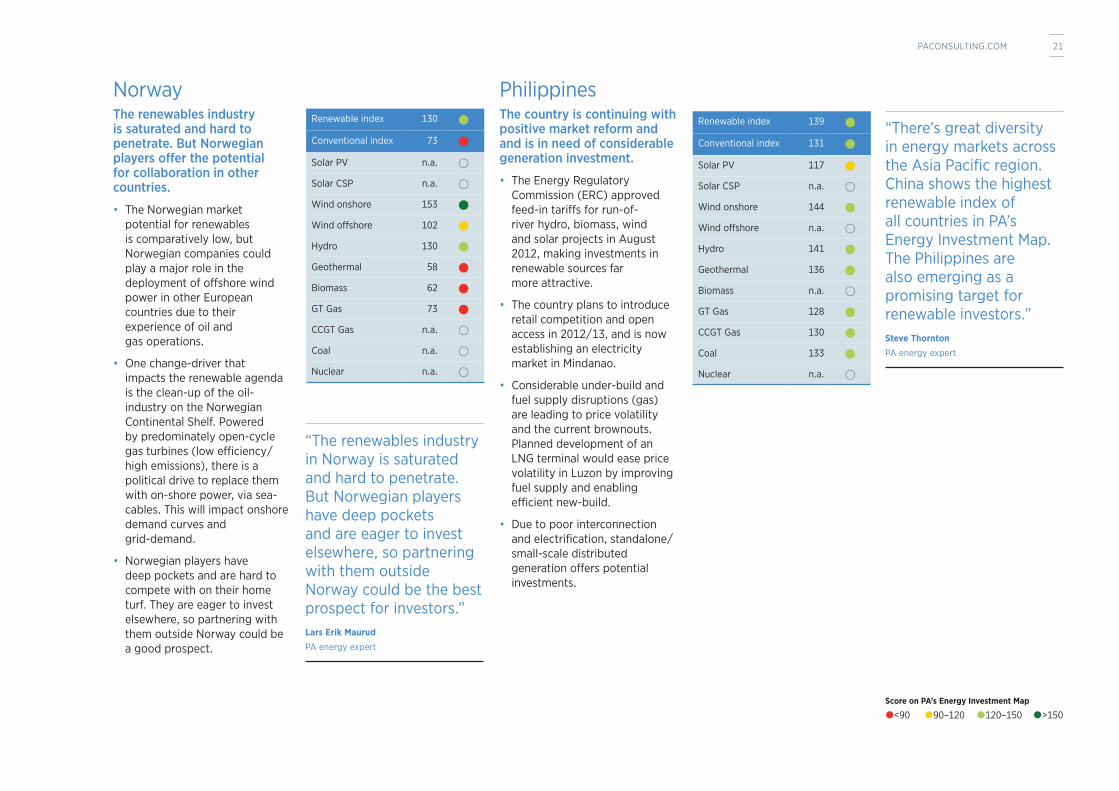
NorwayThe renewables industry is saturated and hard to penetrate. But Norwegian players offer the potential for collaboration in other countries.
• The Norwegian market potential for renewables is comparatively low, but Norwegian companies could play a major role in the deployment of offshore wind power in other European countries due to their experience of oil and gas operations.
• One change-driver that impacts the renewable agenda is the clean-up of the oil-industry on the Norwegian Continental Shelf. Powered by predominately open-cycle gas turbines (low efficiency/high emissions), there is a political drive to replace them with on-shore power, via sea-cables. This will impact onshore demand curves and grid-demand.
• Norwegian players have deep pockets and are hard to compete with on their home turf. They are eager to invest elsewhere, so partnering with them outside Norway could be a good prospect.
PhilippinesThe country is continuing with positive market reform and and is in need of considerable generation investment.
• The Energy Regulatory Commission (ERC) approved feed-in tariffs for run-of-river hydro, biomass, wind and solar projects in August 2012, making investments in renewable sources far more attractive.
• The country plans to introduce retail competition and open access in 2012/13, and is now establishing an electricity market in Mindanao.
• Considerable under-build and fuel supply disruptions (gas) are leading to price volatility and the current brownouts. Planned development of an LNG terminal would ease price volatility in Luzon by improving fuel supply and enabling efficient new-build.
• Due to poor interconnection and electrification, standalone/small-scale distributed generation offers potential investments.
Renewable index 130
Conventional index 73
Solar PV n.a.
Solar CSP n.a.
Wind onshore 153
Wind offshore 102
Hydro 130
Geothermal 58
Biomass 62
GT Gas 73
CCGT Gas n.a.
Coal n.a.
Nuclear n.a.
Renewable index 139
Conventional index 131
Solar PV 117
Solar CSP n.a.
Wind onshore 144
Wind offshore n.a.
Hydro 141
Geothermal 136
Biomass n.a.
GT Gas 128
CCGT Gas 130
Coal 133
Nuclear n.a.
“The renewables industry in Norway is saturated and hard to penetrate. But Norwegian players have deep pockets and are eager to invest elsewhere, so partnering with them outside Norway could be the best prospect for investors.” Lars Erik Maurud PA energy expert
“There’s great diversity in energy markets across the Asia Pacific region. China shows the highest renewable index of all countries in PA’s Energy Investment Map. The Philippines are also emerging as a promising target for renewable investors.” Steve Thornton PA energy expert
<90 90–120 120–150 >150Score on PA’s Energy Investment Map
21PACONSULTING.COM
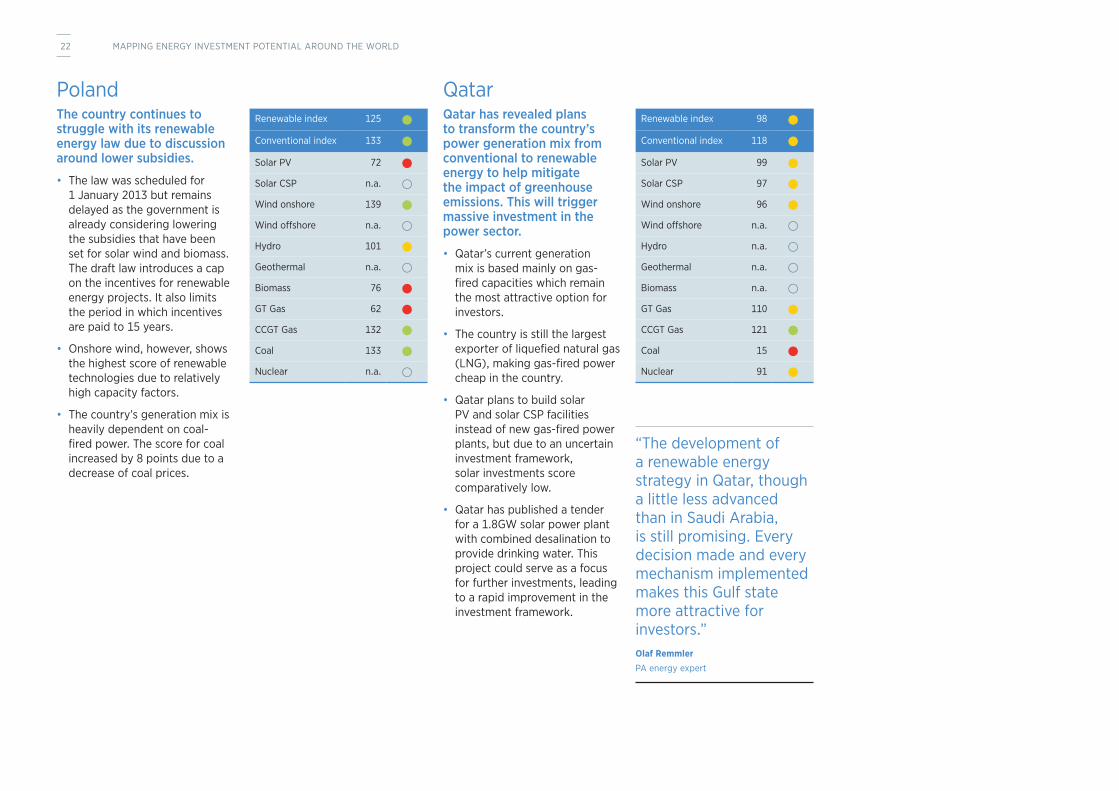
PolandThe country continues to struggle with its renewable energy law due to discussion around lower subsidies.
• The law was scheduled for 1 January 2013 but remains delayed as the government is already considering lowering the subsidies that have been set for solar wind and biomass. The draft law introduces a cap on the incentives for renewable energy projects. It also limits the period in which incentives are paid to 15 years.
• Onshore wind, however, shows the highest score of renewable technologies due to relatively high capacity factors.
• The country’s generation mix is heavily dependent on coal-fired power. The score for coal increased by 8 points due to a decrease of coal prices.
QatarQatar has revealed plans to transform the country’s power generation mix from conventional to renewable energy to help mitigate the impact of greenhouse emissions. This will trigger massive investment in the power sector.
• Qatar’s current generation mix is based mainly on gas-fired capacities which remain the most attractive option for investors.
• The country is still the largest exporter of liquefied natural gas (LNG), making gas-fired power cheap in the country.
• Qatar plans to build solar PV and solar CSP facilities instead of new gas-fired power plants, but due to an uncertain investment framework, solar investments score comparatively low.
• Qatar has published a tender for a 1.8GW solar power plant with combined desalination to provide drinking water. This project could serve as a focus for further investments, leading to a rapid improvement in the investment framework.
Renewable index 125
Conventional index 133
Solar PV 72
Solar CSP n.a.
Wind onshore 139
Wind offshore n.a.
Hydro 101
Geothermal n.a.
Biomass 76
GT Gas 62
CCGT Gas 132
Coal 133
Nuclear n.a.
Renewable index 98
Conventional index 118
Solar PV 99
Solar CSP 97
Wind onshore 96
Wind offshore n.a.
Hydro n.a.
Geothermal n.a.
Biomass n.a.
GT Gas 110
CCGT Gas 121
Coal 15
Nuclear 91
“The development of a renewable energy strategy in Qatar, though a little less advanced than in Saudi Arabia, is still promising. Every decision made and every mechanism implemented makes this Gulf state more attractive for investors.” Olaf Remmler PA energy expert
22 MAPPING ENERGY INVESTMENT POTENTIAL AROUND THE WORLD
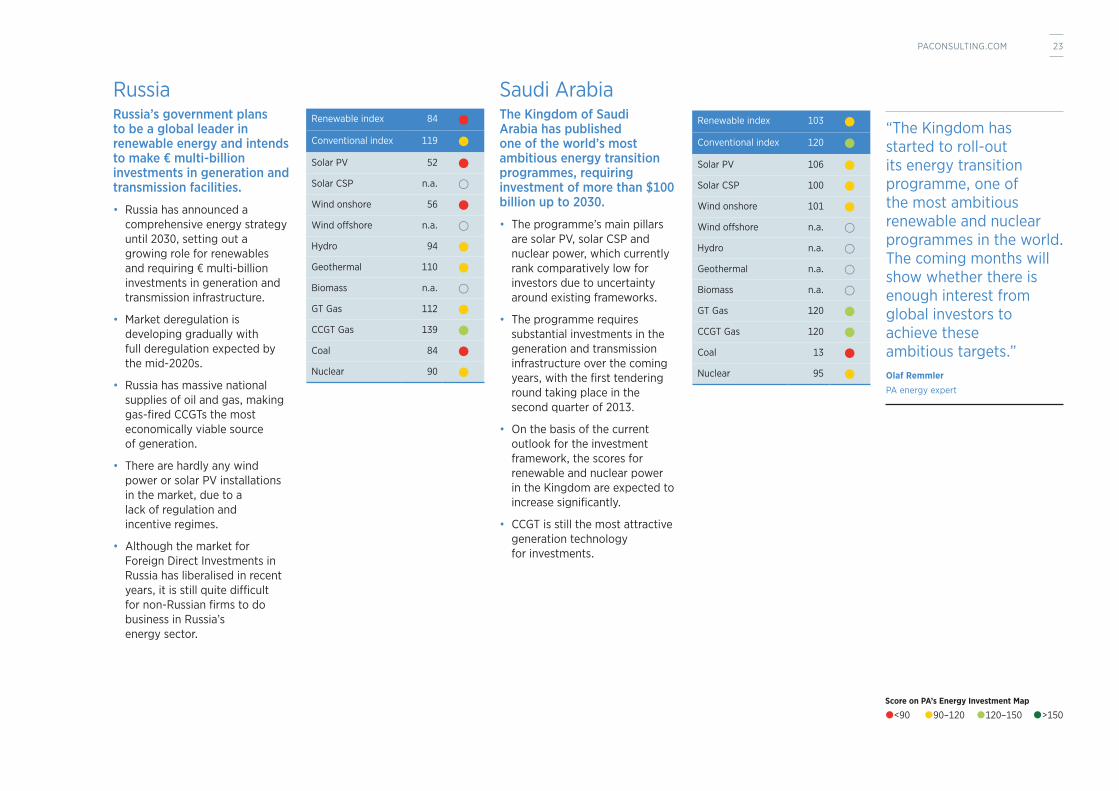
RussiaRussia’s government plans to be a global leader in renewable energy and intends to make € multi-billion investments in generation and transmission facilities.
• Russia has announced a comprehensive energy strategy until 2030, setting out a growing role for renewables and requiring € multi-billion investments in generation and transmission infrastructure.
• Market deregulation is developing gradually with full deregulation expected by the mid-2020s.
• Russia has massive national supplies of oil and gas, making gas-fired CCGTs the most economically viable source of generation.
• There are hardly any wind power or solar PV installations in the market, due to a lack of regulation and incentive regimes.
• Although the market for Foreign Direct Investments in Russia has liberalised in recent years, it is still quite difficult for non-Russian firms to do business in Russia’s energy sector.
Saudi ArabiaThe Kingdom of Saudi Arabia has published one of the world’s most ambitious energy transition programmes, requiring investment of more than $100 billion up to 2030.
• The programme’s main pillars are solar PV, solar CSP and nuclear power, which currently rank comparatively low for investors due to uncertainty around existing frameworks.
• The programme requires substantial investments in the generation and transmission infrastructure over the coming years, with the first tendering round taking place in the second quarter of 2013.
• On the basis of the current outlook for the investment framework, the scores for renewable and nuclear power in the Kingdom are expected to increase significantly.
• CCGT is still the most attractive generation technology for investments.
Renewable index 84
Conventional index 119
Solar PV 52
Solar CSP n.a.
Wind onshore 56
Wind offshore n.a.
Hydro 94
Geothermal 110
Biomass n.a.
GT Gas 112
CCGT Gas 139
Coal 84
Nuclear 90
Renewable index 103
Conventional index 120
Solar PV 106
Solar CSP 100
Wind onshore 101
Wind offshore n.a.
Hydro n.a.
Geothermal n.a.
Biomass n.a.
GT Gas 120
CCGT Gas 120
Coal 13
Nuclear 95
“The Kingdom has started to roll-out its energy transition programme, one of the most ambitious renewable and nuclear programmes in the world. The coming months will show whether there is enough interest from global investors to achieve these ambitious targets.” Olaf Remmler PA energy expert
<90 90–120 120–150 >150Score on PA’s Energy Investment Map
23PACONSULTING.COM
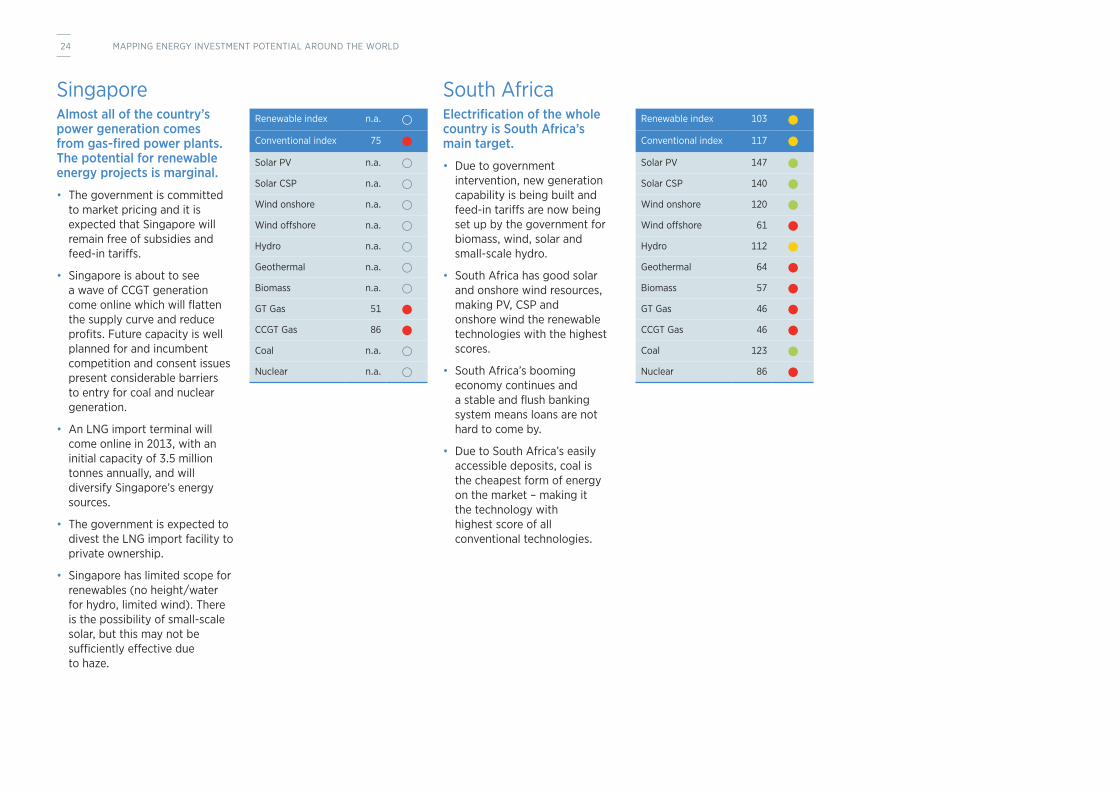
SingaporeAlmost all of the country’s power generation comes from gas-fired power plants. The potential for renewable energy projects is marginal.
• The government is committed to market pricing and it is expected that Singapore will remain free of subsidies and feed-in tariffs.
• Singapore is about to see a wave of CCGT generation come online which will flatten the supply curve and reduce profits. Future capacity is well planned for and incumbent competition and consent issues present considerable barriers to entry for coal and nuclear generation.
• An LNG import terminal will come online in 2013, with an initial capacity of 3.5 million tonnes annually, and will diversify Singapore’s energy sources.
• The government is expected to divest the LNG import facility to private ownership.
• Singapore has limited scope for renewables (no height/water for hydro, limited wind). There is the possibility of small-scale solar, but this may not be sufficiently effective due to haze.
South AfricaElectrification of the whole country is South Africa’s main target.
• Due to government intervention, new generation capability is being built and feed-in tariffs are now being set up by the government for biomass, wind, solar and small-scale hydro.
• South Africa has good solar and onshore wind resources, making PV, CSP and onshore wind the renewable technologies with the highest scores.
• South Africa’s booming economy continues and a stable and flush banking system means loans are not hard to come by.
• Due to South Africa’s easily accessible deposits, coal is the cheapest form of energy on the market – making it the technology with highest score of all conventional technologies.
Renewable index n.a.
Conventional index 75
Solar PV n.a.
Solar CSP n.a.
Wind onshore n.a.
Wind offshore n.a.
Hydro n.a.
Geothermal n.a.
Biomass n.a.
GT Gas 51
CCGT Gas 86
Coal n.a.
Nuclear n.a.
Renewable index 103
Conventional index 117
Solar PV 147
Solar CSP 140
Wind onshore 120
Wind offshore 61
Hydro 112
Geothermal 64
Biomass 57
GT Gas 46
CCGT Gas 46
Coal 123
Nuclear 86
24 MAPPING ENERGY INVESTMENT POTENTIAL AROUND THE WORLD
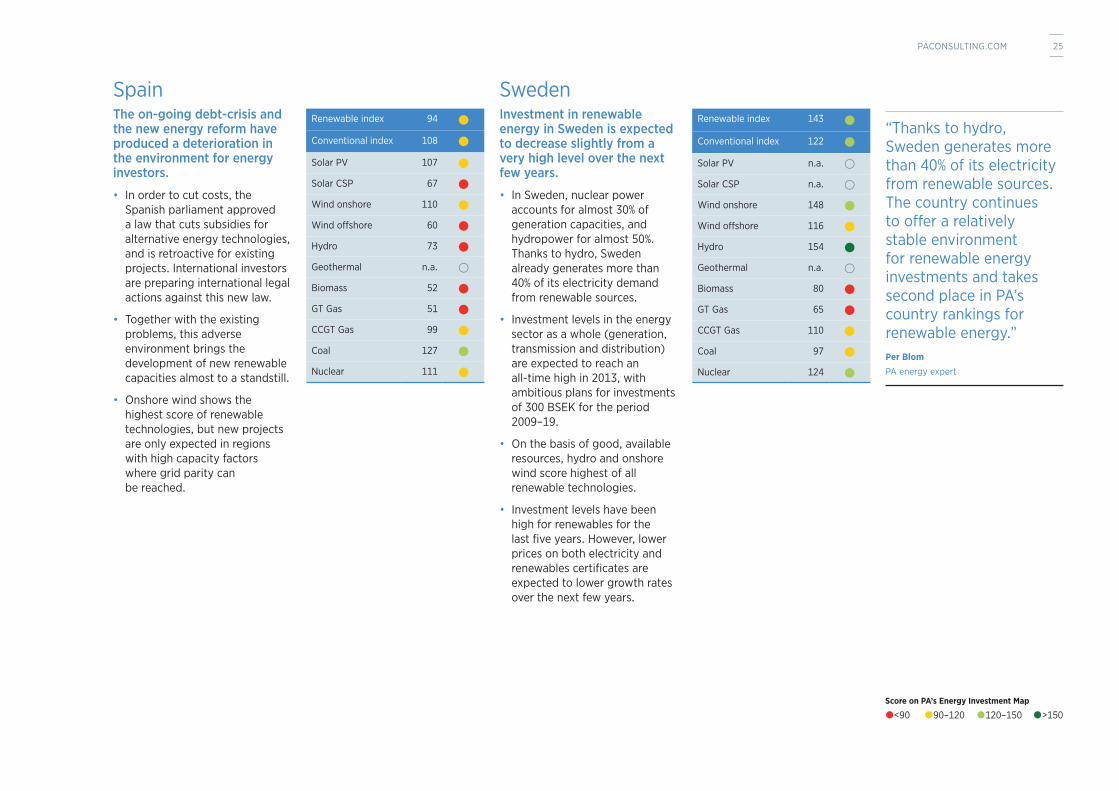
SpainThe on-going debt-crisis and the new energy reform have produced a deterioration in the environment for energy investors.
• In order to cut costs, the Spanish parliament approved a law that cuts subsidies for alternative energy technologies, and is retroactive for existing projects. International investors are preparing international legal actions against this new law.
• Together with the existing problems, this adverse environment brings the development of new renewable capacities almost to a standstill.
• Onshore wind shows the highest score of renewable technologies, but new projects are only expected in regions with high capacity factors where grid parity can be reached.
SwedenInvestment in renewable energy in Sweden is expected to decrease slightly from a very high level over the next few years.
• In Sweden, nuclear power accounts for almost 30% of generation capacities, and hydropower for almost 50%. Thanks to hydro, Sweden already generates more than 40% of its electricity demand from renewable sources.
• Investment levels in the energy sector as a whole (generation, transmission and distribution) are expected to reach an all-time high in 2013, with ambitious plans for investments of 300 BSEK for the period 2009–19.
• On the basis of good, available resources, hydro and onshore wind score highest of all renewable technologies.
• Investment levels have been high for renewables for the last five years. However, lower prices on both electricity and renewables certificates are expected to lower growth rates over the next few years.
Renewable index 94
Conventional index 108
Solar PV 107
Solar CSP 67
Wind onshore 110
Wind offshore 60
Hydro 73
Geothermal n.a.
Biomass 52
GT Gas 51
CCGT Gas 99
Coal 127
Nuclear 111
Renewable index 143
Conventional index 122
Solar PV n.a.
Solar CSP n.a.
Wind onshore 148
Wind offshore 116
Hydro 154
Geothermal n.a.
Biomass 80
GT Gas 65
CCGT Gas 110
Coal 97
Nuclear 124
“Thanks to hydro, Sweden generates more than 40% of its electricity from renewable sources. The country continues to offer a relatively stable environment for renewable energy investments and takes second place in PA’s country rankings for renewable energy.” Per Blom PA energy expert
<90 90–120 120–150 >150Score on PA’s Energy Investment Map
25PACONSULTING.COM
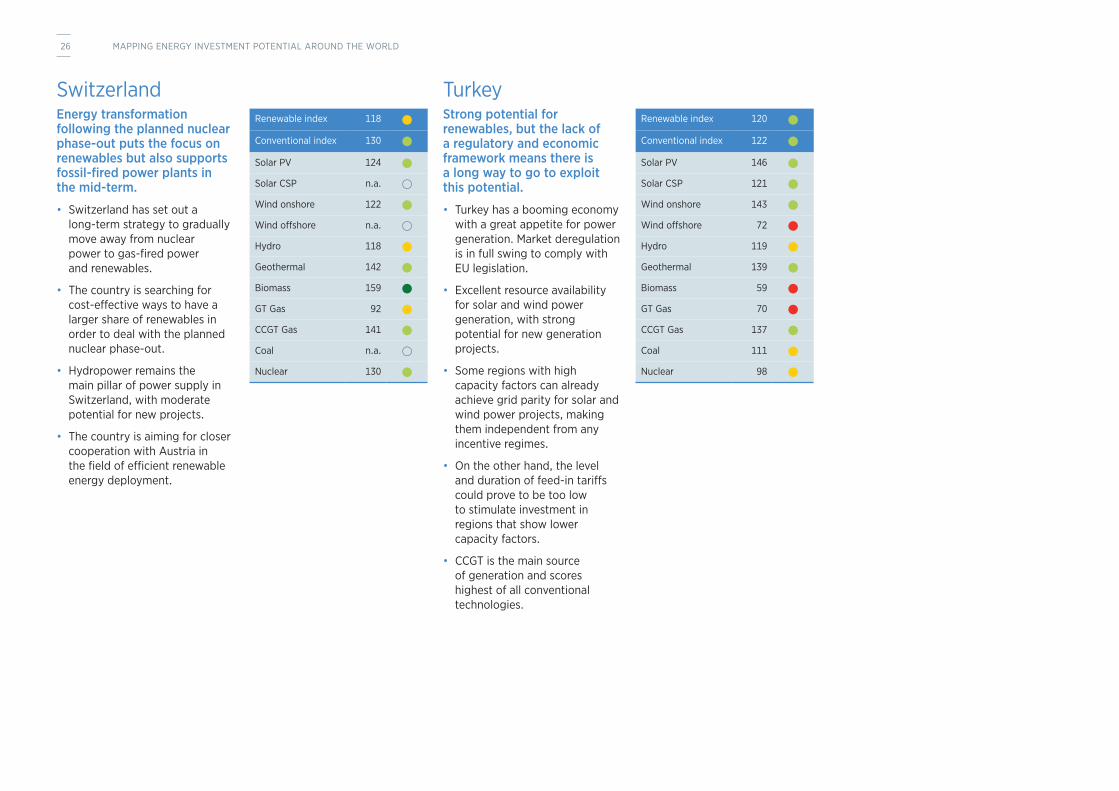
SwitzerlandEnergy transformation following the planned nuclear phase-out puts the focus on renewables but also supports fossil-fired power plants in the mid-term.
• Switzerland has set out a long-term strategy to gradually move away from nuclear power to gas-fired power and renewables.
• The country is searching for cost-effective ways to have a larger share of renewables in order to deal with the planned nuclear phase-out.
• Hydropower remains the main pillar of power supply in Switzerland, with moderate potential for new projects.
• The country is aiming for closer cooperation with Austria in the field of efficient renewable energy deployment.
Turkey Strong potential for renewables, but the lack of a regulatory and economic framework means there is a long way to go to exploit this potential.
• Turkey has a booming economy with a great appetite for power generation. Market deregulation is in full swing to comply with EU legislation.
• Excellent resource availability for solar and wind power generation, with strong potential for new generation projects.
• Some regions with high capacity factors can already achieve grid parity for solar and wind power projects, making them independent from any incentive regimes.
• On the other hand, the level and duration of feed-in tariffs could prove to be too low to stimulate investment in regions that show lower capacity factors.
• CCGT is the main source of generation and scores highest of all conventional technologies.
Renewable index 118
Conventional index 130
Solar PV 124
Solar CSP n.a.
Wind onshore 122
Wind offshore n.a.
Hydro 118
Geothermal 142
Biomass 159
GT Gas 92
CCGT Gas 141
Coal n.a.
Nuclear 130
Renewable index 120
Conventional index 122
Solar PV 146
Solar CSP 121
Wind onshore 143
Wind offshore 72
Hydro 119
Geothermal 139
Biomass 59
GT Gas 70
CCGT Gas 137
Coal 111
Nuclear 98
26 MAPPING ENERGY INVESTMENT POTENTIAL AROUND THE WORLD
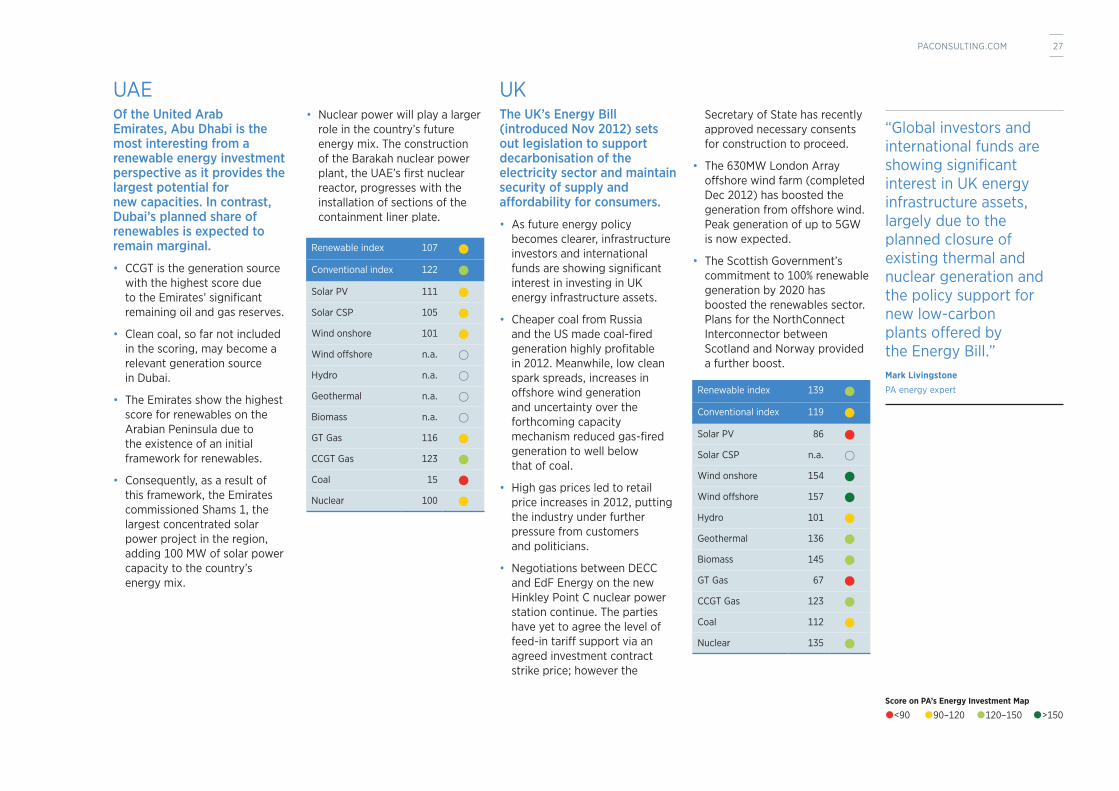
UAEOf the United Arab Emirates, Abu Dhabi is the most interesting from a renewable energy investment perspective as it provides the largest potential for new capacities. In contrast, Dubai’s planned share of renewables is expected to remain marginal.
• CCGT is the generation source with the highest score due to the Emirates’ significant remaining oil and gas reserves.
• Clean coal, so far not included in the scoring, may become a relevant generation source in Dubai.
• The Emirates show the highest score for renewables on the Arabian Peninsula due to the existence of an initial framework for renewables.
• Consequently, as a result of this framework, the Emirates commissioned Shams 1, the largest concentrated solar power project in the region, adding 100 MW of solar power capacity to the country’s energy mix.
• Nuclear power will play a larger role in the country’s future energy mix. The construction of the Barakah nuclear power plant, the UAE’s first nuclear reactor, progresses with the installation of sections of the containment liner plate.
UKThe UK’s Energy Bill (introduced Nov 2012) sets out legislation to support decarbonisation of the electricity sector and maintain security of supply and affordability for consumers.
• As future energy policy becomes clearer, infrastructure investors and international funds are showing significant interest in investing in UK energy infrastructure assets.
• Cheaper coal from Russia and the US made coal-fired generation highly profitable in 2012. Meanwhile, low clean spark spreads, increases in offshore wind generation and uncertainty over the forthcoming capacity mechanism reduced gas-fired generation to well below that of coal.
• High gas prices led to retail price increases in 2012, putting the industry under further pressure from customers and politicians.
• Negotiations between DECC and EdF Energy on the new Hinkley Point C nuclear power station continue. The parties have yet to agree the level of feed-in tariff support via an agreed investment contract strike price; however the
Secretary of State has recently approved necessary consents for construction to proceed.
• The 630MW London Array offshore wind farm (completed Dec 2012) has boosted the generation from offshore wind. Peak generation of up to 5GW is now expected.
• The Scottish Government’s commitment to 100% renewable generation by 2020 has boosted the renewables sector. Plans for the NorthConnect Interconnector between Scotland and Norway provided a further boost.
Renewable index 107
Conventional index 122
Solar PV 111
Solar CSP 105
Wind onshore 101
Wind offshore n.a.
Hydro n.a.
Geothermal n.a.
Biomass n.a.
GT Gas 116
CCGT Gas 123
Coal 15
Nuclear 100
Renewable index 139
Conventional index 119
Solar PV 86
Solar CSP n.a.
Wind onshore 154
Wind offshore 157
Hydro 101
Geothermal 136
Biomass 145
GT Gas 67
CCGT Gas 123
Coal 112
Nuclear 135
“Global investors and international funds are showing significant interest in UK energy infrastructure assets, largely due to the planned closure of existing thermal and nuclear generation and the policy support for new low-carbon plants offered by the Energy Bill.”Mark Livingstone PA energy expert
<90 90–120 120–150 >150Score on PA’s Energy Investment Map
27PACONSULTING.COM
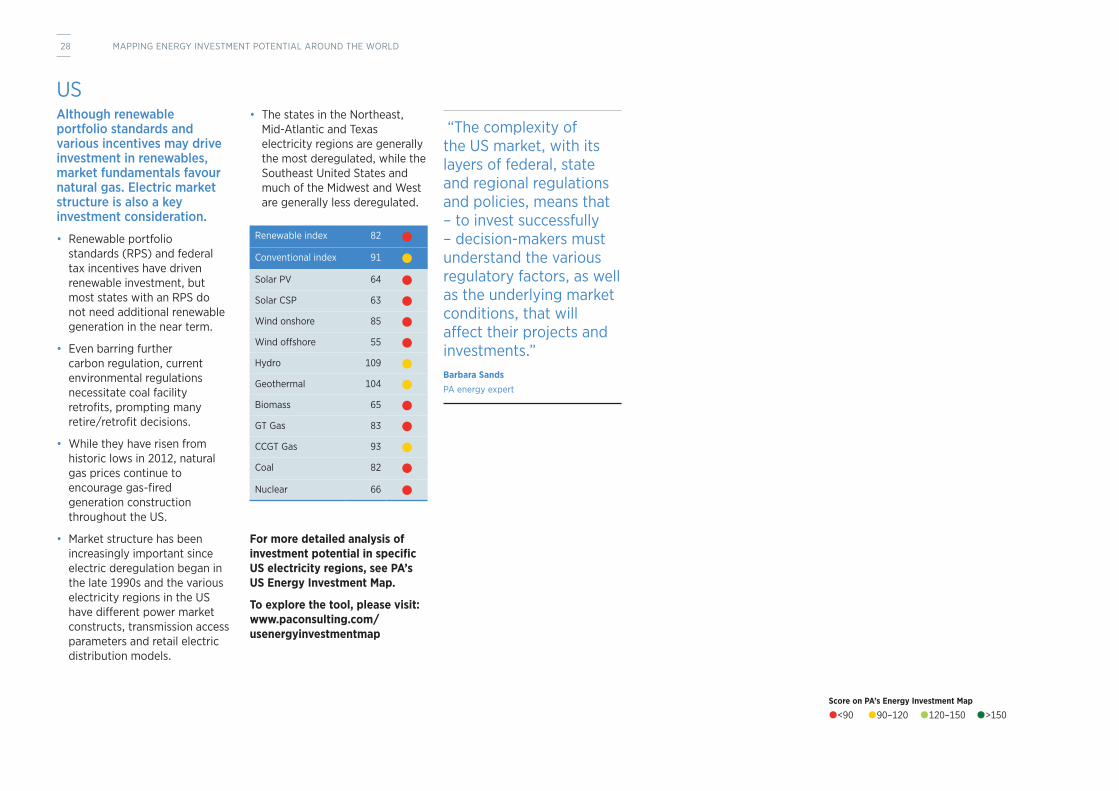
USAlthough renewable portfolio standards and various incentives may drive investment in renewables, market fundamentals favour natural gas. Electric market structure is also a key investment consideration.
• Renewable portfolio standards (RPS) and federal tax incentives have driven renewable investment, but most states with an RPS do not need additional renewable generation in the near term.
• Even barring further carbon regulation, current environmental regulations necessitate coal facility retrofits, prompting many retire/retrofit decisions.
• While they have risen from historic lows in 2012, natural gas prices continue to encourage gas-fired generation construction throughout the US.
• Market structure has been increasingly important since electric deregulation began in the late 1990s and the various electricity regions in the US have different power market constructs, transmission access parameters and retail electric distribution models.
• The states in the Northeast, Mid-Atlantic and Texas electricity regions are generally the most deregulated, while the Southeast United States and much of the Midwest and West are generally less deregulated.
For more detailed analysis of investment potential in specific US electricity regions, see PA’s US Energy Investment Map.
To explore the tool, please visit: www.paconsulting.com/usenergyinvestmentmap
Renewable index 82
Conventional index 91
Solar PV 64
Solar CSP 63
Wind onshore 85
Wind offshore 55
Hydro 109
Geothermal 104
Biomass 65
GT Gas 83
CCGT Gas 93
Coal 82
Nuclear 66
“The complexity of the US market, with its layers of federal, state and regional regulations and policies, means that – to invest successfully – decision-makers must understand the various regulatory factors, as well as the underlying market conditions, that will affect their projects and investments.”Barbara Sands PA energy expert
<90 90–120 120–150 >150Score on PA’s Energy Investment Map
28 MAPPING ENERGY INVESTMENT POTENTIAL AROUND THE WORLD
ABOUT PA’S GLOBAL ENERGY TEAM
PA Consulting Group’s industry knowledge and practical experience enable us to challenge conventional thinking. We find bold, new ways for our clients to meet their customers’ changing expectations, seize the opportunities created by digital channels, capitalise on technology and innovation, make the right investment decisions and retain and develop talent.
For over 30 years, PA has provided economic advisory and business strategy services to the energy sector. Drawing on our deep expertise, we deliver exceptional results for our clients: utilities, policymakers, regulators, oil and gas companies, power producers, investors, banks and law firms across North America, Europe, Asia-Pacific and the Gulf.
Our economic advisory and
business strategy work spans regulatory planning and optimisation, M&A advisory, asset valuation and appraisal, market design and audit, and expert testimony.
In the last two years, our energy economic experts have:
• advised on and supported the purchase and sale of power assets worth over $10 billion
• evaluated more than 75GW of power assets
• audited the operation of electricity markets that annually settle in excess of AUS $4 billion
• advised the UK Government and energy investors on policies to encourage £110 billion of new low-carbon energy and transmission investment
• supported the acquisition and divestiture of natural gas, crude
oil and NGL assets and E&P companies worth over $7 billion.
Key projectsThese short examples show how our work has created a lasting impact in the energy sector.
We developed Onzo’s ‘revolutionary’ Smart Energy Kit, helping millions reduce the energy they use at home.
PA brought together a team with expertise in the development of handheld consumer electronics, experience in low-power electronics and deep understanding of the manufacturing supply chain. We developed the innovative features needed to differentiate the Smart Energy Kit from its competitors and planned the supply chain capable of meeting customer
demand. Onzo is now working with a major energy retailer to roll out the Smart Energy Kit to consumers throughout the UK. The processes we put in place allow it to produce over one million devices every year.
Our strategy for Hawaiian Electric could reduce carbon emissions from the generation arm of its business.
US utility Hawaiian Electric is required to generate 25% of its electricity from renewable sources by 2020 and 40% by 2030. However, its existing generating fleet is predominantly petroleum-fired, operationally inflexible, and heavily depreciated. The company asked PA to develop a comprehensive strategy that would allow it to meet renewable energy targets, reduce carbon emissions and increase shareholder value.
Together with Hawaiian Electric, we developed a range of plausible scenarios and assessed the impact of each on elements such as cost to utility customers, the company’s generation rate base, emissions and compliance with environmental regulations.
PA’s final report laid out three scenarios that met renewable energy targets while retaining flexibility for Hawaiian Electric. Each provided excellent opportunities for investment in the company, increased the rate base for the generation arm of the business and fostered significant levels of renewable energy from independent power producers. All three scenarios could significantly reduce carbon emissions. The results of the joint project indicated that all of this could be achieved at a nominal increase in cost to utility customers.
29PACONSULTING.COM
We positioned UK Power Networks to become a leading distributor in the UK’s transition to a low-carbon economy.
UK Power Networks (UKPN), the UK’s largest electricity distributor, wanted to demonstrate how the company plans to develop its network to support the UK’s transition to a low-carbon economy. As a regulated monopoly, it needs to show that any investment delivers value for money for consumers and supports developments in technologies such as smart metering, electric vehicles and renewable energy.
UKPN asked PA to help them develop a strategy that would not only address these challenges, but would position UKPN to become a leading distributor in the UK’s low-carbon transition.
We worked closely with the company’s CEO and his senior team and sought input from key stakeholders to develop a clear roadmap for UKPN’s future. To understand what will be required of the distribution infrastructure over the next ten years, we deployed enhanced forecasting approaches and drew on our expertise in marketing, regulatory analysis, technology and innovation.
PA continues to work with UKPN, including providing technical advice on how energy from renewable sources can be connected to the distribution network.
Early indications are that the company has positioned itself at the forefront of developing low-carbon strategies in the UK.
We gave Pepco greater confidence in a one-billion-dollar investment in reliable infrastructure.
Pepco supplies power to over 788,000 customers in and around Washington, DC. Following several devastating storms, the company committed one billion dollars to ensure their customers continue to receive power during major weather events. With an investment on this scale, Pepco needed to be sure that its investment would result in the desired outage reduction targets. They also needed to understand the extent to which moving thousands of overhead electricity lines underground would reduce power outages during hurricanes and ice and snow storms.
To give Pepco this greater confidence, we developed a process to collect data from multiple data systems, helping
measure outage improvement before and after system upgrading initiatives were put in place. This allowed Pepco to confidently predict the success of multiple reliability improvement programmes, including undergrounding. To further explore the benefits of moving power lines underground, we compared data from these different systems to understand how benefits varied under a range of construction scenarios.
Pepco is using our approach to guarantee the success of its investment. This is proving essential as the company complies with regulation and makes the case for rate increases.
30 MAPPING ENERGY INVESTMENT POTENTIAL AROUND THE WORLD
We guaranteed competition and reliability of supply within Western Australia’s billion-dollar electricity market.
The electricity market in Western Australia generates average daily volumes of 12GWh, with total annual trades of AUS $177 million and over a billion dollars in associated capacity payments. The Independent Market Operator (IMO), in cooperation with system operator System Management (SM), exists to ensure reliability of supply, put downward pressure on prices and maintain genuine competition within the wholesale market. To achieve this, IMO is bound by market rules which require it to complete an annual regulatory audit demonstrating compliance.
Drawing on our specialist knowledge of energy markets, PA has provided this audit every year since 2006. Each year we review
the obligations placed on IMO and SM and audit their internal operations and software systems for compliance. We investigate incidents that have occurred since the last audit, and highlight any which have had material impact. Our work allows IMO and SM to address any potential issues and gives IMO and its stakeholders confidence that the market is operating efficiently.
31PACONSULTING.COM

Corporate headquarters 123 Buckingham Palace Road London SW1W 9SR United Kingdom Tel: +44 20 7730 9000
US headquarters The Chrysler Building 45th Floor 405 Lexington Avenue New York, 10174 USA Tel: +1 212 973 5900
paconsulting.com
This document has been prepared by PA. The contents of this document do not constitute any form of commitment or recommendation on the part of PA and speak as at the date of their preparation.
© PA Knowledge Limited 2013. All rights reserved.
No part of this documentation may be reproduced, stored in a retrieval system, or transmitted in any form or by any means, electronic, mechanical, photocopying or otherwise without the written permission of PA Consulting Group.
We are an employee-owned firm of over 2,500 people, operating globally from offices across North America, Europe, the Nordics, the Gulf and Asia Pacific.
We are experts in energy, financial services, life sciences and healthcare, manufacturing, government and public services, defence and security, telecommunications, transport and logistics.
Our deep industry knowledge together with skills in management consulting, technology and innovation allows us to challenge conventional thinking and deliver exceptional results with lasting impact. DSP1922-4