Embed Size (px)
Citation preview

Mapping Diversity and Diverse
Economies: A GIS case
Craig Borowiak
Associate Professor of Political Science
Haverford College
Philadelphia, PA
ABSTRACT
This paper is a study of the racial, ethnic and class geographies that underlie solidarity-based economic
initiatives such as cooperatives and community gardens. These initiatives offer new options for social-
economic integration of disadvantaged communities and new avenues for wealth creation under adverse
economic conditions. Critics, however, see solidarity economy practices as occupying only small niches
within the economy and as reinforcing racial and class divides—as a project for affluent white
progressives. In this paper I use Geographic Information Systems (GIS) modeling techniques to analyze
the spatial distribution of solidarity economy organizations in one particularly divided city: Philadelphia.
Using census data and a spatial database of over 500 solidarity economy entities, I map the range and
demographics of the solidarity economy’s geography. The study reveals that whereas many types of
solidarity economy organization tend to cluster along major demographic divides, far fewer reach into the
heart of demographically concentrated communities. Furthermore, very few solidarity economy
enterprises reach into the neediest neighborhoods. This type of research is useful for assessing claims that
the solidarity economy practices can counteract economic hardship and build bridges of solidarity across
socio-economic divides. This, in turn, has implications for how we might theorize the solidarity
economy’s transformative and counterhegemonic potential.
Please do not cite without permission.

1
Introduction1
Today, six years since the 2008 world financial crisis began, economies around the world
are still reeling from its effects. The cascading effects of foreclosures, forestalled retirements,
shattered savings, high unemployment, ballooning fiscal deficits, sovereign debt debacles,
dwindling export revenue, and currency instability, among other woes, have drastically reshaped
economic geographies. Nonetheless, despite all of the damage it is has wrought, the 2008
financial crisis may have also opened new vistas of economic possibility as communities have
been forced to find new ways to meet their needs. In tough times—today, as always—reciprocity
and social solidarity often get people by. In recent years, experiments with alternative, solidarity-
based economic practices have proliferated worldwide as populations grapple with hardship and
attempt to re-vision economic futures that are healthier for communities and the environment.
Cooperatives, community supported agriculture (CSAs), community currencies, community land
trusts, and social enterprises are just a few examples of initiatives that prioritize social norms
such as equity, social and ecological sustainability, cooperation, workplace democracy, and
community-based development above profit maximization, private ownership, and competition.
Initiatives such as these are altering local economic landscapes, yet they typically fall out
of mainstream studies of the economy, which focus instead on state budgets, for-profit capitalist
enterprises, and the market economy. Furthermore, to the extent that these entities are studied,
they tend to be treated in isolation from one another. Thus worker cooperatives are studied
independently from consumer cooperatives, which are studied independently from social
enterprises, community gardens, CSAs, credit unions and so forth. This piecemeal approach
contributes to the further underrepresentation of such economic practices in empirical and
theoretical research. For many practitioners and activists, however, the value of these diverse
practices and their interconnections are far more apparent. In many countries, these
organizational forms and practices have begun to coalesce into a self-identified movement
promoting the social and solidarity economy (SSE).
This paper draws from these movements and approaches the SSE as a new object of
research. Specifically, this paper is a study of the racial, ethnic and class geographies that
underlie solidarity-based economic initiatives such as cooperatives and community gardens. For
proponents, SSE initiatives offer new options for social-economic integration of disadvantaged
communities and new avenues for wealth creation under adverse economic conditions. Critics,
by contrast, see SSE practices as occupying only small niches within the economy and as
reinforcing racial and class divides—as a project for affluent white progressives. As of yet,
however, little empirical work at the aggregate level has been done to evaluate such claims. I am
currently involved in a collaborative research project that aims to rectify this. This paper presents
some of my preliminary findings. Using census data and a spatial database of over 500 solidarity
economy entities, I deploy Geographic Information Systems (GIS) modeling techniques to
analyze the spatial and demographic distribution of SSE organizations in one especially divided
city: Philadelphia. The study reveals that whereas many types of solidarity economy organization
tend to cluster along major demographic divides, far fewer reach into the heart of
demographically concentrated communities. Furthermore, very few solidarity economy
1 This essay has benefited tremendously from the hard work of several very talented student research assistants.
Samantha Shain helped design most of the core maps while providing crucial database support. Madeline Smith-
Gibbs has generated and maintained much of the database, which has been based upon the original work of Cameron
Scherer, who initiated the first inventory of SE in Philadelphia in 2010.

2
enterprises reach into the neediest neighborhoods. This type of research is useful for assessing
claims that the solidarity economy practices can counteract economic hardship and build bridges
of solidarity across socio-economic divides. This, in turn, has implications for how we might
theorize the social and solidarity economy’s transformative and counterhegemonic potential.
I have organized this essay in the following way. I begin by reviewing the history and
meaning of the solidarity economy and its relation to the social economy. I then introduce the
Philadelphia research project along with the larger NSF-sponsored research project of which it is
a part. I follow this with a more detailed discussion of our preliminary findings in Philadelphia,
including a presentation of several demographic maps of Philadelphia. Finally, I draw some brief
conclusions about the potentials and limits of this sort of research.
PART ONE: Histories of the Social and Solidarity Economy
What is the social and solidarity economy? The composite expression “social and
solidarity economy” itself reflects a convergence of two related concepts—the “social economy”
and the “solidarity economy”—with distinct, albeit overlapping histories. I describe these below.
Social Economy
The concept social economy ( in French) has the longer pedigree, dating
at least as far back as the early 19th
century. In the 1830s, liberal French economist Charles
Dunoyer described the social economy as a way to augment political economy (by which he
meant the new economic paradigms inspired by Adam Smith and David Ricardo among others).
In the 1850s, at a time of greater worker mobilization and cooperative development, socialist
Auguste Otte conceived of the social economy not as an augmentation but rather as a substitute
for political economy. Around the same time, French sociologist Frédéric Le Play brought
greater attention to the concept with the founding of both the
P q ’ and the R v ’É . A bit later, around the turn of
the century, Charles Gide and Leon Walras gave the économie sociale an even higher academic
and public profile.2 Both defined the concept as the “science of social justice” in contrast to the
“science of utility” that characterized classical political economy. For them, the social economy
was a complement to the market economy in that it provided for social needs left unmet by the
market. Gide in particular highlighted the role of cooperative and solidarist economic relations
(Moulaert and Ailenei 2005; Demoustier 2004).
The concept seemed to fall from public attention in the mid-20th
century, arguably due to
the rise of the modern welfare state, only to reemerge again in the 1970s, this time under
conditions of economic hardship combined with skepticism about the capacity of either state
planning or capitalist markets to provide for social needs. The pioneering work of Henri
Desroche and Claude Vienney to analyze the common characteristics of cooperatives,
associations and mutual societies helped reignite interest in the social economy concept (Vienney
1995; Desroche 1983; Desroche 1991; Laville, Lévesque, Mendell 2007). The social economy
came to represent an alternative way to meet social needs that does not involve state
redistribution or competitive markets organized around profit maximization. That is, beyond
being simply economic activity with a social purpose, it came to be interpreted through the
2At the 1900 Paris World Fair the social economy had its own pavilion. Charles Gide described it as a
“cathedral.” (Defourny and Develtere 1999, 11n13.)

3
analytic division of the economy into three distinct sectors: The state sector characterized by
planning and public service; the market sector characterized by private action and profit
orientation; and “the third sector” characterized by self-help, mutualism and social purpose. The
social economy came to refer to voluntary and community-oriented economic activity falling in
the third sector outside of the for-profit market sector, on the one hand, and the state-based
public sector, on the other. Even more specifically, the social economy came to refer to the
specific organizational forms of mutuals, cooperatives and associations. As Defourny and
Develtere (1999) describe it, the social economy can be delimited in two ways. First, it can be
defined in terms of type of organizations that participate. The three primary organization types
are: co-operative organizations, mutual aid societies, and associations. An alternative way to
define the social economy is according to a set of key principles. It includes those co-ops, mutual
aid societies, and associations that: 1) place service to members or to the community above
profit; 2) have autonomous management; 3) have democratic decision making; 4) give primacy
of people and work over capital in distribution of revenues. Unlike the “non-profit sector”—a
term in wider use in the United States and other Anglophone contexts—the concept social
economy is not exclusive of for-profit enterprises so long as they follow cooperative principles.
Outside of Francophone Europe, the social economy concept has been developed to
include a broader set of practices. The British activist and theorist John Pearce (2003), for
example, has adapted the three sector model in ways that both extend the meaning of the third
sector (what he calls the third system) beyond just the social economy and extend the meaning of
the social economy to include a variety of entities in addition to mutual, coops and associations.
See Figure 1.
Figure 1: the Three Systems
For Pearce, what defines the third system is the principle of reciprocity, which he opposes to the
profit motive and planning that characterize the first and second system respectively. Defined in

4
terms of reciprocity, the third system includes family- or kinship- based economies as well as the
social economy. In the social economy, Pearce includes entities such as time banks, fair trade
companies, and social enterprises.
In Canada, too, the social economy has come to include hybrid economic forms that span
the state and market sector. Examples include social enterprises, community economic
development, public sector nonprofits, and state subsidized cooperative elder and child care
(Amin 2009; Quarter, Mook and Armstrong 2009; Mendell and Neamtan 2010). In this respect,
the social economy has come to resemble more directly what has elsewhere come to be called the
“solidarity economy,” a concept to which I now turn.
Solidarity Economy
Compared to the social economy, the concept “solidarity economy” has a considerably
shorter history. Although the concept of social solidarism had been developed in the early 20th
century by figures such as Charles Gide in France, the contemporary concept of solidarity
economy appears to have been first developed in the mid-1980s by sociologists Luis Razeto of
Chile and Jean-Louis Laville of France, who independently put forward the concept to visualize,
analyze, and propagate the transformative economic practices that were emerging worldwide
(Razeto 2010; Laville, 2007).
In Latin American in the 1980s, the combination of authoritarian rule, a regional debt
crisis, and neoliberal policies caused significant social and economic hardship and dislocation for
many communities. In Chile, as in many other countries in the region, unemployment was high
and the state offered little support. The legacy of civil war and authoritarian reprisal in the
region had led to disenchantment with revolutionary forms of resistance and the 1973 coup that
put Pinochet in power had foreclosed the possibility of achieving socialism through formal
democratic institutions. After spending the post-coup years in Italy, where he gained experience
with the cooperative movement there, Razeto returned to Chile to find many local communities
innovating with alternative economic practices in order to cope. Collective kitchens, community
service centers, labor workshops, labor exchanges, and cooperatives were just a few of the new
“popular economic” initiatives organized around collective strategies of survival and social
justice. In this context, Razeto began organizing meetings under the framework of the Program
for Labor Economics (PET). In such a meeting, a local community member coined the
expression “solidarity economy,” thus weaving together principles of solidarity (advocated by
the church) and principles of economic development (advocated by NGOs) (Razeto 2010).
Razeto then went on to theorize solidarity economy in opposition to development models
centered on either the state or the assumption of individualism and profit maximization. He
underlined the importance of reciprocal relations and the sense of belonging that is often found
in traditional societies. He called for an “economy of solidarity” organized around cooperative
endeavors to satisfy common needs and achieve the well-being of local communities. In such an
economy, economic enterprises would embody cooperation, co-responsibility, communication,
collaboration and community, all of which help constitute what Razeto calls “Factor C” (Razeto
1998; Razeto 2010). Importantly, his idea was not to do away with the state and market sectors
of the economy, but instead to find ways to spread cooperation into those sectors. His idea was
not to overthrow capitalism so much as to resist its monological imposition and to infiltrate its
operation with cooperative principles. This idea of economia solidaria was subsequently picked
up by other activists and academics in Columbia, Brazil, Argentina, and across Latin America,

5
where it has continued to flourish (Coraggio and Arroyo 2009; Mance 2002; Rodriguez-Garavito
2006).
Around the same time as economia solidaria was being introduced in Latin America,
French sociologist Jean-Louis Laville introduced économie solidaire in continental Europe.
Economic hardship was again a prime motivator. In Europe, however, the key reference points
were not traditional economies, authoritarian states and the dislocations induced by neoliberal
austerity measures. It was rather the crisis of the Keynesian welfare state that was bringing about
a reconfiguring of state-economy relations, as well as the growing influence of civil society in
the economy, not merely as an adjunct to state and market but as a complementary pole (Evers
and Laville, 2004; Laville, Lévesque, Mendell 2007). In the mid1980s, Laville used the
language of économie solidaire to intervene in ongoing research on the social economy in
Europe. As opposed to those who focus only on the organizational forms of cooperatives,
mutual, and associations, Laville used the concept économie solidaire to prioritize the normative
commitment to reciprocity and solidarity as a strategy for social integration. He also used it to
highlight the need to extend cooperative principles beyond the third sector to include also the
public and market sectors of the economy. What mattered most for Laville was not, for example,
whether an organization was organized as a cooperative or not, but rather whether or not it
organized its activities around social solidarity and reciprocity (Laville, Lévesque and Mendell).
Laville’s conceptualization of économie solidaire influenced social economy research across
much of Europe (and especially Francophone countries) such that solidarity economy and social
economy are frequently combined into one expression: l’ . This is
also how the concepts appear in the transcontinental networks promoting the movement.
The Spread of the Social and Solidarity Economy Movement
Taken together and to a certain extent along separate tracks, the Latin American and
Francophone European perspectives have built momentum around the idea of the social and
solidarity economy (hereafter, SSE). The framework has been taken up and theorized by
practitioners, activists and academics across the globe as a way to comprehend and foster values-
based, socially embedded economic practices and to build linkages across geographies and
economic sectors. With the spread of the SSE concept, new transnational networks have formed.
These have gradually become more institutionalized. Vibrant solidarity economy networks can
be found across Western Europe and Latin America. The Latin American Solidarity Economy
Network (Las Redes Latinoamericanas de Economía Solidaria y Políticas Públicas) has been
place since 1998. An Asian Social Solidarity Economy Forum was formed in 2007. New
networks are forming in Africa, with particularly vibrant ones Francophone West African
countries such as Senegal, Mali and Burkina Faso. In North America, Quebec has been a pioneer
with its social and solidarity economy campaigns and networking. In the United States, the U.S.
Solidarity Economy Network (USSEN) was founded in spring 2007. On the world level, the
first “International Meeting for the Globalization of Solidarity” was held in 1997 in Lima, Peru.
This first meeting allowed activists of the social solidarity economy from around the world to
meet and exchange their experiences and ideas on the matter. The meeting resulted in a
declaration opposing development models built around cutthroat competition and advocating the
creation of a solidarity economy that incorporates “cooperation, collective sharing and action”
while “putting the human being at the center of the economic and social development” (RIPESS
6
1997). The movement then received a big boost with the creation of the World Social Forum
(WSF) in 2001. The WSF meetings catalyzed discussions about alternatives to capitalist
globalization and greatly facilitated regional and global networking among civil society actors
involved in alternative economic organizing. In 2001, a second International Meeting for the
Globalization of Solidarity was held in Quebec. This resulted in the founding of The
Intercontinental Network for the Promotion of the Social and Solidarity Economy (RIPESS).
Subsequent RIPESS conferences were held in 2005 in Senegal and in 2009 in Luxembourg. The
next meeting will be held in Manila in October 2013. RIPESS provides institutional stability for
the movement worldwide and now includes over 60 different social and solidarity economy
networks and groups in its framework. Other major international conferences on the social and
solidarity economy have also been organized outside of the RIPESS structure. In 2011, for
example, an International Forum on the Social and Solidarity Economy (FIESS) was held in
Montreal. And in May 2013, the UN Research Institute for Social Development held conference
on “the Potential and Limits of Social and Solidarity Economy.” Clearly, there is momentum
behind the social and solidarity economy idea. It is a momentum sustained by a combination of a
backlash against the alienating and disruptive effects of neoliberalism, the rise of ethical
consumer consciousness among the middle class in rich countries, the new opportunities for
networking made available by globalization, the appeal of pragmatic alternatives that eschew
ideological battles between state and market, and the efforts of young people to adapt creatively
their lifestyles to the realities of ecological change and the limits of growth.
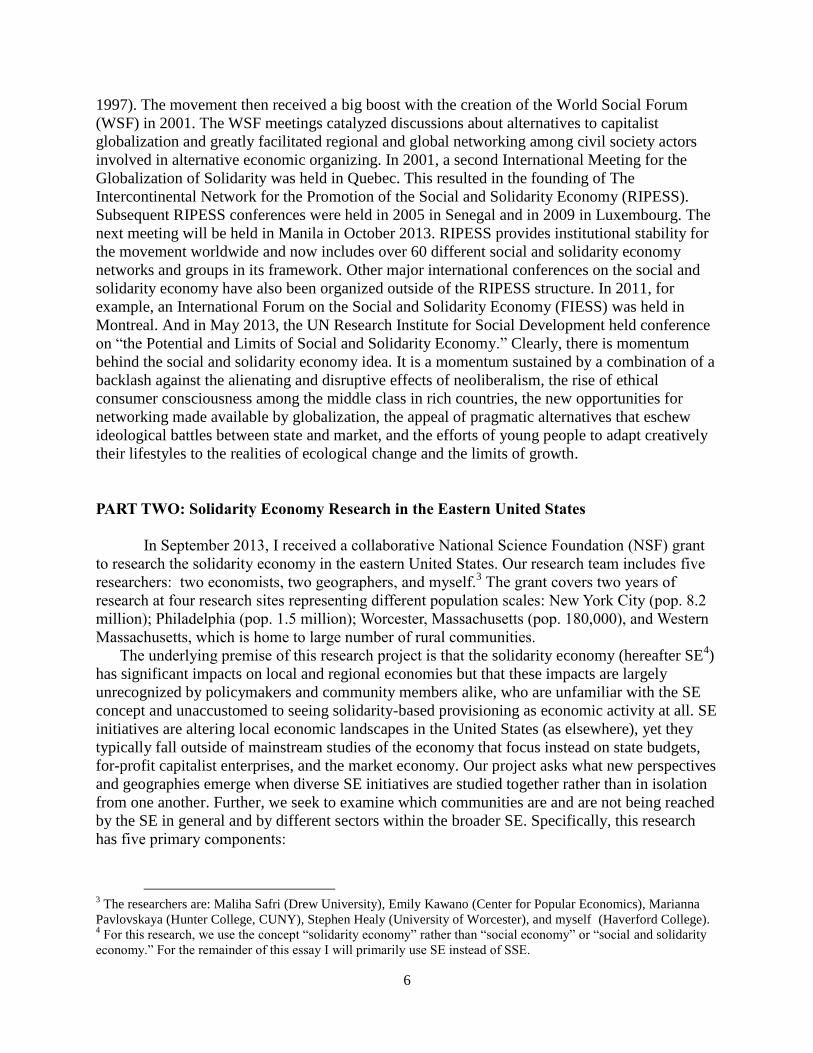
PART TWO: Solidarity Economy Research in the Eastern United States
In September 2013, I received a collaborative National Science Foundation (NSF) grant
to research the solidarity economy in the eastern United States. Our research team includes five
researchers: two economists, two geographers, and myself.3 The grant covers two years of
research at four research sites representing different population scales: New York City (pop. 8.2
million); Philadelphia (pop. 1.5 million); Worcester, Massachusetts (pop. 180,000), and Western
Massachusetts, which is home to large number of rural communities.
The underlying premise of this research project is that the solidarity economy (hereafter SE4)
has significant impacts on local and regional economies but that these impacts are largely
unrecognized by policymakers and community members alike, who are unfamiliar with the SE
concept and unaccustomed to seeing solidarity-based provisioning as economic activity at all. SE
initiatives are altering local economic landscapes in the United States (as elsewhere), yet they
typically fall outside of mainstream studies of the economy that focus instead on state budgets,
for-profit capitalist enterprises, and the market economy. Our project asks what new perspectives
and geographies emerge when diverse SE initiatives are studied together rather than in isolation
from one another. Further, we seek to examine which communities are and are not being reached
by the SE in general and by different sectors within the broader SE. Specifically, this research
has five primary components:
3 The researchers are: Maliha Safri (Drew University), Emily Kawano (Center for Popular Economics), Marianna
Pavlovskaya (Hunter College, CUNY), Stephen Healy (University of Worcester), and myself (Haverford College). 4 For this research, we use the concept “solidarity economy” rather than “social economy” or “social and solidarity
economy.” For the remainder of this essay I will primarily use SE instead of SSE.

7
1. First, we are creating a national-level spatial database of the SE that can be analyzed
quantitatively in terms of overall size, sectoral composition and geographic patterns.
2. Second, and most relevant for this essay, we are generating detailed inventories and
spatial databases of SE entities in our five research sites. We are using census data and
Geographic Information Systems (GIS) methods to map these data in ways that allow us
to identify regional and local SE clusters and to analyze the distribution of the SE with
respect to ethnic, racial and income patterns.
3. Third, we are conducting in-depth qualitative interviews with SE practitioners in different
SE sectors in our research sites
4. Fourth, we are administering economic impact surveys to SE enterprises. We will use the
resulting data and economic modeling tools to assess the overall economic impact of the
SE entities in these regions, taking into account both direct and indirect impacts, as well
as multiplier effects.
5. Finally, we are building an open and public, internet-based interactive mapping platform
of SE entities to build public awareness and encourage networking and linkages among
SE practitioners and sympathetic policy makers.
To guide us in our research, we have developed the following typology of SE organizations
(Figure 2).
Figure 2: Typology of Solidarity Economy Entities
Alternative Consumption
Alternative Production
Alternative Finance Alternative Exchange Governance
Consumer cooperatives
Buying Clubs
Co-housing
Intentional communities
Housing Cooperatives
Community land trusts
Worker cooperatives
Producer cooperatives
Volunteer collectives
Community gardens
Collectives of self-employed
Unpaid care work
Credit unions
Community development credit unions
Peer lending
Fair trade networks
Community supported agriculture and fisheries
Complementary currencies
Barter networks
Free-Cycle networks
Time banks
Participatory budgeting
Collective community management of resources
This typology was created in collaboration with the U.S. Solidarity Economy Network. It breaks
the SE down into different organizational types, some of which are more unique to the U.S. than
others. The underlying assumption is that organizational structure can be at least a proxy for SE

8
practice. The typology itself does not, for example, differentiate between cooperatives that
reflect SE principles and those that don’t. It leaves it to researchers to make those assessments on
their own. This research is currently ongoing. In the remainder of this essay, I will present
preliminary findings from the Philadelphia study, which I am directing.
The Philadelphia Case Study
It will be useful to first provide some background about Philadelphia. With a population
of 1.5 million, Philadelphia is the largest city in Pennsylvania, the second largest city (behind
New York) on the U.S. East Coast, and the fifth largest city in the United States. It is in some
respects a classic “Rustbelt” city. Its economic fortunes rose dramatically with industrialization
in the early 20th
century. This was followed by long periods of urban decline and
deindustrialization in the second half of that century. The city’s population peaked at around 2
million in 1950 and then declined until 2000, after which it has stabilized or grown slightly.
Philadelphia has a sizable poor population. Over 25 percent of the city’s population lives below
the national poverty line.5 This is almost double the national average of 14.3 percent. Roughly
200,000 of Philadelphia’s poor population live in “deep poverty,” defined as income less than
half the national poverty threshold. The median household income in Philadelphia is $36,957,
compared to $52,762 nationally. The city is, however, surrounded by relatively affluent suburbs,
to which many upwardly mobile families move, leaving behind urban blight and a shrinking
urban tax base.
The city also suffers from deep patterns of racial and ethnic division. The nonHispanic
white and black/African American populations each constitute approximately 45% of the
population, with the Asian population constituting around 7 percent. The Hispanic/Latino
population, which the census measures separately from racial variables, constitutes
approximately 13 percent of the city’s population. See Box 1.
Box 1: Philadelphia Demographic Statistics (2010)
Source: U.S. Census Bureau, http://quickfacts.census.gov/qfd/states/42/4260000.html
These aggregate statistics tell us useful things about the demographic composition of
Philadelphia’s population in general. They do not, however, tell us anything about how different
5 The 2013 Federal poverty line for a single person is $11,490. For a family of four it is $23,000.
Land area: 134 sq. miles
Population: 1,526,006
Population density: 11,380 persons/square mile
NonHispanic White: 41%
Black /African American: 43.4%
Asian: 6.3%
Hispanic/Latino*: 13%
Median Household Income: $36,957
Residents below poverty line: 25.6%
* In the census, the concept of race is separate from the concept of Hispanic origin.
9
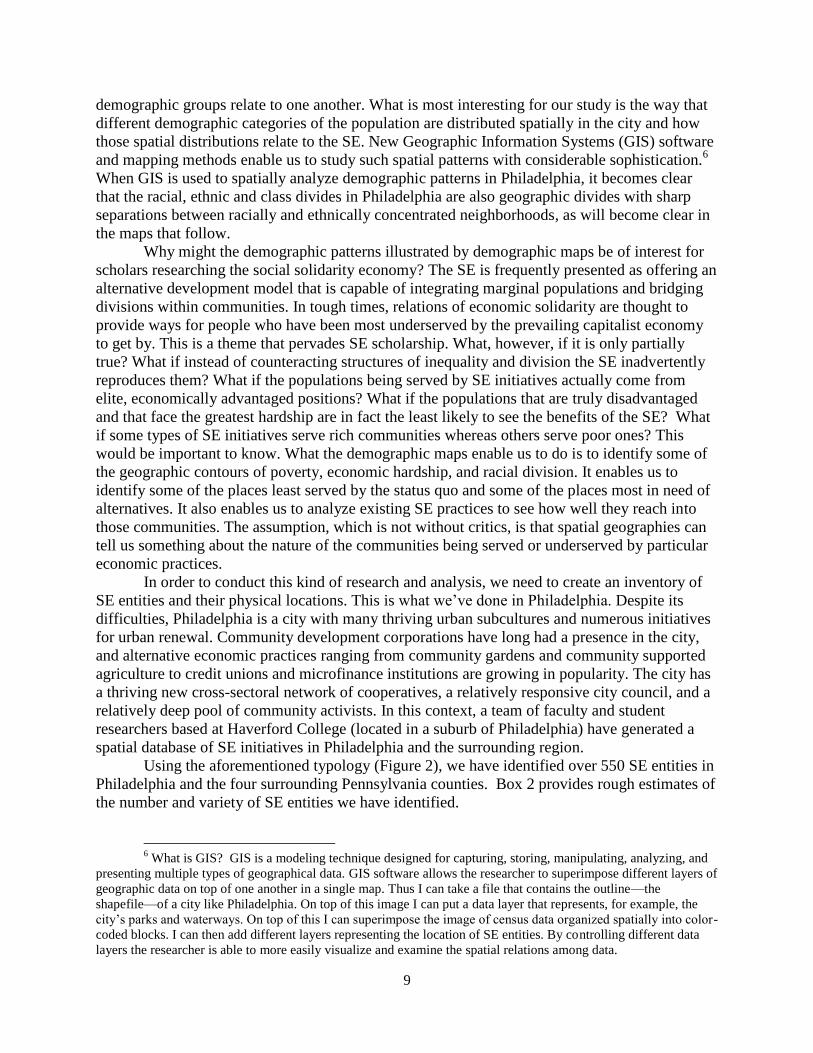
demographic groups relate to one another. What is most interesting for our study is the way that
different demographic categories of the population are distributed spatially in the city and how
those spatial distributions relate to the SE. New Geographic Information Systems (GIS) software
and mapping methods enable us to study such spatial patterns with considerable sophistication.6
When GIS is used to spatially analyze demographic patterns in Philadelphia, it becomes clear
that the racial, ethnic and class divides in Philadelphia are also geographic divides with sharp
separations between racially and ethnically concentrated neighborhoods, as will become clear in
the maps that follow.
Why might the demographic patterns illustrated by demographic maps be of interest for
scholars researching the social solidarity economy? The SE is frequently presented as offering an
alternative development model that is capable of integrating marginal populations and bridging
divisions within communities. In tough times, relations of economic solidarity are thought to
provide ways for people who have been most underserved by the prevailing capitalist economy
to get by. This is a theme that pervades SE scholarship. What, however, if it is only partially
true? What if instead of counteracting structures of inequality and division the SE inadvertently
reproduces them? What if the populations being served by SE initiatives actually come from
elite, economically advantaged positions? What if the populations that are truly disadvantaged
and that face the greatest hardship are in fact the least likely to see the benefits of the SE? What
if some types of SE initiatives serve rich communities whereas others serve poor ones? This
would be important to know. What the demographic maps enable us to do is to identify some of
the geographic contours of poverty, economic hardship, and racial division. It enables us to
identify some of the places least served by the status quo and some of the places most in need of
alternatives. It also enables us to analyze existing SE practices to see how well they reach into
those communities. The assumption, which is not without critics, is that spatial geographies can
tell us something about the nature of the communities being served or underserved by particular
economic practices.
In order to conduct this kind of research and analysis, we need to create an inventory of
SE entities and their physical locations. This is what we’ve done in Philadelphia. Despite its
difficulties, Philadelphia is a city with many thriving urban subcultures and numerous initiatives
for urban renewal. Community development corporations have long had a presence in the city,
and alternative economic practices ranging from community gardens and community supported
agriculture to credit unions and microfinance institutions are growing in popularity. The city has
a thriving new cross-sectoral network of cooperatives, a relatively responsive city council, and a
relatively deep pool of community activists. In this context, a team of faculty and student
researchers based at Haverford College (located in a suburb of Philadelphia) have generated a
spatial database of SE initiatives in Philadelphia and the surrounding region.
Using the aforementioned typology (Figure 2), we have identified over 550 SE entities in
Philadelphia and the four surrounding Pennsylvania counties. Box 2 provides rough estimates of
the number and variety of SE entities we have identified.
6 What is GIS? GIS is a modeling technique designed for capturing, storing, manipulating, analyzing, and
presenting multiple types of geographical data. GIS software allows the researcher to superimpose different layers of
geographic data on top of one another in a single map. Thus I can take a file that contains the outline—the
shapefile—of a city like Philadelphia. On top of this image I can put a data layer that represents, for example, the
city’s parks and waterways. On top of this I can superimpose the image of census data organized spatially into color-
coded blocks. I can then add different layers representing the location of SE entities. By controlling different data
layers the researcher is able to more easily visualize and examine the spatial relations among data.

10
Box 2: Solidarity Economy Entities in five-county Philadelphia Region (PA only)
We then separated out SE practices that have physical locations (e.g., a food coop store)
from those that don’t. 7
We isolated those that have physical addresses within the official city
limits. Finally, we used GIS software to plot their coordinates against demographic maps of the
city. Map 1, for example, plots most of this Philadelphia-based SE data on a map of per capita
income in the city.
Map 1: SE Organizations and Per Capita Income in Philadelphia
As can be seen, many, if not most, of the city’s neighborhoods have per capita income under
$20,000. Large swaths of the city have per capita income under $12,000, which is consistent
with census estimates that over 25% of the city is under the poverty line. Within this economy,
7 Many SE entities, such as buying clubs and time banks, don’t require a physical address in the same way that a
retail food cooperative or community garden does.
17 Alternative Currencies/time banks/barter networks/free cycle
24 B Corps
4 Buying Clubs (plus many branches)
95 CDCs
131 Community Gardens
7 Community Land Trusts
67 Co-ops
117 Credit Unions
46 CSAs (240 including drop-off points)
1 Fair Trade Organization (10,000 villages)
4 Other SE organizations
68 Related organizations
________
581 (Total)
11
The SE initiatives are surprisingly well-distributed, with their numbers thinning out as you move
away from the center of the city. The few areas on the map where SE entities cannot be found
tend also to be areas where the population density is very low due to the presence of parks (West
Philadelphia), cemeteries (North Philadelphia), or industrial waterfronts (East Philadelphia). The
demographic neutrality of the SE would thereby seem confirmed. The story, however, changes if
we disaggregate the data into different types of SE initiative.
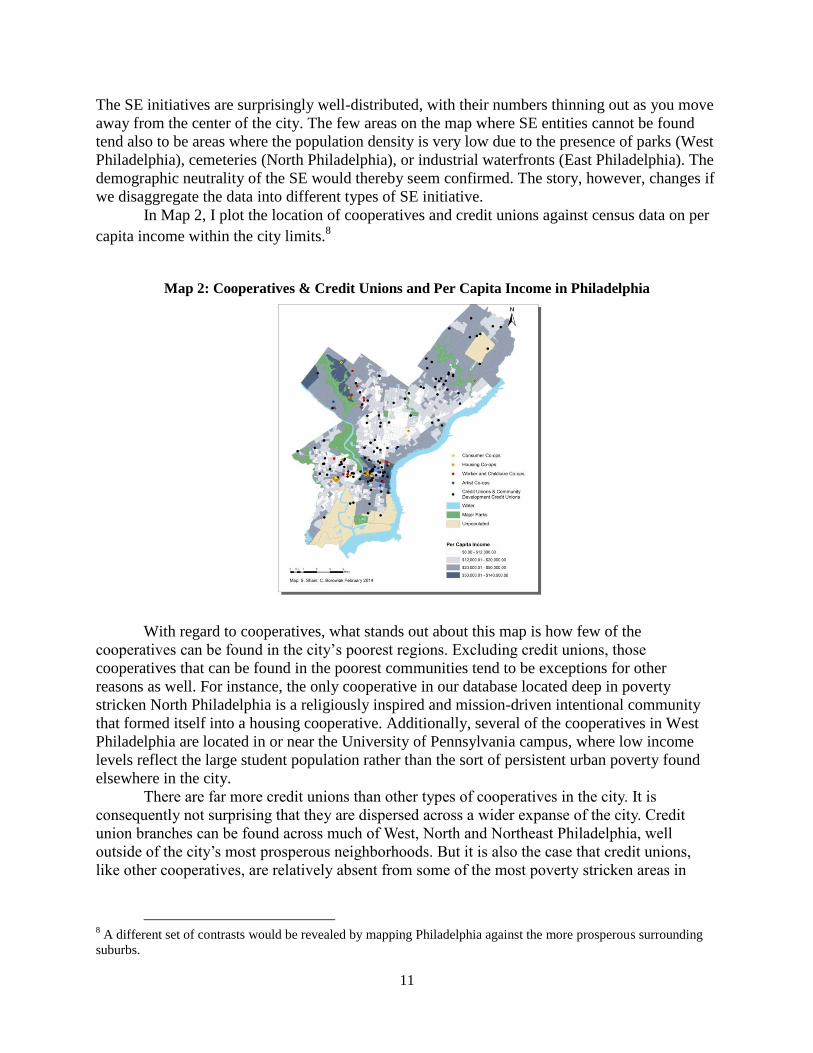
In Map 2, I plot the location of cooperatives and credit unions against census data on per
capita income within the city limits.8
Map 2: Cooperatives & Credit Unions and Per Capita Income in Philadelphia
With regard to cooperatives, what stands out about this map is how few of the
cooperatives can be found in the city’s poorest regions. Excluding credit unions, those
cooperatives that can be found in the poorest communities tend to be exceptions for other
reasons as well. For instance, the only cooperative in our database located deep in poverty
stricken North Philadelphia is a religiously inspired and mission-driven intentional community
that formed itself into a housing cooperative. Additionally, several of the cooperatives in West
Philadelphia are located in or near the University of Pennsylvania campus, where low income
levels reflect the large student population rather than the sort of persistent urban poverty found
elsewhere in the city.
There are far more credit unions than other types of cooperatives in the city. It is
consequently not surprising that they are dispersed across a wider expanse of the city. Credit
union branches can be found across much of West, North and Northeast Philadelphia, well
outside of the city’s most prosperous neighborhoods. But it is also the case that credit unions,
like other cooperatives, are relatively absent from some of the most poverty stricken areas in
8 A different set of contrasts would be revealed by mapping Philadelphia against the more prosperous surrounding
suburbs.

12
North Philadelphia. This is even true of community development credit unions (CDCUs), despite
their explicit mission to support disadvantaged communities.
Community gardens seem to perform better in this regard, as illustrated in Map 3.
Map 3: Community Gardens and Per Capita Income in Philadelphia
Although they don’t reach as far into the Northeast of the city, community gardents are quite
prevalent in impoverished areas north, west, and south of the city. This is perhaps to be expected
considering that the produce from such gardens is acquired through the work of one’s hands
rather than through income generated with a wage.
If we shift the focus from income to racial demographics, the findings become even
starker. Map 4 displays the location of cooperatives and the spatial distribution of Philadelphia’s
Black population. Philadelphia’s Black population is heavily concentrated in West Philadelphia
and in a thick vertical band of north Philadelphia extending from Germantown Avenue on the
west and Broad Street on the east. An additional concentration can be found in a small portion of
South Philadelphia. These concentrations are noticeably distanced from the concentrated wealth
found in center city and along the Delaware River waterfront (on the East side of the map). With
the exception of a daycare cooperative and a couple of housing cooperatives—all in West
Philadelphia—none of the cooperatives are found in the neighborhoods where the Black
population is most highly concentrated.

13
Map 4: Cooperatives Percent Black Population in Philadelphia
Cooperatives are often found along the edges of predominantly Black neighborhoods but rarely
in them. This is the case along Germantown Avenue in Northwest Philadelphia, in the areas west
of the University of Pennsylvania in West Philadelphia, and in the lower portion of North
Philadelphia. The patterns revealed in such maps do little to disabuse the common perception
that cooperatives are a “white” thing. A perception that persists in white and black communities
alike, despite the long history of African American cooperatives (Nembhard 2004) .
In Map 5, I plot credit unions (including branch offices) against the same racial data.
Here the picture is only slightly different.
Map 5: Credit Unions and Percent Black Population in Philadelphia

14
Credit unions do reach into predominantly Black neighborhoods in ways that other cooperatives
do not. But it’s also the case that over a third of the credit unions in the predominantly Black
neighborhoods of West and North Philadelphia are small, single-branch church-based credit
unions or community development credit unions with few assets. This contrasts with
concentrated White neighborhoods in the city, where larger, multi-branch credit unions
predominate.
Patterns of racial separation are further evidenced in the following map of cooperatives
and Philadelphia’s non-Hispanic White population.
Map 6: Cooperatives &Credit Unions and Percent White Population in Philadelphia
In this map, sharp divides separate neighborhoods that are over 75 percent White from
neighborhoods that are less than 25 percent White. In the western half of the city especially, the
racial patterns visible in Map 4 are practically mirror images of those found in Map 2; it is
almost literally black and white with few shades of gray. The city’s White population is most
heavily concentrated in the city center and in the northwest. This northwestern region spans
scenic Wissihickon Park on the western side of Germantown Avenue as well as portions of Mt.
Airy, a trendy neighborhood that also happens to be a hotspot for cooperatives. When the
previous maps are looked at together, it becomes apparent that economic divisions in the city
coincide extensively with racial divides. Not all census block groups with a majority White
population have high incomes, but scarcely any high-income block groups have a non-White
majority. Clusters of cooperatives are found in the heavily White downtown area. Interestingly it
is not the case that all, or even most, cooperatives are found in heavily concentrated White
neighborhoods. In fact, a significant number of cooperatives outside of the city center are located
within relatively thin border zones separating predominantly White and non-White
neighborhoods.

15
The racial demographics of Philadelphia are, of course, not only black and white. Maps 7
and 8 show the spatial patterns of cooperatives and credit unions vis-à-vis the Asian and Latino
populations, respectively.
Map 7: Cooperatives & Credit Unions and Percent Latino Population in Philadelphia
Map 8: Cooperatives and Credit Unions and Percent Asian Population in Philadelphia
16
The size of the Asian population is considerably smaller than the Black, White, and Latino
populations. This population is, however, highly concentrated in some regions in Chinatown
(represented by the darkest block at the center of the map) and, to a lesser extent, in several
blocks groups in the northeast and south of the city. A considerable cooperative presence cannot
be found in any of these regions. Patterns of segregation are even more pronounced with the
Latino population. Although the city’s Latino population is smaller than its non-Latino, White,
and Black populations, the dividing lines separating Latino neighborhoods from other
neighborhoods are as least as stark as those dividing White and Black ones. On the map, the
Latino population is quite visibly concentrated in an area of North Philadelphia shaped like an
inverted triangle. Strikingly, this relatively large area is also one of poorest areas in the city, as
revealed in Map 1. Virtually none of city’s cooperatives—including credit unions—extend into
these neighborhoods.
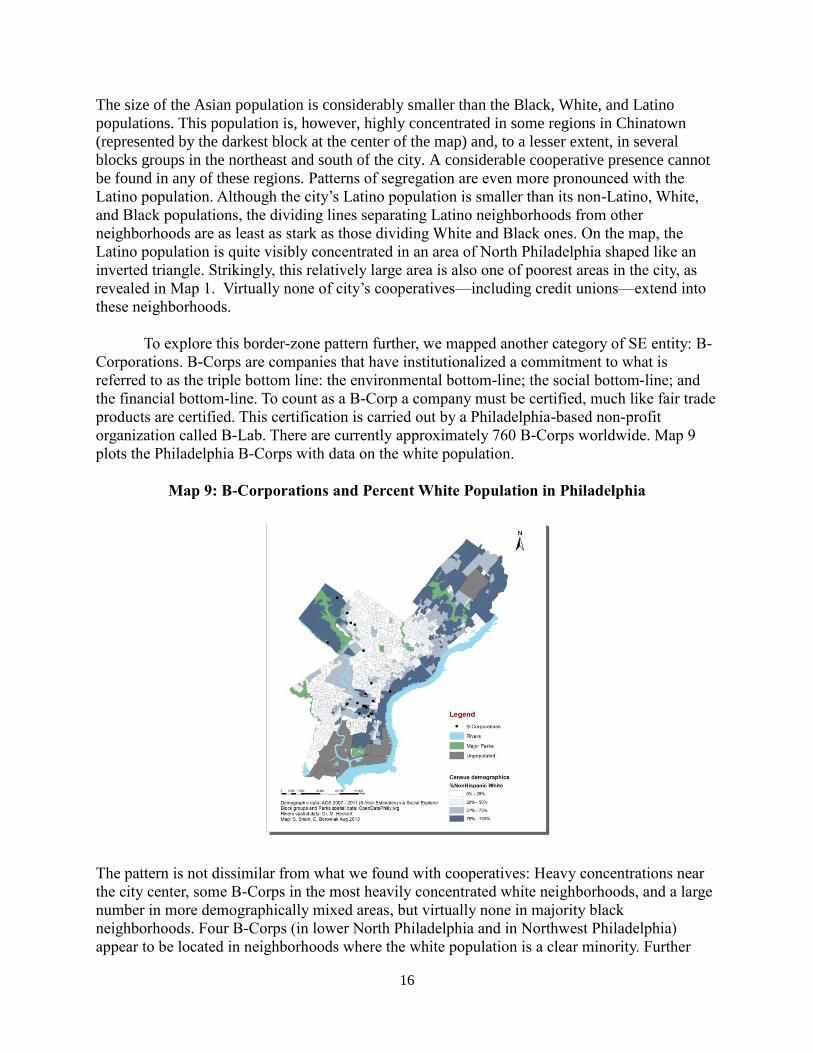
To explore this border-zone pattern further, we mapped another category of SE entity: B-
Corporations. B-Corps are companies that have institutionalized a commitment to what is
referred to as the triple bottom line: the environmental bottom-line; the social bottom-line; and
the financial bottom-line. To count as a B-Corp a company must be certified, much like fair trade
products are certified. This certification is carried out by a Philadelphia-based non-profit
organization called B-Lab. There are currently approximately 760 B-Corps worldwide. Map 9
plots the Philadelphia B-Corps with data on the white population.
Map 9: B-Corporations and Percent White Population in Philadelphia
The pattern is not dissimilar from what we found with cooperatives: Heavy concentrations near
the city center, some B-Corps in the most heavily concentrated white neighborhoods, and a large
number in more demographically mixed areas, but virtually none in majority black
neighborhoods. Four B-Corps (in lower North Philadelphia and in Northwest Philadelphia)
appear to be located in neighborhoods where the white population is a clear minority. Further
17
investigation reveals, however, that three of these have only white employees. The fourth, a
coffee shop with a mixed group of employees, caters primarily to a white clientele. All of this
seems to confirm our observation about a racialized pattern within the SE.
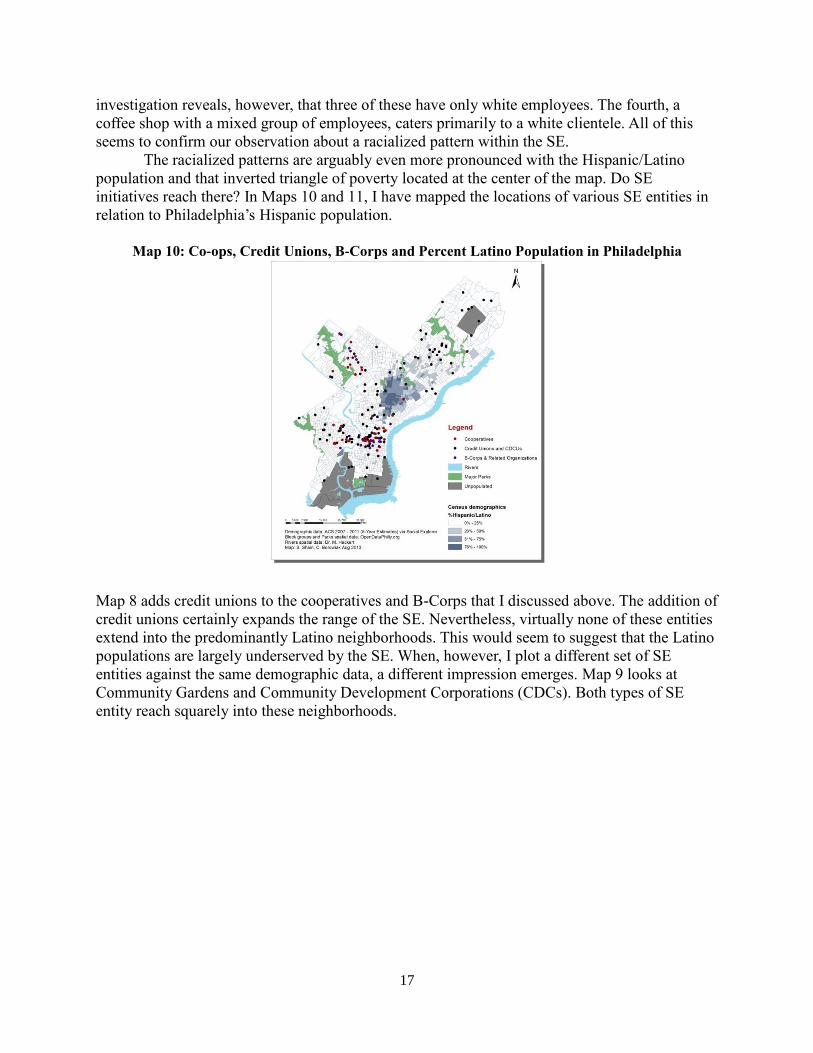
The racialized patterns are arguably even more pronounced with the Hispanic/Latino
population and that inverted triangle of poverty located at the center of the map. Do SE
initiatives reach there? In Maps 10 and 11, I have mapped the locations of various SE entities in
relation to Philadelphia’s Hispanic population.
Map 10: Co-ops, Credit Unions, B-Corps and Percent Latino Population in Philadelphia
Map 8 adds credit unions to the cooperatives and B-Corps that I discussed above. The addition of
credit unions certainly expands the range of the SE. Nevertheless, virtually none of these entities
extend into the predominantly Latino neighborhoods. This would seem to suggest that the Latino
populations are largely underserved by the SE. When, however, I plot a different set of SE
entities against the same demographic data, a different impression emerges. Map 9 looks at
Community Gardens and Community Development Corporations (CDCs). Both types of SE
entity reach squarely into these neighborhoods.

18
Map 11: Community Gardens & CDCs and Percent Latino Population in Philadelphia
This variation in the SE’s reach is important. It leads us to ask “Why?” What are the causal
mechanisms underlying these different spatially patterned distributions of SE activity? In this
case, it is hard to separate out economic variables from cultural ones, given how closely the
Latino neighborhoods coincide with areas of deep poverty: in some of these blocks, many of
which are homes to large families, per capita income is below $8,000. The fact that CDCs and
community gardens seem to fare better at reaching these communities can, at least in part, be
attributed to their differences from other SE initiatives. SE initiatives like credit unions, B-Corps,
and commercial consumer cooperatives all depend upon the saving power and disposable
incomes of community members. Residents in poverty stricken areas, however, often lack the
disposable income and saving capacity to sustain even solidarity-based companies. CDCs, by
contrast, are often deliberately organized within an impoverished community with the express
purpose of bringing about improvements in that community. This they often do with externally
subsidized funds. Additionally, several of the CDCs in this region of Philadelphia are motivated
with explicit concern about the health of the Latino community. Community gardens, in turn,
stand out because they offer a way to generate livelihoods without the need for much disposable
income. In fact, one of the appeals of community gardens is that they help offset the lack
disposable income by substituting community-grown produce for food items that would
otherwise be purchased from groceries. There is also a significant history of community
gardening among Latino immigrants in the United States, which might make this a more
appealing mode of solidarity economy than less familiar organizational forms (Saldivar-Tanaka
and Krasny 2004). These observations are, however, speculative in character. GIS maps are very
useful for exposing spatial correlations. They are less useful when it comes to identifying causal
mechanisms. Good causal explanations would require qualitative, ethnographic research to learn
more about what is happening on the ground and why communities and businesses are behaving
as they are where they are. That sort of research will be undertaken in subsequent stages of our
current research project.

19
PART Three: Limits of This Type of Mapping
I have used the maps above to illustrate a set of spatial relationships between a variety of
SE initiatives and Philadelphia’s demographic geography. In the process, I have sought to
introduce and promote this sort of mapping as a way to enhance research about SE. It is
nevertheless important to acknowledge some of the methodological challenges this type of
geographical analysis faces. I identify several of these challenges below.
First, as I alluded to earlier in the paper, these sorts of maps are only able to represent
initiatives that possess a physical address. This excludes a large number of SE activities that
don’t rely upon singular locations. For example, there is a worker cooperative in Philadelphia
that offers doula (i.e., childbirth) services around the city. The women who own and run this
company do so without a single office; they manage the business from their individual homes. It
is not at all clear how they might be put on the map. Similarly, buying clubs, complementary
currencies, time banks, babysitting collectives, and similarly networked practices are far more
difficult to represent on any map. The consequence is that such maps may tend to underrepresent
the size of the overall SE while overemphasizing the importance of those organizations that do
rely upon a single physical address.
Even for SE entities that do have a physical location, maps such as these can be
misleading by implying that that physical office location is strongly correlated with
organization’s impact on a community. Different SE entities, however, have different spatial
organization. Some are stand-alone entities whereas others are networks of consumers (e.g., large
consumer cooperatives, energy cooperatives, and community supported agriculture). Some are
locally-oriented whereas others operate at regional and national levels. Some pursue solidarity
among their workers whereas others cultivate solidarity among consumers and communities.
These differences have implications for how these entities should be represented spatially and
how their geography should be analyzed. The location of a credit union, community garden,
cohousing arrangement or food or childcare cooperative might be closely tied to the communities
who use and benefit from these organizations. But this is not the case for a variety of other
organizations. New transportation and communication technologies have made economic activity
much less place-based than it used to be. Consumers can consume from far away and workers in
many industries can labor far away from their customers. A worker cooperative might draw its
workers from one neighborhood (or, more likely, from many different neighborhoods) while
being based in an entirely different neighborhood (perhaps a more commercial one). The coop’s
end users might be located in still other neighborhoods. To give one example, the Energy
Cooperative in Philadelphia is a consumer cooperative that provides locally produced sustainable
energy to its members. Its offices are based in Center City, Philadelphia. Two-thirds of its
members and some of its employees, however, reside outside the city in the surrounding suburbs.
The relatively simple maps I’ve generated here fail to capture this information. This raises
questions about data. Which data should we be looking at to assess the relations between SE
activities and demographic variables? The physical locations of offices might tell us something.
Additional information might come from surveys of membership, users, and workforce. That
data, however, is far more difficult to acquire for such a large and diverse set of practices. Such
data does, fortunately, exist for ESOPs. There, the spatial analysis
The data is also only as good as the data collection. Perhaps our research team is not
looking hard enough or in the right places. It’s possible that we’re looking for practices that are
already racially and class coded in ways that render other forms of solidarity economy invisible.

20
For example, the solidarity exercised in the poorest Latino communities might be more informal
and kinship based, which would make it far more difficult to identify and incorporate into this
study. Or perhaps what makes the SE seem more like a “white” phenomenon than a “black” or
“Latino” one is the tendency of white communities, for whatever reason, to exercise economic
solidarity through formal organizations whereas other populations exercise economic solidarity
through more informal networks, kinship, and religious communities (i.e., the church). If this is
the case, and I expect it is, our data and conclusions about the overall reach of the SE will be
skewed, even if our data about many particular forms of SE are accurate. It is also possible that a
cultural bias has been built into the data collection insofar as the data collectors (who are
themselves culturally white and middle class) have greater access to relatively affluent white
communities than they have to Latino, Asian and black communities.
Finally, as I’ve already hinted at, these maps are not particularly good at establishing
causation. These maps are useful for visually representing correlations among spatial data. They
are far less useful when it comes to explaining why those correlations exist. More in-depth
quantitative and qualitative research needs to be done to establish causality. This brings us back
to the particularity of the organizations themselves. This sort of sociological mapping of the SE
needs to be complemented with detailed information about the individual entities that it maps.
That is the only way a compelling narrative can be told about why the patterns exist as they do.
We also need to be wary of overgeneralization. The conditions in Philadelphia might not
be replicated elsewhere. A less divided city might, for example, not provide the same sort of
visible contrasts and mapping results. Similarly, the demographic variables might prove
insignificant in a smaller city with fewer neighborhoods and fewer commercial areas. The
location of SE organizations might have more to do with the location of the city’s one or two
major commercial corridors. In Philadelphia, however, the locations of particular economic
corridors don’t override the significance of race and class divides. On the contrary, they often
reproduce those divides.
Conclusion
In this essay, I’ve presented an alternative way of mapping the social and solidarity
economy. This mode of mapping is both more sociologically oriented and more rooted in the
methods of human geography. It aims to identify larger spatial and demographic patterns in the
way the SE is organized. Doing so can help the SE movement identify both communities in need
of development alternatives and biases inherent in the SE practices themselves. If existing
initiatives to map the SE focus on making individual SE enterprises visible, this type of mapping
focuses on making underserved communities visible for SE development. In this respect, it puts
geospatial and information technologies in the service of economic and social empowerment
(Pavlovskaya 2006).
I have used these mapping technologies to illustrate a set of spatial relationships between
SE initiatives and Philadelphia’s demographic geography. I have suggested that even though the
SE as a whole might appear to span the city in a manner that is demographically neutral, this is
not the case when the different categories of SE activity are disaggregated. Specifically, I have
suggested that many categories of SE entity do not do well at reaching poor neighborhoods.
CDCs, credit unions, and community gardens seem to fare better than others. SE organizations
that rely upon a community’s disposable income seem to do worse. I’ve also observed that the

21
SE is more prominent in predominantly white communities than in nonwhite ones. This
observation needs to be qualified, however, with the further observation that border zones
between racially/ethnically concentrated communities seem to serve as rich sites for SE
development. Why this might be the case requires further investigation.
The fact that different categories of SE activity cluster spatially in racially and
economically significant ways introduces a new dimension to contemporary SE research. It
illuminates the importance of both geography and demographics. And it potentially opens new
lines of inquiry into the SE and its relation to race and class. Concern about ethnic/racial
minorities and the economic underclass is ostensibly vital to the core philosophies under the SE
movement. Nonetheless, the SE movement (or at least segments of it) has also been criticized as
a middle class movement that ultimately does very little to bring about the radical restructuring
necessary to truly address the root causes of poverty and socio-economic injustice. Using maps
such as I have can hopefully carry us some way towards assessing the depth of such
shortcomings.
Ultimately, maps such as these do more to open questions than they do to answer them.
For this reason, in the next stages of our research in the U.S., we will complement our
geographic analysis with qualitative interviews and quantitative studies of economic impact. A
fuller picture of the SE, its impacts, and its causes in these regions will hopefully emerge.

22
Bibliography
Allard, J., C. Davidson, and J. Matthaei,. eds. 2008. Solidarity Economy: Building Alternatives
for People and Planet. Chicago: ChangeMaker Publications.
Amin, A., ed. 2009. The Social Economy. International Perspectives on Economic Solidarity.
New York: Verso.
Coraggio , J. L. and M. Sol Arroyo. 2009. “A path to the social economy in Argentina: worker
takeovers of bankrupt companies.” In The Social Economy. International Perspectives on
Economic Solidarity, ed. A. Amin, 139-55. New York: Verso.
Defourny, J. and P. Develtere. 1999. “Social Economy: the Worldwide Making of a Third
Sector.” In Social Economy. North and South, ed. J. Defourny, P. Develtere and B.
Fonteneau, 25-56. Brussels: De Boeck.
Demoustier D., Rousselière D. 2006. “Social economy as social science and practice: Historical
perspectives on France.” In Ethics and the Market: Insights from Social Economics, ed.
Clary J., W. Dolfsma, and D. Figart, 112-125. New York, Routledge.
Desroche, H. 1983. P ’ . Paris: Coopérative d’édition et
d’information mutualiste.
Desroche, H. 1991. H ’ . D’ t aux tiers secteurs, 1791-
1991. Paris: Syros.
Evers, A. and J-L. Laville, eds. 2004. The Third Sector in Europe. Cheltenham: Edward Elgar.
Gibson-Graham, J.K. 1996. The End of Capitalism as We Knew it. Minneapolis: University of
Minnesota Press.
Gibson-Graham, J.K. 2005. Post-Capitalist Politics. Minneapolis: University of Minnesota
Press.
Laville, J. 1994. L’ . Une perspective international. Paris: Desclée de
Brouwer.
Laville, J., B. Lévesque and M. Mendell. 2007. “The Social Economy: Diverse Approaches and
Practices in Europe and Canada.” In The Social Economy, ed. Antonella Noya and Emma
Clarence. Washington, DC: OECD.
Mance, E. 2002. Redes de Colaboração Solidária. Brazil: Vozes.
Mendell, M., and Neamtan, N. 2010. “The social economy in Quebec: Towards a new political
economy.” In Researching the social economy, ed. L. Mook, J. Quarter, and S. Ryan, 87-
115. Toronto, ON: University of Toronto Press.
Moulaert, F. and O. Ailenei. 2005. “Social Economy, Third Sector and Solidarity Relations: A
Conceptual Synthesis from History to Present.” Urban Studies, 42, No. 11, pp. 2037-
2053.
Nembhard, Jessica Gordon. 2004. "Cooperative ownership in the struggle for African American
economic empowerment." Humanity and Society Vol 28, No. 3.
23
Pavlovskaya, M. 2006. "Theorizing with GIS: A tool for critical geographies?" Environment and
Planning 38 (11): 2003-2020.
Pearce, J. 2003. Social Enterprise in Any Town. London: Calouste Gulbenkian Foundation.
Quarter J, L. Mook and A. Armstrong. 2009. Understanding the Social Economy. A Canadian
Perspective. Toronto: The University of Toronto Press.
Razeto, L. 1998. “El ‘Factor C’: La Fuerza de la Solidaridad en la Economia” [“Factor C: The Force of Solidarity in the Economy”] http://www.luisrazeto.net/content/el-factor-c-la-fuerza-de-
la-solidaridad-en-la-economia-entrevista. Accessed 13 June, 2013.
Razeto, L. 2010. Interview with Luis Razeto. Interview by Esteban Romero.
http://cborowiak.haverford.edu/solidarityeconomy/resources-for-researchers/theorizing-
social-and-solidarity-economy/interviews-with-louis-razeto/
RIPESS. 1997. “Lima Declaration.” http://base.socioeco.org/docs/declaration_lima_eng.pdf
Rodríguez-Garavito, C. 2006. “Solidarity Economy and the Struggle for Social Citizenship in
Times of Globalization: A Study of the Cooperatives of Informal Garbage Pickers in
Columbia.” In Another Production is Possible. Beyond the Capitalist Canon, ed. B.
Santos. New York: Verso.
Saldivar-Tanaka, Laura, and Marianne E. Krasny. 2004. "Culturing community development,
neighborhood open space, and civic agriculture: The case of Latino community gardens
in New York City." Agriculture and human values 21, No. 4: 399-412
Vienney, C. 1994. L’ . Paris: La Découverte.
Wright, Erik Olin. 2010. v g R U p . New York: Verso