Embed Size (px)
Citation preview
MAPLE LEAF PORK - BRANDON, MANITOBA
EXPANDED BIOLOGICAL TREATMENT FOR 18,000 HOGS/DAY
PRELIMINARY STUDY AND REPORT
Manitoba licence no 23599 Expires “July 31, 2003”
J. Willis Sneed Nebraska license no E-4370
Expires “December 31, 2004
PREPARED BY:
HDR ENGINEERING, INC. 8404 INDIAN HILLS DRIVE
OMAHA, NE 68114-4049
HDR PROJECT NO. 09060-005-134-01
June 6, 2003
N:\industri\MapleLeaf\MLP @ Brandon-Exp Bio Treatment.doc i May 2003
TABLE OF CONTENTS
Section Page
I. INTRODUCTION .............................................................................................................1
II. EXISTING FACILITIES.................................................................................................. 1A. Packing Plant .........................................................................................................1 B. Pretreatment Facilities ...........................................................................................2 C. Biological Treatment Facilities..............................................................................6
1. Covered Anaerobic Lagoon .........................................................................62. Activated Sludge System .................................................................................93. Effluent Disinfection, Sampling, Metering and Discharge Facilities............11
III. DESIGN PARAMETERS .............................................................................................. 12A. Production............................................................................................................12 B. Flow .....................................................................................................................13 C. Sanitary Waste Characteristics ............................................................................13
IV. PHYSICAL PRETREATMENT EVALUATION.......................................................... 14A. Raw Waste Lift Station and Piping Modifications ..............................................14 B. Screening .............................................................................................................15 C. Access to Elevated Screens, Centrifuge and Polymer Makeup Unit ...................16 D. Dissolved Air Flotation........................................................................................16 E. Skimmings Handling ...........................................................................................16 F. Pretreatment Sanitation........................................................................................17 G. Estimated Pretreated Effluent Characteristics .....................................................17
V. EFFLUENT DISCHARGE CRITERIA ......................................................................... 19
VI. CHEMICAL PRETREATMENT AND BIOLOGICAL TREATMENT EVALUATION AND RECOMMENDATIONS ...................................................................................... 22A. Nitrogen Removal Options ..................................................................................22
1. Chemical Pretreatment...................................................................................232. Biological Treatment .....................................................................................25
B. Option 1 – Chemical Pretreatment and Biological Treatment.............................25 1. Chemical Pretreatment...................................................................................272. New Equalization Basin.................................................................................283. Activated Sludge System with Anoxic Cells .................................................304. Sludge and Scum Handling Facilities ............................................................325. Effluent Sampling, Metering, Disinfection, and Discharge Facilities...........32
C. Option 2 – Biological Treatment .........................................................................33 1. Anaerobic Treatment .....................................................................................332. Biogas Handling Facilities.............................................................................353. Activated Sludge System with Anoxic Cells .................................................364. Sludge and Scum Handling Facilities ............................................................395. Effluent Sampling, Metering, Disinfection, and Discharge Facilities...........396. Emergency Storage ........................................................................................39
VII. SUMMARY AND CONCLUSIONS ............................................................................. 39
N:\industri\MapleLeaf\MLP @ Brandon-Exp Bio Treatment.doc ii May 2003
LIST OF TABLES
Table No. Title Page
Table I Existing Production Waste Influent Design Parameters........................................8 Table II Production Waste Design Flows..........................................................................13 Table III Sanitary Waste Design Characteristics ................................................................14 Table IV Monthly Effluent Nutrient Amounts and Potential Effluent Criteria ..................21 Table V Maximum Weekly Effluent Nutrients and Potential Effluent Criteria ................22 Table VI Nutrient Reductions Required to Meet Benchmark Effluent Nutrient Criteria ...23
LIST OF FIGURES
Figure No. Title Page
Figure 1 Pretreatment Flow Schematic ..................................................................................3 Figure 2 Waste Treatment Flow Schematic ...........................................................................6 Figure 3 Option 1 – Chemical Pretreatment and Biological Treatment Flow Schematic....25 Figure 4 Option 2 – Biological Treatment Flow Schematic ................................................33
N:\industri\MapleLeaf\MLP @ Brandon-Exp Bio Treatment.doc 1 May 2003
MAPLE LEAF PORK - BRANDON, MANITOBA EXPANDED BIOLOGICAL TREATMENT FOR 18,000 HOGS/DAY
PRELIMINARY STUDY AND REPORT
I. INTRODUCTION
The purpose of this Study and Report is to evaluate the treatment capacity of existing
pretreatment and waste treatment facilities and determine what will be required for a future
double-shift slaughter of 18,000 head per day. The scope of this report includes: 1) description
of existing facilities, 2) development of design parameters, 3) projection of probable effluent
limitations, 4) assessment of the adequacy of existing pretreatment facilities, and 5) evaluation of
existing waste treatment facilities.
II. EXISTING FACILITIES
A. Packing Plant
The Maple Leaf Pork plant at Brandon, Manitoba is a hog slaughtering facility planning
to increase production from a current design kill rate of 54,000 hogs/wk during a single
shift to 108,000 hogs per during a double-shift, six days/wk. Currently the maximum
slaughter has been about 50,435 hogs during a five-day week and nearly 52,890 hogs
during a six-day week with around 2500 hogs killed on Saturday. However hog weights,
at about 113.5 kg/hog (250 lb/hog), have been somewhat higher than the previous design
weight of 109 kg/hog (240 lb/hog). About 1460 people are currently employed at the
plant, including salaried and part-time employees.
The plant does no processing, has no smokehouses, produces no case-ready product
including ground and seasoned pork, but does bone primal cuts (large pieces from the
initial cutting up of the hog carcass).
By-product operations include blood and hair collection, casings saving, bung
processing, and edible rendering. Stomachs can be opened and processed as edible,
although sales of this material may limit the amount of stomachs processed. No inedible
N:\industri\MapleLeaf\MLP @ Brandon-Exp Bio Treatment.doc 2 May 2003
rendering is practiced, so all inedible materials including unopened stomachs and
chitterlings and screenings and solids from pretreatment, are loaded on trucks for
processing offsite. Much of the blood is collected in stainless steel troughs, equipped
with citric acid sprays to prevent clotting, and pumped into a tanker trailer for processing
offsite. As much as possible, the remaining “floor blood” is collected and pumped onto
the inedible material trailer. Hair is collected and loaded on trucks for processing offsite.
Mucosa is recovered from the casings, but the remaining contents are discharged to the
sewer. Partial processing of the mucosa is practiced with the resulting peptone directed
to wastewater pretreatment. Bungs are saved with the contents discharged to the
wastewater pretreatment. Edible lard is recovered for sale with a two-stage centrifugal
separation process. The meat tissue from this operation is conveyed to the inedible
rendering trucks, while the sludge phase is collected for pumping onto the same inedible
trucks.
The refrigeration system is direct ammonia cooled. Air compressors are also air-cooled.
Potable water is used to wash reefer trucks, but no livestock trucks are washed onsite.
Manure from the livestock pens is hosed down to wastewater pretreatment.
B. Pretreatment Facilities
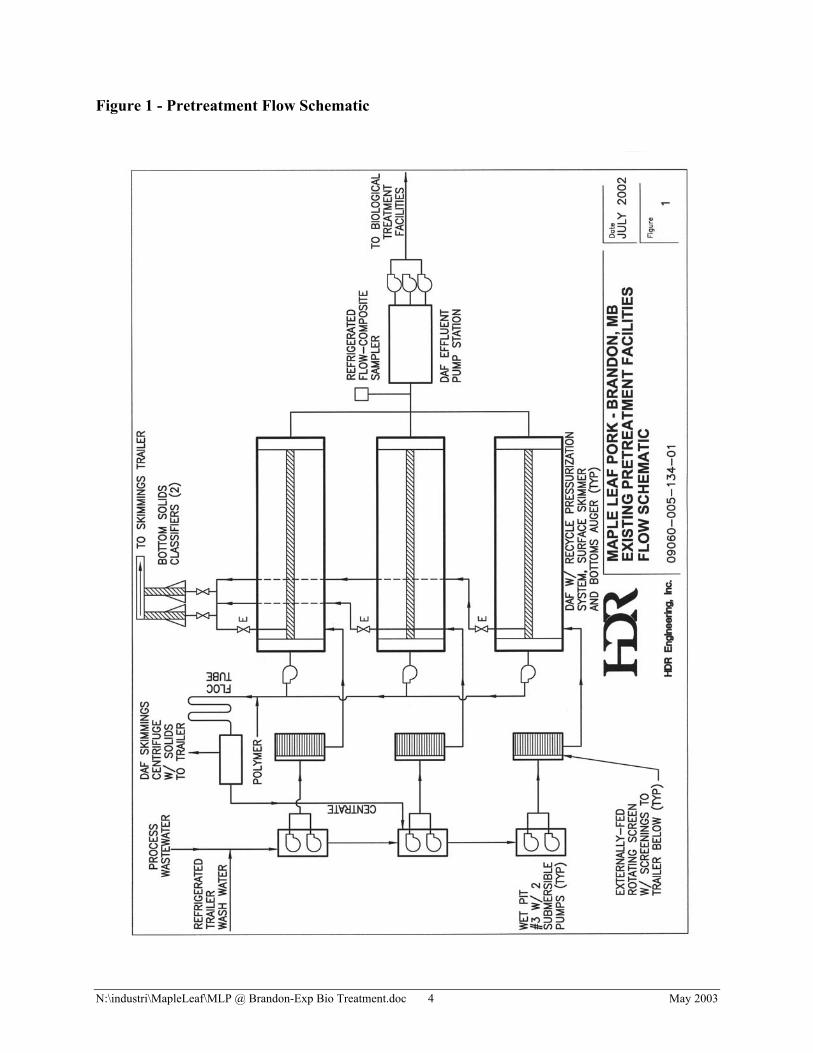
Wastewater from the packing plant flows by gravity to the pretreatment building where it
enters three separate wet pits in series. See Figure No. 1. The raw wastewater is pumped
with two submersible pumps in each wet pit. The pump controls utilize ultrasonic level
sensors in each wet pit to activate pumps in that wet pit. Alternation of the lead is done
manually. The two pumps in each wet pit only supply wastewater to one of the three
externally-fed rotating screens located on an elevated platform above the wet pits. The
screens are equipped with 1.0-mm openings for recovery of coarse solids. The
screenings are directed into a trailer for hauling offsite for rendering.
After screening, wastes flow by gravity to three, parallel dissolved air flotation (DAF)
systems for recovery of grease and fine solids. Each DAF unit can only receive flow
N:\industri\MapleLeaf\MLP @ Brandon-Exp Bio Treatment.doc 3 May 2003
from one of the rotating screens. The above-grade, rectangular stainless steel DAF units
are
N:\industri\MapleLeaf\MLP @ Brandon-Exp Bio Treatment.doc 4 May 2003
Figure 1 - Pretreatment Flow Schematic
N:\industri\MapleLeaf\MLP @ Brandon-Exp Bio Treatment.doc 5 May 2003
each equipped with high-pressure recycle pressurization systems. Each DAF tank has
effective surface dimensions of 14.3 m long by 3.0 m wide (approx. 46.92 ft x 9.84 ft).
The first half of each DAF tank was originally equipped with short, inclined plates about
400 mm apart, although these plates have since been removed from all three of the DAF
units due to problems with plugging with fat.
Bottoms solids are augured to the influent end of each DAF tank where they are
periodically blown down to a pair of stainless steel classifiers by a time clock-activated
electric valve on each DAF. Heavy solids from each classifier are deposited on a belt
conveyor that dumps this material into the screenings trailer for off-site rendering.
Material floating on the surface of each DAF is skimmed with a chain and flight
mechanism into a small hopper at the influent end of each DAF tank. A level sensor in
each skimmings hopper turns the skimmers on or off, depending on the skimmings level
in the hopper. DAF skimmings are pumped with progressing-cavity pumps, equipped
with VFDs, to a flocculation tube (also called floc tube or windings) on the elevated
platform near the rotary screens. A polymer solution is made up on the platform by
mixing water and a dry cationic polymer in a polymer makeup unit. This polymer
solution is metered into the DAF skimmings as they enter the windings to flocculate the
solids before they enter a Pieralisi decanter centrifuge without a back drive. Centrate is
discharged back into the middle wet pit, while the solids are discharged into a trailer and
hauled to Winnipeg for rendering or landfilling, if the material does not meet the
renderer’s requirements.
After screening and flotation, the pretreated wastewater flows by gravity to a large,
below-grade wet pit. An ISCO refrigerated sampler is available to collect time-
composited samples of the influent into the wet pit. Three Gorman Rupp T-8 pumps are
available to pump the wastewater from this below-grade pit to the City of Brandon’s
biological wastewater treatment facilities that serve the Maple Leaf plant. Steam can be
injected into the wastewater during production days as necessary to maintain the required
30o C wastewater temperature in the effluent from the anaerobic lagoon at the City’s
N:\industri\MapleLeaf\MLP @ Brandon-Exp Bio Treatment.doc 6 May 2003
treatment system. There is no temperature regulator to control the amount of steam
injected; steam is regulated manually.
Wash water from the refrigerated trailer wash flows by gravity to influent wet pits for
pretreatment. No livestock trailers are washed at this facility.
An estimated 138 m3/day of sanitary wastes from toilets, urinals, lavatories, drinking
fountains, the laundry, and the cafeteria flow by gravity to the sanitary waste lift station
located just west of the pretreatment building. This sanitary sewage, from about 1460
plant personnel, is pumped with two submersible pumps from a wet pit to a screen for
solids removal. After screening the sewage enters a second pit where two submersible
pumps lift the sewage to the anaerobic lagoon at the City’s adjoining treatment plant.
The only way to measure the flow of sanitary sewage is with an hour meter on the
pumps, which has not appeared to be reliable.
C. Biological Treatment Facilities
1. Covered Anaerobic Lagoon
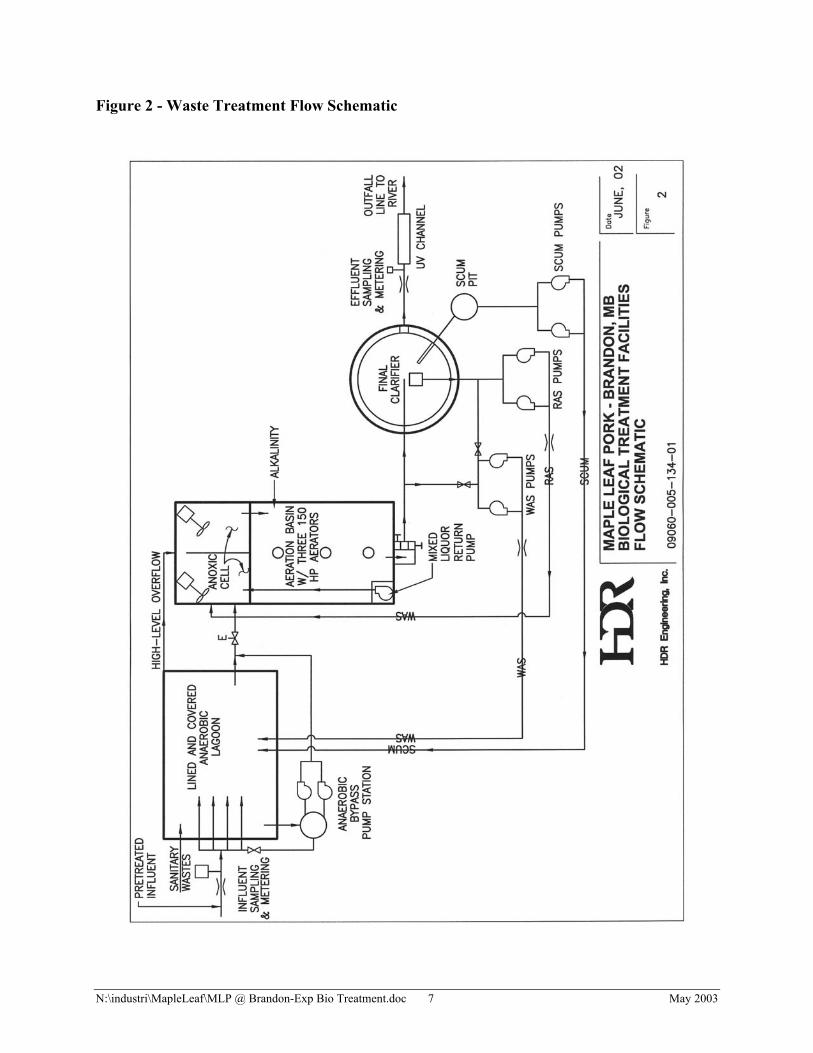
Pretreated process waste from the packing plant is metered with a magnetic flow
meter and sampled with a refrigerated flow-composite sampler just before
entering the anaerobic lagoon. See Figure No. 2. After sampling and metering,
the flow is split into four anaerobic influent lines. Additionally there is a valved
line from the influent to the anaerobic bypass pump station wet pit. Sanitary
sewage is also pumped into the anaerobic lagoon through a separate line.
Exclusive of sanitary sewage, anaerobic influent design parameters for the
slaughter of 54,000 hogs/wk at 109 kg/hog during a single-shift kill, six days/wk
were as shown in Table I.
N:\industri\MapleLeaf\MLP @ Brandon-Exp Bio Treatment.doc 7 May 2003
Figure 2 - Waste Treatment Flow Schematic
N:\industri\MapleLeaf\MLP @ Brandon-Exp Bio Treatment.doc 8 May 2003
Table I Existing Production Waste Influent Design Parameters
Parameter Maximum Week ConcentrationFlow 31,200 m3/wk -COD 103,740 kg/wk 3325 mg/l CBOD5 59,280 kg/wk 1900 mg/l Total Suspended Solids (TSS) 39,312 kg/wk 1260 mg/l Total Kjeldahl Nitrogen (TKN) 6,145 kg/wk 197 mg/l Phosphorous (P) 1,000 kg/wk 32 mg/l Oil and Grease (O&G) 5,865 kg/wk 188 mg/l
The anaerobic lagoon is lined with a double HDPE liner with leak
detection/collection system. The lagoon is also equipped with an insulated HDPE
cover to minimize heat loss and collect biogas from under the cover. Biogas is
withdrawn from under the lagoon cover with four biogas blowers (space is
available for two more). These blowers are Sutorbilt 4MP positive-displacement
blowers V-belt driven by 7.5/15-hp, dual-voltage motors. Each blower is sized
for 354 m3/hr. All blowers are equipped with VFDs and at full speed, one blower
is more than capable of handling the entire biogas volume currently generated.
Biogas containing an estimated 75 percent methane and small concentrations of
hydrogen sulfide can be flared or utilized in a dedicated biogas boiler at the
packing plant to generate hot water.
Flow can be pumped around the anaerobic lagoon with a bypass pump station.
Flow from the anaerobic influent piping or from two lines from the southeast
corner of the anaerobic lagoon can be directed into the wet pit for this pump
station. A package pump station is mounted over the wet pit and utilizes two
Gorman Rupp T-6 self-priming pumps. A magnetic flow meter is available in an
adjoining pit to meter this bypass flow. A portion of the flow is normally
bypassed around the lagoon with as much as 2000 m3/day bypassed at times.
Anaerobic bypass flow combines with two effluent lines from the anaerobic
lagoon. Recently provisions were added to automatically throttle the flow rate
out of the lagoon to a preset rate to equalize the flow over seven days per week.
N:\industri\MapleLeaf\MLP @ Brandon-Exp Bio Treatment.doc 9 May 2003
As such, the maximum volume with 0.5 m (1.64 ft) of freeboard is 39,973.6 m3
(10,561,025 gal) and the minimum volume is 30,406 m3 (8,033,265 gal). This
results in the difference of 9,567.6 m3 (2,527,760 gal) available for flow
equalization. A separate high water overflow line to the subsequent anoxic basin
is included in case the water level becomes too high (only 0.31 m or 1 ft of
freeboard) in the anaerobic lagoon.
Mixed liquor or waste activated sludge (WAS) and scum from the final clarifier
are also pumped through separate lines into the anaerobic lagoon for settling,
digestion and thickening. The anaerobic lagoon is equipped with five 250-mm
(10-inch) sludge draw-off lines so sludge can periodically be removed from the
lagoon and land applied at agronomic rates. The solids content of this sludge has
varied from 2.5 to 4 percent when sludge has been removed in the past.
2. Activated Sludge System
Effluent from the anaerobic lagoon flows by gravity to a subsequent activated
sludge system designed to nitrify and denitrify. The activated sludge system
consists of a combination anoxic/aeration basin, a final clarifier and sludge and
scum pumping facilities.
a. Anoxic basin. Influent enters the initial anoxic zone of the concrete
anoxic/aeration basin. The anoxic cell holds approximately 1152 m3
(304,360 gallons) at a water depth of 4.5 m (14.76 ft) and is divided into
two halves. Each half is equipped with a 7.5-hp submersible mixer. This
basin is intended to recover alkalinity and reuse oxygen while treating
BOD. To enhance this recovery by providing more BOD for
denitrification, flow can be bypassed around the anaerobic lagoon, as
discussed previously. Nitrates are returned to this basin with the Return
Activated Sludge (RAS) from the final clarifier and by pumping mixed
liquor from the end of the subsequent aeration basin back to the inlet end
of the anoxic basin with a 420 lps (6660 gpm), 7.5-hp submersible pump.
N:\industri\MapleLeaf\MLP @ Brandon-Exp Bio Treatment.doc 10 May 2003
This submersible pump is the same as the submersible mixers in the
anoxic basins and a spare unit is available as a standby. Dissolved oxygen
in the anoxic basin is typically around 0.2 mg/l.
Monthly total nitrogen reductions across the entire treatment system, due
to both denitrification and nitrogen uptake in the waste sludge, have been
as high as nearly 60 percent and as low as 5.5 percent. Despite alkalinity
recovery through denitrification, however, 22 metric tonnes of unslaked
lime is still added to the subsequent aeration basin every three to four
weeks. This unslaked lime stored in a lime silo equipped with a slaker to
hydrate the lime before it is added as a slurry.
b. Aeration Basin. After anoxic treatment, the wastewater enters the
aerated portion of the anoxic/aeration basin for nitrification of the
ammonia and further BOD reduction. This aerated cell holds
approximately 3456 m3 (913,075 gallons) at a water depth of 4.5 m (14.76
feet) and is equipped with three dual-speed, 113/150-hp, slow-speed
surface aerators which promote aeration and mixing. A spare 113/150-hp
aerator motor is also available as a standby unit. Normally only the first
two aerators are operated. Dissolved oxygen is typically around 4.5-5
mg/l near the influent to this basin and 2.0 mg/l near the effluent. In
addition to changing the speed of the aerators, oxygen transfer can be
varied by adjusting the submergence of the aerator propellers. This is
accomplished by varying the height of a slide gate at the effluent structure
for the aeration basin. From this basin, the mixed liquor enters an
adjoining splitter structure that is designed to potentially split the flow
between three final clarifiers.
c. Final Clarifier. Currently mixed liquor enters a single 22.5-m
(73.8-ft) diameter final clarifier with an inboard launder. This 4.5-m
(14.76-ft) deep, concrete clarifier is equipped with a WesTech double-
centerwell, full-sweep skimmer and a sludge scraper mechanism for
N:\industri\MapleLeaf\MLP @ Brandon-Exp Bio Treatment.doc 11 May 2003
settled sludge removal. The sludge blanket depth is continuously
monitored by a Drexelbrook sludge blanket sensor. A spare clarifier drive
unit is available as a standby unit.
d. Sludge and Scum Handling. Settled sludge is pumped from the
clarifier sludge hopper and returned to the anoxic cell with one or two
Ingersoll Dresser horizontal centrifugal pumps. This RAS flow is metered
with a magnetic flow meter.
Sludge can be wasted from the activated sludge system by either pumping
waste activated sludge (WAS) from the final clarifier sludge hopper or by
pumping mixed liquor from the influent side of the clarifier splitter
structure with one or two Ingersoll Dresser horizontal centrifugal pumps.
In either case, this flow is metered with a magnetic flow meter and then
pumped back to the southeast corner of the anaerobic lagoon.
From the clarifier skimmings hopper, the scum is deposited into a small
concrete scum hopper adjoining the final clarifier wall. Scum is pumped
from this hopper with one of two Wemco Hidrostall pumps back to the
southeast corner of the anaerobic lagoon through a forcemain separate
from the sludge wasting line.
3. Effluent Disinfection, Sampling, Metering and Discharge Facilities
Before discharge the final effluent is metered and then disinfected with a Trojan
3000 ultra-violet (UV) disinfection system. UV lamps are mounted on four arms
for swinging out of the channel for maintenance. A baffle was installed in the
UV channel to block off a third of the channel. If necessary in the future, this
baffle can be removed so two more moveable arms with UV lamps can be
installed.
N:\industri\MapleLeaf\MLP @ Brandon-Exp Bio Treatment.doc 12 May 2003
After disinfection the effluent is sampled with a refrigerated flow composite
sampler and discharged through a 375-mm (14.75-inch) gravity outfall line to the
Assiniboine River.
III. DESIGN PARAMETERS
After review of operating data and discussion with management, the following design production
basis and flows have been established for a two-shift kill and cut.
A. Production
Kill and Cut @ double shift, 5 or 6 days/wk - 18,000 hogs/day at 120 kg/hog (265 lb/hog) - 2,160,000 kg/day
Maximum Barn Capacity - 10,080 hogs
Byproduct Operations: - Stomach processing
- Casing processing - No chitterling processing
- Bung processing - Ham Boning - No processing, smokehouses, or case-ready product - Possibly ground and seasoned pork - Edible Rendering - No inedible rendering currently, remote possibility it may be
considered in the future
N:\industri\MapleLeaf\MLP @ Brandon-Exp Bio Treatment.doc 13 May 2003
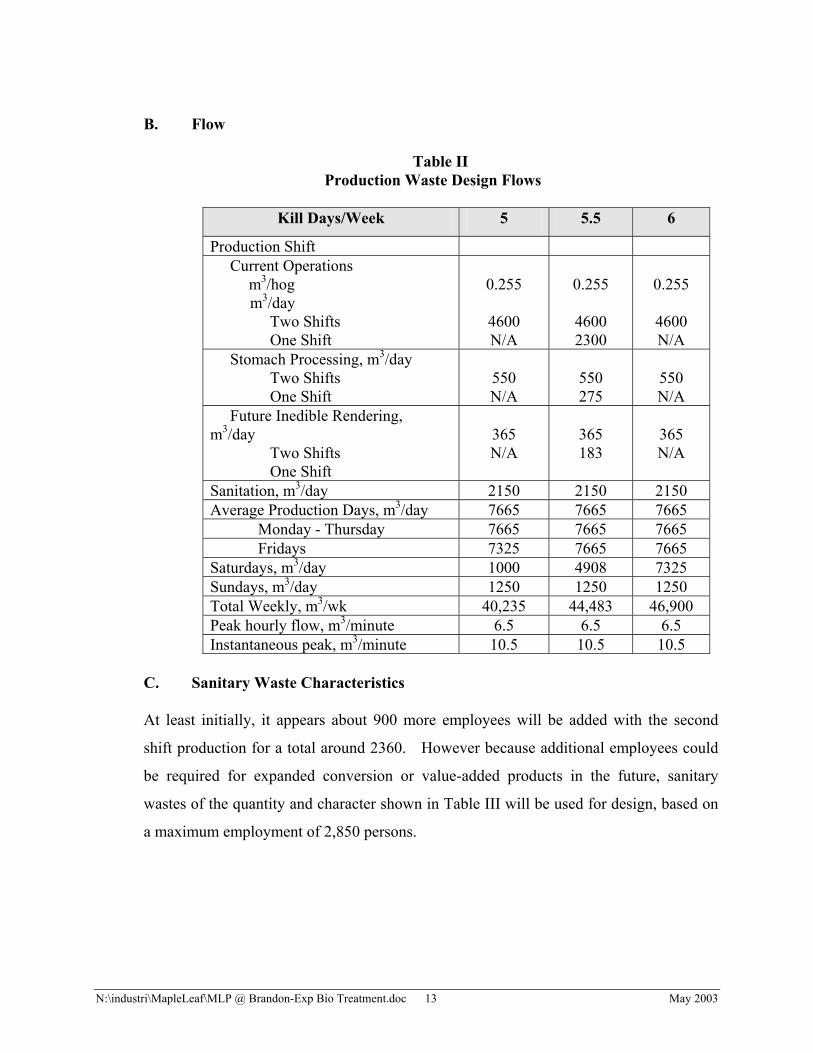
B. Flow
Table II Production Waste Design Flows
Kill Days/Week 5 5.5 6
Production Shift Current Operations m3/hog m3/day Two Shifts One Shift
0.255
4600N/A
0.255
46002300
0.255
4600N/A
Stomach Processing, m3/day Two Shifts One Shift
550N/A
550275
550N/A
Future Inedible Rendering, m3/day Two Shifts One Shift
365N/A
365183
365N/A
Sanitation, m3/day 2150 2150 2150 Average Production Days, m3/day 7665 7665 7665 Monday - Thursday 7665 7665 7665 Fridays 7325 7665 7665 Saturdays, m3/day 1000 4908 7325 Sundays, m3/day 1250 1250 1250 Total Weekly, m3/wk 40,235 44,483 46,900 Peak hourly flow, m3/minute 6.5 6.5 6.5 Instantaneous peak, m3/minute 10.5 10.5 10.5
C. Sanitary Waste Characteristics
At least initially, it appears about 900 more employees will be added with the second
shift production for a total around 2360. However because additional employees could
be required for expanded conversion or value-added products in the future, sanitary
wastes of the quantity and character shown in Table III will be used for design, based on
a maximum employment of 2,850 persons.
N:\industri\MapleLeaf\MLP @ Brandon-Exp Bio Treatment.doc 14 May 2003
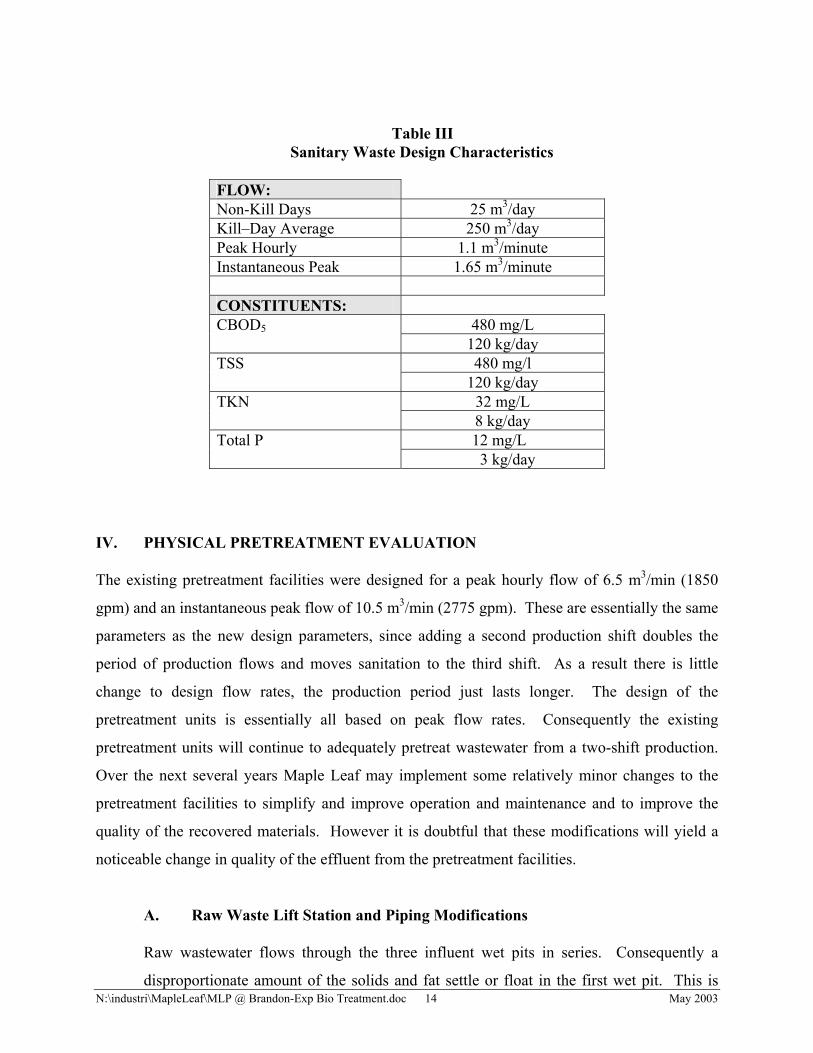
Table III Sanitary Waste Design Characteristics
FLOW:Non-Kill Days 25 m3/dayKill–Day Average 250 m3/dayPeak Hourly 1.1 m3/minuteInstantaneous Peak 1.65 m3/minute
CONSTITUENTS:480 mg/L CBOD5
120 kg/day 480 mg/l TSS
120 kg/day 32 mg/L TKN8 kg/day
12 mg/L Total P 3 kg/day
IV. PHYSICAL PRETREATMENT EVALUATION
The existing pretreatment facilities were designed for a peak hourly flow of 6.5 m3/min (1850
gpm) and an instantaneous peak flow of 10.5 m3/min (2775 gpm). These are essentially the same
parameters as the new design parameters, since adding a second production shift doubles the
period of production flows and moves sanitation to the third shift. As a result there is little
change to design flow rates, the production period just lasts longer. The design of the
pretreatment units is essentially all based on peak flow rates. Consequently the existing
pretreatment units will continue to adequately pretreat wastewater from a two-shift production.
Over the next several years Maple Leaf may implement some relatively minor changes to the
pretreatment facilities to simplify and improve operation and maintenance and to improve the
quality of the recovered materials. However it is doubtful that these modifications will yield a
noticeable change in quality of the effluent from the pretreatment facilities.
A. Raw Waste Lift Station and Piping Modifications
Raw wastewater flows through the three influent wet pits in series. Consequently a
disproportionate amount of the solids and fat settle or float in the first wet pit. This is
N:\industri\MapleLeaf\MLP @ Brandon-Exp Bio Treatment.doc 15 May 2003
visually evident by comparing the large amount of screenings removed on the first
rotating screen that serves the first wet pit with that removed on the third screen that
serves the final wet pit. Therefore the subsequent dissolved air flotation units (DAFs)
following the screens similarly receive unequal solids and fat loadings. Presumably DAF
removals would be somewhat better if the loading to each unit were similar. Mixing the
first two wet pits with an air lance using compressed air was tried as a simple,
economical solution, but did not prove entirely effective. Current plans are to isolate the
third pit and operate the plant on the first two pits, leaving the third pit available as a
back up.
The existing raw waste pumps periodically jam with solids discharged into the raw waste
pit. Maintenance of these pumps is labor intensive and their useful life is reduced. As a
result, consideration in being given to replacing the existing submersible pumps with
high-quality, submersible Vaughn Chopper Pumps. To match variable influent flow
rates, as many as six submersible pumps may be used.
Currently there is no interconnection in the piping to the screens or in the piping from the
screens to the dissolved air flotation (DAF) units. In a “worst-case” scenario, if a certain
combination of two pumps, one screen and one DAF were to fail; the packing plant could
be shut down. Consequently consideration is being given to modifying the piping from
the raw waste lift pumps to provide a common header before the screens. Similarly
underflow piping from the screens will enter a distribution hopper to feed each of the
three subsequent DAF units.
B. Screening
Consideration is also being given to replacing the existing rotary screens with new FAN
Screw Press Separators. These units have smaller 0.5 mm openings, produce drier solids,
are compact, and are contained so the release of humidity and odors is minimized.
Another potential benefit is that DAF skimmings could be directed back through the
screen. The screenings act as a filter to remove and dewater the fat and solids in the
skimmings.
N:\industri\MapleLeaf\MLP @ Brandon-Exp Bio Treatment.doc 16 May 2003
The pumps feeding new FAN Separator screens would operate against more head, so
screen replacement might logically be done at the same time as the existing pumps are
replaced.
C. Access to Elevated Screens, Centrifuge and Polymer Makeup Unit
The current access to the existing screens and centrifuge is by a long vertical ladder.
Routinely climbing this ladder to inspect, maintain and operate the centrifuge is tiring.
This also makes it difficult to carry parts or other materials up this ladder. To enable
good operation of these critical wastewater pretreatment units, it is strongly
recommended that the existing ladder be replaced by a set of stairs.
D. Dissolved Air Flotation
Only minor operational changes are contemplated for the DAFs. Because wastewater
will enter the DAF on a near-continuous basis with two production shifts and a sanitation
shift, the surface skimmers and bottom solids removal systems should be operated
continuously during production days to remove the skimmings and bottom solids as they
accumulate. Near-continuous removal minimizes biological degradation of these
materials and the resulting loss of soluble portions of these materials into the wastewater.
To minimize water in the DAF skimmings and stirring up the surface of the DAFs, the
surface skimmers should be operated at their slowest speed.
E. Skimmings Handling
Currently each DAF surface skimmer is turned off when the skimmings hopper at the
inlet end is full. These hoppers are small and frequently limit operating time for the
surface skimmers. This also requires switching back and forth between the three small
skimmings hoppers to pump to the existing skimmings dewatering centrifuge. Since
skimmings in the three different skimmings hoppers may be somewhat different in
character, this complicates optimizing the polymer dosage and operation of the
dewatering centrifuge. For these reasons, continually pumping skimmings from each of
the existing hoppers with new air-operated, double-diaphragm pumps equipped with flap
valves is being considered. The flow rate for these pumps is easily adjusted and they can
N:\industri\MapleLeaf\MLP @ Brandon-Exp Bio Treatment.doc 17 May 2003
even run dry at times. As part of this change, skimmings would then be pumped into a
large, new stainless steel or glass-lined steel skimmings tank equipped with a mixer to
keep the contents homogenized. The existing progressing cavity skimmings pumps
would be relocated to pump the skimmings from this new tank for further processing.
F. Pretreatment Sanitation
To encourage good sanitation in pretreatment, minimize odors, and aid in maintenance;
consideration is being given to: 1) providing a larger hot water heater, 2) installing an in-
line steam blending station, or 3) running a sanitation line from the packing plant to
several locations in pretreatment. If this addition is implemented, one outlet will be
located on the platform for the screens and centrifuge.
Much of the odor in the pretreatment building was due to old grease caked on the DAF
units turning rancid. Therefore grease accumulations along the top edges, and other
areas, of the DAF tanks will be hosed off once each day, but it is not necessary to hose
off the skimmers each day. However the DAF tanks routinely be drained, thoroughly
cleaned, and inspected. To simplify this effort, a new drain line with valve was recently
installed from the bottom of each tank to the effluent line.
G. Estimated Pretreated Effluent Characteristics
While the pretreatment modifications discussed previously would offer many benefits,
including reduced maintenance and higher-quality recovered materials, they will have
minimal impact on the pretreated effluent characteristics. Therefore with, or without,
these pretreatment improvements, pretreated effluent characteristics are estimated as
follows:

N:\industri\MapleLeaf\MLP @ Brandon-Exp Bio Treatment.doc 18 May 2003
Flow
Kill Days/Week 5 5.5 6Average Production Days, m3/day Monday - Thursday 7665 7665 7665 Fridays 7325 7665 7665 Saturdays, m3/day 1000 4508 7325 Sundays, m3/day 1250 1250 1250 Total Weekly, m3/wk 40,235 44,083 46,900 Peak hourly flow, m3/minute 6.5 6.5 6.5 Instantaneous peak, m3/minute 10.5 10.5 10.5
CBOD5
Kill and Cut = 6.6 kg/1,000 kg LWK/day x 2,160,000 kg/day
= 14,256 kg/day
Stomach Processing = 400 kg/day
Inedible Rendering = 630 kg/day
Total = 15,286 kg/day (1995 mg/l @ 7665 m3/day)
COD
Kill and Cut = 12.2 kg/1,000 kg LWK/day x 2,160,000 kg/day
= 26,350 kg/day
Stomach Processing = 800 kg/day
Inedible Rendering = 1220 kg/day
Total = 28,370 kg/day (3700 mg/l @ 7665 m3/day)
Suspended Solids (TSS)
Kill and Cut = 3.8 kg/1,000 kg LWK/day x 2,160,000 kg/day
= 8208 kg/day
Stomach Processing = 300 kg/day
Inedible Rendering = 400 kg/day
Total = 8908 kg/day (1160 mg/l @ 7665 m3/day)
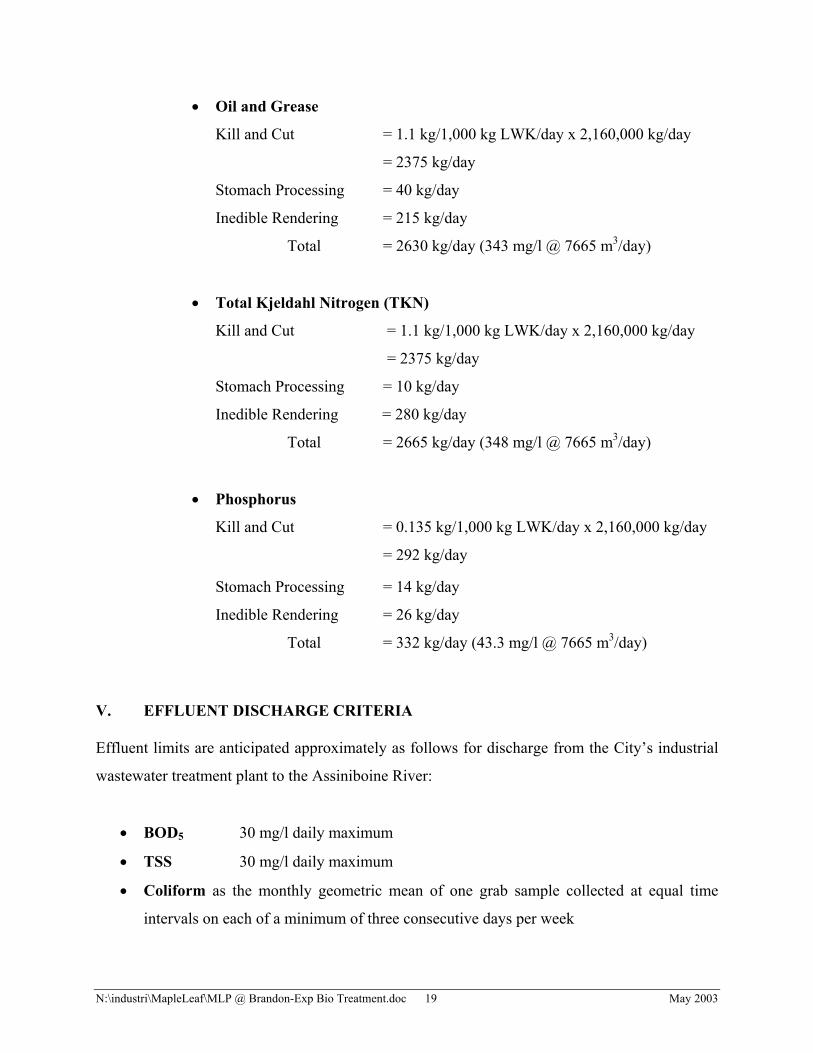
N:\industri\MapleLeaf\MLP @ Brandon-Exp Bio Treatment.doc 19 May 2003
Oil and Grease
Kill and Cut = 1.1 kg/1,000 kg LWK/day x 2,160,000 kg/day
= 2375 kg/day
Stomach Processing = 40 kg/day
Inedible Rendering = 215 kg/day
Total = 2630 kg/day (343 mg/l @ 7665 m3/day)
Total Kjeldahl Nitrogen (TKN)
Kill and Cut = 1.1 kg/1,000 kg LWK/day x 2,160,000 kg/day
= 2375 kg/day
Stomach Processing = 10 kg/day
Inedible Rendering = 280 kg/day
Total = 2665 kg/day (348 mg/l @ 7665 m3/day)
Phosphorus
Kill and Cut = 0.135 kg/1,000 kg LWK/day x 2,160,000 kg/day
= 292 kg/day
Stomach Processing = 14 kg/day
Inedible Rendering = 26 kg/day
Total = 332 kg/day (43.3 mg/l @ 7665 m3/day)
V. EFFLUENT DISCHARGE CRITERIA
Effluent limits are anticipated approximately as follows for discharge from the City’s industrial
wastewater treatment plant to the Assiniboine River:
BOD5 30 mg/l daily maximum
TSS 30 mg/l daily maximum
Coliform as the monthly geometric mean of one grab sample collected at equal time
intervals on each of a minimum of three consecutive days per week
N:\industri\MapleLeaf\MLP @ Brandon-Exp Bio Treatment.doc 20 May 2003
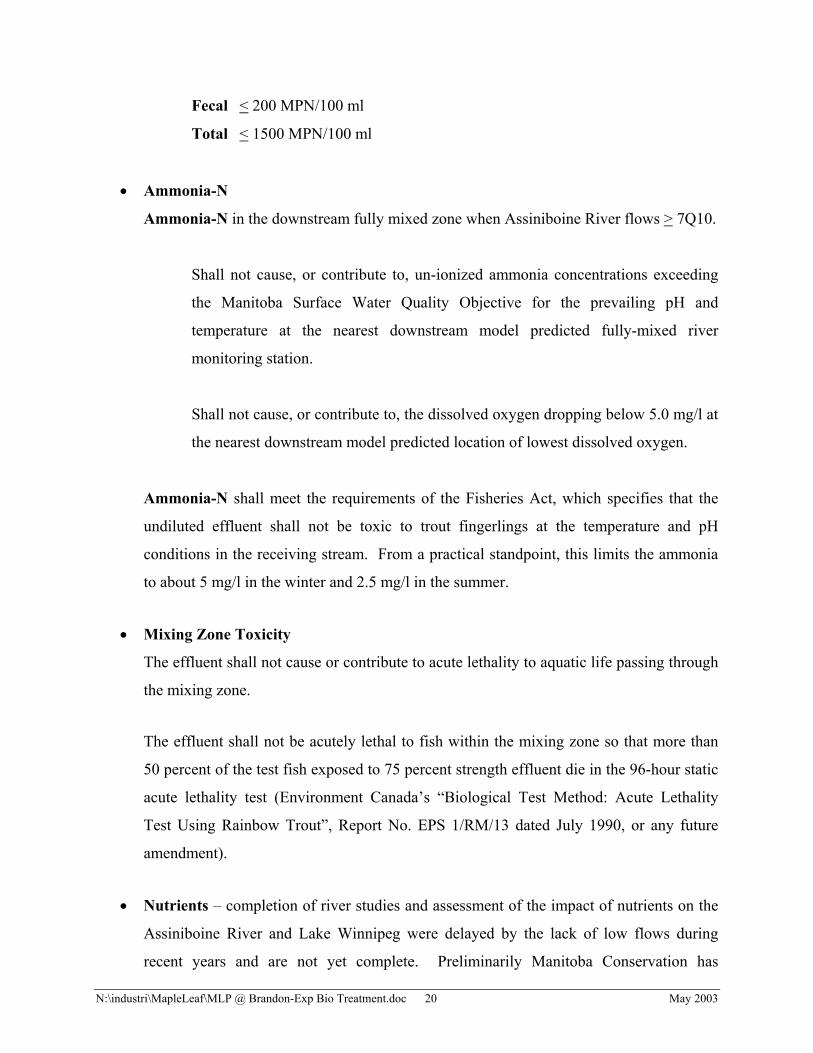
Fecal < 200 MPN/100 ml
Total < 1500 MPN/100 ml
Ammonia-N
Ammonia-N in the downstream fully mixed zone when Assiniboine River flows > 7Q10.
Shall not cause, or contribute to, un-ionized ammonia concentrations exceeding
the Manitoba Surface Water Quality Objective for the prevailing pH and
temperature at the nearest downstream model predicted fully-mixed river
monitoring station.
Shall not cause, or contribute to, the dissolved oxygen dropping below 5.0 mg/l at
the nearest downstream model predicted location of lowest dissolved oxygen.
Ammonia-N shall meet the requirements of the Fisheries Act, which specifies that the
undiluted effluent shall not be toxic to trout fingerlings at the temperature and pH
conditions in the receiving stream. From a practical standpoint, this limits the ammonia
to about 5 mg/l in the winter and 2.5 mg/l in the summer.
Mixing Zone Toxicity
The effluent shall not cause or contribute to acute lethality to aquatic life passing through
the mixing zone.
The effluent shall not be acutely lethal to fish within the mixing zone so that more than
50 percent of the test fish exposed to 75 percent strength effluent die in the 96-hour static
acute lethality test (Environment Canada’s “Biological Test Method: Acute Lethality
Test Using Rainbow Trout”, Report No. EPS 1/RM/13 dated July 1990, or any future
amendment).
Nutrients – completion of river studies and assessment of the impact of nutrients on the
Assiniboine River and Lake Winnipeg were delayed by the lack of low flows during
recent years and are not yet complete. Preliminarily Manitoba Conservation has
N:\industri\MapleLeaf\MLP @ Brandon-Exp Bio Treatment.doc 21 May 2003
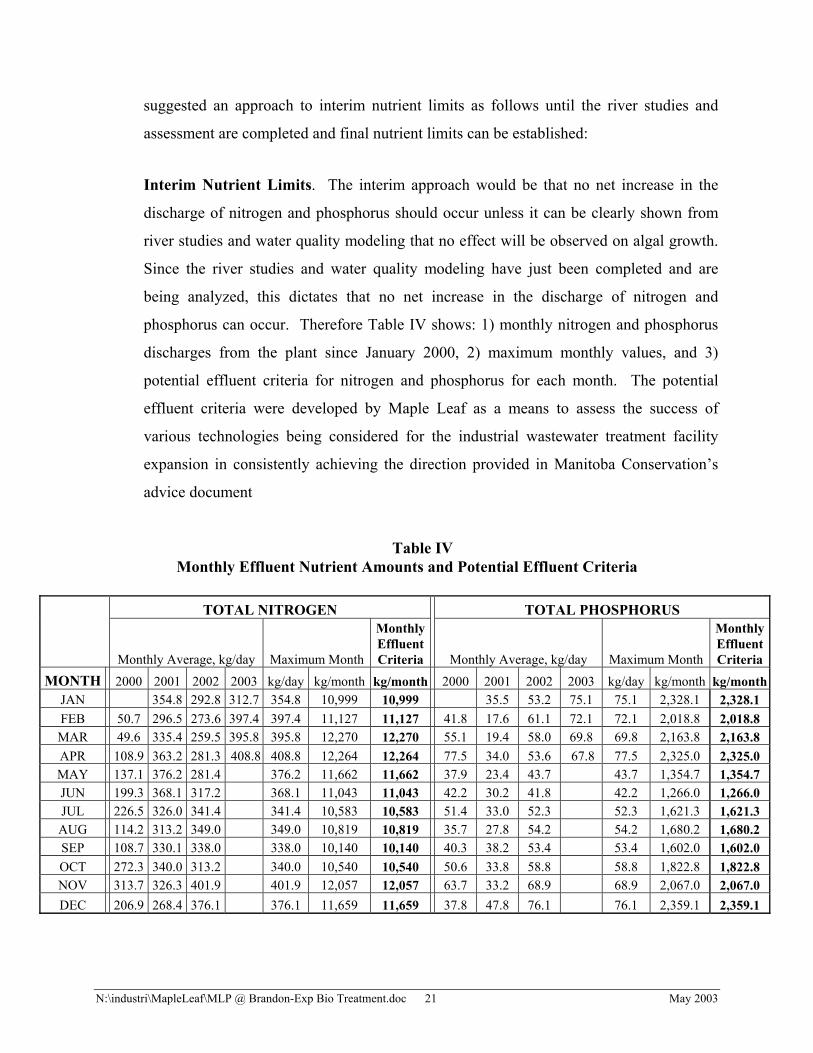
suggested an approach to interim nutrient limits as follows until the river studies and
assessment are completed and final nutrient limits can be established:
Interim Nutrient Limits. The interim approach would be that no net increase in the
discharge of nitrogen and phosphorus should occur unless it can be clearly shown from
river studies and water quality modeling that no effect will be observed on algal growth.
Since the river studies and water quality modeling have just been completed and are
being analyzed, this dictates that no net increase in the discharge of nitrogen and
phosphorus can occur. Therefore Table IV shows: 1) monthly nitrogen and phosphorus
discharges from the plant since January 2000, 2) maximum monthly values, and 3)
potential effluent criteria for nitrogen and phosphorus for each month. The potential
effluent criteria were developed by Maple Leaf as a means to assess the success of
various technologies being considered for the industrial wastewater treatment facility
expansion in consistently achieving the direction provided in Manitoba Conservation’s
advice document
Table IV Monthly Effluent Nutrient Amounts and Potential Effluent Criteria
TOTAL NITROGEN TOTAL PHOSPHORUS
Monthly Average, kg/day Maximum Month
MonthlyEffluentCriteria Monthly Average, kg/day Maximum Month
MonthlyEffluentCriteria
MONTH 2000 2001 2002 2003 kg/day kg/month kg/month 2000 2001 2002 2003 kg/day kg/month kg/monthJAN 354.8 292.8 312.7 354.8 10,999 10,999 35.5 53.2 75.1 75.1 2,328.1 2,328.1FEB 50.7 296.5 273.6 397.4 397.4 11,127 11,127 41.8 17.6 61.1 72.1 72.1 2,018.8 2,018.8MAR 49.6 335.4 259.5 395.8 395.8 12,270 12,270 55.1 19.4 58.0 69.8 69.8 2,163.8 2,163.8APR 108.9 363.2 281.3 408.8 408.8 12,264 12,264 77.5 34.0 53.6 67.8 77.5 2,325.0 2,325.0MAY 137.1 376.2 281.4 376.2 11,662 11,662 37.9 23.4 43.7 43.7 1,354.7 1,354.7JUN 199.3 368.1 317.2 368.1 11,043 11,043 42.2 30.2 41.8 42.2 1,266.0 1,266.0JUL 226.5 326.0 341.4 341.4 10,583 10,583 51.4 33.0 52.3 52.3 1,621.3 1,621.3AUG 114.2 313.2 349.0 349.0 10,819 10,819 35.7 27.8 54.2 54.2 1,680.2 1,680.2SEP 108.7 330.1 338.0 338.0 10,140 10,140 40.3 38.2 53.4 53.4 1,602.0 1,602.0OCT 272.3 340.0 313.2 340.0 10,540 10,540 50.6 33.8 58.8 58.8 1,822.8 1,822.8NOV 313.7 326.3 401.9 401.9 12,057 12,057 63.7 33.2 68.9 68.9 2,067.0 2,067.0DEC 206.9 268.4 376.1 376.1 11,659 11,659 37.8 47.8 76.1 76.1 2,359.1 2,359.1
N:\industri\MapleLeaf\MLP @ Brandon-Exp Bio Treatment.doc 22 May 2003
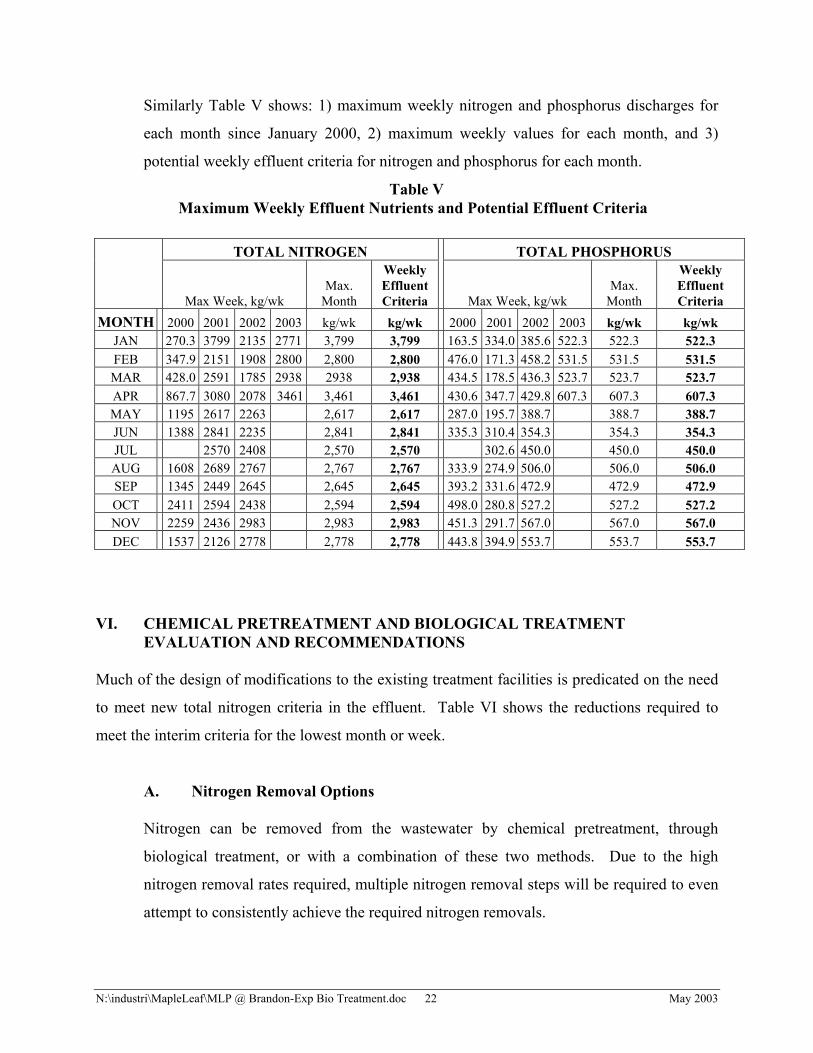
Similarly Table V shows: 1) maximum weekly nitrogen and phosphorus discharges for
each month since January 2000, 2) maximum weekly values for each month, and 3)
potential weekly effluent criteria for nitrogen and phosphorus for each month.
Table V Maximum Weekly Effluent Nutrients and Potential Effluent Criteria
TOTAL NITROGEN TOTAL PHOSPHORUS
Max Week, kg/wk Max.
Month
WeeklyEffluentCriteria Max Week, kg/wk
Max. Month
WeeklyEffluentCriteria
MONTH 2000 2001 2002 2003 kg/wk kg/wk 2000 2001 2002 2003 kg/wk kg/wk JAN 270.3 3799 2135 2771 3,799 3,799 163.5 334.0 385.6 522.3 522.3 522.3FEB 347.9 2151 1908 2800 2,800 2,800 476.0 171.3 458.2 531.5 531.5 531.5MAR 428.0 2591 1785 2938 2938 2,938 434.5 178.5 436.3 523.7 523.7 523.7APR 867.7 3080 2078 3461 3,461 3,461 430.6 347.7 429.8 607.3 607.3 607.3MAY 1195 2617 2263 2,617 2,617 287.0 195.7 388.7 388.7 388.7JUN 1388 2841 2235 2,841 2,841 335.3 310.4 354.3 354.3 354.3JUL 2570 2408 2,570 2,570 302.6 450.0 450.0 450.0AUG 1608 2689 2767 2,767 2,767 333.9 274.9 506.0 506.0 506.0SEP 1345 2449 2645 2,645 2,645 393.2 331.6 472.9 472.9 472.9OCT 2411 2594 2438 2,594 2,594 498.0 280.8 527.2 527.2 527.2NOV 2259 2436 2983 2,983 2,983 451.3 291.7 567.0 567.0 567.0DEC 1537 2126 2778 2,778 2,778 443.8 394.9 553.7 553.7 553.7
VI. CHEMICAL PRETREATMENT AND BIOLOGICAL TREATMENT EVALUATION AND RECOMMENDATIONS
Much of the design of modifications to the existing treatment facilities is predicated on the need
to meet new total nitrogen criteria in the effluent. Table VI shows the reductions required to
meet the interim criteria for the lowest month or week.
A. Nitrogen Removal Options
Nitrogen can be removed from the wastewater by chemical pretreatment, through
biological treatment, or with a combination of these two methods. Due to the high
nitrogen removal rates required, multiple nitrogen removal steps will be required to even
attempt to consistently achieve the required nitrogen removals.
N:\industri\MapleLeaf\MLP @ Brandon-Exp Bio Treatment.doc 23 May 2003
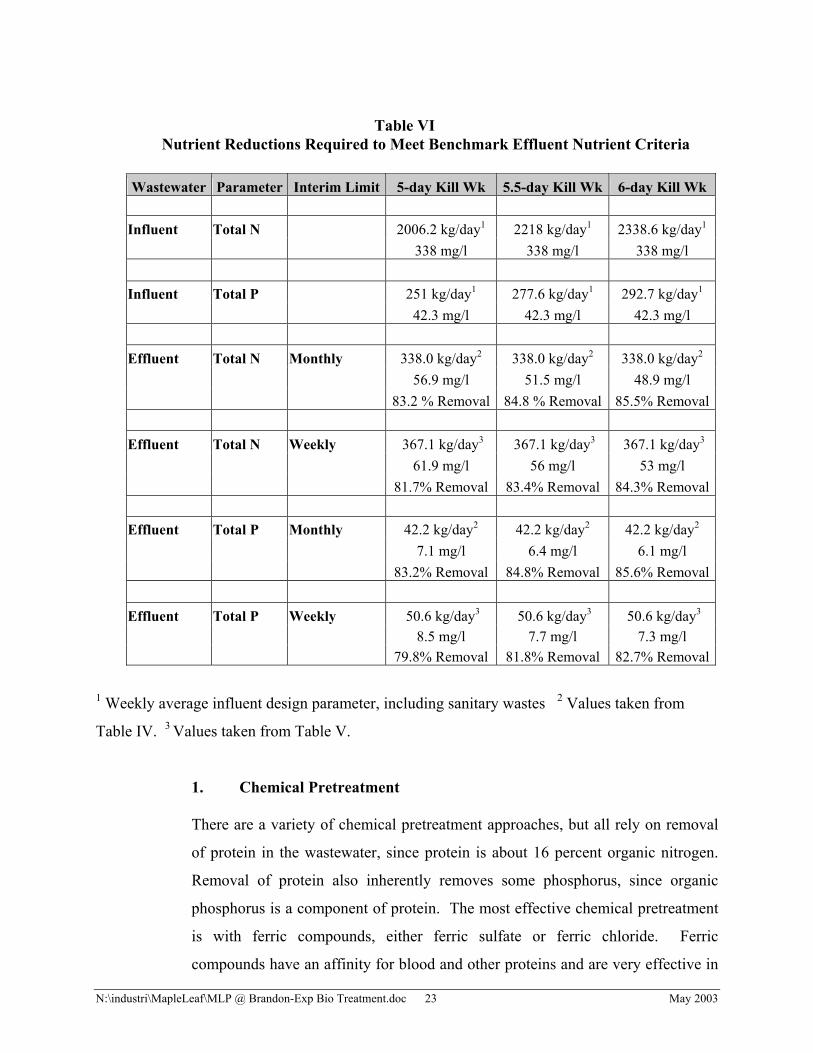
Table VI Nutrient Reductions Required to Meet Benchmark Effluent Nutrient Criteria
Wastewater Parameter Interim Limit 5-day Kill Wk 5.5-day Kill Wk 6-day Kill Wk
Influent Total N 2006.2 kg/day1 2218 kg/day1 2338.6 kg/day1
338 mg/l 338 mg/l 338 mg/l
Influent Total P 251 kg/day1 277.6 kg/day1 292.7 kg/day1
42.3 mg/l 42.3 mg/l 42.3 mg/l
Effluent Total N Monthly 338.0 kg/day2 338.0 kg/day2 338.0 kg/day2
56.9 mg/l 51.5 mg/l 48.9 mg/l 83.2 % Removal 84.8 % Removal 85.5% Removal
Effluent Total N Weekly 367.1 kg/day3 367.1 kg/day3 367.1 kg/day3
61.9 mg/l 56 mg/l 53 mg/l 81.7% Removal 83.4% Removal 84.3% Removal
Effluent Total P Monthly 42.2 kg/day2 42.2 kg/day2 42.2 kg/day2
7.1 mg/l 6.4 mg/l 6.1 mg/l 83.2% Removal 84.8% Removal 85.6% Removal Effluent Total P Weekly 50.6 kg/day3 50.6 kg/day3 50.6 kg/day3
8.5 mg/l 7.7 mg/l 7.3 mg/l 79.8% Removal 81.8% Removal 82.7% Removal
1 Weekly average influent design parameter, including sanitary wastes 2 Values taken from
Table IV. 3 Values taken from Table V.
1. Chemical Pretreatment
There are a variety of chemical pretreatment approaches, but all rely on removal
of protein in the wastewater, since protein is about 16 percent organic nitrogen.
Removal of protein also inherently removes some phosphorus, since organic
phosphorus is a component of protein. The most effective chemical pretreatment
is with ferric compounds, either ferric sulfate or ferric chloride. Ferric
compounds have an affinity for blood and other proteins and are very effective in
N:\industri\MapleLeaf\MLP @ Brandon-Exp Bio Treatment.doc 24 May 2003
their removal. It is also effective in removing phosphorus, both organic
phosphorus in the proteins, as well as, inorganic phosphorus. Coagulation with
ferric is usually best at a pH around 5.8. After adding ferric for coagulation of the
proteins, anionic polymer is added for flocculation of the coagulated solids.
While ferric is effective, it also creates a chemically-contaminated sludge that
renderers will not take because it darkens their grease and meal and increases the
acid content of the grease. This ferric-laden sludge can be land applied, but this
necessitates dewatering, stabilization and storage during the portion of the year
when land application is not feasible.
Alternatives to the use of ferric compounds consist of a tri-polymer system or a
system employing acidulation to the iso-electric point (point of least solubility) of
the proteins. Both of these systems are capable of removing organic nitrogen and
phosphorus, but not inorganic phosphorus. With the tri-polymer system, about
75-100 mg/l of a polymer named poly-diallyl-dimethyl ammonium chloride is
added first. Next 3-5 mg/l of anionic polymer are added and this is followed by
about the same amount of cationic polymer. GRAS (generally recognized as safe)
polymers can be used with the tri-polymer system. Due to the 75-100 mg/l of
poly-diallyl-dimethyl ammonium chloride polymer used with this system, the
sludge goes through a glue-like phase as it is dried, so many renderers are
unwilling to take this material.
With acidulation, the pH of the wastewater is lowered to the iso-electric point,
which is the point of lowest solubility of the proteins. In packing plant
wastewater, the iso-electric point is typically around a pH of 4.5. At this point,
many of the proteins come out of solution and are flocculated with GRAS
polymer for removal. After acidulation to the iso-electric point, the pH of the
wastewater must be neutralized before subsequent biological treatment.
Facilities for chemical pretreatment are all nearly the same regardless of whether
ferric, a tri-polymer system, or acidulation is used. In all cases some degree of
equalization is preferable, followed by addition of chemicals for coagulation of
N:\industri\MapleLeaf\MLP @ Brandon-Exp Bio Treatment.doc 25 May 2003
the proteins, then flocculation with polymer and finally removal of the flocculated
protein in a DAF system. For ferric or acidulation, the DAF system should be
corrosion resistant.
2. Biological Treatment
With biological treatment the two main mechanisms for nitrogen removal are: 1)
nitrogen incorporated into the sludge and 2) nitrification/denitrification. Sludge
that is wasted from the subsequent activated sludge system and then sent back to
the anaerobic lagoon where it will settle, thicken and digest will contain about
seven percent nitrogen when it is removed from the anaerobic lagoon along with
anaerobic sludge formed by anaerobic treatment of the anaerobic influent
wastewater. However, the bulk of the nitrogen removal must occur through
nitrification/denitrification. With nitrification/denitrification, ammonia is first
nitrified (oxidized) to nitrates/nitrites, which are then denitrified in an anoxic
(without dissolved oxygen) environment to nitrogen gas that is released to the
atmosphere.
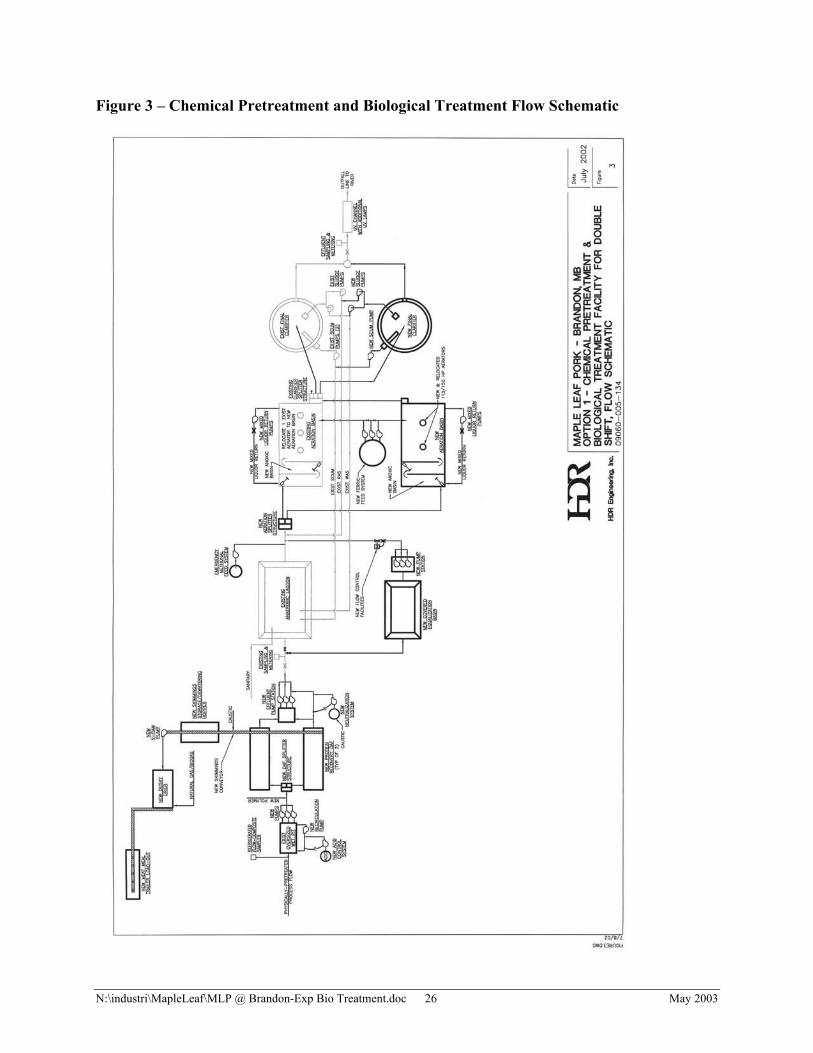
B. Option 1 – Chemical Pretreatment and Biological Treatment
For this option, chemical pretreatment for protein removal will be provided ahead of
biological treatment employing nitrification/denitrification. It is assumed acidulation to
the iso-electric point will be utilized for chemical pretreatment because the DAF
skimmings can be dried for sale as meat meal, which serves to offset the high chemical
costs and eliminates chemical sludge disposal. Alternatively the sludge is acceptable to
be sent for rendering, provided appropriate sludge characteristics can be attained
consistently. Figure 3 shows the configuration of this option.
N:\industri\MapleLeaf\MLP @ Brandon-Exp Bio Treatment.doc 26 May 2003
Figure 3 – Chemical Pretreatment and Biological Treatment Flow Schematic
N:\industri\MapleLeaf\MLP @ Brandon-Exp Bio Treatment.doc 27 May 2003
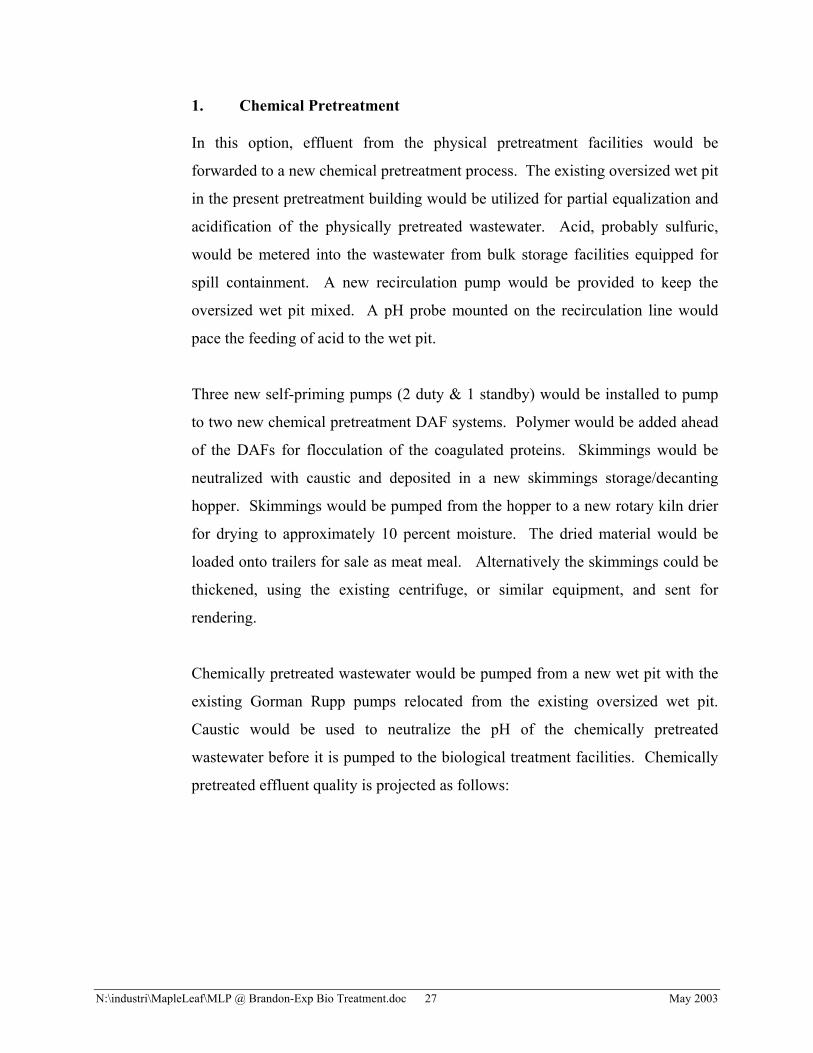
1. Chemical Pretreatment
In this option, effluent from the physical pretreatment facilities would be
forwarded to a new chemical pretreatment process. The existing oversized wet pit
in the present pretreatment building would be utilized for partial equalization and
acidification of the physically pretreated wastewater. Acid, probably sulfuric,
would be metered into the wastewater from bulk storage facilities equipped for
spill containment. A new recirculation pump would be provided to keep the
oversized wet pit mixed. A pH probe mounted on the recirculation line would
pace the feeding of acid to the wet pit.
Three new self-priming pumps (2 duty & 1 standby) would be installed to pump
to two new chemical pretreatment DAF systems. Polymer would be added ahead
of the DAFs for flocculation of the coagulated proteins. Skimmings would be
neutralized with caustic and deposited in a new skimmings storage/decanting
hopper. Skimmings would be pumped from the hopper to a new rotary kiln drier
for drying to approximately 10 percent moisture. The dried material would be
loaded onto trailers for sale as meat meal. Alternatively the skimmings could be
thickened, using the existing centrifuge, or similar equipment, and sent for
rendering.
Chemically pretreated wastewater would be pumped from a new wet pit with the
existing Gorman Rupp pumps relocated from the existing oversized wet pit.
Caustic would be used to neutralize the pH of the chemically pretreated
wastewater before it is pumped to the biological treatment facilities. Chemically
pretreated effluent quality is projected as follows:
N:\industri\MapleLeaf\MLP @ Brandon-Exp Bio Treatment.doc 28 May 2003
CHEMICALLY-PRETREATED WASTEWATER INFLUENT
(effluent from physical
pretreatment)
REMOVAL%
EFFLUENT(influent to
the biological system)
Flow, m3/day 7665 0 7665
CBOD5 mg/l 1995 65 700 kg/day 15,286 65 5,350
COD mg/l 3700 65 1300 kg/day 28,370 65 9,930
TSS mg/l 1160 91.4 100 kg/day 8,908 91.4 766
Oil and Grease mg/l 343 >85 <50 kg/day 2630 >85 <395 TKN
mg/l 348 55 157 kg/day 2665 55 1200
Phosphorus mg/l 43.3 40 26 kg/day 332 40 200
2. New Equalization Basin
The projected CBOD5:TKN ratio of the chemically pretreated wastewater, at
4.46:1, is well suited for denitrification in the subsequent anoxic basins.
Therefore no treatment of the CBOD5 would be necessary, or even desirable,
ahead of the anoxic basins. However it would be necessary to equalize the
chemically pretreated wastewater over the seven-day week to provide a steady
feed to the anoxic basins, but to do so without any biological treatment.
Unfortunately the existing anaerobic lagoon is too large for this flow equalization
as it would continue to anaerobically treat the CBOD5 in the wastewater.
Therefore a new small equalization basin would be constructed to equalize the
flow over the seven-day week. This anaerobic equalization basin would be sized
for five production days/wk as follows:
N:\industri\MapleLeaf\MLP @ Brandon-Exp Bio Treatment.doc 29 May 2003
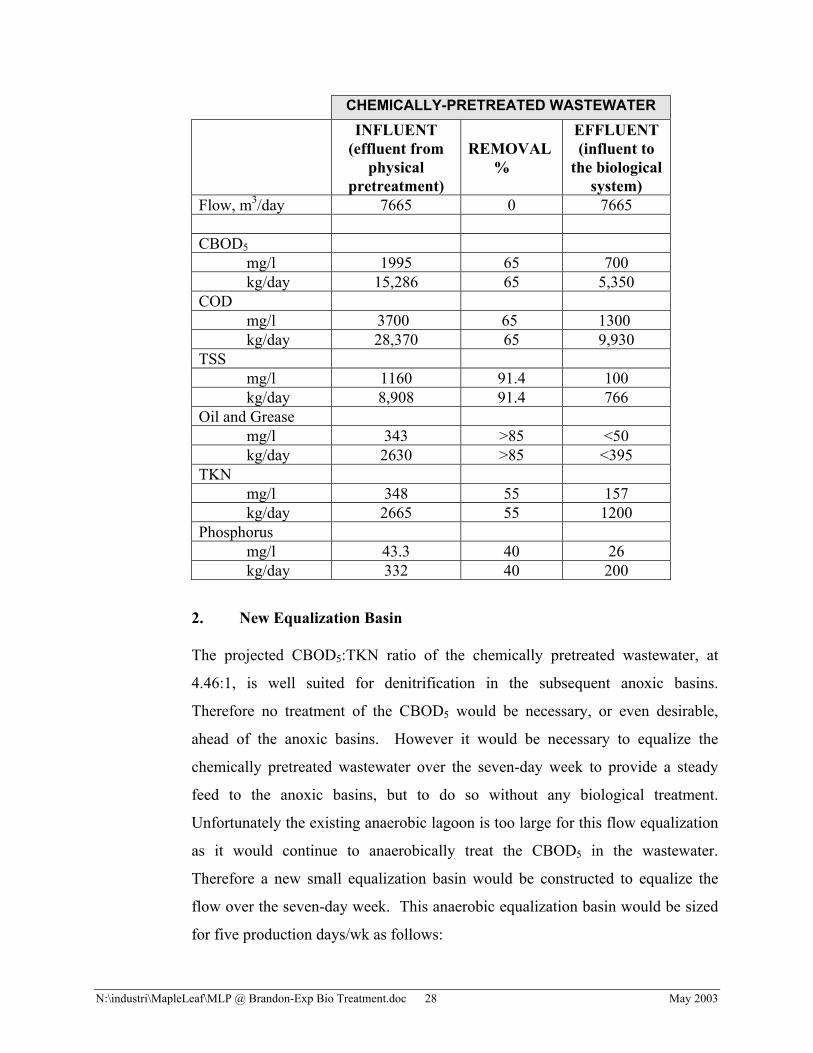
Kill Days/Wk 5
Average Production Days Monday - Thursday 7,665 m3/day Friday 7,325 m3/dayMinimum Saturday & Sunday Flows Combined
750 m3
Total Weekly Flow 38,735 m3/wkEqualized Weekly Flow Rate 5,533.5 m3/day
The design volume for the new equalization basin would be 10,317 m3 [5,533.5
m3/day x 2 days (outflow) –750 m3 (inflow)]. To ensure that no treatment, either
aerobic or anaerobic, of this stored flow occurs so the CBOD5 is available for
denitrification, this lagoon would be covered and gradually be filled during the
production week with pretreated effluent and then emptied on the weekends. By
keeping this flow in an anaerobic state, but emptying the storage lagoon each
week, insufficient anaerobic treatment microorganisms would accumulate to
achieve any significant biological treatment of the CBOD5. Because anaerobic
treatment is not wanted in this basin, it would no longer be necessary to inject
steam into the pretreated effluent.
This basin would be constructed somewhat similar to the existing covered
anaerobic lagoon using lagoon-type construction with a double HDPE liner with
leak detection provisions and an HDPE cover. The cover would be provided to 1)
maintain anaerobic conditions so aerobic treatment does not occur, 2) to minimize
odors from the lagoon, and 3) to reduce heat loss during the winter. To minimize
the amount of borrow material necessary to construct this new earthen lagoon,
however, interior sideslopes would be around 2.5:1, depending on soil conditions,
and exterior sideslopes will be 3:1.
Sanitary sewage and WAS would continue to go to the existing anaerobic lagoon.
A new pump station would be constructed to pump flow from the new
equalization basin, as well as, supernatant from the anaerobic lagoon. The
anaerobic effluent flow meter would be relocated and used to meter this pumped
N:\industri\MapleLeaf\MLP @ Brandon-Exp Bio Treatment.doc 30 May 2003
flow. A new rate controller would be used to modulate a new throttling valve to
maintain the equalized flow at a preset rate.
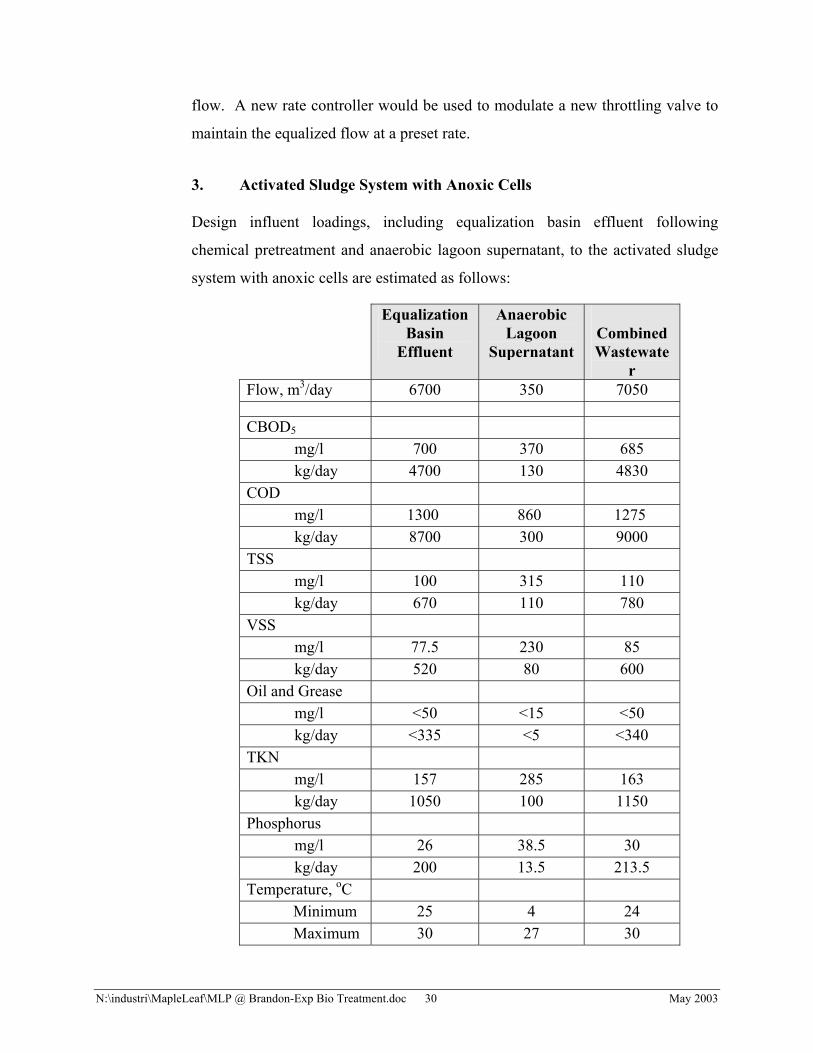
3. Activated Sludge System with Anoxic Cells
Design influent loadings, including equalization basin effluent following
chemical pretreatment and anaerobic lagoon supernatant, to the activated sludge
system with anoxic cells are estimated as follows:
Equalization Basin
Effluent
AnaerobicLagoon
SupernatantCombinedWastewate
rFlow, m3/day 6700 350 7050
CBOD5 mg/l 700 370 685 kg/day 4700 130 4830
COD mg/l 1300 860 1275 kg/day 8700 300 9000
TSS mg/l 100 315 110 kg/day 670 110 780
VSS mg/l 77.5 230 85 kg/day 520 80 600
Oil and Grease mg/l <50 <15 <50 kg/day <335 <5 <340 TKN
mg/l 157 285 163 kg/day 1050 100 1150
Phosphorus mg/l 26 38.5 30 kg/day 200 13.5 213.5
Temperature, oC Minimum 25 4 24 Maximum 30 27 30
N:\industri\MapleLeaf\MLP @ Brandon-Exp Bio Treatment.doc 31 May 2003
To keep loadings at reasonable levels, a second parallel train consisting of an
anoxic basin, an aeration basin, a final clarifier and sludge and scum pumping
facilities would be added. In general, each of these new units would be similar to
the existing units. A new splitter structure would be constructed ahead of the
anoxic basins.
With the new aeration basin, it would only be necessary to maintain mixed liquor
suspended solids levels around 2800 mg/l to provide a 13.5-day mean cell
residence time which results in good nitrification. These concentrations are well
below a maximum recommended value of 5000 mg/l. The oxygen transfer rate in
the aeration basins would be around 46 mg/l/hr at field conditions, a conservative
design value. Slow-speed surface aerators totaling around 375 hp would be
required to maintain a minimum dissolved oxygen concentration in the aeration
basins. Currently there are three dual-speed, 115/150-hp surface aerators
mounted on the existing aeration basin. One of these slow-speed surface aerators
would be relocated from this existing aeration basin and installed on the new
aeration basin, along with an additional aerator.
To ensure sufficient alkalinity in both aeration basins, arrangements would be
made to feed lime slurry from the existing lime silo into the inlet of the new
aeration basin.
Since denitrification if far more important than before, flow metering and control
provisions would be added to the mixed liquor return pumping systems.
Due to biological uptake of phosphorus in the WAS, phosphorus in the effluent
would be projected to be around 21.5 mg/l, which is higher than the potential
effluent phosphorus criteria, as outlined in Section V. Therefore provisions
would be included to meter ferric chloride solution into the later portion of each
aeration basin. Bulk storage facilities with spill containment would be provided
for the ferric chloride.
N:\industri\MapleLeaf\MLP @ Brandon-Exp Bio Treatment.doc 32 May 2003
The ferric compound would combine with the orthophosphate to form ferric
phosphate. The ferric phosphate would accumulate in the mixed liquor and settle
out with the sludge in the final clarifiers and be wasted to the anaerobic lagoon
for thickening. This ferric phosphate would increase the inert fraction of the
MLSS in the aeration basins so that actual MLSS would be somewhat above the
2800 mg/l previously indicated.
Flow from both aeration basins would combine in the existing clarifier splitter
structure where the mixed liquor would be divided between two identical 22.5-m
(73.8-ft) diameter final clarifiers, the existing clarifier and a new one. At the
maximum equalized flow around 6800 m3/day, the surface overflow rate would be
a conservative 8.55 m3/day /m2 (210 gpd/ft2). At a maximum mixed liquor
suspended solids concentration of 5,000 mg/l and 100 percent recycle, the solids
loading rate would be 85.5 kg/m2/day (17.5 lb/ft2/day), which is considerably less
than the recommended maximum of 146.5 kg/m2/day (30 lb/ft2/day).
4. Sludge and Scum Handling Facilities
Duplicate RAS, WAS and scum pumps and meters would be installed in the
basement of the existing operations building. RAS would be pumped back to the
new aeration splitter structure. WAS and scum would be pumped to the existing
anaerobic lagoon for thickening, digestion and storage. Each fall this lagoon
would be projected to be less than half full when thickened and digested sludge is
land applied. An estimated 25,650 m3 of sludge containing approximately
830,000 kg of solids, 58,000 kg of nitrogen and 16,500 kg of plant-available
phosphorus is projected to be removed annually from the anaerobic lagoon and
sent to land application. The phosphorus bound with the ferric as ferric phosphate
would not be available to the crops.
5. Effluent Sampling, Metering, Disinfection, and Discharge Facilities
Before discharge the final effluent would continue to be sampled and metered
with the existing equipment. The baffle that currently blocks off a third of the
UV channel would be removed and two more moveable arms with Trojan 3000
N:\industri\MapleLeaf\MLP @ Brandon-Exp Bio Treatment.doc 33 May 2003
UV lamps could be installed to operate in conjunction with the four existing arms.
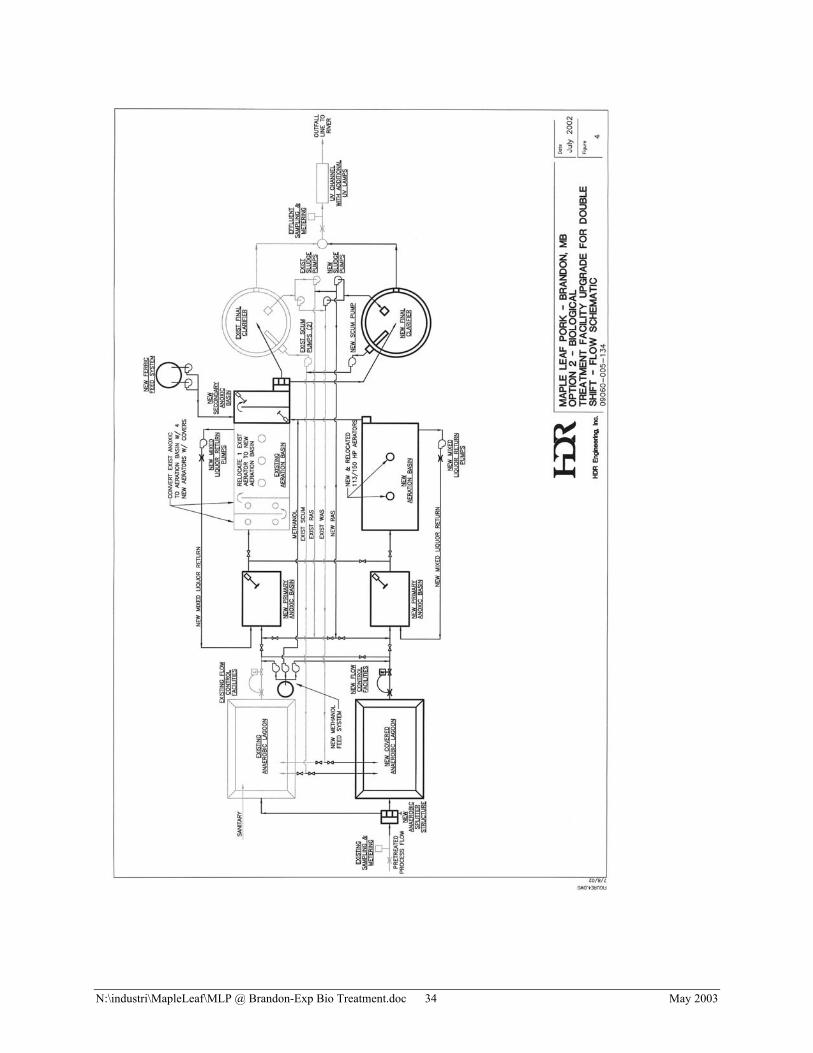
C. Option 2 – Biological Treatment
1. Anaerobic Treatment
This option evaluates expansion of the wastewater treatment plant to
accommodate the additional flow from a two-shift operation. Figure 4 provides
an overview of this option. In this option, a second covered anaerobic lagoon
would be added to reduce both the hydraulic and organic loading to the existing
anaerobic lagoon and to provide storage space for WAS from the activated sludge
system. This would result in a total maximum volume of 79,950 m3. In addition
to providing adequate volume for treatment of the influent, this would also
provide for flow equalization seven days/wk and storage of one year’s
accumulation of waste activated sludge (WAS) after it thickens to approximately
four percent solids. As discussed previously, the maximum flow equalization
volume required would be 10,317 m3. At the end of 12 months, settled and
digested sludge would occupy approximately 20,870 m3 of this anaerobic volume.
Therefore the minimum volume remaining for anaerobic treatment would be
48,763 m3. The maximum weekly influent CBOD5 would be 13,470 kg/day,
including sanitary sewage. This would result in an organic loading rate of 0.276
kg CBOD5/ m3/day (17.2 lb CBOD5/1000 ft3/day), a good design value. With a
weekly influent flow of 46,900 m3/wk of process wastewater and 1525 m3/wk of
sanitary sewage the detention time at the minimum treatment volume of 48,763
m3 would be 7 days, a conservative value.
An anaerobic splitter structure would be constructed after the existing sampling
and metering facilities to divide the influent equally between the two anaerobic
lagoons.
Figure 4 – Biological Treatment Flow Schematic
N:\industri\MapleLeaf\MLP @ Brandon-Exp Bio Treatment.doc 34 May 2003
N:\industri\MapleLeaf\MLP @ Brandon-Exp Bio Treatment.doc 35 May 2003
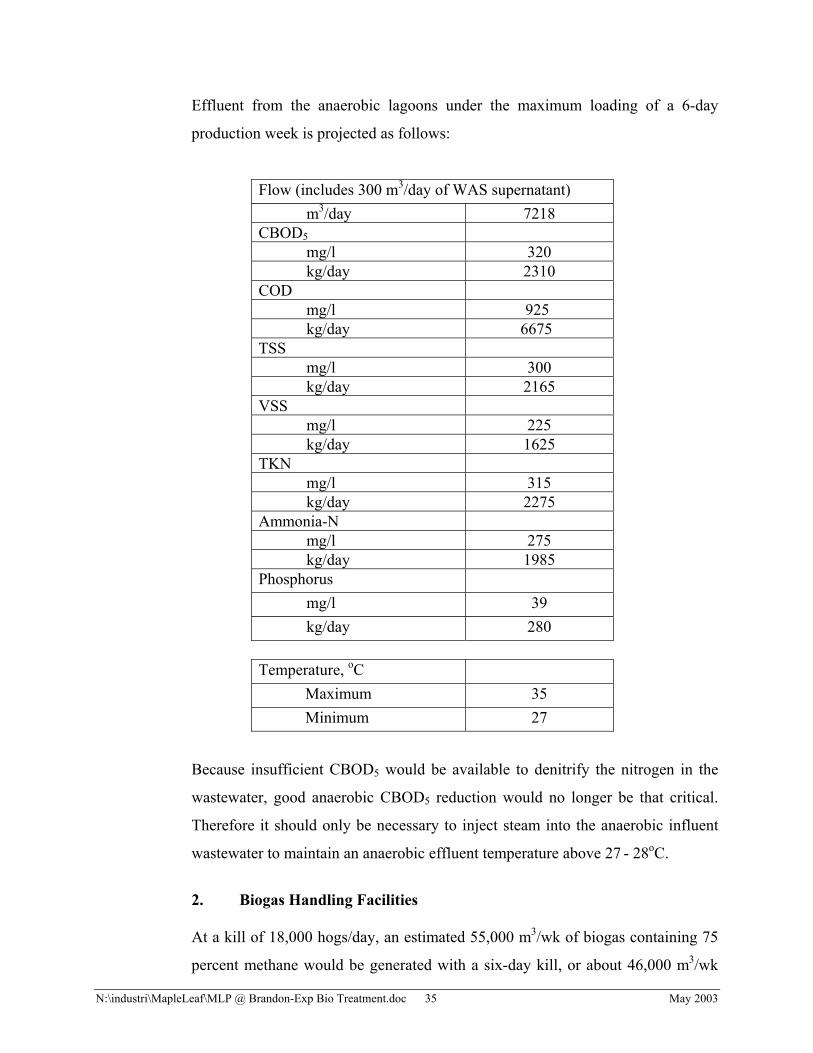
Effluent from the anaerobic lagoons under the maximum loading of a 6-day
production week is projected as follows:
Flow (includes 300 m3/day of WAS supernatant) m3/day 7218
CBOD5mg/l 320 kg/day 2310
CODmg/l 925 kg/day 6675
TSSmg/l 300 kg/day 2165
VSSmg/l 225 kg/day 1625
TKNmg/l 315 kg/day 2275
Ammonia-N mg/l 275 kg/day 1985
Phosphorus mg/l 39 kg/day 280
Temperature, oCMaximum 35 Minimum 27
Because insufficient CBOD5 would be available to denitrify the nitrogen in the
wastewater, good anaerobic CBOD5 reduction would no longer be that critical.
Therefore it should only be necessary to inject steam into the anaerobic influent
wastewater to maintain an anaerobic effluent temperature above 27 - 28oC.
2. Biogas Handling Facilities
At a kill of 18,000 hogs/day, an estimated 55,000 m3/wk of biogas containing 75
percent methane would be generated with a six-day kill, or about 46,000 m3/wk
N:\industri\MapleLeaf\MLP @ Brandon-Exp Bio Treatment.doc 36 May 2003
with a five-day kill. Assuming $0.36/m3 ($10.20/1000 ft3) of natural gas, the
biogas has a value around $720,000/yr. The existing biogas blowers, safety
equipment, emergency flare and biogas boiler are adequate for this volume,
although additional biogas safety equipment would be required at the new
anaerobic lagoon.
3. Activated Sludge System with Anoxic Cells
For good denitrification in the anoxic basins, it is necessary for the amount of
influent CBOD5 to be around 4.5 times the amount of nitrogen removed. With an
activated sludge system influent TKN of 2275 kg/day and a potential minimum
monthly effluent TN of 335 kg/day, a minimum of 1940 kg/day of nitrogen would
need to be removed. This would require about 8730 kg/day (1209 mg/l), of
CBOD5. At 2310 kg/day, or 320 mg/l, the CBOD5 in the anaerobic effluent
would be well below this amount. Therefore supplemental CBOD5 would be
required. This supplemental CBOD5 could possibly be supplemented by
bypassing a portion of the flow around the anaerobic lagoon. Approximately 35
percent of the pretreated process waste would need to be bypassed around the
anaerobic lagoon to provide adequate CBOD5. Past data reveals the COD (no
CBOD5 data is available) in wastewater bypassed from the southeast corner of the
anaerobic lagoon is only about 18.5 percent higher than anaerobic effluent COD.
This indicates that substantial treatment is occurring even as the flow short
circuits across the corner of the anaerobic lagoon.
Therefore, to maintain adequate CBOD5 in the bypassed flow, it would have to be
bypassed from the anaerobic influent piping. However this raises several
concerns. First, there would be a concern with the potential for grease or blood
spills causing problems with the anoxic basins and the activated sludge system.
Second, on weekends anaerobic influent flow would be insufficient in both flow
and CBOD5 to supply adequate oxygen demand in the anoxic basin to achieve the
required amount of denitrification. Therefore it would be necessary to store
wastewater from the production week to ensure adequate denitrification during
the weekend. It would be necessary to store a maximum of 4275 m3 with a five-
N:\industri\MapleLeaf\MLP @ Brandon-Exp Bio Treatment.doc 37 May 2003
day kill, while storage requirements for a six-day kill would be less at 2490 m3.
This storage would need to be done in an unaerated covered lagoon. Another
disadvantage of bypassing pretreated flow to the anoxic basin would be the
relatively-high level of TSS in this flow. As a result of these high solids levels,
more sludge would be made. For these reasons, methanol, or possibly ethanol if
reasonably priced, would be added as a source of CBOD5. Methanol is
reasonably priced and contains no nitrogen, phosphorus or TSS so sludge
production would be minimized from this source. About 5.5 m3/day of methanol
would be required, so the methanol will be handled in bulk with spill-prevention
provisions.
Two new anoxic basins would be constructed, each with a volume around 2500
m3. Each basin would be equipped with mixers totaling around 30-35 hp.
The existing anoxic basin would be converted to an aeration basin with the
addition of aeration. This basin, in addition to the existing aeration basin, would
provide a total aeration volume of 4608 m3. In addition to this volume, a second
aeration with a similar 4608-m3 volume would be added.
With the new aeration basin, the maximum mixed liquor suspended solids levels
would be around 4500 mg/l to provide a 13.5-day mean cell residence time that
would result in good nitrification. The maximum oxygen transfer rate in the
aeration basins would be less than 55 mg/l/hr. Slow-speed surface aerators
totaling around 585 hp would be required to maintain a minimum dissolved
oxygen concentration in the aeration basins under the worst conditions. One of
the 113/150-hp, slow-speed surface aerators would be relocated from the existing
aeration basin and installed on the new aeration basin, along with two additional
150-hp aerators. The relocated 115/150-hp aerator would be replaced with a new
150-hp aerator.
N:\industri\MapleLeaf\MLP @ Brandon-Exp Bio Treatment.doc 38 May 2003
To ensure sufficient alkalinity in both aeration basins, arrangements would be
made to feed lime slurry from the existing lime silo into the inlet of the new
aeration basin.
Flow metering and control provisions would be added to the mixed liquor return
pumping systems.
Due to the high nitrogen removals required, a secondary anoxic basin would be
constructed at the ends of the two aeration basins for further denitrification. This
concrete anoxic basin would receive flow from the two parallel aeration basins,
will contain around 2500 m3, and would be equipped with mixers totaling around
30-35 hp. Methanol would be fed from the common bulk storage tank to provide
a source of oxygen demand for the denitrification in this secondary anoxic basin.
Due to biological uptake of phosphorus in the WAS, phosphorus in the effluent
would be projected to be around 26 mg/l, which is higher than potential effluent
phosphorus criteria. Therefore provisions would be included to meter ferric
chloride solution into the secondary anoxic basin. Bulk storage facilities with
spill containment would be provided for the ferric chloride. The ferric would
combine with the orthophosphate to form ferric phosphate. The ferric phosphate
would accumulate in the mixed liquor and settle out with the sludge in the final
clarifiers and be wasted to the anaerobic lagoon for thickening. This ferric
phosphate would increase the inert fraction of the MLSS in the aeration basins so
that actual MLSS would be somewhat above the 4500 mg/l previously indicated.
Flow from the secondary anoxic basin would be reaerated in the existing clarifier
splitter structure where the mixed liquor would be divided between two identical
22.5-m (73.8-ft) diameter final clarifiers, the existing clarifier and a new one. At
the maximum equalized flow around 6918 m3/day, the surface overflow rate
would be a conservative 8.7 m3/day /m2 (215 gpd/ft2). At a maximum mixed
liquor suspended solids concentration of 5,000 mg/l and 100 percent recycle, the
solids loading rate would be 85.5 kg/m2/day (17.5 lb/ft2/day), which would be
N:\industri\MapleLeaf\MLP @ Brandon-Exp Bio Treatment.doc 39 May 2003
considerably less than the recommended maximum of 146.5 kg/m2/day (30
lb/ft2/day).
4. Sludge and Scum Handling Facilities
Duplicate RAS, WAS and scum pumps and meters would be installed in the
basement of the existing operations building. RAS would be pumped back to the
new aeration splitter structure. WAS and scum would be pumped to the existing
anaerobic lagoon for thickening, digestion and storage. Each fall this lagoon
would be less than half full when thickened and digested sludge is land applied.
5. Effluent Sampling, Metering, Disinfection, and Discharge Facilities
Before discharge the final effluent would continue to be sampled and metered
with the existing equipment. The baffle that currently blocks off a third of the
UV channel would be removed and two more moveable arms with Trojan 3000
UV lamps could be installed to operate in conjunction with the four existing arms.
6. Emergency Storage
If limits more stringent than the levels currently envisioned were imposed, it
would be necessary to add an emergency storage pond for times when the effluent
was not in compliance with discharge limits.
VII. SUMMARY AND CONCLUSIONS
The proposed treatment schemes are logical approaches to meeting the required interim criteria
for total nitrogen. As shown in Tables IV and V, these effluent nitrogen criteria are as low as
10,140 kg/month (338 kg/day) for the lowest month and 2570 kg/wk (367 kg/day) for the lowest
week. As illustrated in Table VI, this lowest monthly limit can necessitate removals as high as
85.5 percent, with weekly removals as high as 84.3 percent.
N:\industri\MapleLeaf\MLP @ Brandon-Exp Bio Treatment.doc 40 May 2003
Unfortunately there are no pork, or beef, plants that are required to consistently achieve these
high nitrogen removals either in Canada or the United States to act as a model for upgrading the
plant in Brandon. There is one pork plant in the central United States that reduces total nitrogen
from around 225-250 mg/l to about 60 mg/l (73-76% removal) in a single anoxic step with a
portion of the flow bypassed around the anaerobic treatment. However the effluent TN from this
plant is somewhat erratic due to variable operating conditions. Consequently it is impossible to
guarantee that effluent total nitrogen criteria would be consistently met with either of these two
approaches.
Due to the uncertainties of consistently meeting the potential effluent criteria as outlined in
Section V, Maple Leaf evaluated the Zenon system. Long-term pilot testing was conducted to
substantiate the ability of this system to consistently achieve the required nitrogen removal rates.
This testing was performed during the winter of 2002/2003 by Zenon and showed consistently-
high nitrogen removal rates. A separate report has been prepared by Zenon, based on the design
waste loads contained in this report. This report discusses the pilot testing and the ultimate
design derived from it. The Zenon system will incorporate: 1) an initial anoxic step for
denitrification, 2) aeration for nitrification and BOD reduction, 3) a secondary anoxic step for
additional denitrification, 4) secondary aeration, and 5) removal of very-high quality effluent
through Zenon’s ultrafiltration membrane system. If the Zenon system performs as indicated in
the report, and the pilot testing indicates it will, the total system should achieve the desired
effluent characteristics.


![Pandering and pork-barrel politics · pork / =∗ >/ (∗)+ >(=∗ ∗= =, ()= < ≥ ()+≥(. / /. / ∗ ∗ ()= ⎧ ⎪⎨ ⎪⎩ ()>) ()∈ ) (∗,)> . ≡ /)]](https://img.pdfslide.us/doc/110x75/5f953f35c33d70257c62d34e/pandering-and-pork-barrel-politics-pork-a-a-a-a-.jpg)


![Untitled 2 [stbistro.ca] · PULLED PORK ON A BUN Slow roasted marinated pork with our signature BBQ sauce on a brioche bun. 13.89 MAPLE BACON CRISPY CHICKEN WRAP Crispy chicken fingers](https://img.pdfslide.us/doc/110x75/600b9d942b6122323a6c8fe2/untitled-2-pulled-pork-on-a-bun-slow-roasted-marinated-pork-with-our-signature.jpg)