Embed Size (px)
Citation preview
Maple-Brown Abbott
Australia Plus Asia Trust
Annual Financial Report 30 June 2017
Maple-Brown Abbott Australia Plus Asia Trust
Annual Financial Report
Contents
Directors’ report 1
Lead Auditor’s Independence Declaration 4
Statement of Financial Position 5
Statement of Comprehensive Income 6
Statement of Changes in Equity 7
Statement of Cash Flows 8
Notes to and forming part of the financial statements 9
1 Summary of significant accounting policies 9
2 Net assets attributable to unitholders 13
3 Other expenses 14
4 Auditor’s remuneration 14
5 Distributions paid and payable 14
6 Related parties 15
7 Notes to the Statement of Cash Flows 16
8 Financial instruments 18
9 Interests in unconsolidated structured entities 24
10 Events subsequent to balance date 25
Directors’ declaration 26
Independent auditor’s report to the unitholders 27

1
Maple-Brown Abbott Australia Plus Asia Trust
Directors’ report
The directors of Maple-Brown Abbott Limited, the Responsible Entity of the Maple-Brown Abbott Australia Plus Asia Trust (the Trust), present their report together with the financial report of the Trust, for the year ended 30 June 2017 and the auditor’s report thereon.
Responsible Entity
Maple-Brown Abbott Limited is the Responsible Entity (AFSL No. 237296).
The Responsible Entity is the investment manager of the Trust. The names of the directors of the Responsible Entity are disclosed in note 6(b) to the financial statements.
The registered office and principal place of business of the Responsible Entity and the Trust is Level 31, 259 George Street, Sydney, NSW 2000.
Principal activities
The Trust invests in equity markets in the Australian and Asia region, excluding Japan and in accordance with the provisions of the Trust’s Constitution.
The Trust did not have any employees during the year.
There have been no significant changes in the nature of those activities during the year.
Results of operations
The Responsible Entity’s objective for the Trust is to outperform the S&P/ASX 300 Index (Total Returns) over rolling four year periods.
The Trust achieved a rolling four year annualised return of 7.7% p.a. (2016: 10.1% p.a.) after fees versus the relevant Benchmark return of 9.2% p.a. (2016: 11.1% p.a.).
A summary of the Trust’s annual performance after fees to 30 June is set out below:
2017
%
2016
%
2015
%
2014
%
2013
%
Total return* 19.0 (8.1) 6.0 16.1 29.9
S&P/ASX 300 Index (Total Returns) 13.8 0.9 5.6 17.3 21.9
* Total return is based on the movement in net asset value per unit plus distributions and is before tax and after all fees and charges. Imputation and foreign tax credits are not included in the performance figures.
2
Directors’ report (continued)
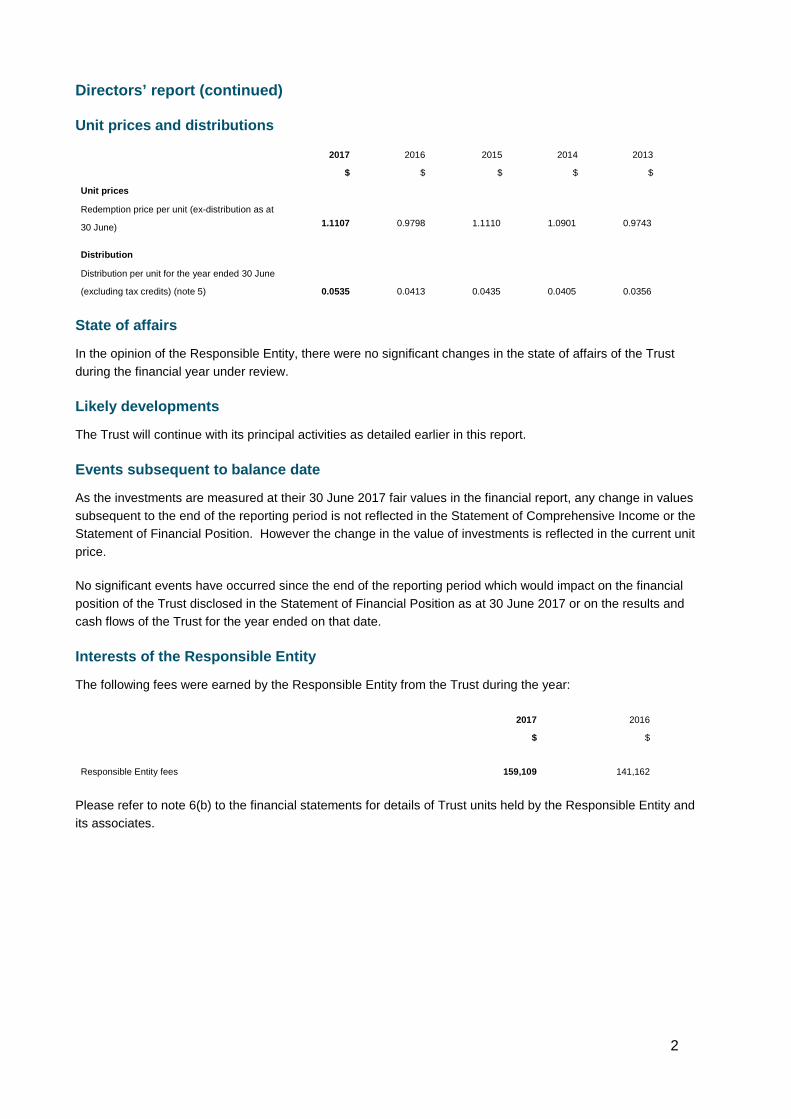
Unit prices and distributions
2017
$
2016
$
2015
$
2014
$
2013
$
Unit prices
Redemption price per unit (ex-distribution as at
30 June) 1.1107 0.9798 1.1110 1.0901 0.9743
Distribution
Distribution per unit for the year ended 30 June
(excluding tax credits) (note 5) 0.0535 0.0413 0.0435 0.0405 0.0356
State of affairs
In the opinion of the Responsible Entity, there were no significant changes in the state of affairs of the Trust during the financial year under review.
Likely developments
The Trust will continue with its principal activities as detailed earlier in this report.
Events subsequent to balance date
As the investments are measured at their 30 June 2017 fair values in the financial report, any change in values subsequent to the end of the reporting period is not reflected in the Statement of Comprehensive Income or the Statement of Financial Position. However the change in the value of investments is reflected in the current unit price.
No significant events have occurred since the end of the reporting period which would impact on the financial position of the Trust disclosed in the Statement of Financial Position as at 30 June 2017 or on the results and cash flows of the Trust for the year ended on that date.
Interests of the Responsible Entity
The following fees were earned by the Responsible Entity from the Trust during the year:
2017
$
2016
$
Responsible Entity fees 159,109 141,162
Please refer to note 6(b) to the financial statements for details of Trust units held by the Responsible Entity and its associates.
5
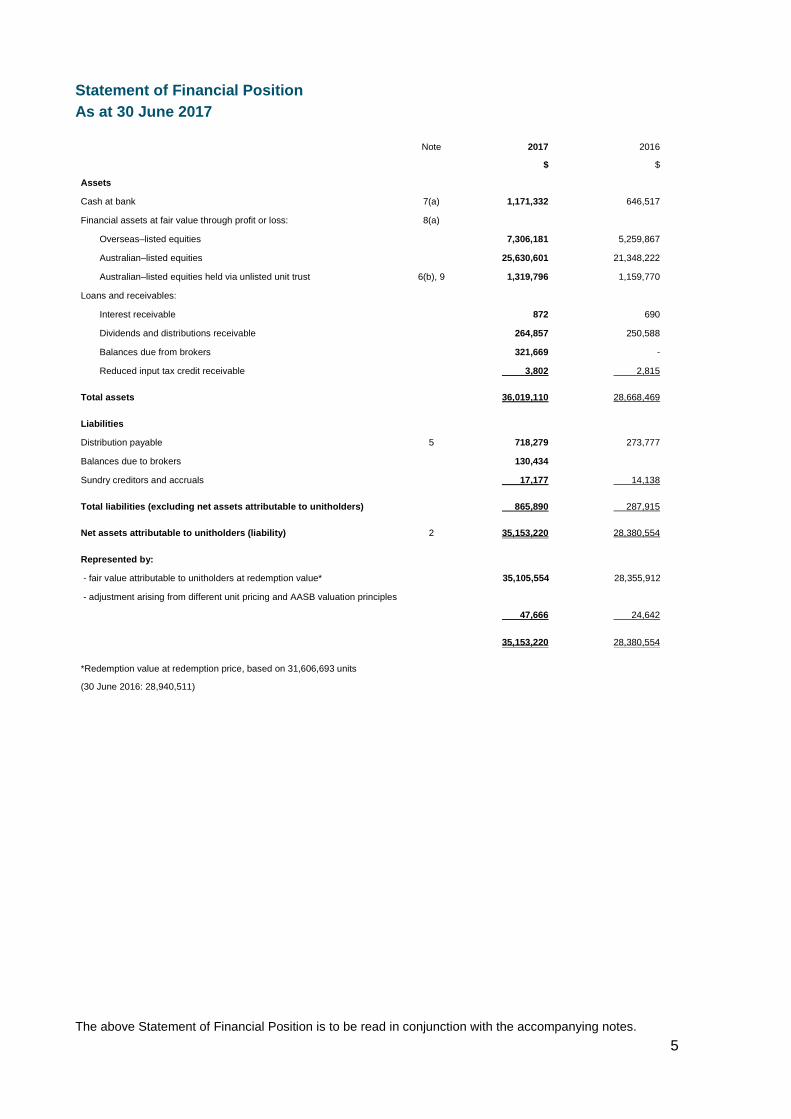
Statement of Financial Position As at 30 June 2017
Note 2017
$
2016
$
Assets
Cash at bank 7(a) 1,171,332 646,517
Financial assets at fair value through profit or loss: 8(a)
Overseas–listed equities 7,306,181 5,259,867
Australian–listed equities 25,630,601 21,348,222
Australian–listed equities held via unlisted unit trust 6(b), 9 1,319,796 1,159,770
Loans and receivables:
Interest receivable 872 690
Dividends and distributions receivable 264,857 250,588
Balances due from brokers 321,669 -
Reduced input tax credit receivable 3,802 2,815
Total assets 36,019,110 28,668,469
Liabilities
Distribution payable 5 718,279 273,777
Balances due to brokers 130,434
Sundry creditors and accruals 17,177 14,138
Total liabilities (excluding net assets attributable to unitholders) 865,890 287,915
Net assets attributable to unitholders (liability) 2 35,153,220 28,380,554
Represented by:
- fair value attributable to unitholders at redemption value* 35,105,554 28,355,912
- adjustment arising from different unit pricing and AASB valuation principles
47,666
24,642
35,153,220 28,380,554
*Redemption value at redemption price, based on 31,606,693 units
(30 June 2016: 28,940,511)
The above Statement of Financial Position is to be read in conjunction with the accompanying notes.
6
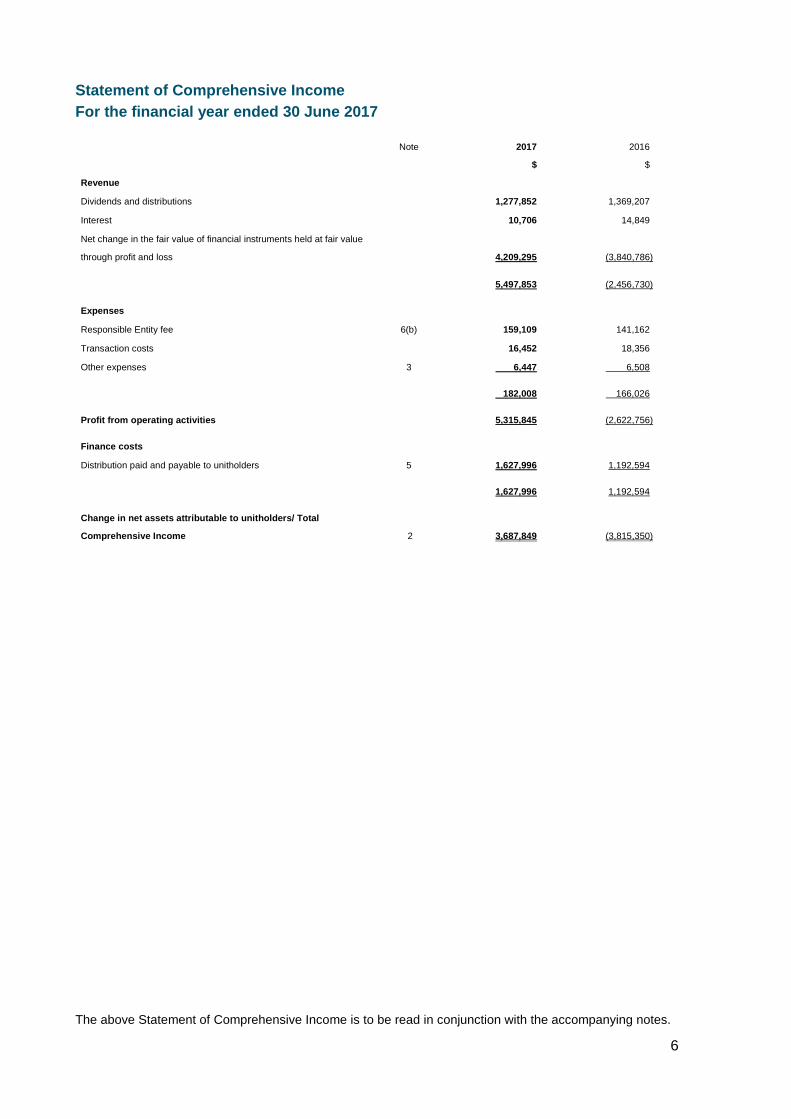
Statement of Comprehensive Income For the financial year ended 30 June 2017
Note 2017
$
2016
$
Revenue
Dividends and distributions 1,277,852 1,369,207
Interest 10,706 14,849
Net change in the fair value of financial instruments held at fair value
through profit and loss
4,209,295
(3,840,786)
5,497,853 (2,456,730)
Expenses
Responsible Entity fee 6(b) 159,109 141,162
Transaction costs 16,452 18,356
Other expenses 3 6,447 6,508
182,008 166,026
Profit from operating activities 5,315,845 (2,622,756)
Finance costs
Distribution paid and payable to unitholders 5 1,627,996 1,192,594
1,627,996 1,192,594
Change in net assets attributable to unitholders/ Total
Comprehensive Income
2
3,687,849
(3,815,350)
The above Statement of Comprehensive Income is to be read in conjunction with the accompanying notes.
7
Statement of Changes in Equity For the financial year ended 30 June 2017
The Trust’s net assets attributable to unitholders are classified as a liability under AASB 132 Financial instruments: Presentation. As such, the Trust has no equity and no items of changes in equity have been presented for the current or comparative year.
The above Statement of Changes in Equity is to be read in conjunction with the accompanying notes
8
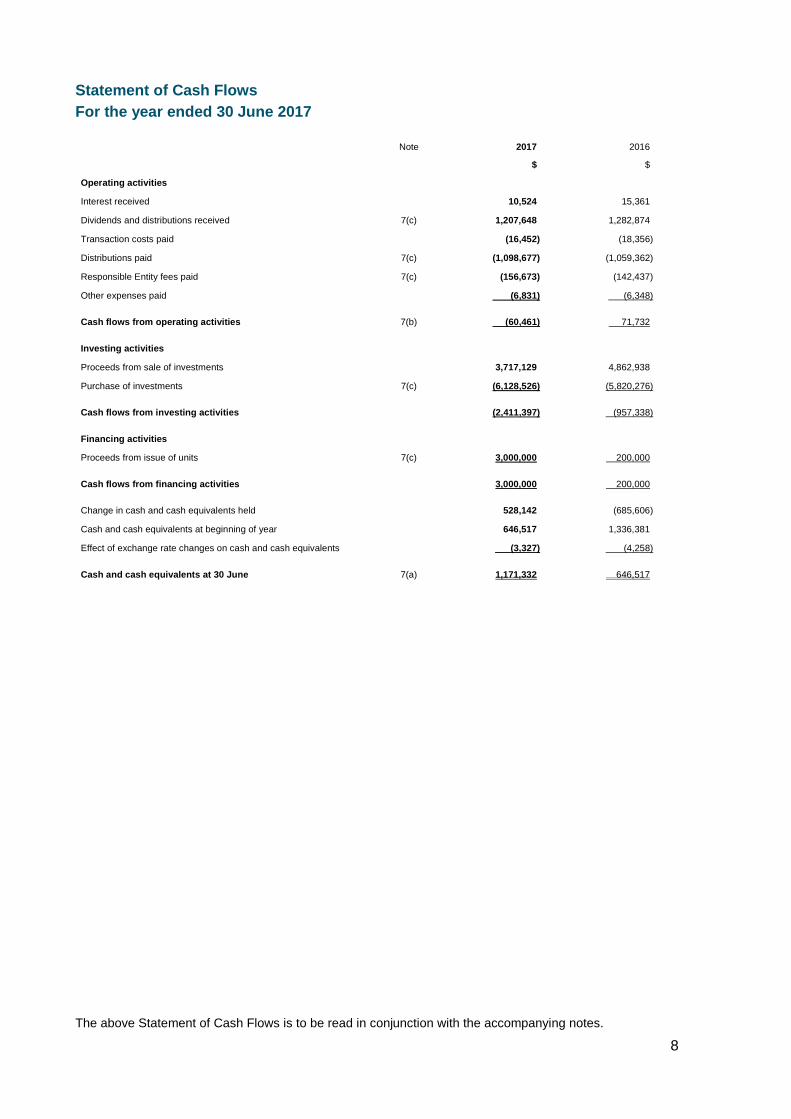
Statement of Cash Flows For the year ended 30 June 2017
Note 2017
$
2016
$
Operating activities
Interest received 10,524 15,361
Dividends and distributions received 7(c) 1,207,648 1,282,874
Transaction costs paid (16,452) (18,356)
Distributions paid 7(c) (1,098,677) (1,059,362)
Responsible Entity fees paid 7(c) (156,673) (142,437)
Other expenses paid (6,831) (6,348)
Cash flows from operating activities 7(b) (60,461) 71,732
Investing activities
Proceeds from sale of investments 3,717,129 4,862,938
Purchase of investments 7(c) (6,128,526) (5,820,276)
Cash flows from investing activities (2,411,397) (957,338)
Financing activities
Proceeds from issue of units 7(c) 3,000,000 200,000
Cash flows from financing activities 3,000,000 200,000
Change in cash and cash equivalents held 528,142 (685,606)
Cash and cash equivalents at beginning of year 646,517 1,336,381
Effect of exchange rate changes on cash and cash equivalents (3,327) (4,258)
Cash and cash equivalents at 30 June 7(a) 1,171,332 646,517
The above Statement of Cash Flows is to be read in conjunction with the accompanying notes.
9
Notes to and forming part of the financial statements For the financial year ended 30 June 2017 1 Summary of significant accounting policies
The Maple-Brown Abbott Australia Plus Asia Trust (the Trust) is a trust domiciled in Australia and is a for profit entity. The Trust was constituted on 30 November 2005 and commenced operations on 20 December 2005. The Trust will terminate 80 years (less one day) from the date of commencement or at such earlier time as provided by the Trust’s Constitution or by the law.
Maple-Brown Abbott Limited is the Responsible Entity. The registered office and principal place of business of the Responsible Entity is Level 31, 259 George Street, Sydney, NSW 2000.
This annual financial report covers the Trust as an individual entity.
The Annual Financial Report was authorised for issue by the directors on 7 September 2017. The directors of the Responsible Entity have the power to amend and reissue the financial report.
(a) Statement of compliance The Annual Financial Report is a general purpose financial report which has been prepared in accordance with the Trust’s Constitution (as amended) and Australian Accounting Standards and other authoritative pronouncements of the Australian Accounting Standards Board (AASB).
The Annual Financial Report of the Trust also complies with International Financial Reporting Standards (IFRS) and interpretations adopted by the International Accounting Standards Board.
(b) Basis of preparation The financial report is presented in Australian dollars.
The financial report is prepared on the basis of fair value measurement of assets and liabilities, except where otherwise stated.
Changes in accounting policies The following standards were available for early adoption but have not been applied in the financial statements:
o AASB 9 Financial Instruments and applicable amendments (effective from 1 January 2018) was available for early adoption but has not been applied in the financial statements. AASB 9 replaces existing guidance on classification and measurement of financial assets and introduces additions relating to the classification and measurement of financial liabilities (as part of the project to replace AASB 139 Financial Instruments: Recognition and Measurement). It has also introduced new hedge accounting requirements and revised certain requirements for impairment of financial assets. AASB 9 becomes mandatory for the Trust’s 30 June 2019 financial statements. Retrospective application is required. The Responsible Entity does not expect this standard to have a significant impact on the recognition and measurement of the Trust’s financial instruments as they are carried at fair value through profit and loss. The de-recognition rules have not been changed from previous requirements and the Trust does not apply hedge accounting.
10
Notes to and forming part of the financial statements For the financial year ended 30 June 2017 1 Summary of significant accounting policies (continued)
(b) Basis of preparation (continued) o AASB 15 Revenue from Contracts with Customers, (effective from 1 January 2018) the AASB has
issued a new standard for the recognition of revenue. This will replace AASB 118 which covers contracts for goods and services and AASB 111 which covers construction contracts. The new standard is based on the principle that revenue is recognised when control of a good or service transfers to a customer – so the notion of control replaces the existing notion of risks and rewards. The Trust’s main sources of income are interest, dividends and gains on financial instruments held at fair value. All of these are outside the scope of the new revenue standard. As a consequence, the Responsible Entity does not expect the adoption of the new revenue recognition rules to have a significant impact on the Trust's accounting policies or the amounts recognised in the financial statements.
The accounting policies set out below have been consistently applied to all periods presented in the Annual Financial Report.
(c) Financial instruments Specific instruments: Cash and cash equivalents Cash and cash equivalents include cash at bank, short term deposits held at call with banks and bank bills of exchange and are valued at cost.
Derivatives Derivative financial instruments are held for trading and accounted for on a fair value basis using the most recent verifiable source of market prices. Fair values are obtained using quoted market prices or determined through the use of valuation techniques. All derivatives are carried as assets when the fair value is positive and as liabilities when fair value is negative.
The Trust does not designate any derivatives as hedges in a hedging relationship.
Other Financial instruments Financial assets Financial assets of the Trust are classified either as “fair value through profit or loss” or as “loans and receivables”.
Fair value through profit or loss Financial assets which are classified as “fair value through profit or loss” are recognised or derecognised by the Responsible Entity as such at trade date. They are initially recognised at fair value, excluding transaction costs, which are expensed as incurred. Thereafter they are re-measured at fair value, with any resultant gain or loss recognised immediately as revenue in the Statement of Comprehensive Income.
11
Notes to and forming part of the financial statements For the financial year ended 30 June 2017 1 Summary of significant accounting policies (continued)
(c) Financial instruments (continued) Financial assets’ fair values are determined as follows:
Overseas-listed equities These securities are valued at their quoted bid price on the exchange on which such securities are traded as of the close of business on the day the securities are being valued.
Australian-listed equities These securities are valued at their quoted bid price on the Australian Securities Exchange as of the close of business on the day the securities are being valued.
Australian-listed equities held via unlisted unit trusts
Listed equities may be held via units in unlisted unit trusts which are valued at redemption price as reported by the manager of the trust as at close of business on the day the trusts are being valued.
Loans and Receivables Financial assets classified as “loans and receivables” include balances due from brokers, dividends and distributions receivable and other income receivable. These financial assets are carried at amortised cost using the effective interest method less impairment losses if any.
Loans and receivables are of a short term nature and hence their carrying value approximates fair value.
Financial liabilities Financial liabilities of the Trust are either measured at “fair value through profit or loss” or at “amortised cost” using the effective interest method.
Financial liabilities other than those at “fair value through profit or loss” include distributions payable, balances due to brokers, redemptions payable and sundry creditors and accruals which are carried at “amortised cost” using the effective interest method. These financial liabilities are of a short term nature and hence their carrying value approximates fair value.
Financial liabilities arising from the issue of redeemable units in the Trust are carried at the redemption amount representing the unitholders’ rights to a residual interest in the Trust’s assets at reporting date which approximates fair value.
Offsetting financial instruments Financial assets and liabilities are offset and the net amount reported in the Statement of Financial Position when there is a legally enforceable right to offset the recognised amounts and there is an intention to settle on a net basis, or realise the asset and settle the liability simultaneously.
12
Notes to and forming part of the financial statements For the financial year ended 30 June 2017 1 Summary of significant accounting policies (continued)
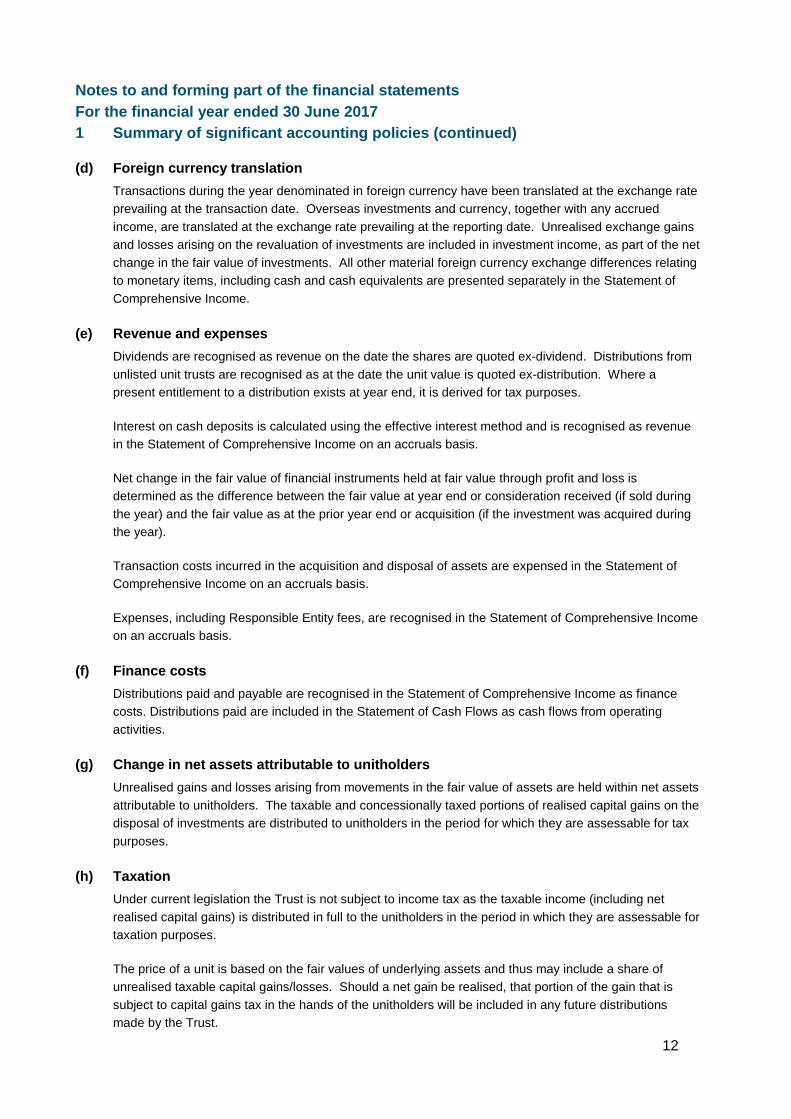
(d) Foreign currency translation Transactions during the year denominated in foreign currency have been translated at the exchange rate prevailing at the transaction date. Overseas investments and currency, together with any accrued income, are translated at the exchange rate prevailing at the reporting date. Unrealised exchange gains and losses arising on the revaluation of investments are included in investment income, as part of the net change in the fair value of investments. All other material foreign currency exchange differences relating to monetary items, including cash and cash equivalents are presented separately in the Statement of Comprehensive Income.
(e) Revenue and expenses Dividends are recognised as revenue on the date the shares are quoted ex-dividend. Distributions from unlisted unit trusts are recognised as at the date the unit value is quoted ex-distribution. Where a present entitlement to a distribution exists at year end, it is derived for tax purposes.
Interest on cash deposits is calculated using the effective interest method and is recognised as revenue in the Statement of Comprehensive Income on an accruals basis.
Net change in the fair value of financial instruments held at fair value through profit and loss is determined as the difference between the fair value at year end or consideration received (if sold during the year) and the fair value as at the prior year end or acquisition (if the investment was acquired during the year).
Transaction costs incurred in the acquisition and disposal of assets are expensed in the Statement of Comprehensive Income on an accruals basis.
Expenses, including Responsible Entity fees, are recognised in the Statement of Comprehensive Income on an accruals basis.
(f) Finance costs Distributions paid and payable are recognised in the Statement of Comprehensive Income as finance costs. Distributions paid are included in the Statement of Cash Flows as cash flows from operating activities.
(g) Change in net assets attributable to unitholders Unrealised gains and losses arising from movements in the fair value of assets are held within net assets attributable to unitholders. The taxable and concessionally taxed portions of realised capital gains on the disposal of investments are distributed to unitholders in the period for which they are assessable for tax purposes.
(h) Taxation Under current legislation the Trust is not subject to income tax as the taxable income (including net realised capital gains) is distributed in full to the unitholders in the period in which they are assessable for taxation purposes.
The price of a unit is based on the fair values of underlying assets and thus may include a share of unrealised taxable capital gains/losses. Should a net gain be realised, that portion of the gain that is subject to capital gains tax in the hands of the unitholders will be included in any future distributions made by the Trust.
13
Notes to and forming part of the financial statements For the financial year ended 30 June 2017 1 Summary of significant accounting policies (continued)
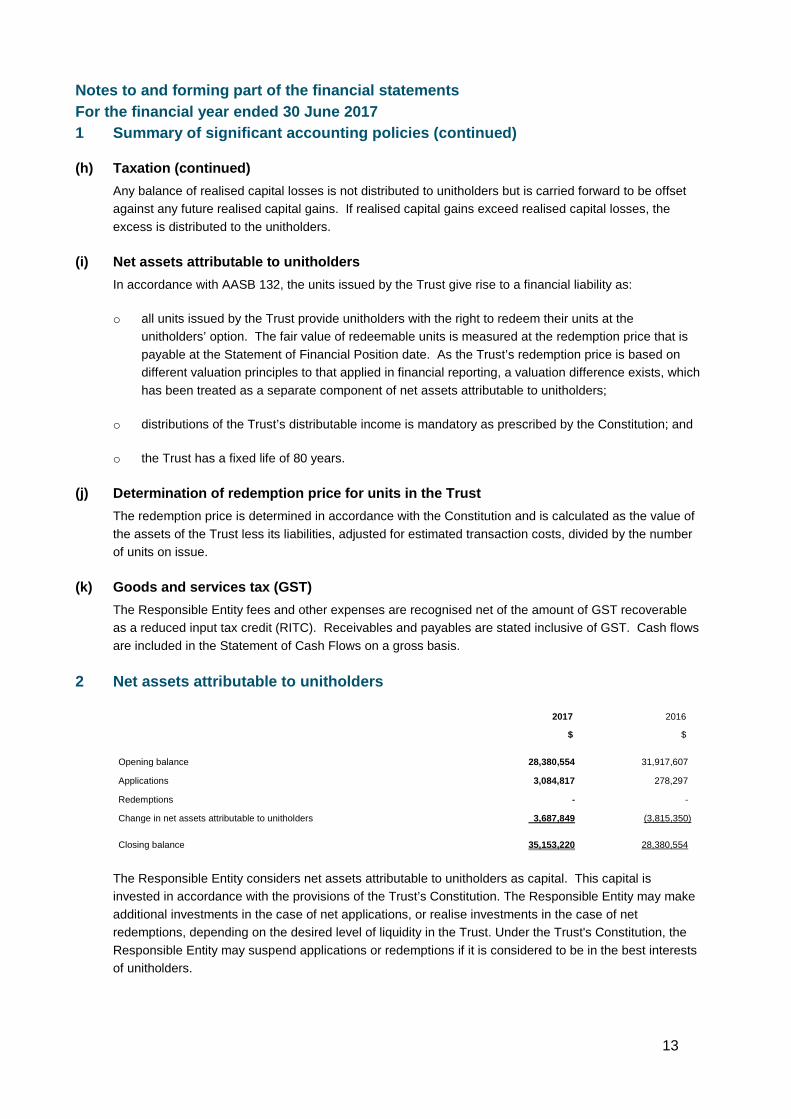
(h) Taxation (continued) Any balance of realised capital losses is not distributed to unitholders but is carried forward to be offset against any future realised capital gains. If realised capital gains exceed realised capital losses, the excess is distributed to the unitholders.
(i) Net assets attributable to unitholders In accordance with AASB 132, the units issued by the Trust give rise to a financial liability as:
o all units issued by the Trust provide unitholders with the right to redeem their units at the unitholders’ option. The fair value of redeemable units is measured at the redemption price that is payable at the Statement of Financial Position date. As the Trust’s redemption price is based on different valuation principles to that applied in financial reporting, a valuation difference exists, which has been treated as a separate component of net assets attributable to unitholders;
o distributions of the Trust’s distributable income is mandatory as prescribed by the Constitution; and
o the Trust has a fixed life of 80 years.
(j) Determination of redemption price for units in the Trust The redemption price is determined in accordance with the Constitution and is calculated as the value of the assets of the Trust less its liabilities, adjusted for estimated transaction costs, divided by the number of units on issue.
(k) Goods and services tax (GST) The Responsible Entity fees and other expenses are recognised net of the amount of GST recoverable as a reduced input tax credit (RITC). Receivables and payables are stated inclusive of GST. Cash flows are included in the Statement of Cash Flows on a gross basis.
2 Net assets attributable to unitholders
2017
$
2016
$
Opening balance 28,380,554 31,917,607
Applications 3,084,817 278,297
Redemptions - -
Change in net assets attributable to unitholders 3,687,849 (3,815,350)
Closing balance 35,153,220 28,380,554
The Responsible Entity considers net assets attributable to unitholders as capital. This capital is invested in accordance with the provisions of the Trust’s Constitution. The Responsible Entity may make additional investments in the case of net applications, or realise investments in the case of net redemptions, depending on the desired level of liquidity in the Trust. Under the Trust's Constitution, the Responsible Entity may suspend applications or redemptions if it is considered to be in the best interests of unitholders.
14
Notes to and forming part of the financial statements For the financial year ended 30 June 2017 3 Other expenses
2017
$
2016
$
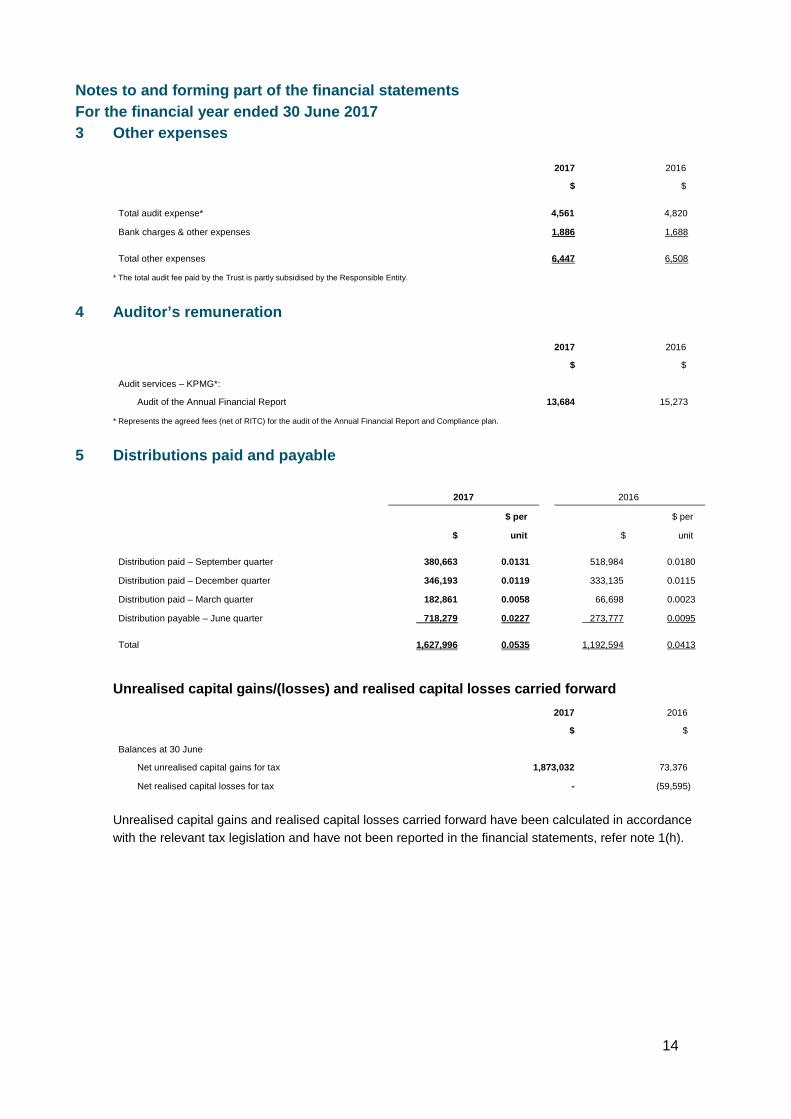
Total audit expense* 4,561 4,820
Bank charges & other expenses 1,886 1,688
Total other expenses 6,447 6,508
* The total audit fee paid by the Trust is partly subsidised by the Responsible Entity.
4 Auditor’s remuneration
2017
$
2016
$
Audit services – KPMG*:
Audit of the Annual Financial Report 13,684 15,273
* Represents the agreed fees (net of RITC) for the audit of the Annual Financial Report and Compliance plan.
5 Distributions paid and payable
Unrealised capital gains/(losses) and realised capital losses carried forward
2017
$
2016
$
Balances at 30 June
Net unrealised capital gains for tax 1,873,032 73,376
Net realised capital losses for tax - (59,595)
Unrealised capital gains and realised capital losses carried forward have been calculated in accordance with the relevant tax legislation and have not been reported in the financial statements, refer note 1(h).
2017 2016
$ per $ per
$ unit $ unit
Distribution paid – September quarter 380,663 0.0131 518,984 0.0180
Distribution paid – December quarter 346,193 0.0119 333,135 0.0115
Distribution paid – March quarter 182,861 0.0058 66,698 0.0023
Distribution payable – June quarter 718,279 0.0227 273,777 0.0095
Total 1,627,996 0.0535 1,192,594 0.0413
15
Notes to and forming part of the financial statements For the financial year ended 30 June 2017 6 Related parties
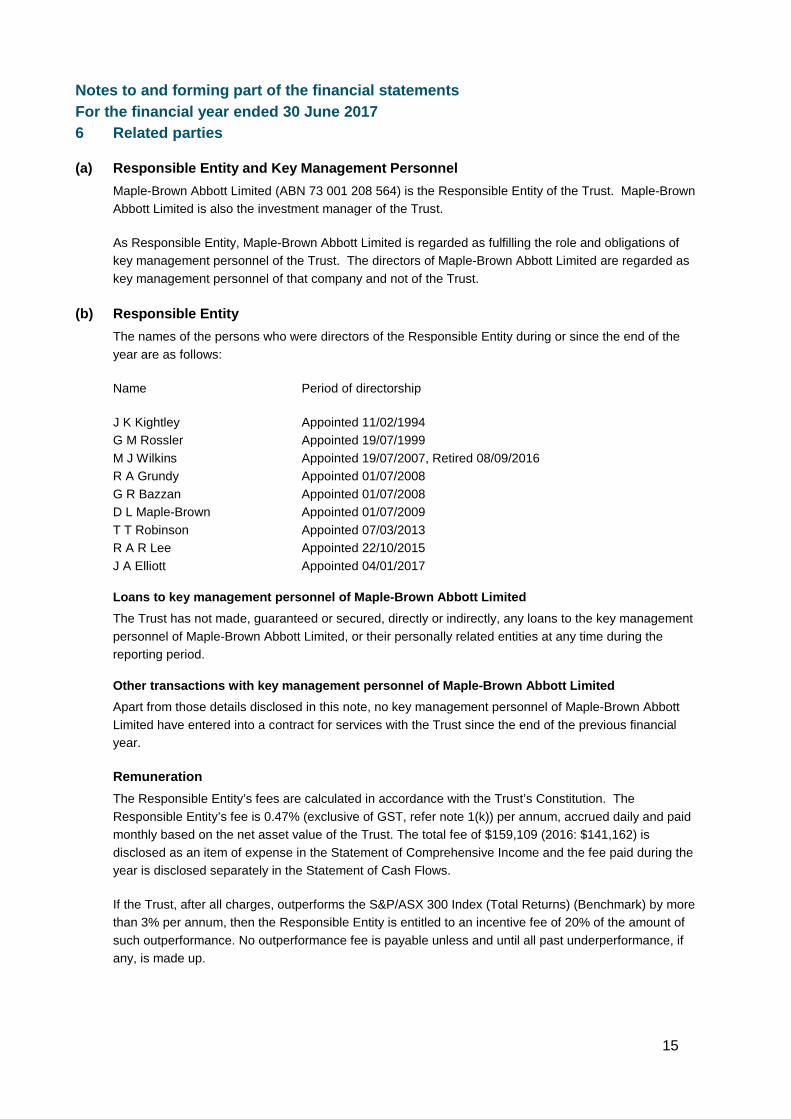
(a) Responsible Entity and Key Management Personnel Maple-Brown Abbott Limited (ABN 73 001 208 564) is the Responsible Entity of the Trust. Maple-Brown Abbott Limited is also the investment manager of the Trust.
As Responsible Entity, Maple-Brown Abbott Limited is regarded as fulfilling the role and obligations of key management personnel of the Trust. The directors of Maple-Brown Abbott Limited are regarded as key management personnel of that company and not of the Trust.
(b) Responsible Entity The names of the persons who were directors of the Responsible Entity during or since the end of the year are as follows:
Name Period of directorship
J K Kightley Appointed 11/02/1994 G M Rossler Appointed 19/07/1999 M J Wilkins Appointed 19/07/2007, Retired 08/09/2016 R A Grundy Appointed 01/07/2008 G R Bazzan Appointed 01/07/2008 D L Maple-Brown Appointed 01/07/2009 T T Robinson Appointed 07/03/2013 R A R Lee Appointed 22/10/2015 J A Elliott Appointed 04/01/2017
Loans to key management personnel of Maple-Brown Abbott Limited The Trust has not made, guaranteed or secured, directly or indirectly, any loans to the key management personnel of Maple-Brown Abbott Limited, or their personally related entities at any time during the reporting period.
Other transactions with key management personnel of Maple-Brown Abbott Limited Apart from those details disclosed in this note, no key management personnel of Maple-Brown Abbott Limited have entered into a contract for services with the Trust since the end of the previous financial year.
Remuneration The Responsible Entity’s fees are calculated in accordance with the Trust’s Constitution. The Responsible Entity’s fee is 0.47% (exclusive of GST, refer note 1(k)) per annum, accrued daily and paid monthly based on the net asset value of the Trust. The total fee of $159,109 (2016: $141,162) is disclosed as an item of expense in the Statement of Comprehensive Income and the fee paid during the year is disclosed separately in the Statement of Cash Flows.
If the Trust, after all charges, outperforms the S&P/ASX 300 Index (Total Returns) (Benchmark) by more than 3% per annum, then the Responsible Entity is entitled to an incentive fee of 20% of the amount of such outperformance. No outperformance fee is payable unless and until all past underperformance, if any, is made up.
16
Notes to and forming part of the financial statements For the financial year ended 30 June 2017 6 Related parties (continued)
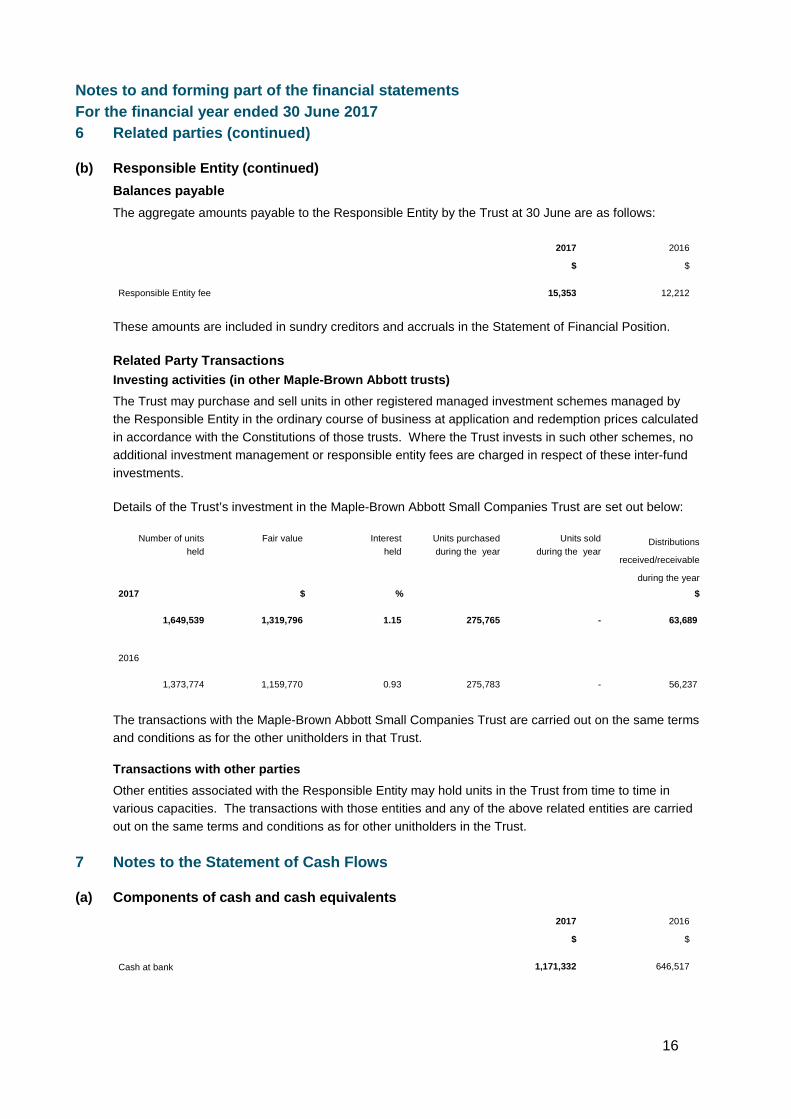
(b) Responsible Entity (continued) Balances payable The aggregate amounts payable to the Responsible Entity by the Trust at 30 June are as follows:
2017
$
2016
$
Responsible Entity fee 15,353 12,212
These amounts are included in sundry creditors and accruals in the Statement of Financial Position.
Related Party Transactions Investing activities (in other Maple-Brown Abbott trusts) The Trust may purchase and sell units in other registered managed investment schemes managed by the Responsible Entity in the ordinary course of business at application and redemption prices calculated in accordance with the Constitutions of those trusts. Where the Trust invests in such other schemes, no additional investment management or responsible entity fees are charged in respect of these inter-fund investments.
Details of the Trust’s investment in the Maple-Brown Abbott Small Companies Trust are set out below:
Number of units held
Fair value Interest held
Units purchased during the year
Units sold during the year
Distributions
received/receivable
during the year
2017 $ % $
1,649,539 1,319,796 1.15 275,765 - 63,689
2016
1,373,774 1,159,770 0.93 275,783 - 56,237
The transactions with the Maple-Brown Abbott Small Companies Trust are carried out on the same terms and conditions as for the other unitholders in that Trust.
Transactions with other parties Other entities associated with the Responsible Entity may hold units in the Trust from time to time in various capacities. The transactions with those entities and any of the above related entities are carried out on the same terms and conditions as for other unitholders in the Trust.
7 Notes to the Statement of Cash Flows
(a) Components of cash and cash equivalents 2017
$
2016
$
Cash at bank 1,171,332 646,517
17
Notes to and forming part of the financial statements For the financial year ended 30 June 2017 7 Notes to the Statement of Cash Flows (continued)
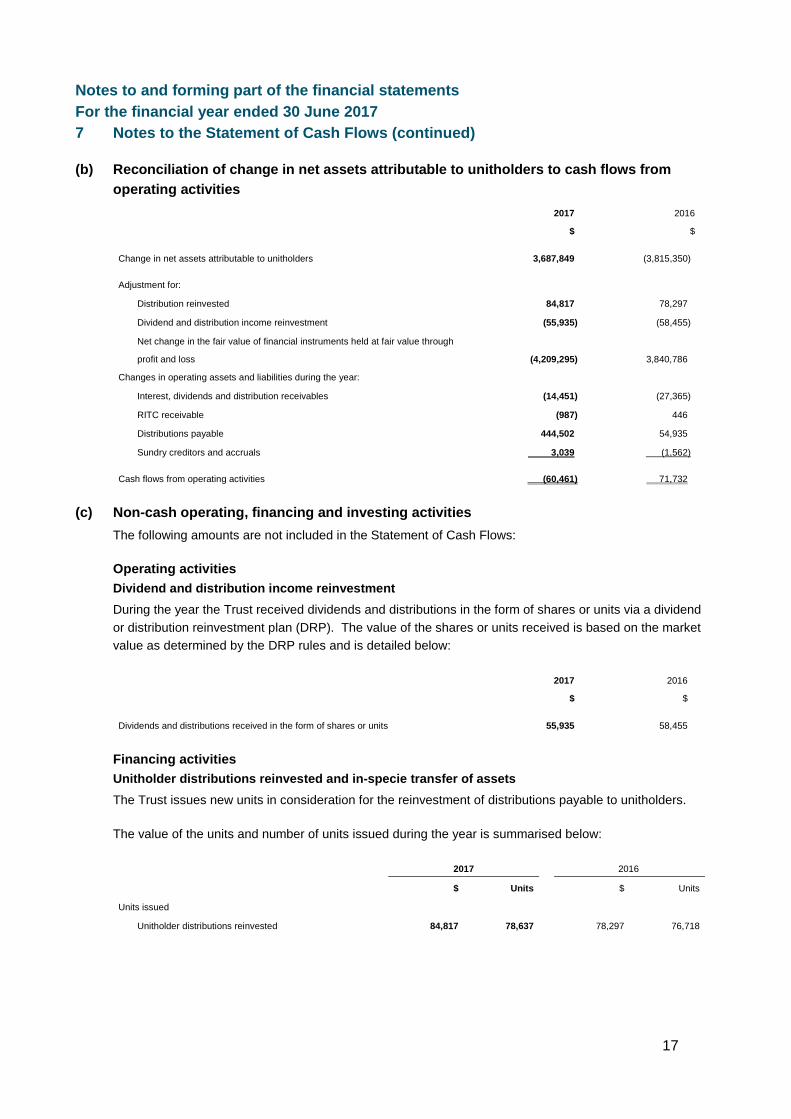
(b) Reconciliation of change in net assets attributable to unitholders to cash flows from operating activities
2017
$
2016
$
Change in net assets attributable to unitholders 3,687,849 (3,815,350)
Adjustment for:
Distribution reinvested 84,817 78,297
Dividend and distribution income reinvestment (55,935) (58,455)
Net change in the fair value of financial instruments held at fair value through
profit and loss
(4,209,295)
3,840,786
Changes in operating assets and liabilities during the year:
Interest, dividends and distribution receivables (14,451) (27,365)
RITC receivable (987) 446
Distributions payable 444,502 54,935
Sundry creditors and accruals 3,039 (1,562)
Cash flows from operating activities (60,461) 71,732
(c) Non-cash operating, financing and investing activities
The following amounts are not included in the Statement of Cash Flows:
Operating activities Dividend and distribution income reinvestment During the year the Trust received dividends and distributions in the form of shares or units via a dividend or distribution reinvestment plan (DRP). The value of the shares or units received is based on the market value as determined by the DRP rules and is detailed below:
2017
$
2016
$
Dividends and distributions received in the form of shares or units 55,935 58,455
Financing activities Unitholder distributions reinvested and in-specie transfer of assets The Trust issues new units in consideration for the reinvestment of distributions payable to unitholders.
The value of the units and number of units issued during the year is summarised below:
2017 2016
$ Units $ Units
Units issued
Unitholder distributions reinvested 84,817 78,637 78,297 76,718
18
Notes to and forming part of the financial statements For the financial year ended 30 June 2017 7 Notes to the Statement of Cash Flows (continued)
(c) Non-cash operating, financing and investing activities (continued) Investing activities The above dividend and distribution income reinvestments are not included in the Statement of Cash Flows relating to the purchase of investments.
8 Financial instruments
Risks and capital management objectives The Trust's activities expose it to a variety of risks: market risk (including price risk, interest rate risk and currency risk), liquidity risk, credit risk and operational risk.
The Responsible Entity seeks to minimise the Trust’s financial risks through a variety of activities, including diversification of the investment portfolio and the selection of liquid investments in accordance with the specific investment policies and restrictions set out in the Product Disclosure Statement.
The key element in the Trust’s investment philosophy is to seek to buy investments that offer relatively good long term value. The investment philosophy can also be described as contrarian and conservative, which helps to minimise its finance risks described above.
The nature and extent of the financial instruments outstanding at the balance date and the risk management policies employed by the Trust are discussed below together with the specific investment objectives and policies applicable to the Trust.
(a) Market risk Market risk is the risk that the value of a financial instrument will change as a result of exposure to market price changes, interest rate changes and currency movements.
Price risk The Trust’s market price risk is managed on a daily basis in accordance with the following specific investment policies and restrictions:
Investment policies The Responsible Entity will invest at least 70% of the portfolio in Australian-listed equity securities of companies and may invest up to a maximum of 20% in listed Asian equities (ex-Japan).
Investment restrictions Exposure to a single Australian stock should not be greater than 5% above its weighting in the Benchmark. Exposure to the Maple-Brown Abbott Small Companies Trust should not be greater than 5% of the Trust’s market value.
Exposure to a single Asian (ex-Japan) stock should not be greater than 5% of the total Trust’s market value.
19
Notes to and forming part of the financial statements For the financial year ended 30 June 2017 8 Financial instruments (continued)
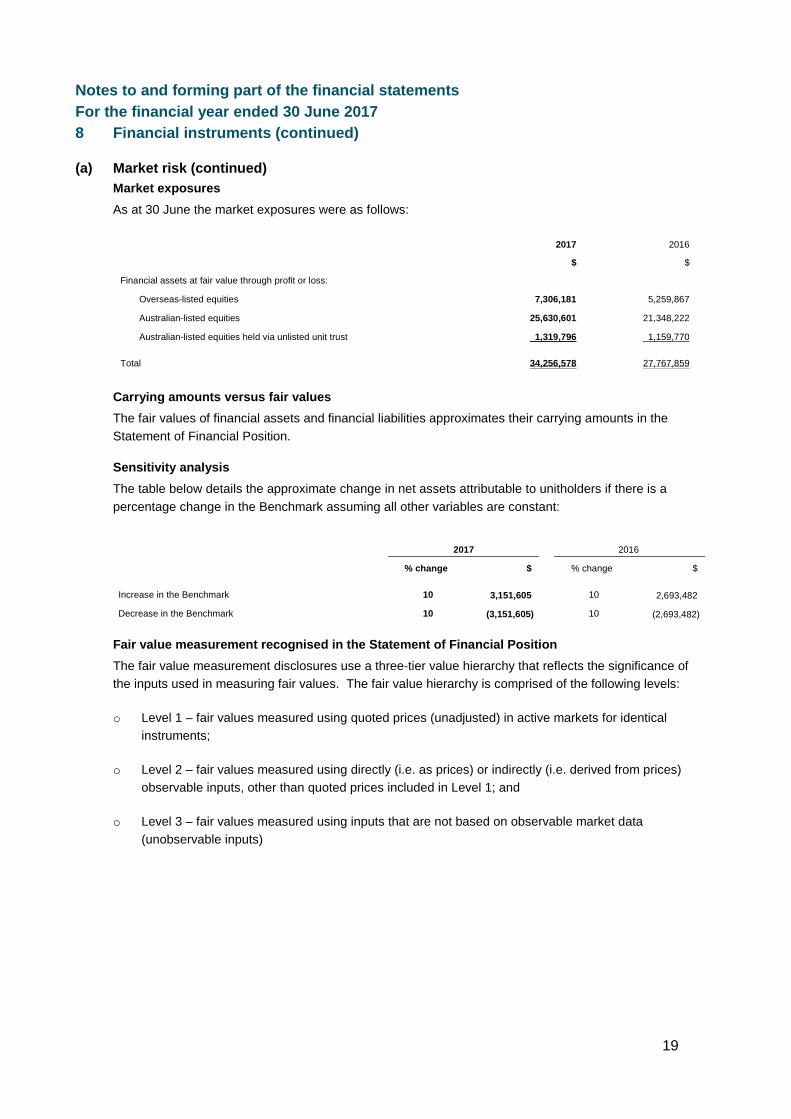
(a) Market risk (continued) Market exposures As at 30 June the market exposures were as follows:
2017
$
2016
$
Financial assets at fair value through profit or loss:
Overseas-listed equities 7,306,181 5,259,867
Australian-listed equities 25,630,601 21,348,222
Australian-listed equities held via unlisted unit trust 1,319,796 1,159,770
Total 34,256,578 27,767,859
Carrying amounts versus fair values The fair values of financial assets and financial liabilities approximates their carrying amounts in the Statement of Financial Position.
Sensitivity analysis The table below details the approximate change in net assets attributable to unitholders if there is a percentage change in the Benchmark assuming all other variables are constant:
2017 2016
% change $ % change $
Increase in the Benchmark 10 3,151,605 10 2,693,482
Decrease in the Benchmark 10 (3,151,605) 10 (2,693,482)
Fair value measurement recognised in the Statement of Financial Position The fair value measurement disclosures use a three-tier value hierarchy that reflects the significance of the inputs used in measuring fair values. The fair value hierarchy is comprised of the following levels:
o Level 1 – fair values measured using quoted prices (unadjusted) in active markets for identical instruments;
o Level 2 – fair values measured using directly (i.e. as prices) or indirectly (i.e. derived from prices) observable inputs, other than quoted prices included in Level 1; and
o Level 3 – fair values measured using inputs that are not based on observable market data (unobservable inputs)
20
Notes to and forming part of the financial statements For the financial year ended 30 June 2017 8 Financial instruments (continued)
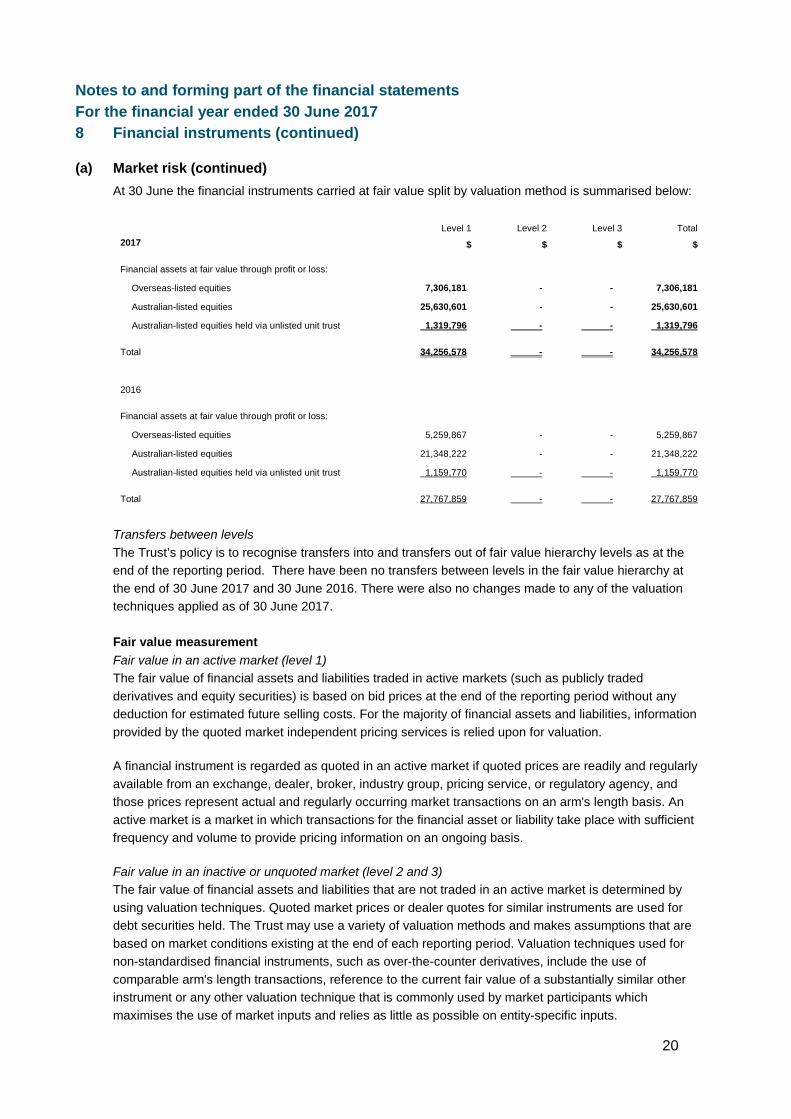
(a) Market risk (continued) At 30 June the financial instruments carried at fair value split by valuation method is summarised below:
Level 1 Level 2 Level 3 Total 2017 $ $ $ $
Financial assets at fair value through profit or loss:
Overseas-listed equities 7,306,181 - - 7,306,181
Australian-listed equities 25,630,601 - - 25,630,601
Australian-listed equities held via unlisted unit trust 1,319,796 - - 1,319,796
Total 34,256,578 - - 34,256,578
2016
Financial assets at fair value through profit or loss:
Overseas-listed equities 5,259,867 - - 5,259,867
Australian-listed equities 21,348,222 - - 21,348,222
Australian-listed equities held via unlisted unit trust 1,159,770 - - 1,159,770
Total 27,767,859 - - 27,767,859
Transfers between levels The Trust’s policy is to recognise transfers into and transfers out of fair value hierarchy levels as at the end of the reporting period. There have been no transfers between levels in the fair value hierarchy at the end of 30 June 2017 and 30 June 2016. There were also no changes made to any of the valuation techniques applied as of 30 June 2017.
Fair value measurement Fair value in an active market (level 1) The fair value of financial assets and liabilities traded in active markets (such as publicly traded derivatives and equity securities) is based on bid prices at the end of the reporting period without any deduction for estimated future selling costs. For the majority of financial assets and liabilities, information provided by the quoted market independent pricing services is relied upon for valuation.
A financial instrument is regarded as quoted in an active market if quoted prices are readily and regularly available from an exchange, dealer, broker, industry group, pricing service, or regulatory agency, and those prices represent actual and regularly occurring market transactions on an arm's length basis. An active market is a market in which transactions for the financial asset or liability take place with sufficient frequency and volume to provide pricing information on an ongoing basis.
Fair value in an inactive or unquoted market (level 2 and 3) The fair value of financial assets and liabilities that are not traded in an active market is determined by using valuation techniques. Quoted market prices or dealer quotes for similar instruments are used for debt securities held. The Trust may use a variety of valuation methods and makes assumptions that are based on market conditions existing at the end of each reporting period. Valuation techniques used for non-standardised financial instruments, such as over-the-counter derivatives, include the use of comparable arm's length transactions, reference to the current fair value of a substantially similar other instrument or any other valuation technique that is commonly used by market participants which maximises the use of market inputs and relies as little as possible on entity-specific inputs.
21
Notes to and forming part of the financial statements For the financial year ended 30 June 2017 8 Financial instruments (continued)
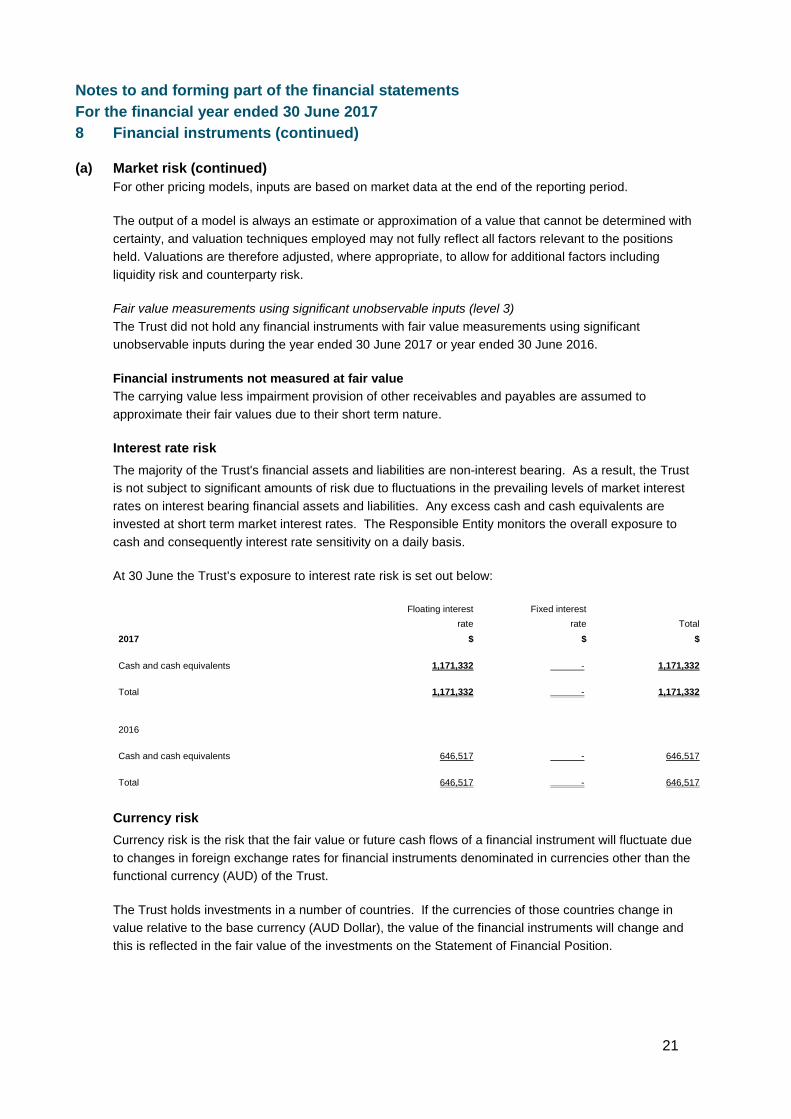
(a) Market risk (continued) For other pricing models, inputs are based on market data at the end of the reporting period.
The output of a model is always an estimate or approximation of a value that cannot be determined with certainty, and valuation techniques employed may not fully reflect all factors relevant to the positions held. Valuations are therefore adjusted, where appropriate, to allow for additional factors including liquidity risk and counterparty risk.
Fair value measurements using significant unobservable inputs (level 3) The Trust did not hold any financial instruments with fair value measurements using significant unobservable inputs during the year ended 30 June 2017 or year ended 30 June 2016.
Financial instruments not measured at fair value The carrying value less impairment provision of other receivables and payables are assumed to approximate their fair values due to their short term nature.
Interest rate risk The majority of the Trust's financial assets and liabilities are non-interest bearing. As a result, the Trust is not subject to significant amounts of risk due to fluctuations in the prevailing levels of market interest rates on interest bearing financial assets and liabilities. Any excess cash and cash equivalents are invested at short term market interest rates. The Responsible Entity monitors the overall exposure to cash and consequently interest rate sensitivity on a daily basis.
At 30 June the Trust’s exposure to interest rate risk is set out below:
Floating interest rate
Fixed interest rate
Total
2017 $ $ $
Cash and cash equivalents 1,171,332 - 1,171,332
Total 1,171,332 - 1,171,332
2016
Cash and cash equivalents 646,517 - 646,517
Total 646,517 - 646,517
Currency risk Currency risk is the risk that the fair value or future cash flows of a financial instrument will fluctuate due to changes in foreign exchange rates for financial instruments denominated in currencies other than the functional currency (AUD) of the Trust.
The Trust holds investments in a number of countries. If the currencies of those countries change in value relative to the base currency (AUD Dollar), the value of the financial instruments will change and this is reflected in the fair value of the investments on the Statement of Financial Position.
22
Notes to and forming part of the financial statements For the financial year ended 30 June 2017 8 Financial instruments (continued)
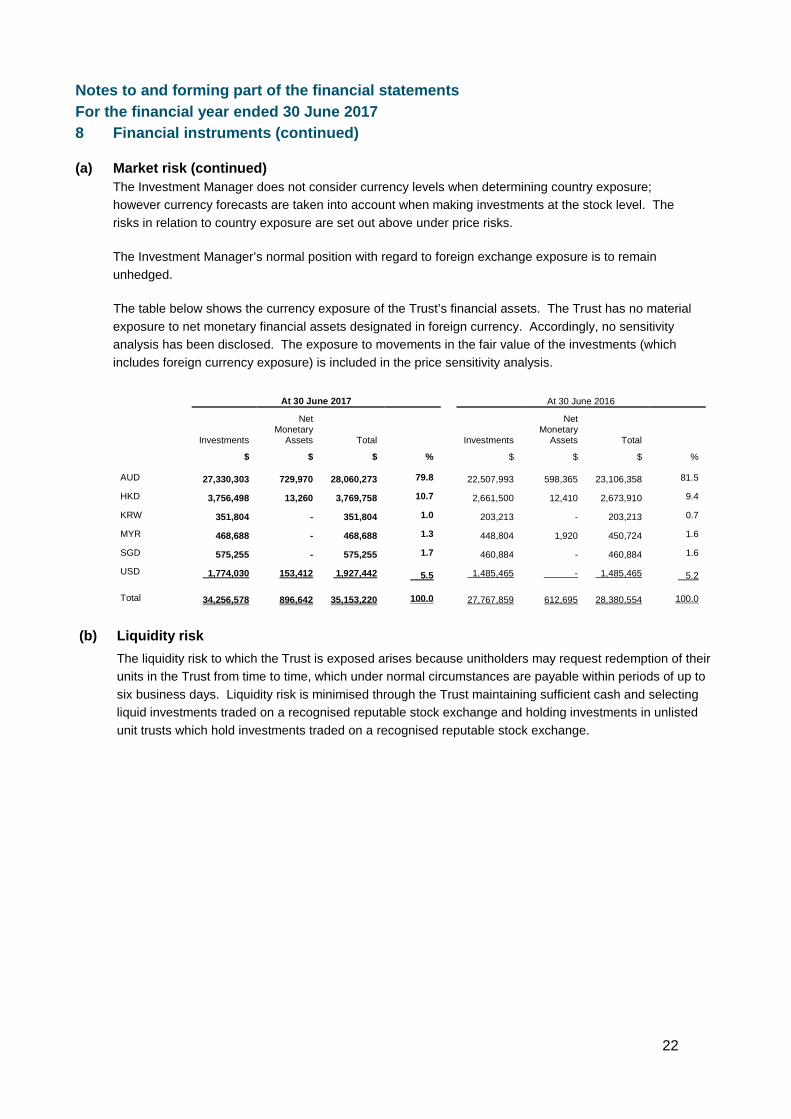
(a) Market risk (continued) The Investment Manager does not consider currency levels when determining country exposure; however currency forecasts are taken into account when making investments at the stock level. The risks in relation to country exposure are set out above under price risks.
The Investment Manager’s normal position with regard to foreign exchange exposure is to remain unhedged.
The table below shows the currency exposure of the Trust’s financial assets. The Trust has no material exposure to net monetary financial assets designated in foreign currency. Accordingly, no sensitivity analysis has been disclosed. The exposure to movements in the fair value of the investments (which includes foreign currency exposure) is included in the price sensitivity analysis.
At 30 June 2017 At 30 June 2016
Investments
Net Monetary
Assets Total
Investments
Net Monetary
Assets Total
$ $ $ % $ $ $ %
AUD 27,330,303 729,970 28,060,273 79.8 22,507,993 598,365 23,106,358 81.5
HKD 3,756,498 13,260 3,769,758 10.7 2,661,500 12,410 2,673,910 9.4
KRW 351,804 - 351,804 1.0 203,213 - 203,213 0.7
MYR 468,688 - 468,688 1.3 448,804 1,920 450,724 1.6
SGD 575,255 - 575,255 1.7 460,884 - 460,884 1.6
USD 1,774,030 153,412 1,927,442 5.5 1,485,465 - 1,485,465 5.2
Total 34,256,578 896,642 35,153,220 100.0 27,767,859 612,695 28,380,554 100.0
(b) Liquidity risk The liquidity risk to which the Trust is exposed arises because unitholders may request redemption of their units in the Trust from time to time, which under normal circumstances are payable within periods of up to six business days. Liquidity risk is minimised through the Trust maintaining sufficient cash and selecting liquid investments traded on a recognised reputable stock exchange and holding investments in unlisted unit trusts which hold investments traded on a recognised reputable stock exchange.
23
Notes to and forming part of the financial statements For the financial year ended 30 June 2017 8 Financial instruments (continued)
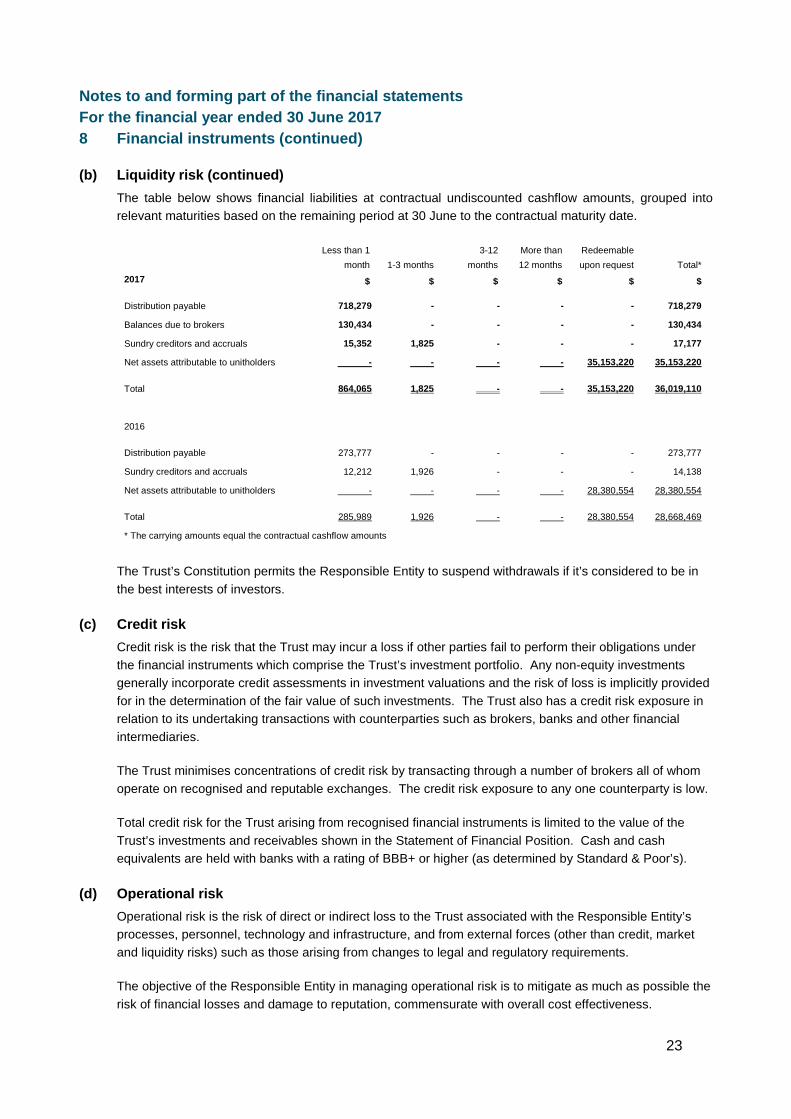
(b) Liquidity risk (continued) The table below shows financial liabilities at contractual undiscounted cashflow amounts, grouped into relevant maturities based on the remaining period at 30 June to the contractual maturity date.
Less than 1 month 1-3 months
3-12 months
More than 12 months
Redeemable upon request Total*
2017 $ $ $ $ $ $
Distribution payable 718,279 - - - - 718,279
Balances due to brokers 130,434 - - - - 130,434
Sundry creditors and accruals 15,352 1,825 - - - 17,177
Net assets attributable to unitholders - - - - 35,153,220 35,153,220
Total 864,065 1,825 - - 35,153,220 36,019,110
2016
Distribution payable 273,777 - - - - 273,777
Sundry creditors and accruals 12,212 1,926 - - - 14,138
Net assets attributable to unitholders - - - - 28,380,554 28,380,554
Total 285,989 1,926 - - 28,380,554 28,668,469
* The carrying amounts equal the contractual cashflow amounts
The Trust’s Constitution permits the Responsible Entity to suspend withdrawals if it’s considered to be in the best interests of investors.
(c) Credit risk Credit risk is the risk that the Trust may incur a loss if other parties fail to perform their obligations under the financial instruments which comprise the Trust’s investment portfolio. Any non-equity investments generally incorporate credit assessments in investment valuations and the risk of loss is implicitly provided for in the determination of the fair value of such investments. The Trust also has a credit risk exposure in relation to its undertaking transactions with counterparties such as brokers, banks and other financial intermediaries.
The Trust minimises concentrations of credit risk by transacting through a number of brokers all of whom operate on recognised and reputable exchanges. The credit risk exposure to any one counterparty is low.
Total credit risk for the Trust arising from recognised financial instruments is limited to the value of the Trust’s investments and receivables shown in the Statement of Financial Position. Cash and cash equivalents are held with banks with a rating of BBB+ or higher (as determined by Standard & Poor’s).
(d) Operational risk Operational risk is the risk of direct or indirect loss to the Trust associated with the Responsible Entity’s processes, personnel, technology and infrastructure, and from external forces (other than credit, market and liquidity risks) such as those arising from changes to legal and regulatory requirements.
The objective of the Responsible Entity in managing operational risk is to mitigate as much as possible the risk of financial losses and damage to reputation, commensurate with overall cost effectiveness.
24
Notes to and forming part of the financial statements For the financial year ended 30 June 2017 8 Financial instruments (continued)
(d) Operational risk (continued) The Responsible Entity is responsible for the development and implementation of controls to address operational risk. This responsibility is supported by the development of an overall control framework implemented to manage operational risk, key aspects of which include:
o appropriate segregation of duties, including the independent authorisation of transactions;
o cash and securities positions are completely and accurately recorded and reconciled to third party
data;
o monitoring the performance of external service providers, including financial information received
from them;
o documentation of controls and procedures;
o periodic assessment of operational risks faced, and the adequacy of controls and procedures to
address the risks identified;
o reporting of operational losses and proposed remedial action, with appropriate follow-up;
o assessment and mitigation of cyber risks and development of contingency business continuity,
including disaster recovery, plans;
o training and professional development;
o ethical and business standards; and
o risk mitigation, including insurance where this is effective.
9 Interests in unconsolidated structured entities
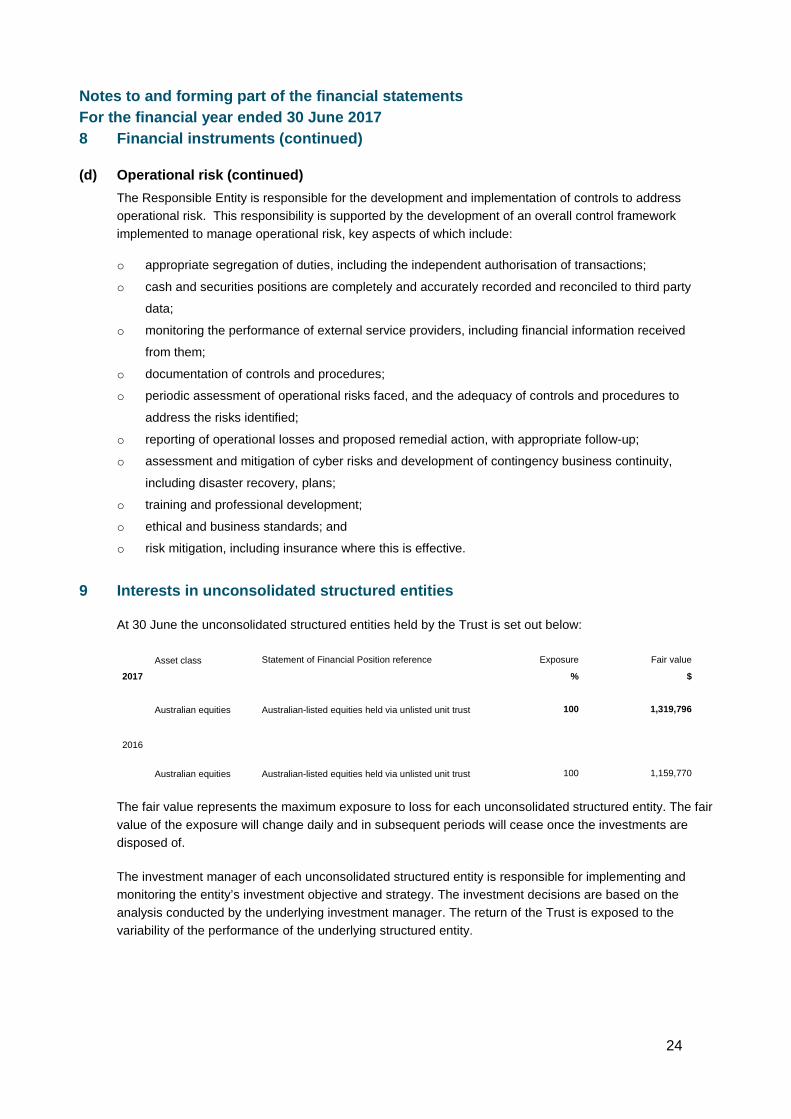
At 30 June the unconsolidated structured entities held by the Trust is set out below:
Asset class Statement of Financial Position reference Exposure Fair value
2017 % $
Australian equities Australian-listed equities held via unlisted unit trust 100 1,319,796
2016
Australian equities Australian-listed equities held via unlisted unit trust 100 1,159,770
The fair value represents the maximum exposure to loss for each unconsolidated structured entity. The fair value of the exposure will change daily and in subsequent periods will cease once the investments are disposed of.
The investment manager of each unconsolidated structured entity is responsible for implementing and monitoring the entity’s investment objective and strategy. The investment decisions are based on the analysis conducted by the underlying investment manager. The return of the Trust is exposed to the variability of the performance of the underlying structured entity.

25
Notes to and forming part of the financial statements For the financial year ended 30 June 2017 10 Events subsequent to balance date
As the investments are measured at their 30 June 2017 fair values in the financial report, any change in values subsequent to the end of the reporting period is not reflected in the Statement of Comprehensive Income or the Statement of Financial Position. However the change in the value of investments is reflected in the current unit price.
No significant events have occurred since the end of the reporting period which would impact on the financial position of the Trust disclosed in the Statement of Financial Position as at 30 June 2017 or on the results and cash flows of the Trust for the year ended on that date.