Embed Size (px)
Citation preview

MapInfo Training
Concepts & Definitions

MapInfo Training CourseThere are 3 Sections to this course
1. Concepts & Definitions• Coordinate Systems• Projections• Introducing MapInfo
2. MapInfo Training – Part 1: Basics• Tables• Maps• Layouts
3. MapInfo Training – Part 2: Advanced• Thematic Maps• Selections• Queries• Sample Application

What is GIS?• GIS Refers to software tools which use spatial /
geographic techniques to visualize and analyze data
• Typically, GIS is used to relate different types of geographic data. o Polygons (e.g. counties)
o lines (e.g. rivers or utility lines)
o points (e.g. population centers)
• This information can then be geographically identified and related
• Spatial relationships between data translate to mathematical expressions and can be evaluated by GIS tools
What GIS is NOT!• GIS is not equivalent to digital mapping• There are better programs available (i.e. Adobe
Freehand or Illustrator) for creating presentation quality digital maps
• Questions such as “Which county has the highest population?” can be answered by a database
• Questions such as “Which county has the highest density of potential customers within 5 miles of potential radio sites?” use GIS

Coordinate Systems• A coordinate system is used to create a
numerical representation of geometric objects.• Each point in a geometric object is represented
by a pair of numbers. • Those numbers are the coordinates for that
point.• In cartography*, coordinate systems are closely
related to projections. • You create a coordinate system by supplying
specific values for the parameters of a projection.
* Cartography is the art and science of making maps. In GIS it is the graphic presentation and visual interpretation of data.

Coordinate SystemsLatitude• The North-South position of a point• The Y-Axis• Measured in degrees or decimal degrees above
or below the equator.• Latitude lines are the horizontal lines on a map• Latitude lines increase from 0 degrees at the
Equator to 90 degrees at both the North (+90.0 degrees) and South (-90.0 degrees) poles.

N
S
EW
Equator(-) 41 12 23
(+) 41 12 23
Lines of Latitude

Coordinate SystemsLongitude• Used to describe the East – West position of a
point• The X-Axis• It is reported as the number of degrees East (to
–180.0 degrees) or west (to +180.0 degrees) of the Prime Meridian (0 degrees)
• Represented by vertical lines running from North to South.
• Lines of Longitude are farthest apart at the Equator and intersect at both poles, and are therefore not parallel.

N
S
EW
Prime Meridian
(+) 76 02 14(-) 76 02 14
Lines of Longitude
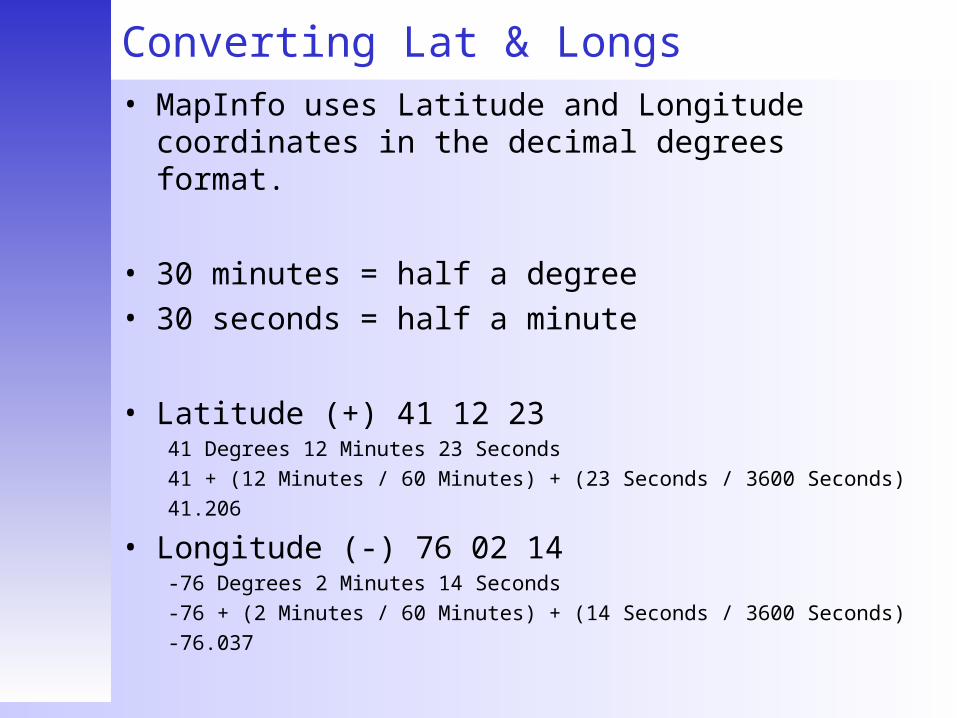
Converting Lat & Longs• MapInfo uses Latitude and Longitude
coordinates in the decimal degrees format.
• 30 minutes = half a degree• 30 seconds = half a minute
• Latitude (+) 41 12 2341 Degrees 12 Minutes 23 Seconds41 + (12 Minutes / 60 Minutes) + (23 Seconds / 3600 Seconds)41.206
• Longitude (-) 76 02 14-76 Degrees 2 Minutes 14 Seconds-76 + (2 Minutes / 60 Minutes) + (14 Seconds / 3600 Seconds)-76.037

Projections• A Projection is a mathematical model that
translates the location of features on the Earth’s surface to locations on a two-dimensional surface.
• All projections have a degree of distortion• A map projection can preserve area, distance,
shape or direction but only a globe can preserve everything!
• MapInfo has a wide range of projections for displaying maps, it defaults to Latitude / Longitude.

Projection Example

Examples of ProjectionsSome well known projections are:• Mercator – Produce maps suited for navigation• Lambert – Produce maps suited for visual
analysis
In MapInfo• Latitude/Longitude NAD27 – Bahamas, Cape
etc.*• Latitude/Longitude NAD83*• Various other options
* Used by many Network Planning Software tools

What is MapInfo?• MapInfo Professional
Windows based Mapping (thematic)Can handle both Vector & Raster dataData AnalysisSQL Query, Geographic QueriesImports/exports to many popular data formatsCartographic LegendsLayout (Presentation)Graphing / Charting

Raster and Vector Data
Vector RasterConstructed by joining points with lines. Nodes are the start and end points, vertices are the points where there is a change of direction.
Pixels are used to represent features. Each pixel covers a set area of the ground, dependant upon resolution. Used mainly for representing areas.

What is it used for?
Areas of Application• Marketing / Market Planning
o Locate customers / users, prioritize market launch
• Strategic Planningo Business case analysis, trending, forecasting
• RF Engineeringo Enhance site selection / maximizing demographic
coverage
• Network Engineeringo Interconnect / backhaul planning
• Maintenance / Optimizationo Analysis / Mapping of network problems, complaints

MapInfo Training
Part 1: Basics

Tables: Structure• Tables typically consist of between 3 and 4 files
associated by MapInfo• Tables can represent either raster data, vector
data, or non-geographic data• Tables can be in the native MapInfo format
(.tab) or external formats opened in MapInfo (mdb, xls, dbf, jpg, gif)
• It is estimated that up to 85% of the Worlds databases contain some sort of Geographic information (lat/long, post code, etc.)

Tables: File Structure
Table definition, ASCII file containing structure (.tab)
File containing tabular data. (.dat, .xls, .dbf, etc)
File containing raster data. (.bmp, .jpg, .gif, etc)
OR
File containing graphical objects. (.map)
File cross-referencing tabular data with graphical objects. (.id)
File indexing tabular fields for searching. (.ind)

Tables: Opening
• To open a file use the Open Table Dialog;o Menu (File > Open..)
• Default view is automatic, but this can be changed.
• When you open a file you register it with MapInfo as being open
• Just because there is no map or browser window open it does not mean that there are no files open!

Tables: OpeningThe View Options Are:
o Automatic (Default)o Browsero Current Mappero New Mappero No View
• Automatic setting is quite intelligent and will be fine for most uses.
• Double-click a file name to open, or select the name and click the OK button.

Tables: Closing
• Closing a window does NOT close a table!• Tables remain open until you specifically tell
MapInfo to close them• This is done in one of two ways, depending on
what you are trying to do
Closing Single Tables:Menu (File > Close Table)
Closing All Tables:Menu (File > Close All)

Tables: Saving• After editing tables you need to save the table
in order to save your changes• This is done by using the save dialog
o Menu (File > Save Table)
• MapInfo will present a list of tables that have had changes done to them, select the table you wish to save from the list and click OK
• If no tables have been edited then the “Save Table” option in the “File” menu will be greyed out
• Before closing tables or exiting, MapInfo will warn you if there are any unsaved changes in tables.

Tables: Saving Copies Of• Occasionally you will need to save copies of
tables• This is especially true if you import tables that
are not MapInfo native• Before you can edit the structure of these
tables they must be in a MapInfo native format• Use the Save Copy Dialog to do this
o Menu (File > Save Copy As..)
• MapInfo shows a list of all open tables• Select the table you want to make a copy of• Enter a location and file name in the dialog• Click OK

Tables: Creating New
• Sometimes it will be necessary to create your own blank tables, into which you can put your own data. This might be some new Cell sites that you want to plot
• Use the File > New Table menu option• Select whether you want to open a browser or
mapper, or both!• Use a mapper if you will be drawing objects
(such as point locations)• Use a browser if you want to type data into a
table (like a spreadsheet)• The “Create New Table Dialog” will appear

Tables: New Table Dialog
• Click the “Add Field” button
• Give the field a name• Choose a field type
(character, float, integer, etc)
• Enter a value for the maximum width of the fied
• Tick “Table is mappable” box (for map tables!)
• Choose a projection (default is Latitude / Longitude)
• Repeat for all fields• Click create new• Give it a file name• Click OK
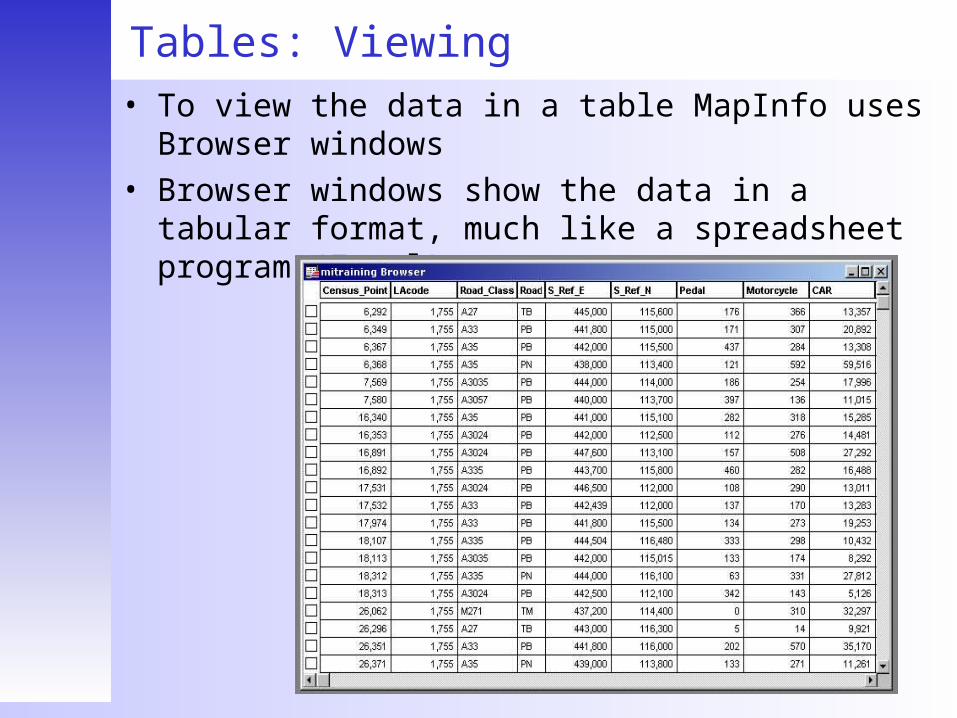
Tables: Viewing• To view the data in a table MapInfo uses
Browser windows• Browser windows show the data in a tabular
format, much like a spreadsheet program (Excel)

Tables: Importing Files• MapInfo can open and view several different file
typeso dBASE DBF (.dbf)o Delimited ASCII (.txt)o Lotus 123 (.wk1, .wks, .wk2, etc)o Microsoft Excel (.xls)o Microsoft Access Database (.mdb)
• The method of opening varies with each file type
• The most common types viewed are Excel and ASCII

Tables: Important Issues• Opening a non MapInfo file format only allows
you to view the data• You cannot edit / map etc a non-native file
format• This method of opening is merely a dynamic
link to the original file• If you make changes to the original file then
these changes would be reflected in MapInfo• This method of file opening is good for viewing
sample data• To import the file you need to save a copy of
the table as mentioned previously

Tables: Exporting • MapInfo can export its tables to the following
formats:o MapInfo Interchange (.mif)o Delimited ASCII (.txt)o AutoCAD DXF (.dxf)o dBASE DBF (.dbf)
• The most common use of export is to text files, these can then be read by virtually any other program

Tables: Table Maintenance• It is very important to know how to maintain
tables• It allows you to:
o Alter table structureo Delete tableso Rename tableso Pack tables
• The table maintenance options can be accessed via:o Menu (Table > Maintenance)
• This opens a sub menu containing the maintenance options

Tables: Structure Dialog• You can add, remove, or rename a tables fields• You can also alter the position of fields in a
table• The properties of a field may also be altered
(name, type, and width)

Tables: Deleting• Using this function will delete a table and all its
associated files from your hard disk• Accessed via:
o Menu (Table > Maintenance > Delete Table)
• Can NOT be undone!• Select the table to delete from the list that
appears

Tables: Renaming
• This option allows you to rename an open table• It renames the table within MapInfo, and also
renames all associated files• Accessed via:
o Menu (Table > Maintenance > Rename Table)
• Select table to rename from list that appears• Give it a new file name in the save dialog• Click “Save”• All files are renamed and the tables entry in
MapInfo is also renamed

Tables: Packing• When you delete a row from a table you only
delete the data in that row• You do NOT delete the actual row• To delete empty rows from a table you must
use the Pack Table function:o Menu (Table > Maintenance > Pack Table)
• Select the table to pack from the list• Select the pack method• Click OK

Tables: Pack Table DialogPack Options1. Pack Tabular Data
o Only packs the table
2. Pack Graphic Datao Only packs graphical
objects
3. Pack Both Types of Datao Packs both tabular and
graphical data
• If your table is just tabular then use option 1, otherwise use option 3
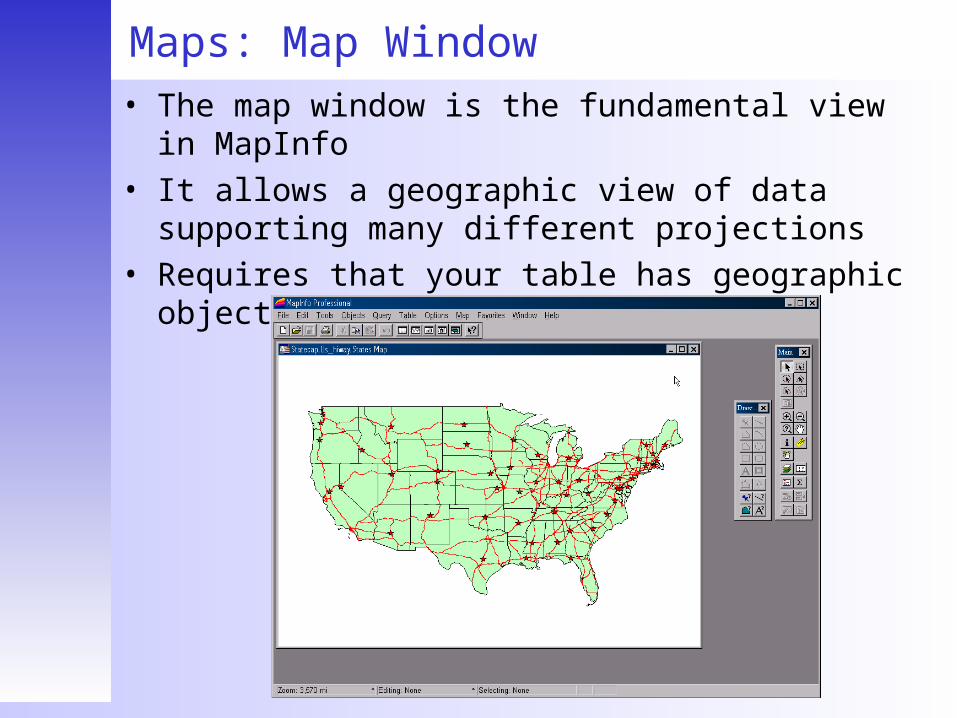
Maps: Map Window• The map window is the fundamental view in
MapInfo• It allows a geographic view of data supporting
many different projections• Requires that your table has geographic objects

Maps: Objects• Hidden column in mappable tables called the
“obj” column• The “obj” is a symbolic link to the “.map” file of
your table• There are four basic types of map objects:
o Regions: Closed objects covering a given geography Examples: Countries, Counties, Provinces
o Points: Single locations / Coordinates Examples: City, Tower, Building
o Lines (Single, Arc, Poly): Open linear objects Examples: Motorways, rivers
o Text: Text with geographic links Example: Labels
Maps: Object Styles• Map objects have default styles saved to tables
when created• Typically when mapping, it is necessary to
change these styles for esthetic reasons• Changes can mean variations in color, fill, line
thickness, or text style depending on the type of objects
• Global style changes (affecting all objects in a table) are set in layer control (Display Option) using a Style Override
• Permanent style changes can be made directly to an editable table, but not recommended
• Changes can also be made using Thematic Layers
Maps: Object Labelling• Each map object can be labeled• Labels can be made automatically or manually• Labels are typically based on tabular data• Automatic labels created from label control,
manual labels are set with the label tool (Main Button Pad)
• Label Styles set from Layer Control (Source, Font, Color, etc..)
* Note: Labels are not permanent additions to tables, they are merelyannotations saved in the current session (saved in Workspaces)

Maps: Layer Control• Maps consist of tables displayed as layers• Analogy: Each table can be viewed on a
transparency, and these transparencies are then stacked to create a map
• Order of layers controls the appearance of your map
• Layers can be tables, thematic views of tables, or mapped queries
• The “Layer Control” dialog is a tool to help you manipulate your layers
• Accessed by:o Menu (Map > Layer Control)o Right-Click in a map window > Layer Control

Maps: Layer Control Dialog• Allows you to:
o Add / Remove layerso Change order of layers (influencing map composition)o Change layers display propertieso Control layers labellingo Turn layers on or off

Maps: Zooming & Panning
• Zooming and Panning is easily controlled through buttons on the Main button pad
• Change View will allow you to set a specific zoom level and center for your map
• Grabber will let you pan your map manually
Zoom In
Zoom Out
Change View
Grabber

Maps: Cosmetic Layers• Each map has a cosmetic layer by default,
which serves as a ‘scratch pad’ for temporary data
• You can use this layer to store map objects temporarily, with the ability to save or discard objects
• Objects in the cosmetic layer are saved in workspaces
• Objects in cosmetic layers are not by default saved to tables, they can be saved or discarded by selecting menu items from the Map menu
Maps: Saving Objects• As mentioned, objects in the cosmetic layer can
be saved into their own table• Accessed by:
o Menu (Map > Save Cosmetic Objects)
• In the save dialog that appears choose a location and name to save the table to
• Click OK• The table will be added to MapInfo’s list of
current tables

Layouts: Description• Layout Windows are a page layout feature which allows
the user to arrange map, browser, and graph windows along with annotations and prepare for printingo Layout Windows are the preferred method of printing from
MapInfoo Layouts are specific to a paper size and orientationo Layouts use frames to organize map, graph, and browser
windowso Layouts are WYSIWYG (what you see is what you get), the
only true representation of how your maps will appear when printed
o Annotations can be added directly to the Layout Window (Text, Lines, Regions) and are saved in Workspaces
o Frames can be added using the Frame Tool on the Main Toolpad
o Scale of maps can be precisely indicated using Layout Windows

Sample Layout
Text Annotations
Map Frame
Legend Frame
Browser Frame
MapInfo Training
Part 2: Advanced

Thematic Maps: Description• Map Layers can be shaded Thematically
o Object Styles (Color, line width, fill, etc..) can be controlled based on values of tabular data associated to that object
o Thematic Layers help display geographic trends of data
o Types of Thematic Layers: Ranges: Shade based on ranges of data values Individual: Shade each unique value individually Other: Pie Charts, Bar Charts, Graduated Symbols, Dot Density,
Grid

Thematic Maps: Creating• First decide exactly what it is you are trying to
display• Select Menu:
o Map > Create Thematic Map
• Select the type of thematic map to create• Select the table containing the data• Select the column with values to use• Make adjustments to the legend • Click OK!
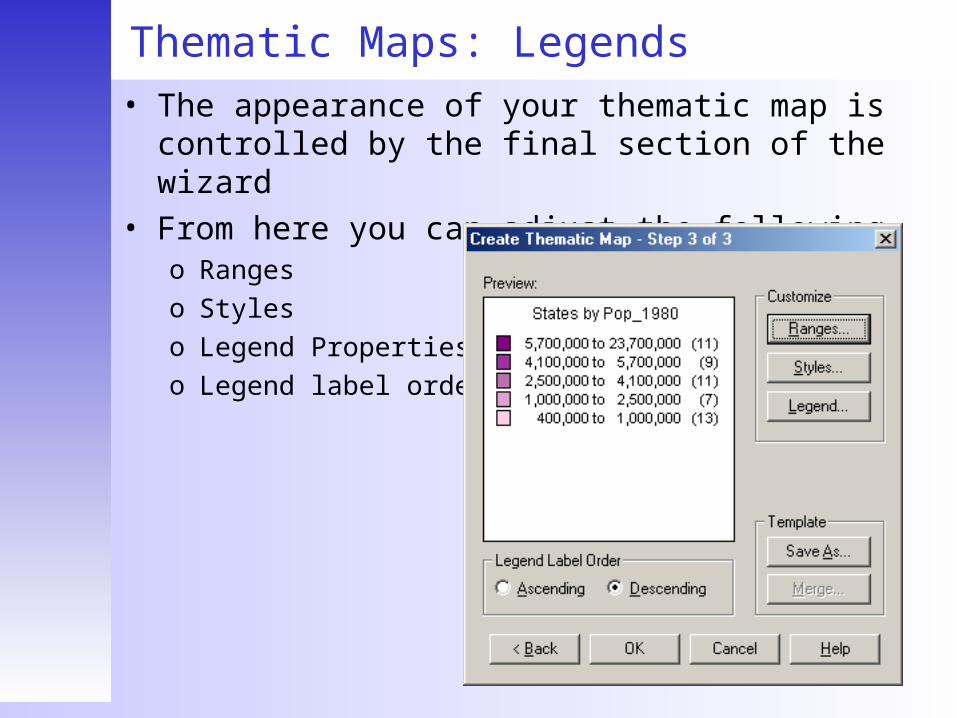
Thematic Maps: Legends• The appearance of your thematic map is
controlled by the final section of the wizard• From here you can adjust the following
o Rangeso Styleso Legend Propertieso Legend label order

Thematic Maps: Important Points
• Appear in Layer Control above tables they are based upon
• May be visible even if base tables are not• Ranges can be set in a variety of ways,
including statistically calculated methods• Styles & Ranges can be customized and saved
to templates which can be applied easily to other tables
• Thematic layers are saved in workspaces and are not modifications of base tables
• Thematic maps can be modified

Legends: Description• The legend for the thematic map is displayed in
a window• Extra components can be added to the legend• Click the right mouse button in the legend
window and select the “Add Frames” option• Use the wizard to add or remove elements from
the legend• Double clicking a component in the legend
window opens the editing dialog• This can be used to alter the appearance of the
component (title, style, etc)

Selections: Described• Selections are subsets of table data created by
the usero Selections can be created manually either through
map windows or browser windowso Selections can be created automatically through
query capabilities of MapInfoo Selections are temporary tables created by MapInfo
and can be saved to permanent tableso Selections are also known as Queries, and are
represented in MapInfo as temporary tables named QueryN, where N represents an integer

Selections: Using• Selections can be :
o Added to maps as new layerso Viewed in browser windowso Used to edit subsets of tableso Appended to other tableso View / Analyze subsets of datao Make further selections
• Selections can be made using the screen• Or by querying the data

Selections: From Screen• Tools: Select Tool, Radius Select Tool,
Boundary Select Tool, Marquee Select Tool, Select All, Unselect All
• Tools can be used to make selections directly from map windows on the screen
• Selections can only be made from a single table, whose selectable status is enabled
• Selections are highlighted on the map• Multiple selections can be made using
the Control key in conjunction with tools

Selections: From Queries• Allows you to create expressions based on data
fields and query tables based upon those expressions
• For Example, you can ask MapInfo to:o Show Post Code regions where the population >
50,000o Show Buildings where expected revenue > $20,000o Show Cell Sites co-located with Bell Atlantic?

Queries: Expressions• Expressions are logical statements which ask
the questions to MapInfo• If you wanted to know which Zip Codes had a
population > 50,000 your expression might be:o POP_90 > 50000
• Expression are typed directly into the Select Dialog, the expression assistant can help in forming the expressions
• Expression can be complex containing logical operators (such as OR, AND, NOT) and mathematical operators (such as + / = *)
• MapInfo’s query language is SQL

Miscellaneous: MapBasic Window
• MapBasic is MapInfo’s scripting language• The MapBasic window can be opened by:
o Menu (Options > Show MapBasic Window)
• Any time MapInfo performs an operation the relevant MapBasic command is printed in the window
• Commands can be typed into the window• The window is handy for controlling elements of
MapInfo, such as selections• Example command:
o Select * From table Where condition Into new table

Miscellaneous: Workspaces• Workspaces are a feature in MapInfo that
enable you to save your current work session. By saving a workspace, you will keep track of:o Tables you currently have openo Views are open for tables (Map, Browser, Graph)o Thematic Layerso Querieso Legend Windowso Labelso Style Settings for all map windows
Miscellaneous: Workspaces• When opening a workspace, you will be
recreating your saved work session o Tables will automatically be openedo Views will be created, including Layout Windowso Global Styles and Thematic Styles will be applied
• Save and Open workspaces from the file menu• Saving workspaces will not save current edits to
tables, editing or renaming tables may invalidate saved workspaces
• Workspace files are simply text files containing a series of MapBasic commands which tell MapInfo what to do

Questions & Answers